Attached files
| file | filename |
|---|---|
| 8-K - 8-K - FOREST CITY ENTERPRISES INC | d364279d8k.htm |
 Investor
Update June 2012
Capability
Adaptability
Accountability
Exhibit 99.1 |
 2
|
 Information
Related to Forward-Looking Statements Statements made in this presentation that state
the Company’s or management's intentions, hopes, beliefs, expectations or
predictions of the future are forward- looking statements. It is important to note
that the Company's future events and actual results, financial or otherwise, could
differ materially from those projected in such forward-looking statements.
Additional information concerning factors that could cause future events or actual
results to differ materially from those in the
forward-looking statements are included in the “Risk Factors”
section of the
Company's SEC filings, including, but not limited to, the Company's Annual Report
and quarterly reports. You are cautioned not to place undue reliance on such
forward-looking statements.
Use of non-GAAP measures
We frequently use the
non-GAAP measures of funds from operations (“FFO”),
earnings before depreciation, amortization and deferred taxes (“EBDT”),
comparable net operating income (“NOI”), and measures based on the pro-rata consolidation method
(“pro-rata”) to explain operating performance and assist
investors in evaluating our business. In addition, we present a
schedule of
components to assist investors in determining the “net asset value”
(“NAV”) of the
Company, also a non-GAAP measure. For a more thorough discussion of FFO,
EBDT, NOI, pro-rata
measures, and NAV, including how we reconcile these measures to their GAAP
counterparts, please refer to the Supplemental Package furnished to the SEC on Form 8-K on June 7, 2012. Copies of our quarterly and
annual Supplemental Packages can be found on our website at www.forestcity.net,
or on the SEC’s website at www.sec.gov.
3 |
 Company
Profile •
Founded in 1920 and traded publically since 1960, Cleveland based Forest City is known
nationally as a property owner, manager, and developer of some of the largest and most
prestigious real estate projects in the country. Forest City’s diverse portfolio includes
hundreds of premier properties located throughout the United States.
•
With a
focus
on
Core
Markets
–
the
New
York
City
metropolitan
area,
Boston,
Greater
Washington, D.C., Denver, Los Angeles, San Francisco, Dallas, Philadelphia and Chicago
–
we have overcome high barriers to entry and developed a unique franchise. Each of
these core markets are great urban centers with strong demographics and superior
growth potential.
4 |
 Our
Mission Forest City is a leading owner, operator, and
developer of distinctive and diversified real estate
projects in select core markets, which create value
for our customers, shareholders, and communities
through place creation, sustainable practices, and a
long-term investment perspective.
We operate by developing meaningful relationships
and leveraging our entrepreneurial capabilities with
creative and talented associates who embrace our
core values.
Our Vision
To be the real estate leader and partner-of-choice in
creating distinctive places to live, work, and shop.
5 |
 Our Strategic
Themes •
We will leverage our unique and proven
capability
as an owner, operator and
developer of distinctive real estate.
•
We will continue to show
adaptability
to
changing market conditions and stakeholder
needs.
•
We will commit to a high level of
accountability
to ourselves and to all of our
stakeholders to drive value creation.
6 |
 Our
2012-2015 Strategic Plan Key Goals:
•
Increase shareholder value by:
Intensify
focus
on
the
,
both
markets and products
Continuing
to
strengthen
the
balance
sheet
and reduce risk
Driving
operational
excellence
through all aspects of our company
7
core |
 Our Strategic
Foundation 8
Develop
unique,
differentiated real
estate that fuels
growth, creates a
“sense of place”
and
builds communities in
strong core markets
Be a value-added
owner and operator
of a diverse
portfolio of
profitable real
estate assets
Build a strong,
sustaining capital
structure
and
balance sheet that
allow us to further
create value and
profitable growth |
 Our Investment
Profile: “Core-PLUS” 9
Core
Products:
•
High-quality portfolio of 220+ income-producing assets
•
Primarily apartments, retail, and office (including life science)
•
Consistent NOI growth, stable occupancy, low tenant concentration
Core
Markets:
•
Gateway cities with strong growth/demographics, barriers to entry
•
78% of assets in New York, D.C., Boston, Chicago, Dallas,
Denver, Los Angeles,
San Francisco, Philadelphia •
Selective expansion in new growth markets, including Dallas
PLUS:
•
Signature development capability to fuel future growth
•
Substantial entitlement at large, mixed-use projects in core markets
•
Expertise in public/private partnerships, urban infill, adaptive reuse
•
90-year+ track record, more than 50 years as a public company
|
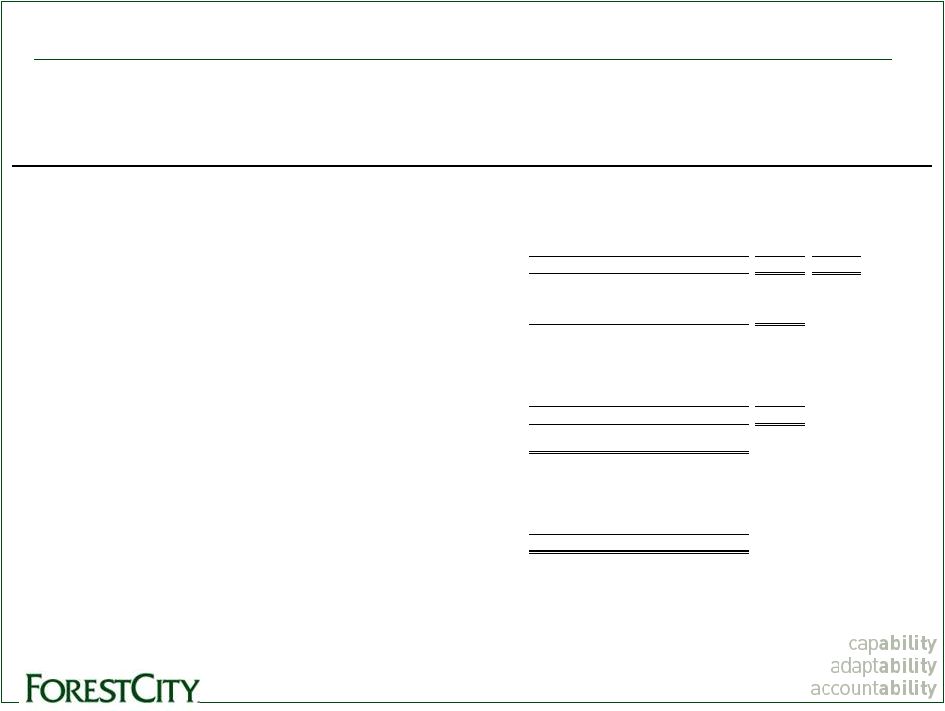
 Forest City
Initiates FFO 10
*Footnotes provided in Appendix Section
*
The table below will illustrate the differences between FFO and our historical reporting of
EBDT. The table will also reconcile these non-GAAP measures to net earnings,
the most comparable GAAP measure. FFO
EBDT
FFO
EBDT
Net earnings attributable to Forest City Enterprises, Inc.
22,752
$
22,752
$
46,343
$
46,343
$
Depreciation and Amortization -
Real Estate Groups
70,417
70,417
68,829
68,829
Impairment of depreciable rental properties
1,381
1,381
3,435
3,435
Gain on disposition of rental properties and partial interests in
rental properties (7,914)
(7,914)
(32,166)
(32,166)
Income tax expense (benefit) on non-operating earnings (loss)
- current and deferred
(1)
Gain on disposition of rental properties and partial interests in
rental properties 3,052
3,052
12,467
12,467
Impairment of depreciable rental properties
(536)
(536)
(1,332)
(1,332)
Straight-line rent adjustments
(4,835)
(2,224)
Impairment of Land Group projects
-
1,400
Deferred taxes on impairment of Land Group projects
(1)
-
(543)
Deferred income tax expense on operating earnings
(1)
14,492
24,950
Amortization of mortgage procurement costs -
Real Estate Groups
3,623
3,632
Preference payment
-
585
Allowance for projects under development revision
-
2,000
FFO/EBDT
89,152
$
102,432
$
97,576
$
127,376
$
FFO Per Share Data -
Quarterly Historical Trends
April 30,
January 31,
October 31,
July 31,
April 30,
2012
2012
(2)
2011
2011
2011
FFO
89,152
$
(40,714)
$
61,198
$
60,129
$
97,576
$
If-Converted Method (adjustments for
interest, net of tax): 3,769
-
3,769
1,852
1,798
FFO for per share data
92,921
$
(40,714)
$
64,967
$
61,981
$
99,374
$
Weighted average shares outstanding
- Basic
169,206,594
169,157,392
169,150,429
168,788,754
165,498,904
Weighted average shares outstanding -
Diluted
221,840,381
221,500,850
221,413,645
207,917,958
204,975,222
FFO Per Share
0.42
$
(0.24)
$
0.29
$
0.30
$
0.48
$
Three Months Ended April 30, 2012
Three Months Ended April 30, 2011
Three Months Ended
(in thousands)
(in thousands) |
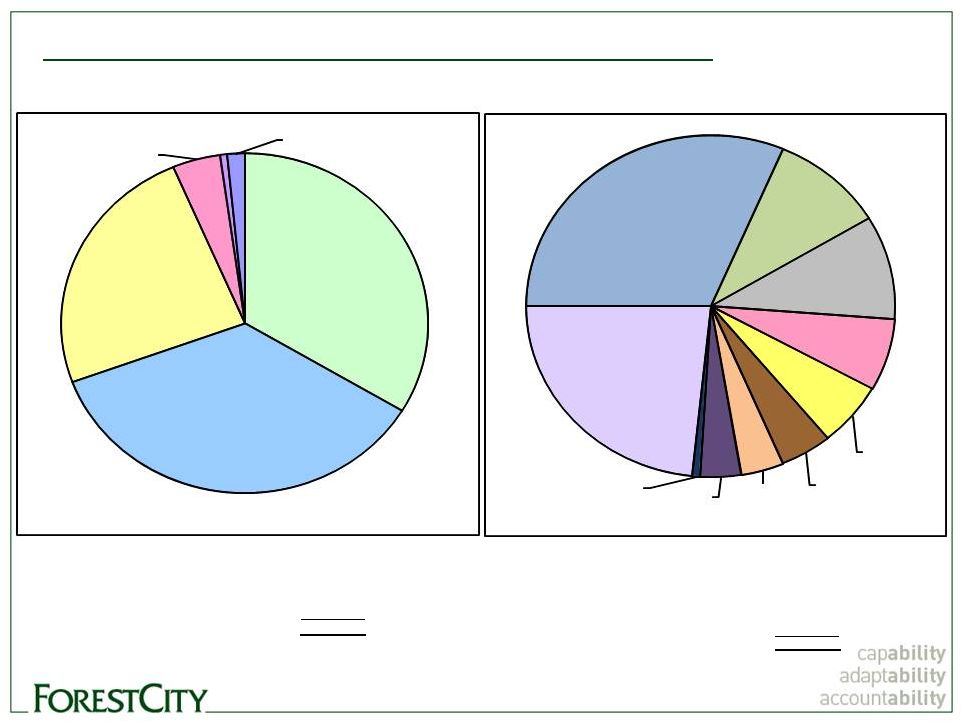 Balanced,
Diverse NOI Sources 11
1)
Includes limited-distribution subsidized senior housing.
2)
Includes write-offs of abandoned development projects, non-capitalizable development
costs, non-capitalizable marketing/promotional costs (3)
Includes Richmond, Virginia. New York
$52,785
31.4%
Los Angeles
$16,510
9.8%
Boston
$11,465
6.8%
Greater
San Francisco
$10,199
6.1%
Denver
$7,639
4.5%
Philadelphia
$6,223
3.7%
Chicago
$6,050
3.6%
Dallas
$1,171
0.7%
Non-Core
Markets
$39,258
23.4%
Greater
Washington, D.C.
(3)
$16,811
10.0%
Retail
$58,989
33.6%
Office
$62,777
35.8%
Apartments
(1)
$42,517
24.2%
Military
Housing
$7,347
4.2%
Hotels
$1,096
0.6%
Land
$2,732
1.6%
NOI by Product Type
175,458
$
NOI by Market
168,111
$
Casino Land Sale
36,484
Casino Land Sale
36,484
The Nets
(6,958)
Military Housing
7,347
Corporate Activities
(13,015)
The Nets
(6,958)
Other
(2)
(10,690)
Corporate Activities
(13,015)
Grand Total NOI
181,279
$
Other
(2)
(10,690)
Grand Total NOI
181,279
$
Net Operating Income by Product Type
Pro-Rata Consolidation
Three Months Ended April 30, 2012
Net Operating Income by Core Market
Pro-Rata Consolidation
Three Months Ended April 30, 2012
(dollars in thousands)
(dollars in thousands)
associated with Barclays Center and unallocated management and service
company overhead, net of tax credit income.
|
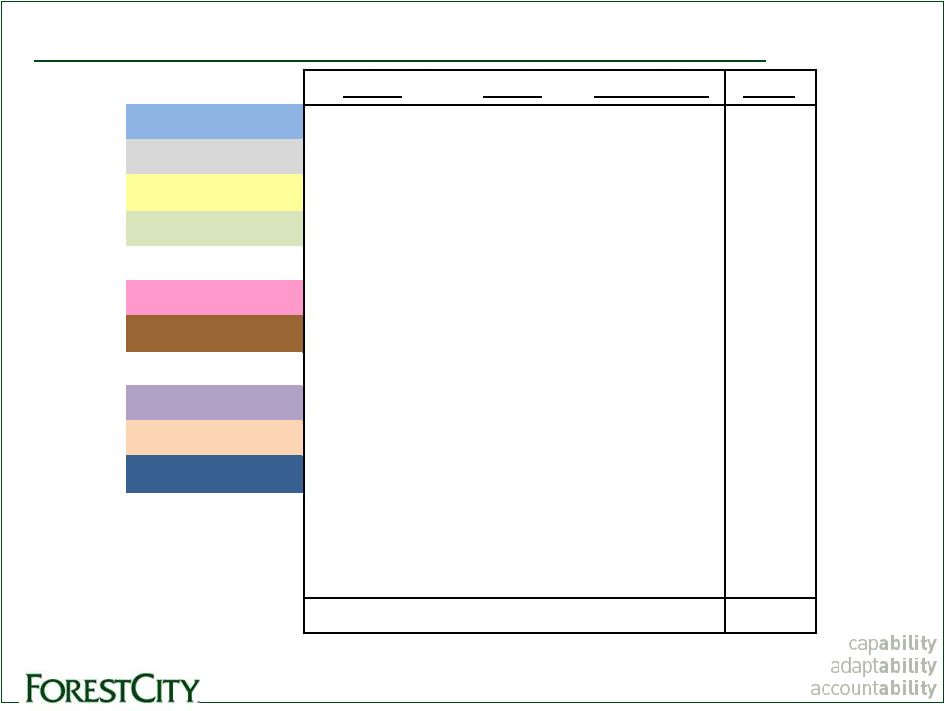 Washington DC
NOI by Market and Product Type*
12
* Excludes limited-distribution subsidized senior housing, military housing, supported
living, land, land sales, hotels, and other Three Months Ended April 30, 2012
Office
Retail
Apartments
SUM
New York
69%
21%
10%
100%
Los Angeles
0%
89%
11%
100%
San Francisco
25%
46%
29%
100%
29%
43%
28%
100%
Cleveland
38%
12%
50%
100%
Boston
77%
0%
23%
100%
Denver
7%
66%
27%
100%
Pittsburgh
26%
69%
5%
100%
Chicago
25%
22%
53%
100%
Philadelphia
20%
23%
57%
100%
Dallas
0%
0%
100%
100%
Florida
0%
70%
30%
100%
Las Vegas
0%
100%
0%
100%
Other
6%
58%
36%
100%
39%
37%
24%
100% |
 NOI by Product
Type and Market* 13
Three Months Ended April 30, 2012
* Excludes limited-distribution subsidized senior housing, military housing, supported
living, land, land sales, hotels, and other Office
Retail
Apartments
New York
57%
19%
13%
Los Angeles
0%
24%
5%
San Francisco
4%
8%
8%
Washington DC
8%
12%
13%
Cleveland
9%
3%
21%
Boston
14%
0%
7%
Denver
0%
4%
3%
Pittsburgh
2%
7%
1%
Chicago
2%
2%
8%
Philadelphia
2%
2%
9%
Dallas
0%
0%
3%
Florida
0%
5%
3%
Las Vegas
0%
6%
0%
Other
2%
8%
6%
100%
100%
100% |
 Comparable
Occupancy
%
(1)
Comparable
NOI
Growth –
Year-over-Year,
Pro
Rata
%
Source: Supplemental Packages for the three months ended April 30, 2012 and years ended
January 31, 2012, 2011, 2010, and 2009. Historical
Operations
(1)
Represents comparable occupancy for Retail and Office as of the applicable date and comparable
average occupancy year-to-date for Residential. 14
“We continue to be encouraged by the strong performance of our rental
properties
portfolio
and
by
real
estate
fundamentals
in
our
core
products
and
core markets. We are confident in our ability to drive value creation, from
within the mature portfolio, by stabilizing newly opened projects and by
activating existing entitlement, particularly at our large, mixed-use projects in
core markets.”
-
David LaRue, President and CEO
90
90 90
91
91 91
91
91
88
92
92
92
94
95
95
86
88
90
92
94
96
YE 1/31/09
YE 1/31/10
YE 1/31/11
YE 1/31/12
4/30/2012
Retail
Office
Residential
0.3
(3.9)
2.2
2.6
3.0
1.2
5.4
2.1
(2.6)
3.2
1.4
(3.9)
4.3
7.3
11.0
(6.0)
(4.0)
(2.0)
-
2.0
4.0
6.0
8.0
10.0
12.0
YE 1/31/09
YE 1/31/10
YE 1/31/11
YE 1/31/12
YTD 4/30/12
Retail
Office
Residential |
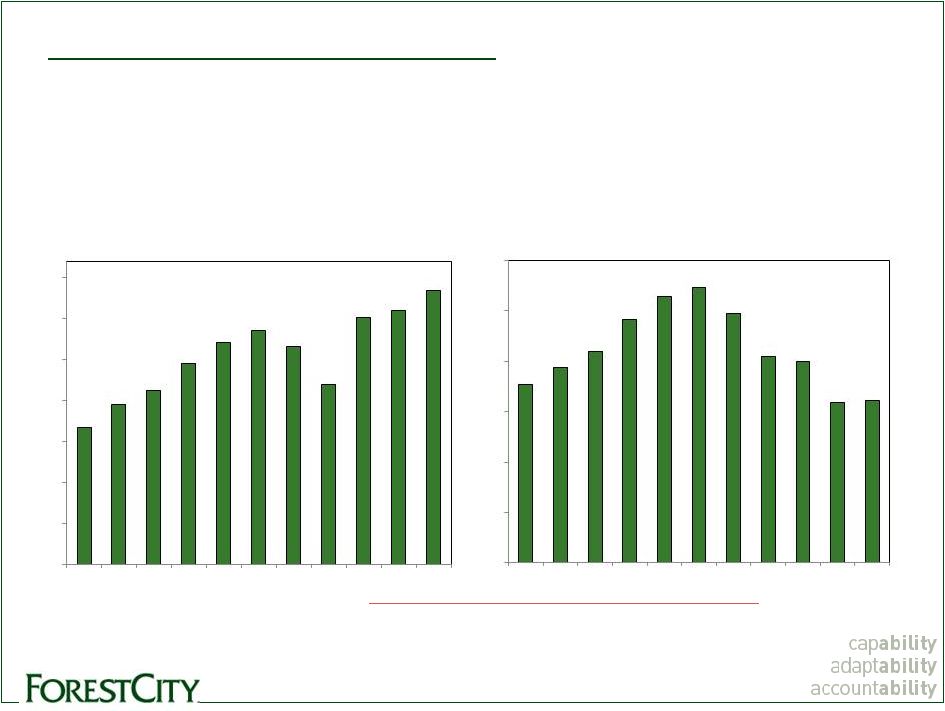 EBDT
per
Share
($
per
share)
(2)
Historical Operations
EBDT
($
in
millions)
(1)
(1)
(2)
“We
achieved
record
total
EBDT
in
2011,
propelled
by
the
strength
of
our
portfolio,
particularly
our
residential
and
retail
businesses,
where
our
comp
portfolios
outperformed
industry
averages
for
the
year.
Our
results
also
benefited
from
major
transactions
such
as
our
sale
of
land
and
air
rights to the Cleveland casino developer. Overall, 2011 was a year of solid progress and
positive momentum for Forest City”
–
David LaRue, President and CEO
15
Refer
to
the
Investors
section
of
Forest
City’s
web
site
(http://ir.forestcity.net/phoenix.zhtml?c=88464&p=IROL-reportsother )
for
Supplemental Packages for the periods referenced above, which provide reconciliation of EBDT
to its nearest GAAP equivalent. 168.0
194.4
212.4
245.0
270.5
285.0
265.7
218.9
301.1
309.9
334.4
-
50
100
150
200
250
300
350
2001
2002
2003
2004
2005
2006
2007
2008
2009
2010
2011
1.77
1.94
2.10
2.41
2.64
2.73
2.47
2.05
2.00
1.59
1.61
-
0.50
1.00
1.50
2.00
2.50
3.00
2001
2002
2003
2004
2005
2006
2007
2008
2009
2010
2011
Per–share data reflects new Class A common shares and the “if-converted”
effect of convertible debt and convertible preferred stock issued in 2009 and
2010. |
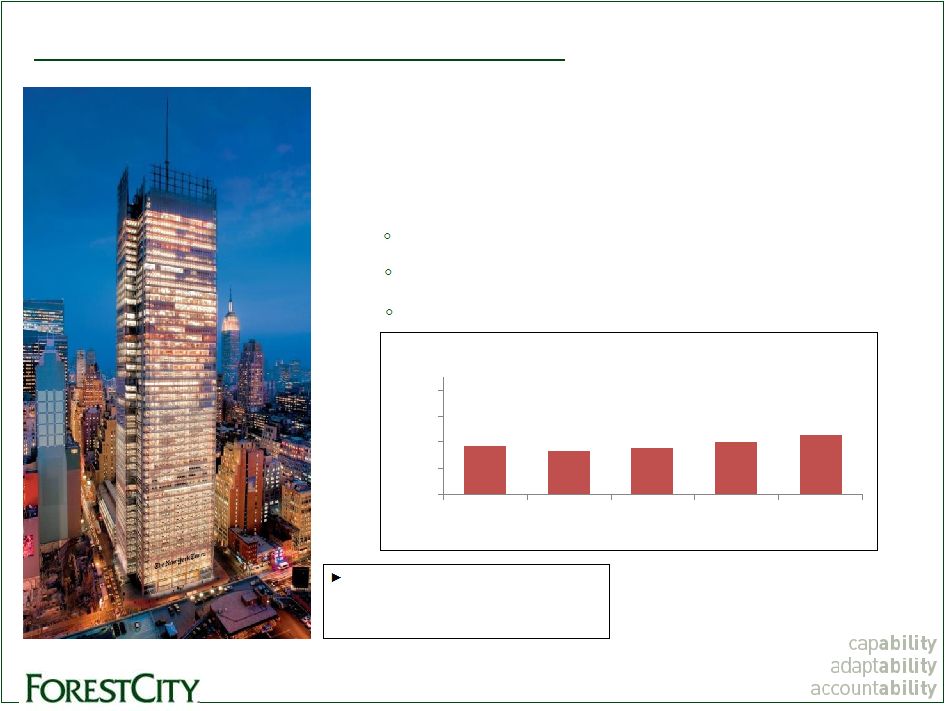 Office
Portfolio Overview •
49 properties, 13.5M s.f. in conventional and
life science office
•
Concentrations in New York and Boston
•
Key properties:
New York Times, Manhattan (left)
University Park at MIT, Cambridge
MetroTech Center, Brooklyn
The New York Times is a 52 story office
tower located in the Times Square
submarket and was designed by Pritzker
Prize winning architect Renzo Piano.
16
90.7%
90.3%
90.5%
91.0%
91.5%
87.0%
89.0%
91.0%
93.0%
95.0%
April 30,
2011
July 31,
2011
October 31,
2011
January 31,
2012
April 30,
2012
Office Comparable Occupancy Recap
For the three months ended |
 Apartment
Portfolio Overview Metro
417,
opened
in
2005
was
one
of
the
largest
adaptive –
reuse projects in LA history. There are 277 units in the 500k s.f.
building that was originally built in the 1920s as the Subway
Terminal for the city’s Red Car trolleys. The building is on both
the state and national lists of historical places.
17
4.8%
3.1%
12.0%
11.9%
11.0%
0.0%
2.0%
4.0%
6.0%
8.0%
10.0%
12.0%
14.0%
April 30,
2011
July 31,
2011
October 31,
2011
January 31,
2012
April 30,
2012
Quarterly Residential Comparable NOI Increase
For three months ended:
8 Spruce Street, Manhattan
DKLB BKLN, Brooklyn
River Lofts at Tobacco Row, Richmond
Metro 417, Los Angeles (shown)
123 apartment communities, 24,416 total units at pro-rata
Key properties: |
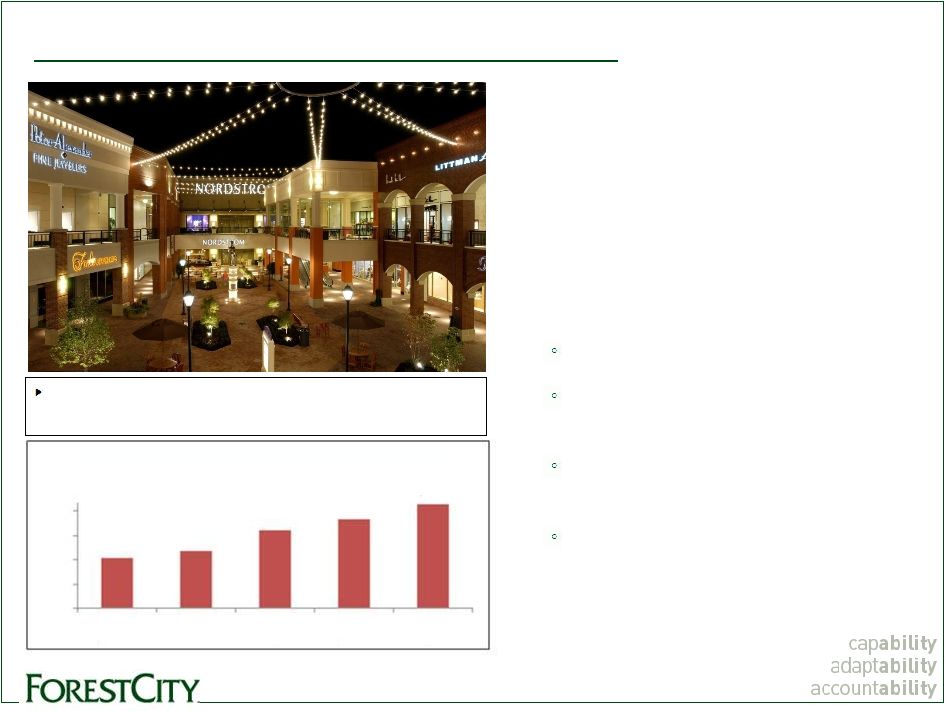 Portfolio
Highlights – Retail
•
45
centers, 25.8M total s.f.,
15.9M GLA
•
Enclosed regional malls,
open-air lifestyle centers, big-
box/power centers, specialty
centers
•
Key properties:
18
(1) All sales data is derived from schedules provided by our
tenants and is not subject to the same internal control and
verification procedures that are applied to the other data in
the Company's supplemental package. In addition, the data is
presented on a one-month lag to be consistent with the
calendar year end of our tenants.
Short
Pump
Town
Center
is
a
two-level
1.3M
s.f.
open-air
mall
located
in
Richmond,
Virginia,
anchored
by
Nordstrom,
Macy’s
Dillard’s,
and
Dick’s
Sporting
Goods.
FCE Regional Mall Sales per Square Foot
(1)
42nd Street, New York
San Francisco Centre/
The Emporium
Short Pump Town Center,
Richmond (Shown)
Victoria Gardens,
Rancho Cucamonga, CA
$411
$417
$434
$443
$456
$370
$390
$410
$430
$450
April 30,
2011
July 31,
2011
October 31,
2011
January 31,
2012
April 30,
2012
Rolling 12-month basis for the periods presented
|
 Forest City
is proud to participate in the privatization of rental residential communities
for military families.
Our portfolio includes more than 14,000 military
family homes located in eight states. These
include the Southern Group Air Force bases, the
U.S. Air Force Academy, and Naval installations
in Hawaii, Washington, Illinois, Indiana and
Tennessee.
Military
Housing
NOI
(In
Thousands)
Military Housing
19
$-
$5,000
$10,000
$15,000
$20,000
$25,000
2005
2006
2007
2008
2009
2010
2011
Property Management
$1,776
$4,092
$3,379
$6,834
$9,881
$9,872
$10,967
Asset Management
$316
$559
$1,141
$2,272
$2,192
$2,993
$3,309
Construction
$1,149
$3,344
$9,033
$12,345
$8,783
$5,634
$4,158
Development
$3,334
$8,983
$16,624
$23,541
$11,169
$5,883
$5,615
Total
$6,573
$16,978
$30,177
$44,992
$32,025
$24,381
$24,049 |
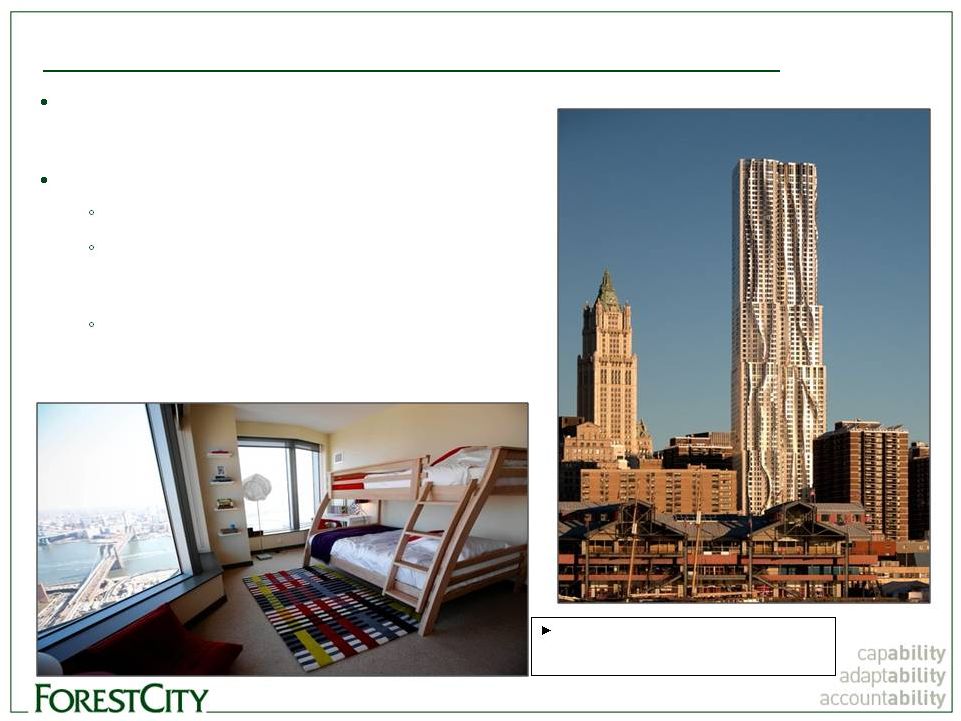 Recently
Opened: 8 Spruce Street Located in
New York City (Lower
Manhattan); Frank Gehry-designed
apartment tower.
76 stories, 899 market-rate units
700+ executed leases or 79% of total
Lower floors include a K-8 public school
and an ambulatory care center for the
New York Downtown Hospital
Over 871 units are open, remaining
units on upper floors are still under
construction
View from an upper level model unit, featured
in the Wall Street Journal on March 21, 2012
(Views from the Market Top
by Laura Kusisto)
20 |
 Recently
Opened: Westchester’s Ridge Hill Located in Yonkers, NY 1.3M
s.f. mixed- use retail project opening in phases
(currently 60% leased)
LEGOLAND is expected to begin
construction in July, 2012, with an
anticipated opening in Spring of 2013
Some tenants currently open:
21 |
 •
Foundry Lofts,
the
first
residential
building
at
The
Yards
mixed-
use project in the Capitol Riverfront District of Washington, D.C.
170 loft-style apartments in an adaptive–reuse of a former
Navy Yard industrial building
Initial move-ins began in December, 2011 with lease
commitments for 97% of the units already
Recently Opened: Foundry Lofts
22 |
 Under
Construction: Barclays Center •
Brooklyn, New
York
State-of-the-art sports
and entertainment
venue
70% of forecasted
contractually obligated
revenues currently under
contract
Future home of the NBA Nets
First phase of the Atlantic
Yards mixed-use project,
which is expected to feature
more than 6,400 housing units,
approximately 250K s.f. of
retail, and more than 8 acres
of open space
Set to open September, 2012
23 |
 Enhanced
Disclosure: Net Asset Value Components 24
*Footnotes provided in Appendix Section
*
(Dollars in millions at pro-rata)
Q1 2012
NOI
(1)
Annualized
NOI
(2)
Net Stabilized
Adjustments
(3)
Annualized
Stabilized NOI
Nonrecourse
Debt
(4)
A
B
=A + B
Commercial Real Estate
Retail
59.0
$
236.0
$
4.9
$
240.9
$
(2,641.9)
$
Office
62.8
251.2
0.5
251.7
(2,297.5)
Other
(6.3)
(25.2)
9.7
(15.5)
Total Commercial Real Estate
115.5
$
462.0
$
15.1
$
477.1
$
(4,939.4)
$
Residential Real Estate
Apartments
38.1
$
152.4
$
(2.8)
$
149.6
$
(1,975.5)
$
Subsidized Senior Housing
(5)
4.4
17.6
-
17.6
Military Housing
7.3
29.2
(14.2)
15.0
Other
(3.3)
(13.2)
-
(13.2)
Total Residential Real Estate
46.5
$
186.0
$
(17.0)
$
169.0
$
(1,975.5)
$
Total Rental Properties
162.0
$
648.0
$
(1.9)
$
646.1
$
(6,914.9)
$
Development Pipeline Debt Adj. NET
(6)
454.8
Adjusted Total Rental Properties
162.0
$
648.0
$
(1.9)
$
646.1
$
(6,460.1)
$
Book Value
Debt
Westchester's Ridge Hill
(Adjusted for amounts included in CRP)
(6)
346.2
$
(193.7)
$
8 Spruce Street
(Adjusted for amounts included in CRP)
(6)
427.4
(261.1)
Total development pipeline adjustments
773.6
(454.8)
Projects under construction
(4)
899.6
(434.3)
Adjusted projects under construction
1,673.2
$
(889.1)
$
Projects under development
(4)
939.3
$
(181.9)
$
Land held for development and sale
(4)
97.6
$
(26.6)
$
Book Value
(4)
Nonrecourse
Debt
(4)
Cash and equivalents
336.7
$
Restricted cash and escrowed funds
429.0
$
Notes and accounts receivable, net
(7)
386.9
$
Net investments and advances to unconsolidated
entities 212.6
$
Prepaid expenses and other deferred costs, net
215.2
$
Land held for divestiture
88.5
$
(28.6)
$
Book Value
(4)
Bank revolving credit facility
-
$
Senior and subordinated
debt (1,038.6)
$
Less: convertible debt
599.2
$
Construction payables
(155.1)
$
Operating accounts payable and accrued expenses
(8)
(706.4)
$
Number
of
shares
for
the
three
months
ended
April
30,
2012 (In millions)
221.8
Net Asset Value Components -
April 30, 2012
Completed Rental Properties ("CRP")
Weighted
Average
Shares
Outstanding
-
Diluted
Nonrecourse
Recourse Debt and other Liabilities
Development Pipeline
Other Tangible Assets |
 Appendix
Recourse Debt Maturities
26
Asset Sales
27
Lease Expirations
28
Pipeline
30
The Yards –
Project Site Plan
36
Atlantic Yards –
Project Site Plan
37
Sustainability
38
Net Asset Value Components Footnotes
39
Funds From Operations Footnotes
40 |
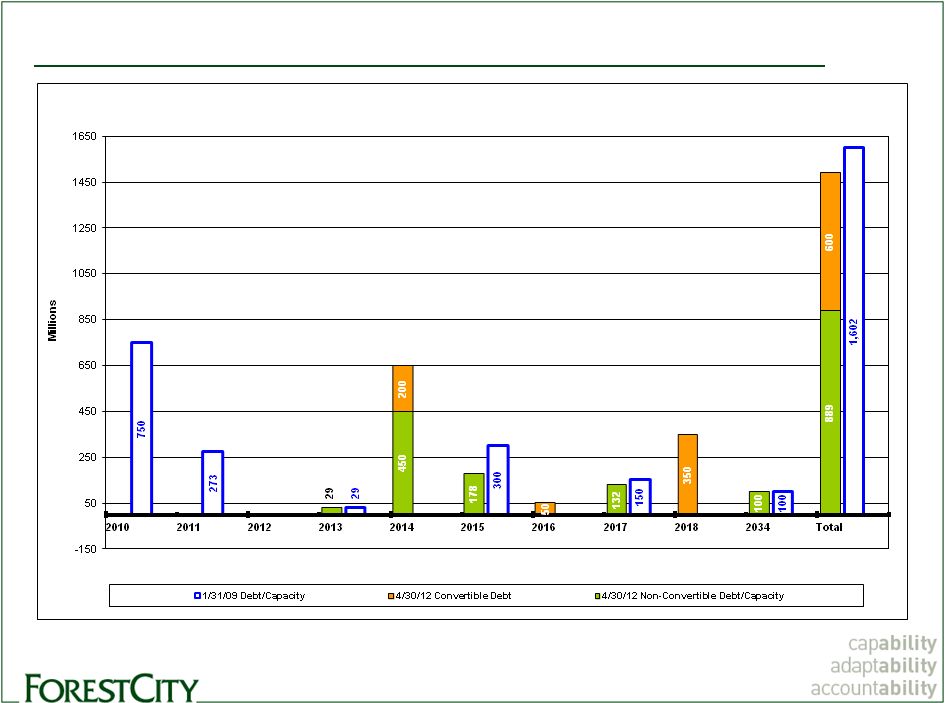 Addressing
Recourse Debt Maturities 26
Change in Recourse Debt Capacity -
4/30/2012 Compared to 1/31/09 |
 Asset
Sales 27
($ in thousands at pro-rata) Cash
Net
Annualized
Cap
EBDT Year
EBDT/
Count
Proceeds
Sales Price
NOI
Rate
Prior to Sale
Proceeds
Leverage
Total (11 Yr + YTD 2012: 2001-2012)
97
1,304,861
3,138,922
207,701
6.6%
97,702
7.5%
58%
Total (10 Yr: 2002-2011)
88
1,207,394
2,928,026
191,337
6.5%
90,266
7.5%
59%
Total (7 Yr: 2005-2011)
70
1,080,576
2,573,017
163,272
6.3%
76,309
7.1%
58%
Total (5 Yr: 2007-2011)
58
720,777
1,860,871
122,134
6.6%
60,632
8.4%
61% |
 Office Lease
Expirations (as of 4/30/2012) 28
0.0%
1.0%
2.0%
3.0%
4.0%
5.0%
6.0%
7.0%
8.0%
9.0%
10.0%
2012
2013
2014
2015
2016
Office Lease Expirations
Percentage of Net Base Rent Expiring
As of April
30,
2012
(1)
GLA = Gross Leasable Area
(2)
Net base rent expiring is an operating statistic and is not comparable to rental revenue, a
GAAP financial measure. The primary differences arise because net base rent is
determined using the tenant’s contractual rental agreements at our ownership share of the
base rental income from expiring leases as determined within the rent agreement and it
does not include adjustments such as the impact of straight-line rent, amortization of intangible assets related to in-place leases, above and below
market leases, and contingent rental payments (which are not reasonably estimable).
(3)
Square feet of expiring leases and average base rent per square feet are operating statistics
that represent 100% of the square footage and base rental income per square foot from expiring leases.
NET
EXPIRATION
BASE RENT
YEAR
EXPIRING
(2)
2012
82
629,105
5.54 %
$ 18,223,579
6.02 %
$ 35.37
2013
99
1,203,425
10.61
25,976,786
8.58
22.77
2014
80
862,748
7.60
17,803,428
5.88
33.02
2015
53
507,152
4.47
9,539,205
3.15
21.98
2016
65
1,003,898
8.85
23,101,556
7.63
29.77
EXPIRING
OF EXPIRING
OF TOTAL
OF TOTAL
SQUARE FEET
LEASES
LEASES
(3)
LEASED GLA
(1)
BASE RENT
EXPIRING
(3)
AVERAGE
BASE
NUMBER OF
SQUARE FEET
PERCENTAGE
PERCENTAGE
RENT PER |
 Retail Lease
Expirations (as of 4/30/2012) 29
0.00%
2.00%
4.00%
6.00%
8.00%
10.00%
12.00%
14.00%
2012
2013
2014
2015
2016
Retail Lease Expirations
Percentage of Net Base Rent Expiring
As of April 30, 2012
NET
EXPIRATION
BASE RENT
YEAR
EXPIRING
(2)
2012
212
634,085
5.08
%
$ 12,995,333
5.17
%
$ 26.27
2013
350
1,223,594
9.80
26,708,040
10.63
27.30
2014
295
1,077,675
8.63
21,067,186
8.38
27.67
2015
218
866,319
6.93
19,331,135
7.69
29.84
2016
265
1,404,114
11.24
31,550,161
12.55
36.38
EXPIRING
OF EXPIRING
OF TOTAL
OF TOTAL
SQUARE FEET
LEASES
LEASES
(3)
LEASED GLA
(1)
BASE RENT
EXPIRING
(3)
AVERAGE
BASE
NUMBER OF
SQUARE FEET
PERCENTAGE
PERCENTAGE
RENT PER
(1)
GLA = Gross Leasable Area
(2)
Net base rent expiring is an operating statistic and is not comparable to rental revenue, a
GAAP financial measure. The primary differences arise because net base rent is
determined using the tenant’s contractual rental agreements at our ownership share of the base rental income from expiring leases as determined within
the rent agreement and it does not include adjustments such as the impact of straight-line
rent, amortization of intangible assets related to in-place leases, above and below
market leases, and contingent rental payments (which are not reasonably estimable).
(3)
Square feet of expiring leases and average base rent per square feet are operating statistics
that represent 100% of the square footage and base rental income per square foot
from expiring leases. |
 Pipeline:
Projects Opened 30
Note:
See
pages
34-
35
in
the
Supplemental
Package
for
the
quarter
ended
April
30,
2012
for
footnotes.
Designed to meet LEED
certifications, Las Vegas City
Hall,
was
designed
by
Forest
City
Real
Estate
Services
on
a fee basis. Thirty-three
“solar trees”
are located in
the buildings front plaza.
Cost at FCE
Cost at Full
Total Cost
Pro-Rata Share
Sq. ft./
Date
Consolidation
at 100%
(Non-GAAP) (c)
No. of
Property
Location
Dev (D)
Opened
(GAAP) (b)
(2)
(1) X (2)
Units
2012
Residential:
The Aster Town Center (d) Denver, CO
D
Q1-12/Q2-12
90.0%
90.0%
$
10.9
10.9
$
9.8
$
85
42%
Fee Development Project
Las Vegas City Hall
Las Vegas, NV
D
Q1-12
-
(e)
-
(e)
$
0.0
146.2
$
0.0
$
270,000
Openings as of April
30,
2012
Lease
Ownership % (a)
(1)
Commitment %
(in millions)
Pro-Rata
FCE Legal
FCE % (a)
(f) |
 Pipeline:
Projects Under Construction 31
Note:
See
pages
34-
35
in
the
Supplemental
Package
for
the
quarter
ended
April
30,
2012
for
footnotes.
Cost at FCE
Total Cost
Pro-Rata Share
Anticipated
at 100%
(Non-GAAP) (c)
Sq. ft./
Property
Location
Opening
(2)
(1) X (2)
No. of Units
Retail Centers:
(f)
The
Yards
-
Boilermaker
Shops
Washington, D.C.
Q3-12
100.0%
100.0%
$
19.6
19.6
$
19.6
$
40,000
40,000
74%
Office:
Johns Hopkins Parking Garage
Baltimore, MD
Q3-12
85.0%
100.0%
$
29.9
29.9
$
29.9
$
492,000
Residential:
Botanica Eastbridge
Denver, CO
Q2-12
90.0%
90.0%
$
15.4
15.4
$
13.9
$
118
Continental Building
Dallas, TX
Q1-13
100.0%
100.0%
54.6
54.6
54.6
203
$
70.0
70.0
$
68.5
$
321
Arena:
Barclays Center
Brooklyn, NY
Q3-12
34.0%
34.0%
$
934.3
934.3
$
317.7
$
670,000
18,000 seats
(n)
70%
(o)
Total Under Construction (p)
$
1,053.8
1,053.8
$
435.7
$
Fee Development Project
Dept. of Health & Mental Hygiene
Baltimore, MD
Q2-14
-
(e)
-
(e)
$
0.0
135.0
$
0.0
$
234,000
Pro-Rata
Cost at Full
Gross
FCE Legal
FCE % (a)
Consolidation
Leasable
(in millions)
Projects Under Construction
as of April
30,
2012
Lease
Ownership % (a)
(1)
(GAAP) (b)
Area
Commitment % |
 Pipeline:
Equity Requirements 32
For Projects Under Construction (a)
as of April 30, 2012
Less
Plus
Unconsolidated
Full
Less
Unconsolidated
Pro-Rata
Investments
Consolidation
Noncontrolling
Investments
Consolidation
100%
at 100%
(GAAP)
(b)
Interest
at Pro-Rata
(Non-GAAP)
(c)
Total Cost Under Construction
1,053.8
$
-
$
1,053.8
$
618.1
$
-
$
435.7
$
Total Loan Draws
and Other Sources at Completion (d)
638.5
-
638.5
389.8
-
248.7
Net Equity at Completion
415.3
-
415.3
228.3
-
187.0
Net Costs Incurred to Date
762.3
-
762.3
450.7
-
311.6
Loan Draws and Other Sources to Date
380.9
-
380.9
228.4
-
152.5
Net Equity to Date
381.4
-
381.4
222.3
-
159.1
% of Total Equity
92%
92%
85%
Remaining Costs
291.5
-
291.5
167.4
-
124.1
Remaining Loan Draws and Other Sources
257.6
-
257.6
161.4
-
96.2
Remaining Equity
33.9
$
-
$
33.9
$
6.0
$
-
$
27.9
$
% of Total Equity
8%
8%
15%
(dollars in millions)
(a) This schedule includes only the five projects under construction
listed on the previous page. This does not include costs associated with phased-in units, operating property renovations and military housing
(b) Amounts are presented on the full consolidation method of
accounting, a GAAP measure. Under full consolidation, costs are reported as consolidated at 100 percent if we are deemed to have control or to
be the primary beneficiary of our investments in the variable interest
entity ("VIE"). Company determines its pro-rata share
by multiplying its pro-rata ownership by the total cost of the applicable property.
(c) Cost at pro-rata share represents Forest City's share of cost,
based on the Company's pro-rata ownership of each property (a non-GAAP measure). Under the pro-rata consolidation method of accounting the
(d) "Other Sources" includes estimates of third party subsidies
and tax credit proceeds. The timing and the amounts may differ from our estimates. |
 Projects
Opened or Acquired: Prior Two Years 33
Note:
See
pages
34-
35
in
the
Supplemental
Package
for
the
quarter
ended
April
30,
2012
for
footnotes.
Cost at FCE
Cost at Full
Total Cost
Pro-Rata Share
Sq. ft./
Date
Consolidation
at 100%
(Non-GAAP) (c)
No. of
Property
Location
Dev (D)
Opened
(GAAP) (b)
(2)
(1) X (2)
Units
Prior Two Years Openings as of April 30, 2012
Retail Centers:
(f)
Westchester's Ridge Hill (i)
Yonkers, NY
D
Q2-11/12
70.0%
100.0%
$
868.2
868.2
$
868.2
$
1,336,000
1,336,000
(h)
60%/68%
Village at Gulfstream Park (g) (k)
Hallandale Beach, FL
D
Q1-10
50.0%
50.0%
0.0
140.2
70.1
511,000
511,000
78%
East River Plaza (g)
Manhattan, NY
D
Q4-09/Q2-10
35.0%
50.0%
0.0
390.6
195.3
527,000
527,000
94%
$
868.2
1,399.0
$
1,133.6
$
2,374,000
2,374,000
Office:
Waterfront Station
-
East 4th & West 4th Bldgs (Sold Q2-11) (l)
Washington, D.C.
D
Q1-10
45.0%
45.0%
$
245.9
245.9
$
110.7
$
631,000
99%
Residential
8 Spruce Street (g) (j)
Manhattan, NY
D
Q1-11/12
35.7%
51.0%
$
0.0
875.7
$
446.6
$
899
79%
Foundry Lofts
Washington, D.C.
D
Q4-11
100.0%
100.0%
57.5
57.5
57.5
170
97%
Presidio Landmark
San Francisco, CA
D
Q3-10
100.0%
100.0%
96.6
96.6
96.6
161
98%
$
154.1
1,029.8
$
600.7
$
1,230
Total Prior Two Years Openings (m)
$
1,268.2
2,674.7
$
1,845.0
$
Recap of Total Prior Two Years Openings
Total 2011
$
925.7
1,801.4
$
1,372.3
$
Total 2010
342.5
873.3
472.7
Total Prior Two Years Openings (m)
$
1,268.2
2,674.7
$
1,845.0
$
Pro-Rata
Gross
FCE Legal
FCE % (a)
Leasable
Lease
Ownership % (a)
(1)
Area
Commitment %
(f) |
 Projects Under
Development 34
as of April 30, 2012
Below is a summary of our active large scale development projects, which
have yet to commence construction, often referred to as our
"shadow pipeline" which are crucial to our long-term
growth. While we cannot make any assurances on the timing or delivery of these projects, our track record speaks to our ability to bring large,
complex projects to fruition when there is demand and available
construction financing. The projects listed below represent pro-rata costs of $801.8 million
($1,005.0 million at full consolidation) of Projects Under Development
("PUD") on our balance sheet and pro-rata mortgage debt of $166.2 million ($222.0 million at full consolidation).
1)
Atlantic
Yards
-
Brooklyn,
NY
2)
LiveWork
Las
Vegas
-
Las
Vegas,
NV
3) The Yards -
Washington, D.C.
4)
Colorado
Science
+
Technology
Park
at
Fitzsimons
-
Aurora,
CO
5)
The
Science
+
Technology
Park
at
Johns
Hopkins
-
Baltimore,
MD
6) Waterfront Station -
Washington, D.C.
7) 300 Massachusetts Avenue -
Cambridge, MA
Located
in
the
science
and
technology
hub
of
Cambridge,
MA,
the
300
Massachusetts
Avenue
block
represents
an
expansion
of
University
Park
@
MIT.
In
a
50/50
partnership
with
MIT,
Forest
City
is
presently
focused
on
a
project
that
reflects
a
development
program
of
approximately
260,000
square
feet
of
lab
and
office
space.
Potential
redevelopment
of
the
entire
block
is
possible with the acquisition of adjacent parcels in future phases, and
would result in an approximately 400,000 square foot project.
Atlantic Yards is adjacent to the state-of-the-art arena,
Barclays Center, which was designed by the award-winning firms Ellerbe Becket and SHoP Architects and is currently under
construction. Atlantic Yards is expected to feature more than
6,400 units of housing, including over 2,200 affordable units, approximately 250,000 square feet of retail space, and more than 8
acres of landscaped open space.
LiveWork Las Vegas is a mixed-use project on a 13.5 acre parcel in
downtown Las Vegas. At full build-out, the project will have the new 260,000 square-foot City Hall and is also expected
to include up to 1 million square feet of office space and
approximately 300,000 square feet of retail. The City Hall is owned by the city of Las Vegas, which held its dedication ceremony on
March 5, 2012.
The 184 acre Colorado Science + Technology Park at Fitzsimons is
becoming a hub for the biotechnology industry in the Rocky Mountain
region. Anchored by the University of Colorado at Denver Health
Science Center, the University of Colorado Hospital and The Denver Children’s Hospital, the park will offer cost-effective lease rates, build-to-suit office and research sites, and
flexible lab and office layouts in a cutting-edge research park.
The park is also adjacent to Forest City’s 4,700 acre Stapleton mixed-used development.
Located
in
Southwest
Washington,
D.C.,
Waterfront
Station
is
adjacent
to
the
Waterfront/Southeastern
University
MetroRail
station.
Waterfront
Station
is
expected
to
include
660,000
square
feet of office space, an estimated 400 residential units and 40,000
square feet of stores and restaurants. The 31 acre Science +
Technology Park at Johns Hopkins is a new center for collaborative research directly adjacent to the world-renowned Johns Hopkins medical and research complex.
Initial plans call for 1.1 million square feet in five buildings, with
future phases that could support additional expansion. In 2008,
the Company opened the first of those buildings, 855 North Wolfe
Street, a 279,000 square-foot office building anchored by the Johns Hopkins School of Medicine’s Institute for Basic Biomedical Sciences.
Construction of a 492,000 square-foot
parking garage at 901 N. Washington Street is currently underway
and will provide approximately 1,450 parking spaces for Johns Hopkins
and the active buildings at the Science + Technology Park when it
is completed in Q3-12. Construction of a second commercial
building totaling 234,000 square feet commenced in January 2012.
The new building is being developed on a fee
basis and will be fully leased to the Department of Health & Mental
Hygiene (DHMH) when it is expected to open in Q2-14. The
Yards is a 42 acre mixed-use project, located in the neighborhood of the Washington Nationals baseball park in the Capitol Riverfront District. The full
project is expected to include up to
2,700 residential units, 1.8 million square feet of office space, and
300,000 square feet of retail and dining space. The Yards
features a 5.5 acre publicly funded public park that is a gathering
place and recreational focus for the community. The first
residential building, Foundry Lofts, opened in November 2011 and includes a Potbelly Sandwich restaurant which opened Q1-12.
Kruba Thai & Sushi restaurant is expected to open Q2-12.
|
 Military
Housing 35
as of April 30, 2012
Below is a summary of our Military Housing development projects. The
Company provides development, construction and management services
for these projects and receives agreed upon fees for these
services. The following phases still have a percentage of units opened and under construction:
Anticipated
FCE
Cost at Full
Total Cost
No.
Property
Location
Opening
Pro-Rata %
Consolidation
at 100%
of Units
Military Housing Under Construction
Hawaii Phase IV
Kaneohe, HI
2007-2014
*
476.6
$
1,141
Air Force – Southern Group:
Keesler Air Force Base
Biloxi, MS
2011-2012
0.0%
0.0
5.0
1,188
Joint Base Charleston
Charleston, SC
2011-2013
0.0%
0.0
72.0
345
Arnold Air Force Base
Tullahoma, TN
2011-2013
0.0%
0.0
10.1
22
Shaw Air Force Base
Sumter, SC
2011-2015
0.0%
0.0
156.5
630
Subtotal Air Force – Southern Group
$ 0.0
243.6
$
2,185
Total Under Construction
$ 0.0
720.2
$
3,326
* The Company's share of residual cash flow ranges from 0-20%
during the life cycle of the project. (in millions)
Summary of Military Housing Net Operating Income (14,104 end-state
units) Development fees related to our military housing projects
are earned based on a contractual percentage of the actual development costs incurred. We also recognize
additional development incentive fees upon successful completion of
certain criteria, such as incentives to realize development cost savings, encourage small and local
business participation, comply with specified safety standards and
other project management incentives as specified in the development agreements. NOI from
development and development incentive fees was $2,362,000 for the three
months ended April 30, 2012 and $1,137,000 for the three months ended April 30, 2011.
Construction management fees are earned based on a contractual
percentage of the actual construction costs incurred. We also recognize certain construction incentive fees
based upon successful completion of certain criteria as set forth in
the construction contracts. NOI from construction and incentive fees was $433,000 for the three months
ended April 30, 2012 and $1,180,000 for the three months ended April
30, 2011. Property management and asset management fees are earned based on a
contractual percentage of the annual net rental income and annual operating income, respectively,
that is generated by the military housing privatization projects as
defined in the agreements. We also recognize certain property management incentive fees based upon
successful completion of certain criteria as set forth in the property
management agreements. Property management, management incentive and asset management fees
generated NOI of $3,547,000 for the three months ended April 30, 2012
and $3,229,000 for the three months ended April 30, 2011. |
 Riverfront
Park (5.5 Acres) Completed Fall 2010
Foundry Lofts Apts.
Completed November 2011
Boilermaker Shops
Retail/Office
Opening Q3-2012
The Yards –Site Plan
In total, a 42-acre mixed-use project in the Neighborhood of the Washington
Nationals baseball park in the Capitol Riverfront District of Washington, D.C.
Expected to include up to 2,700 residential units, 1.8 million square feet of office
space, and 300,000 square feet of retail and dining space.
36 |
 Atlantic Yards
– Site Plan
37
Located in Brooklyn, and adjacent to the state-of-the-art arena, Barclays
Center, designed
by
Ellerbe
Becket
and
SHoP
Architects,
Atlantic
Yards
is
expected
to
feature more than 6,400 residential units (including 2,200 affordable units),
250,000 square feet of retail and more than 8 acres of landscaped open space.
|
 Sustainability
at Forest City 38
•
Commitment
A corporate core value since 2003
Dedicated Sustainability Dept. and Commercial Energy Services Dept.
Accountability
and
verification
–
all
projects
prepare
a
sustainability
“scorecard”
•
Results
30+ projects certified or seeking certification (LEED, Energy Star, others)
Approx. 18.6% of total portfolio is certified (based on cost at pro-rata)
A leader in breadth of LEED certifications by project type:
•
New Construction
•
Core & Shell
•
Neighborhood Development
•
Homes
•
Existing Buildings
•
Value-added
Leveraging portfolio opportunities for energy generation/sale, reduced cost
Forest City included in Calvert Social Index since September, 2010
•
New Developments
Focus on results, not specific certifications, however use them to benchmark performance
and stay on top of best practices
December 2011 –
Joined National Better Buildings Challenge, a private sector initiative to
increase energy efficiency 20% by 2020 across 14m SF of the overall portfolio
•
Renewable Energy
In-house capability to develop and manage alternative energy projects (solar,
wind, waste-to-energy) deployed on existing Forest City assets as well as new
projects |
 Net Asset
Value Components Footnotes 39
(1) Pro-rata Q1 2012 NOI is reconciled to NOI at full consolidation by Product Group for
the three months ended April 30, 2012 in the Supplemental Operating Information section
of the supplemental package for the three months ended April 30, 2012. NOI generated
from the casino land sale of $36.5 million has been excluded from total NOI used in the Net
Asset Value Component schedule.
(2) Pro-rata annualized NOI is calculated by taking the Q1 2012 NOI times a multiple of
four.
(3) The net stabilized adjustments column represents net adjustments required to arrive at a
fully stabilized NOI for those properties currently in initial lease up periods, net of
the removal of partial period NOI for recently sold properties. For those properties currently
in initial lease up periods we have included stabilization adjustments as follows:
a) Except for Westchester’s Ridge Hill and 8 Spruce Street, NOI for the
properties in lease up are reflected at 5% of the pro- rata cost disclosed in our
Development Pipeline disclosure (Current Year and Prior Two Year Openings). This assumption does
not reflect Forest City’s anticipated NOI, but rather is used in order to establish a
hypothetical basis for valuation of lease up properties. See note 6, which describes
the treatment of Westchester’s Ridge Hill and 8 Spruce Street.
b) At the conclusion of the initial development period at each of our military housing
communities, we estimate the ongoing property management fees, net of operating
expenses, to be $15.0 million.
The net stabilized adjustments are not comparable to any GAAP measure and therefore do not
have a reconciliation to the nearest comparable GAAP measure. (4) Amounts
are derived from the respective pro-rata balance sheet line item as of April 30, 2012 and are reconciled to their GAAP
equivalents in the Selected Financial Information section of the supplemental package for the
three months ended April 30, 2012.
(5) Represents limited-distribution subsidized senior housing properties. (6)
Westchester’s Ridge Hill and 8 Spruce Street have their assets shown in the Development Pipeline section of the model.
Westchester’s Ridge Hill,
mortgage debt at pro-rata consolidation which were transferred to CRP. 8 Spruce
Street, as of April 30, 2012, had $427.4 million of costs incurred at pro-rata
consolidation and $261.1 million of mortgage debt at pro-rata consolidation which were transferred to CRP.
In order to account for the phased openings of Westchester’s Ridge Hill and 8
Spruce Street as NAV components we have made the following adjustments: a) All costs
and associated debt for Westchester’s Ridge Hill and 8 Spruce Street for purposes exclusive to this disclosure are
accounted for as a component of “Adjusted Projects Under Construction” in the
Development Pipeline section of this schedule. Accordingly, all NOI, through the net
stabilized adjustments column, and debt have been removed from the CRP section of the
NAV schedule.
(7) Includes $157.7 million of straight-line rent receivable (net of $15.9
million of allowance for doubtful accounts).
(8) Includes $41.7 million of straight-line rent payable. as of April
30, 2012, had $346.2 million of costs incurred at pro-rata consolidation and $193.7 million of |
 Funds From
Operations Footnotes 40
(1) The following table provides detail of Income Tax Expense (Benefit):
(2)
For the three months ended January 31, 2012, the effect of 52,343,458
shares of diluted securities were not included in the computation
of diluted FFO per share because their effect is anti-dilutive to the negative FFO for the quarter. As a result,
an adjustment to FFO is not required for interest expense of $3,769,000
related to these securities. 2012
2011
Current taxes
Operating earnings
(3,736)
$
(12,671)
$
Gain on disposition of rental properties and partial interests in
rental properties 4,865
30,304
Subtotal
1,129
17,633
Discontinued operations
Operating earnings
(169)
(623)
Gain on disposition of rental properties and partial interests in
rental properties 680
1,201
Subtotal
511
578
Total Current taxes
1,640
18,211
Deferred taxes
Operating earnings
14,302
24,540
Gain on disposition of rental properties and partial interests in
rental properties (5,322)
(22,549)
Impairment of depreciable rental properties
(536)
(1,332)
Impairment of Land Group projects
-
(543)
Subtotal
8,444
116
Discontinued operations
Operating earnings
190
410
Gain on disposition of rental properties and partial interests in
rental properties 2,829
3,511
Subtotal
3,019
3,921
Total Deferred taxes
11,463
4,037
Grand Total
13,103
$
22,248
$
Three Months Ended April 30,
(in thousands) |
 Company
is
principally
engaged
in
the
ownership,
development,
management
and
acquisition
of
commercial
and
residential
real
estate
and
land
throughout
the
United
States.
Founded
in
1920
and
based
in
Cleveland,
Ohio,
Forest
City’s
diverse
portfolio
includes
hundreds
of
premier
properties
located
throughout
the
United
States.
We
are
especially
active
in
our
Core
Markets
–
New
York,
Boston,
Greater
Washington,
D.C./Baltimore,
Denver,
Los
Angeles,
Greater
San
Francisco,
Dallas,
Philadelphia
and
Chicago
–
where
we
have
overcome
high
barriers
to
entry
and
developed
a
unique
franchise.
These
are
great
urban
markets
with
strong
demographics
and
good
growth
potential.
Investor
Relations
Contact:
Jeff
Linton
Senior
Vice
President,
Corporate
Communication
Forest
City
Enterprises
216-416-3558
jefflinton@forestcity.net
Forest
City
Enterprises,
Inc.,
is
an
NYSE-listed
national
real
estate
company
with
$10.5
billion
in
total
assets
(4/30/2012).
The |