Attached files
| file | filename |
|---|---|
| EX-31.2 - EXHIBIT 31.2 - FOREST CITY ENTERPRISES INC | fce-10qex3129302015.htm |
| EX-31.1 - EXHIBIT 31.1 - FOREST CITY ENTERPRISES INC | fce-10qex3119302015.htm |
| EX-32.1 - EXHIBIT 32.1 - FOREST CITY ENTERPRISES INC | fce-10qex3219302015.htm |
UNITED STATES
SECURITIES AND EXCHANGE COMMISSION
Washington, D.C. 20549
_____________________________________________________________
Form 10-Q
_____________________________________________________________
(Mark One)
ý | QUARTERLY REPORT PURSUANT TO SECTION 13 OR 15 (d) OF THE SECURITIES EXCHANGE ACT OF 1934 |
For the quarterly period ended September 30, 2015
¨ | TRANSITION REPORT PURSUANT TO SECTION 13 OR 15 (d) OF THE SECURITIES EXCHANGE ACT OF 1934 |
For the transition period from to
Commission file number 1-4372
_____________________________________________________________
FOREST CITY ENTERPRISES, INC.
(Exact name of registrant as specified in its charter)
_____________________________________________________________
Ohio (State or other jurisdiction of incorporation or organization) | 34-0863886 (I.R.S. Employer Identification No.) | |||
Terminal Tower Suite 1100 | 50 Public Square Cleveland, Ohio | 44113 | ||
(Address of principal executive offices) | (Zip Code) | |||
216-621-6060
(Registrant’s telephone number, including area code)
(Former name, former address and former fiscal year, if changed since last report)
_____________________________________________________________
Indicate by check mark whether the registrant (1) has filed all reports required to be filed by Section 13 or 15(d) of the Securities Exchange Act of 1934 during the preceding 12 months (or for such shorter period that the registrant was required to file such reports), and (2) has been subject to such filing requirements for the past 90 days. Yes ý No ¨
Indicate by check mark whether the registrant has submitted electronically and posted on its corporate Web site, if any, every Interactive Date File required to be submitted and posted pursuant to Rule 405 of Regulation S-T (§232.405 of this chapter) during the preceding 12 months (or for such shorter period that the registrant was required to submit and post such files). Yes ý No ¨
Indicate by check mark whether the registrant is a large accelerated filer, an accelerated filer, a non-accelerated filer, or a smaller reporting company. See the definitions of “large accelerated filer,” “accelerated filer” and “smaller reporting company” in Rule 12b-2 of the Exchange Act. (Check one):
Large accelerated filer | ý | Accelerated filer | ¨ |
Non-accelerated filer | ¨ (Do not check if a smaller reporting company) | Smaller reporting company | ¨ |
Indicate by checkmark whether the registrant is a shell company (as defined in Rule 12b-2 of the Exchange Act). Yes ¨ No ý
Indicate the number of shares outstanding, including unvested restricted stock, of each of the issuer’s classes of common stock, as of the latest practicable date.
Class | Outstanding at October 29, 2015 |
Class A Common Stock, $.33 1/3 par value | 240,919,839 shares |
Class B Common Stock, $.33 1/3 par value | 18,824,341 shares |
Forest City Enterprises, Inc. and Subsidiaries
Table of Contents
Page | ||
Certifications | ||
i
PART I – FINANCIAL INFORMATION
Item 1. Financial Statements
Forest City Enterprises, Inc. and Subsidiaries
Consolidated Balance Sheets
(Unaudited)
September 30, 2015 | ||||||
(Unaudited) | December 31, 2014 | |||||
(in thousands) | ||||||
Assets | ||||||
Real Estate | ||||||
Completed rental properties | $ | 8,592,934 | $ | 7,753,561 | ||
Projects under construction and development | 802,621 | 477,957 | ||||
Land inventory | 73,566 | 97,469 | ||||
Total Real Estate | 9,469,121 | 8,328,987 | ||||
Less accumulated depreciation | (1,677,620 | ) | (1,555,965 | ) | ||
Real Estate, net – (variable interest entities $591.5 million and $427.8 million, respectively) | 7,791,501 | 6,773,022 | ||||
Cash and equivalents – (variable interest entities $45.7 million and $20.6 million, respectively) | 331,449 | 326,518 | ||||
Restricted cash – (variable interest entities $13.6 million and $28.6 million, respectively) | 241,562 | 266,530 | ||||
Notes and accounts receivable, net | 444,136 | 419,038 | ||||
Investments in and advances to unconsolidated entities | 665,623 | 620,466 | ||||
Other assets – (variable interest entities $19.4 million and $19.6 million, respectively) | 485,970 | 409,366 | ||||
Total Assets | $ | 9,960,241 | $ | 8,814,940 | ||
Liabilities and Equity | ||||||
Liabilities | ||||||
Mortgage debt and notes payable, nonrecourse – (variable interest entities $283.1 million and $250.7 million, respectively) | $ | 4,501,169 | $ | 4,238,201 | ||
Revolving credit facility | — | — | ||||
Convertible senior debt | 272,249 | 700,000 | ||||
Accounts payable, accrued expenses and other liabilities – (variable interest entities $115.5 million and $42.6 million, respectively) | 968,089 | 847,011 | ||||
Cash distributions and losses in excess of investments in unconsolidated entities | 149,162 | 211,493 | ||||
Deferred income taxes | 483,084 | 482,474 | ||||
Total Liabilities | 6,373,753 | 6,479,179 | ||||
Redeemable Noncontrolling Interest | 168,226 | 183,038 | ||||
Commitments and Contingencies | — | — | ||||
Equity | ||||||
Shareholders’ Equity | ||||||
Preferred stock – without par value; 20,000,000 shares authorized; no shares issued | — | — | ||||
Common stock – $.33 1/3 par value | ||||||
Class A, 371,000,000 shares authorized, 240,354,028 and 180,859,262 shares issued and 238,844,963 and 179,763,952 shares outstanding, respectively | 80,118 | 60,286 | ||||
Class B, convertible, 56,000,000 shares authorized, 18,824,341 and 19,208,517 shares issued and outstanding, respectively; 26,257,961 issuable | 6,275 | 6,403 | ||||
Total common stock | 86,393 | 66,689 | ||||
Additional paid-in capital | 2,460,133 | 1,165,828 | ||||
Retained earnings | 510,526 | 563,198 | ||||
Less treasury stock, at cost; 1,509,065 and 1,095,310 Class A shares, respectively | (29,647 | ) | (18,922 | ) | ||
Shareholders’ equity before accumulated other comprehensive loss | 3,027,405 | 1,776,793 | ||||
Accumulated other comprehensive loss | (49,959 | ) | (58,846 | ) | ||
Total Shareholders’ Equity | 2,977,446 | 1,717,947 | ||||
Noncontrolling interest | 440,816 | 434,776 | ||||
Total Equity | 3,418,262 | 2,152,723 | ||||
Total Liabilities and Equity | $ | 9,960,241 | $ | 8,814,940 | ||
The accompanying notes are an integral part of these consolidated financial statements.
2
Forest City Enterprises, Inc. and Subsidiaries
Consolidated Statements of Operations
(Unaudited)
Three Months Ended September 30, | Nine Months Ended September 30, | ||||||||||||
2015 | 2014 | 2015 | 2014 | ||||||||||
(in thousands, except per share data) | |||||||||||||
Revenues | |||||||||||||
Rental | $ | 168,723 | $ | 132,536 | $ | 457,809 | $ | 391,019 | |||||
Tenant recoveries | 38,161 | 30,082 | 101,241 | 89,146 | |||||||||
Service and management fees | 9,911 | 12,150 | 31,394 | 36,053 | |||||||||
Parking and other | 17,145 | 13,604 | 43,644 | 38,272 | |||||||||
Arena | 24,637 | 25,039 | 80,497 | 84,968 | |||||||||
Land sales | 23,535 | 15,123 | 47,589 | 50,367 | |||||||||
Military Housing | 6,945 | 6,209 | 23,724 | 24,092 | |||||||||
Total revenues | 289,057 | 234,743 | 785,898 | 713,917 | |||||||||
Expenses | |||||||||||||
Property operating and management | 97,215 | 92,347 | 285,940 | 283,075 | |||||||||
Real estate taxes | 24,261 | 19,691 | 66,959 | 59,445 | |||||||||
Ground rent | 3,701 | 2,411 | 9,376 | 6,465 | |||||||||
Arena operating | 17,199 | 17,105 | 55,019 | 55,399 | |||||||||
Cost of land sales | 9,189 | 2,879 | 15,716 | 17,081 | |||||||||
Military Housing operating | 1,938 | 1,958 | 6,289 | 10,216 | |||||||||
Corporate general and administrative | 10,191 | 13,763 | 35,895 | 35,383 | |||||||||
REIT conversion and reorganization costs | 9,515 | — | 25,498 | — | |||||||||
173,209 | 150,154 | 500,692 | 467,064 | ||||||||||
Depreciation and amortization | 79,966 | 55,511 | 206,782 | 169,838 | |||||||||
Write-offs of abandoned development projects and demolition costs | — | 456 | 5,778 | 1,389 | |||||||||
Impairment of real estate | 425,463 | 966 | 425,463 | 130,795 | |||||||||
Total expenses | 678,638 | 207,087 | 1,138,715 | 769,086 | |||||||||
Operating income (loss) | (389,581 | ) | 27,656 | (352,817 | ) | (55,169 | ) | ||||||
Interest and other income | 8,995 | 10,096 | 27,977 | 33,974 | |||||||||
Net loss on disposition of partial interest in development project | — | — | — | (19,590 | ) | ||||||||
Net gain (loss) on disposition of full or partial interest in rental properties | 1,746 | (146 | ) | 1,746 | (613 | ) | |||||||
Net gain on change in control of interests | — | — | 487,684 | 2,759 | |||||||||
Interest expense | (49,007 | ) | (59,312 | ) | (149,335 | ) | (178,917 | ) | |||||
Amortization of mortgage procurement costs | (1,793 | ) | (2,074 | ) | (5,756 | ) | (5,967 | ) | |||||
Loss on extinguishment of debt | (23,609 | ) | (49 | ) | (61,953 | ) | (927 | ) | |||||
Loss before income taxes | (453,249 | ) | (23,829 | ) | (52,454 | ) | (224,450 | ) | |||||
Income tax expense (benefit) | |||||||||||||
Current | 6,526 | 3,493 | 10,050 | 8,992 | |||||||||
Deferred | (186,172 | ) | (3,858 | ) | (6,651 | ) | (52,373 | ) | |||||
(179,646 | ) | (365 | ) | 3,399 | (43,381 | ) | |||||||
Earnings (loss) from unconsolidated entities, gross of tax | |||||||||||||
Equity in earnings (loss) | (29,132 | ) | 10,157 | (20,094 | ) | 30,468 | |||||||
Net gain on disposition of interest in unconsolidated entities | 1,009 | 9,189 | 20,293 | 50,075 | |||||||||
Impairment | (1,384 | ) | — | (1,384 | ) | — | |||||||
(29,507 | ) | 19,346 | (1,185 | ) | 80,543 | ||||||||
Loss from continuing operations | (303,110 | ) | (4,118 | ) | (57,038 | ) | (100,526 | ) | |||||
Discontinued operations, net of tax | |||||||||||||
Operating loss from rental properties | — | — | — | (1,844 | ) | ||||||||
Gain on disposition of rental properties | — | — | — | 14,856 | |||||||||
— | — | — | 13,012 | ||||||||||
Net loss | (303,110 | ) | (4,118 | ) | (57,038 | ) | (87,514 | ) | |||||
Noncontrolling interests | |||||||||||||
Loss from continuing operations attributable to noncontrolling interests, gross of tax | 891 | 4,804 | 4,366 | 10,778 | |||||||||
Earnings from discontinued operations attributable to noncontrolling interests | — | — | — | (50 | ) | ||||||||
891 | 4,804 | 4,366 | 10,728 | ||||||||||
Net earnings (loss) attributable to Forest City Enterprises, Inc. | $ | (302,219 | ) | $ | 686 | $ | (52,672 | ) | $ | (76,786 | ) | ||
Basic and diluted earnings (loss) per common share | |||||||||||||
Earnings (loss) from continuing operations attributable to common shareholders | $ | (1.18 | ) | $ | — | $ | (0.23 | ) | $ | (0.45 | ) | ||
Earnings from discontinued operations attributable to common shareholders | — | — | — | 0.06 | |||||||||
Net earnings (loss) attributable to common shareholders | $ | (1.18 | ) | $ | — | $ | (0.23 | ) | $ | (0.39 | ) | ||
The accompanying notes are an integral part of these consolidated financial statements.
3
Forest City Enterprises, Inc. and Subsidiaries
Consolidated Statements of Comprehensive Income (Loss)
(Unaudited)
Three Months Ended September 30, | ||||||
2015 | 2014 | |||||
(in thousands) | ||||||
Net earnings (loss) | $ | (303,110 | ) | $ | (4,118 | ) |
Other comprehensive income (loss), net of tax: | ||||||
Foreign currency translation adjustments (net of tax of $(68) and $64, respectively) | 109 | (102 | ) | |||
Unrealized net gains on interest rate derivative contracts (net of tax of $(739) and $(4,587), respectively) | 2,069 | 7,265 | ||||
Total other comprehensive income, net of tax | 2,178 | 7,163 | ||||
Comprehensive income (loss) | (300,932 | ) | 3,045 | |||
Comprehensive loss attributable to noncontrolling interest | 887 | 4,779 | ||||
Total comprehensive income (loss) attributable to Forest City Enterprises, Inc. | $ | (300,045 | ) | $ | 7,824 | |
Nine Months Ended September 30, | ||||||
2015 | 2014 | |||||
(in thousands) | ||||||
Net earnings (loss) | $ | (57,038 | ) | $ | (87,514 | ) |
Other comprehensive income (loss), net of tax: | ||||||
Foreign currency translation adjustments (net of tax of $(18) and ($30), respectively) | 29 | 48 | ||||
Unrealized net gains on interest rate derivative contracts (net of tax of $(5,612) and $(9,647), respectively) | 8,870 | 15,272 | ||||
Total other comprehensive income, net of tax | 8,899 | 15,320 | ||||
Comprehensive income (loss) | (48,139 | ) | (72,194 | ) | ||
Comprehensive loss attributable to noncontrolling interest | 4,354 | 10,682 | ||||
Total comprehensive income (loss) attributable to Forest City Enterprises, Inc. | $ | (43,785 | ) | $ | (61,512 | ) |
The accompanying notes are an integral part of these consolidated financial statements.
4
Forest City Enterprises, Inc. and Subsidiaries
Consolidated Statements of Equity
(Unaudited)
Accumulated | ||||||||||||||||||||||||||||||
Common Stock | Additional | Other | ||||||||||||||||||||||||||||
Class A | Class B | Paid-In | Retained | Treasury Stock | Comprehensive | Noncontrolling | ||||||||||||||||||||||||
Shares | Amount | Shares | Amount | Capital | Earnings | Shares | Amount | (Loss) Income | Interest | Total | ||||||||||||||||||||
(in thousands) | ||||||||||||||||||||||||||||||
Balances at December 31, 2013 | 178,499 | $ | 59,500 | 20,173 | $ | 6,725 | $ | 1,095,748 | $ | 570,793 | 942 | $ | (15,978 | ) | $ | (76,582 | ) | $ | 285,913 | $ | 1,926,119 | |||||||||
Net loss, net of $17,095 loss attributable to redeemable noncontrolling interest | (7,595 | ) | 3,670 | (3,925 | ) | |||||||||||||||||||||||||
Other comprehensive income, net of tax | 17,736 | 55 | 17,791 | |||||||||||||||||||||||||||
Purchase of treasury stock | 215 | (4,009 | ) | (4,009 | ) | |||||||||||||||||||||||||
Conversion of Class B to Class A shares | 964 | 322 | (964 | ) | (322 | ) | — | |||||||||||||||||||||||
Restricted stock vested | 723 | 240 | (240 | ) | — | |||||||||||||||||||||||||
Exercise of stock options | (276 | ) | (62 | ) | 1,065 | 789 | ||||||||||||||||||||||||
Stock-based compensation | 19,673 | 19,673 | ||||||||||||||||||||||||||||
Write-off of deferred tax asset related to expired stock options | (419 | ) | (419 | ) | ||||||||||||||||||||||||||
Exchange of Class A Common Units for Class A shares | 673 | 224 | 34,134 | (34,358 | ) | — | ||||||||||||||||||||||||
Redeemable noncontrolling interest adjustment | (28,390 | ) | (28,390 | ) | ||||||||||||||||||||||||||
Acquisition of partners’ noncontrolling interest in consolidated subsidiaries | (32,505 | ) | (67,358 | ) | (99,863 | ) | ||||||||||||||||||||||||
Contributions from noncontrolling interests | 175,274 | 175,274 | ||||||||||||||||||||||||||||
Distributions to noncontrolling interests | (14,634 | ) | (14,634 | ) | ||||||||||||||||||||||||||
Adjustment due to change in ownership of consolidated subsidiaries | 78,103 | (82,038 | ) | (3,935 | ) | |||||||||||||||||||||||||
Change in control of equity method subsidiary | 168,252 | 168,252 | ||||||||||||||||||||||||||||
Balances at December 31, 2014 | 180,859 | $ | 60,286 | 19,209 | $ | 6,403 | $ | 1,165,828 | $ | 563,198 | 1,095 | $ | (18,922 | ) | $ | (58,846 | ) | $ | 434,776 | $ | 2,152,723 | |||||||||
Net loss, net of $14,812 loss attributable to redeemable noncontrolling interest | (52,672 | ) | 10,446 | (42,226 | ) | |||||||||||||||||||||||||
Other comprehensive income, net of tax | 8,887 | 12 | 8,899 | |||||||||||||||||||||||||||
Issuance of Class A shares in equity offering | 37,375 | 12,458 | 794,042 | 806,500 | ||||||||||||||||||||||||||
Purchase of treasury stock | 217 | (5,412 | ) | (5,412 | ) | |||||||||||||||||||||||||
Conversion of Class B to Class A shares | 385 | 128 | (385 | ) | (128 | ) | — | |||||||||||||||||||||||
Proceeds and Class A shares received from termination of Convertible Senior Notes hedge | 24,321 | 258 | (6,503 | ) | 17,818 | |||||||||||||||||||||||||
Issuance of Class A shares in exchange for Convertible Senior Notes | 19,967 | 6,656 | 403,924 | 410,580 | ||||||||||||||||||||||||||
Restricted stock vested | 736 | 246 | (246 | ) | — | |||||||||||||||||||||||||
Exercise of stock options | (235 | ) | (61 | ) | 1,190 | 955 | ||||||||||||||||||||||||
Stock-based compensation | 21,536 | 21,536 | ||||||||||||||||||||||||||||
Write-off of deferred tax asset related to expired stock options | (1,536 | ) | (1,536 | ) | ||||||||||||||||||||||||||
Exchange of Class A Common Units for Class A shares | 1,032 | 344 | 52,319 | (52,663 | ) | — | ||||||||||||||||||||||||
Acquisition of partners’ noncontrolling interest in consolidated subsidiaries | (299 | ) | (9 | ) | (308 | ) | ||||||||||||||||||||||||
Contributions from noncontrolling interests | 77,369 | 77,369 | ||||||||||||||||||||||||||||
Distributions to noncontrolling interests | (28,588 | ) | (28,588 | ) | ||||||||||||||||||||||||||
Adjustment due to change in ownership of consolidated subsidiaries | 479 | (527 | ) | (48 | ) | |||||||||||||||||||||||||
Balances at September 30, 2015 (Unaudited) | 240,354 | $ | 80,118 | 18,824 | $ | 6,275 | $ | 2,460,133 | $ | 510,526 | 1,509 | $ | (29,647 | ) | $ | (49,959 | ) | $ | 440,816 | $ | 3,418,262 | |||||||||
The accompanying notes are an integral part of these consolidated financial statements.
5
Forest City Enterprises, Inc. and Subsidiaires
Consolidated Statements of Cash Flows
(Unaudited)
Nine Months Ended September 30, | ||||||
2015 | 2014 | |||||
(in thousands) | ||||||
Net loss | $ | (57,038 | ) | $ | (87,514 | ) |
Depreciation and amortization | 206,782 | 169,838 | ||||
Amortization of mortgage procurement costs | 5,756 | 5,967 | ||||
Impairment of real estate | 425,463 | 130,795 | ||||
Impairment of unconsolidated entities | 1,384 | — | ||||
Write-offs of abandoned development projects | 674 | 283 | ||||
Loss on extinguishment of debt | 61,953 | 927 | ||||
Net loss on disposition of partial interest in development project | — | 19,590 | ||||
Net (gain) loss on disposition of full or partial interest in rental properties | (1,746 | ) | 613 | |||
Net gain on change in control of interests | (487,684 | ) | (2,759 | ) | ||
Deferred income tax benefit | (6,651 | ) | (52,373 | ) | ||
Earnings from unconsolidated entities | (199 | ) | (80,543 | ) | ||
Stock-based compensation expense | 16,569 | 10,730 | ||||
Amortization and mark-to-market adjustments of derivative instruments | (2,653 | ) | 4,984 | |||
Cash distributions from operations of unconsolidated entities | 46,671 | 59,217 | ||||
Non-cash operating expenses and deferred taxes included in discontinued operations | — | 9,883 | ||||
Gain on disposition of rental properties included in discontinued operations | — | (28,100 | ) | |||
Decrease in land inventory | 5,062 | 9,203 | ||||
Increase in notes and accounts receivable | (17,726 | ) | (2,065 | ) | ||
(Increase) decrease in other assets | (15,341 | ) | 7,562 | |||
Decrease in accounts payable, accrued expenses and other liabilities | (22,726 | ) | (15,009 | ) | ||
Net cash provided by operating activities | 158,550 | 161,229 | ||||
Cash flows from investing activities | ||||||
Capital expenditures | (338,490 | ) | (295,182 | ) | ||
Acquisitions | (397,275 | ) | (19,988 | ) | ||
Payment of lease procurement costs | (8,063 | ) | (7,212 | ) | ||
(Increase) decrease in notes receivable | (10,934 | ) | 10,580 | |||
Decrease in restricted cash used for investing purposes | 42,262 | 106,165 | ||||
Proceeds from disposition of rental properties or development project | 36,594 | 236,908 | ||||
Contributions to investments in and advances to unconsolidated entities | (92,678 | ) | (112,613 | ) | ||
Distributions from investments in and advances to unconsolidated entities | 11,911 | 120,294 | ||||
Net cash (used in) provided by investing activities | (756,673 | ) | 38,952 | |||
Cash flows from financing activities | ||||||
Proceeds from nonrecourse mortgage debt and notes payable | 256,049 | 507,788 | ||||
Principal payments on nonrecourse mortgage debt and notes payable | (441,822 | ) | (733,937 | ) | ||
Borrowings on revolving credit facility | 111,850 | 832,325 | ||||
Payments on revolving credit facility | (111,850 | ) | (832,325 | ) | ||
Payments to noteholders related to exchange of convertible senior notes | (61,110 | ) | — | |||
Transaction costs related to exchange of convertible senior notes | (6,950 | ) | — | |||
Proceeds received from termination of convertible senior note hedge | 17,818 | — | ||||
Proceeds from issuance of Class A common stock, net of $34,438 of transaction costs | 806,500 | — | ||||
Payments of deferred financing costs | (11,447 | ) | (10,751 | ) | ||
Purchase of treasury stock | (5,412 | ) | (3,800 | ) | ||
Exercise of stock options | 955 | 583 | ||||
Acquisitions of noncontrolling interests | (308 | ) | (83,871 | ) | ||
Contributions from noncontrolling interests | 77,369 | 34,249 | ||||
Distributions to noncontrolling interests | (28,588 | ) | (8,992 | ) | ||
Net cash provided by (used in) financing activities | 603,054 | (298,731 | ) | |||
Net increase (decrease) in cash and equivalents | 4,931 | (98,550 | ) | |||
Cash and equivalents at beginning of period | 326,518 | 280,206 | ||||
Cash and equivalents at end of period | $ | 331,449 | $ | 181,656 | ||
The accompanying notes are an integral part of these consolidated financial statements.
6
Forest City Enterprises, Inc. and Subsidiaries
Notes to Consolidated Financial Statements
(Unaudited)
A. Accounting Policies
Basis of Presentation
The interim consolidated financial statements have been prepared in accordance with the instructions to Form 10-Q and should be read in conjunction with the consolidated financial statements and related notes included in the Company’s annual report on Form 10-K for the year ended December 31, 2014, as amended. The results of interim periods are not necessarily indicative of results for the full year or any subsequent period. In management’s opinion, all adjustments (consisting solely of normal recurring matters) necessary for a fair statement of financial position, results of operations and cash flows as of and for the periods presented have been included.
Use of Estimates
The preparation of consolidated financial statements in conformity with accounting principles generally accepted in the United States of America (“GAAP”) requires the Company to make estimates and assumptions in certain circumstances that affect amounts reported in the accompanying consolidated financial statements and related notes. Some of the critical estimates include, but are not limited to, determination of the primary beneficiary of variable interest entities (“VIEs”), estimates of useful lives for long-lived assets, reserves for collection on accounts and notes receivable and other investments, the fair value estimate of redeemable noncontrolling interest, net gain on change in control of interests, impairment of real estate and other-than-temporary impairments on equity method investments. Actual results could differ from those estimates.
Planned REIT Conversion
On January 13, 2015, the Company announced its Board of Directors approved a plan to pursue conversion to real estate investment trust (“REIT”) status. On September 16, 2015, the Securities and Exchange Commission (the “SEC”) declared the Company’s wholly owned subsidiary, Forest City Realty Trust, Inc.’s registration statement on Form S-4 effective. On September 17, 2015, the Company filed with the SEC a definitive proxy statement and Forest City Realty Trust, Inc. filed a prospectus in connection with the Company’s plan to convert to REIT status. The Company’s special shareholder meeting to present proposals related to the Company’s conversion to REIT status was held on October 20, 2015. Each of the proposals presented to the shareholders received the required number of affirmative votes, and as a result, each proposal was approved by the shareholders. The Company expects to elect REIT status for its taxable year ended December 31, 2016, subject to business conditions, the completion of related preparatory work, obtaining necessary approvals and third-party consents.
Variable Interest Entities
As of September 30, 2015, the Company determined it was the primary beneficiary of 25 VIEs representing 21 consolidated properties. The creditors of the consolidated VIEs do not have recourse to the Company’s general credit. As of September 30, 2015, the Company determined it was not the primary beneficiary of 64 VIEs and accounts for these interests as equity method investments. The maximum exposure to loss of these unconsolidated VIEs is limited to $339,000,000, the Company’s investment balances as of September 30, 2015.
Investments in Unconsolidated Entities
The Company owns an equity interest in the Brooklyn Nets (the “Nets”), a member of the National Basketball Association (“NBA”), through the Company’s consolidated subsidiary Nets Sports & Entertainment (“NS&E”). NS&E owns 20% of the Nets and accounts for its interests in the Nets on the equity method of accounting.
In July 2013, the Company elected not to fund current or future capital calls related to this non-core investment and began investigating various disposition strategies. The Company’s election did not constitute a default under any agreements related to the Company’s investment in the Nets but did provide the right to the majority partner to dilute the Company’s ownership interest. In order to preserve the ownership interest while pursuing disposition strategies, the Company entered into a forbearance agreement with the majority partner of the Nets related to the 2013-2014 and 2014-2015 NBA basketball season capital calls. Based on the decision to no longer fund the equity method investment, the Company ceased recording the Company’s portion of the equity in earnings. The Company has been actively marketing its interest in the Nets but has yet to enter a definitive agreement to sell its ownership interests. On September 8, 2015, the forbearance agreement, as amended, expired and the Company made the strategic decision to fund the Company’s portion of the Nets capital calls, rather than have the Company’s ownership interests diluted. As a result, the Company’s portion of the net loss recorded during the nine months ended September 30, 2015 primarily represents losses related to its ownership interest in the Nets from the period the Company ceased funding to present. It is the Company’s intention to continue to market this equity method investment for sale.
7
Forest City Enterprises, Inc. and Subsidiaries
Notes to Consolidated Financial Statements
(Unaudited)
For the nine months ended September 30, 2015, Brooklyn Basketball Holdings, LLC ("BBH"), the equity method subsidiary of NS&E that owns the Nets, was deemed a significant subsidiary. Summarized financial information for BBH is as follows:
Nine Months Ended September 30, | |||||||
2015 | 2014 | ||||||
(in thousands) | |||||||
Operations: | |||||||
Revenues | $ | 90,675 | $ | 92,790 | |||
Operating expenses | (135,256 | ) | (180,482 | ) | |||
Interest expense, net | (9,191 | ) | (9,209 | ) | |||
Depreciation and amortization | (5,037 | ) | (5,754 | ) | |||
Net loss (pre-tax) | $ | (58,809 | ) | $ | (102,655 | ) | |
Company's portion of net loss (pre-tax) | $ | (38,435 | ) | $ | (2,361 | ) | |
New Accounting Guidance
The following accounting pronouncements were adopted during the nine months ended September 30, 2015:
In January 2015, the FASB issued an amendment to the accounting guidance to eliminate the concept of extraordinary items from GAAP. The presentation and disclosure guidance for items that are unusual in nature or occur infrequently has been retained and expanded to include items that are both unusual in nature and infrequently occurring. This guidance was early adopted effective January 1, 2015 and did not have a material impact on the Company’s consolidated financial statements.
The following new accounting pronouncements will be adopted on their respective effective dates:
In May 2014, the FASB issued an amendment to the accounting guidance for revenue from contracts with customers. The core principle of this guidance is an entity should recognize revenue to depict the transfer of promised goods or services to customers in an amount that reflects the consideration to which the entity expects to be entitled in exchange for those goods or services. The guidance defines steps an entity should apply to achieve the core principle. This guidance is effective for annual reporting periods beginning after December 15, 2017 and interim reporting periods within that annual period and allows for both retrospective and modified retrospective methods of adoption. Early adoption is permitted for annual periods beginning after December 15, 2016. The Company is currently in the process of determining the method of adoption and evaluating the impact of adopting this guidance on its consolidated financial statements.
In August 2014, the FASB issued an amendment to the accounting guidance on disclosure of uncertainties about an entity’s ability to continue as a going concern. This guidance requires management to assess the Company’s ability to continue as a going concern and to provide disclosures under certain circumstances. This guidance is effective for annual reporting periods ending after December 15, 2016 and interim reporting periods thereafter. Early adoption is permitted. The Company does not expect the adoption of this guidance to have a material impact on its consolidated financial statements.
In February 2015, the FASB issued an amendment to the consolidation accounting guidance. This guidance changes the required analysis to determine whether certain types of legal entities should be consolidated. The amendment modifies the evaluation of whether limited partnerships and similar legal entities are VIEs or voting interest entities, eliminates the presumption that a general partner should consolidate a limited partnership and may affect the consolidation analysis of entities involved in VIEs, particularly those having fee arrangements and related party relationships. This guidance is effective for fiscal years, and for interim reporting periods within those fiscal years, beginning after December 15, 2015. Early adoption is permitted. The Company does not expect the adoption of this guidance to have a material impact on its consolidated financial statements.
In April 2015, the FASB issued an Accounting Standards Update to simplify the presentation of debt issuance costs. This guidance requires that third-party debt issuance costs be presented in the balance sheet as a direct deduction from the carrying value of the debt. Debt issuance costs related to revolving lines of credit are not within the score of this new guidance. This guidance is effective for fiscal years, and for interim reporting periods within those fiscal years, beginning after December 15, 2015. Early adoption is permitted. The Company does not expect the adoption of this guidance to have a material impact on its consolidated financial statements.
8
Forest City Enterprises, Inc. and Subsidiaries
Notes to Consolidated Financial Statements
(Unaudited)
Related Party Transactions
The Company and certain of its affiliates entered into a Master Contribution and Sale Agreement (the “Master Contribution Agreement”) with Bruce C. Ratner (“Mr. Ratner”), Executive Vice President and Director, and certain entities and individuals affiliated with Mr. Ratner (the “BCR Entities”) in August 2006 to purchase their interests in a total of 30 retail, office and residential operating properties and service companies in the Greater New York City metropolitan area. The Company issued Class A Common Units (“Units”) in a jointly-owned, limited liability company in exchange for their interests. The Units may be exchanged for one of the following forms of consideration at the Company’s sole discretion: (i) an equal number of shares of the Company’s Class A common stock or, (ii) cash based on a formula using the average closing price of the Class A common stock at the time of conversion or, (iii) a combination of cash and shares of the Company’s Class A common stock. The Company has no rights to redeem or repurchase the Units. Pursuant to the Master Contribution Agreement, certain projects under development would remain owned jointly until each project was completed and achieved “stabilization.” Upon stabilization, each project would be valued and the Company, in its discretion, would choose among various ownership options for the project.
In September 2015, certain BCR Entities exchanged 1,032,402 of the Units. The Company issued 1,032,402 shares of its Class A common stock for the exchanged Units. The Company accounted for the exchange as a purchase of noncontrolling interests, resulting in a reduction of noncontrolling interests of $52,663,000, an increase to Class A common stock of $344,000 and a combined increase to additional paid-in capital of $52,319,000, accounting for the fair value of common stock issued and the difference between the fair value of consideration exchanged and the noncontrolling interest balance. At September 30, 2015 and December 31, 2014, 1,940,788 and 2,973,190 Units, respectively, were outstanding. The carrying value of the Units of $99,000,000 and $151,663,000 is included as noncontrolling interests at September 30, 2015 and December 31, 2014, respectively.
In June 2014, one of the BCR Entities exchanged 673,565 of the Units. The Company issued 673,565 shares of its Class A common stock for the exchanged Units. The Company accounted for the exchange as a purchase of noncontrolling interests, resulting in a reduction of noncontrolling interests of $34,358,000, an increase to Class A common stock of $224,000 and a combined increase to additional paid-in capital of $34,134,000, accounting for the fair value of common stock issued and the difference between the fair value of consideration exchanged and the noncontrolling interest balance. At September 30, 2014 and December 31, 2013, 2,973,190 and 3,646,755 Units, respectively, were outstanding.
Pursuant to the terms of the Master Contribution Agreement, in January 2014, the Company caused certain of its affiliates to acquire the BCR Entities’ interests in 8 Spruce Street, an apartment community in Manhattan, New York, DKLB BKLN, an apartment community in Brooklyn, New York, and East River Plaza, a specialty retail center in Manhattan, New York, for $14,286,000. Prior to the transaction, the Company accounted for the three projects using the equity method of accounting and subsequently accounts for the projects as equity method investments as the partners continue to have joint control.
As a result of the March 2014 disposal of Quartermaster Plaza, a specialty retail center in Philadelphia, Pennsylvania, the Company accrued $1,646,000 during the nine months ended September 30, 2014, related to a tax indemnity payment due to the BCR Entities, all of which was paid as of March 31, 2015.
Accumulated Other Comprehensive Loss
The following table summarizes the components of accumulated other comprehensive income (loss) (“accumulated OCI”):
September 30, 2015 | December 31, 2014 | |||||
(in thousands) | ||||||
Unrealized losses on foreign currency translation | $ | 90 | $ | 137 | ||
Unrealized losses on interest rate contracts (1) | 81,602 | 96,084 | ||||
81,692 | 96,221 | |||||
Income tax benefit | (31,651 | ) | (37,281 | ) | ||
Noncontrolling interest | (82 | ) | (94 | ) | ||
Accumulated Other Comprehensive Loss | $ | 49,959 | $ | 58,846 | ||
(1) | Included in the amounts as of September 30, 2015 and December 31, 2014 are $58,223 and $73,536, respectively, of unrealized loss on an interest rate swap associated with the New York Times office building on its nonrecourse mortgage debt with a notional amount of $640,000. This swap effectively fixes the mortgage at an all-in lender interest rate of 6.40% and expires in September 2017. |
9
Forest City Enterprises, Inc. and Subsidiaries
Notes to Consolidated Financial Statements
(Unaudited)
The following table summarizes the changes, net of tax and noncontrolling interest, of accumulated OCI by component:
Foreign Currency Translation | Interest Rate Contracts | Total | |||||||
(in thousands) | |||||||||
Nine Months Ended September 30, 2015 | |||||||||
Balance, January 1, 2015 | $ | (84 | ) | $ | (58,762 | ) | $ | (58,846 | ) |
Gain (loss) recognized in accumulated OCI | 29 | (9,524 | ) | (9,495 | ) | ||||
Loss reclassified from accumulated OCI | — | 18,382 | 18,382 | ||||||
Total other comprehensive income | 29 | 8,858 | 8,887 | ||||||
Balance, September 30, 2015 | $ | (55 | ) | $ | (49,904 | ) | $ | (49,959 | ) |
Nine Months Ended September 30, 2014 | |||||||||
Balance, January 1, 2014 | $ | (116 | ) | $ | (76,466 | ) | $ | (76,582 | ) |
Gain (loss) recognized in accumulated OCI | 48 | (6,235 | ) | (6,187 | ) | ||||
Loss reclassified from accumulated OCI | — | 21,461 | 21,461 | ||||||
Total other comprehensive income | 48 | 15,226 | 15,274 | ||||||
Balance, September 30, 2014 | $ | (68 | ) | $ | (61,240 | ) | $ | (61,308 | ) |
The following table summarizes losses reclassified from accumulated OCI and their location on the Consolidated Statements of Operations:
Accumulated OCI Components | Loss Reclassified from Accumulated OCI | Location on Consolidated Statements of Operations | |||
(in thousands) | |||||
Nine Months Ended September 30, 2015 | |||||
Interest rate contracts | $ | 28,087 | Interest expense | ||
Interest rate contracts | (900 | ) | Net gain on change in control of interests | ||
Interest rate contracts | 2,852 | Earnings (loss) from unconsolidated entities, gross of tax | |||
30,039 | Total before income tax and noncontrolling interest | ||||
(11,645 | ) | Income tax benefit | |||
(12 | ) | Noncontrolling interest | |||
$ | 18,382 | Loss reclassified from accumulated OCI | |||
Nine Months Ended September 30, 2014 | |||||
Interest rate contracts | $ | 28,413 | Interest expense | ||
Interest rate contracts | 3,666 | Discontinued operations | |||
Interest rate contracts | 3,005 | Earnings (loss) from unconsolidated entities, gross of tax | |||
35,084 | Total before income tax and noncontrolling interest | ||||
(13,597 | ) | Income tax benefit | |||
(26 | ) | Noncontrolling interest | |||
$ | 21,461 | Loss reclassified from accumulated OCI | |||
10
Forest City Enterprises, Inc. and Subsidiaries
Notes to Consolidated Financial Statements
(Unaudited)
Supplemental Non-Cash Disclosures
The following table summarizes the impact to the applicable balance sheet line items as a result of various non-cash transactions. Non-cash transactions primarily include dispositions of operating properties whereby the nonrecourse mortgage debt is assumed by the buyer, acquisition of rental properties, exchanges of Units or senior notes for Class A common stock, changes in consolidation methods of fully consolidated properties and equity method investments due to the occurrence of triggering events including, but not limited to, disposition of a partial interest in rental properties or development projects or acquisition of a partner’s interest, change in construction payables and other capital expenditures, change in the fair market value of redeemable noncontrolling interest and capitalization of stock-based compensation granted to employees directly involved with the development and construction of real estate.
Nine Months Ended September 30, | ||||||
2015 | 2014 | |||||
(in thousands) | ||||||
Non-cash changes to balance sheet - Investing Activities | ||||||
Projects under construction and development | $ | 84,971 | $ | (351,905 | ) | |
Completed rental properties | 827,125 | (136,008 | ) | |||
Restricted cash | 8,969 | 20 | ||||
Notes and accounts receivable | — | 2,728 | ||||
Investments in and advances to affiliates - due to dispositions or change in control | 71,438 | 97,154 | ||||
Investments in and advances to affiliates - other activity | 20,397 | 25,509 | ||||
Total non-cash effect on investing activities | $ | 1,012,900 | $ | (362,502 | ) | |
Non-cash changes to balance sheet - Financing Activities | ||||||
Accounts payable, accrued expenses and other liabilities | $ | — | $ | 10,683 | ||
Nonrecourse mortgage debt and notes payable | 448,741 | (342,960 | ) | |||
Convertible senior debt | (424,433 | ) | — | |||
Class A common stock | 7,000 | 225 | ||||
Additional paid-in capital | 473,614 | 34,741 | ||||
Treasury stock | (6,503 | ) | — | |||
Redeemable noncontrolling interest | — | 28,390 | ||||
Noncontrolling interest | (53,188 | ) | (73,535 | ) | ||
Total non-cash effect on financing activities | $ | 445,231 | $ | (342,456 | ) | |
B. Mortgage Debt and Notes Payable, Nonrecourse
The following table summarizes the mortgage debt and notes payable, nonrecourse maturities as of September 30, 2015:
Years Ending December 31, | |||
(in thousands) | |||
2015 | $ | 75,578 | |
2016 | 283,047 | ||
2017 | 1,259,953 | ||
2018 | 360,710 | ||
2019 | 363,087 | ||
Thereafter | 2,158,794 | ||
Total | $ | 4,501,169 | |
11
Forest City Enterprises, Inc. and Subsidiaries
Notes to Consolidated Financial Statements
(Unaudited)
C. Revolving Credit Facility
The Company’s Fourth Amended and Restated Credit Agreement and Fourth Amended and Restated Guaranty of Payment of Debt, as amended to the date hereof (collectively, the “Credit Facility”), provides total available borrowings of $500,000,000. The Credit Facility matures on February 21, 2016 and provides for one, 12-month extension option, subject to certain conditions. Borrowings bear interest at London Interbank Offered Rate (“LIBOR”) plus 3.50%. Up to $100,000,000 of the available borrowings may be used, in the aggregate, for letters of credit and/or surety bonds. The Credit Facility has restrictive covenants, including a prohibition on certain consolidations and mergers, limitations on the amount of debt, guarantees and property liens and restrictions on the pledging of ownership interests in subsidiaries. The Company may repurchase up to $100,000,000 of Class A common stock and declare or pay dividends in an amount not to exceed $24,000,000 in the aggregate in any four quarter period to Class A or B common shareholders, subject to certain conditions. The Credit Facility contains development limitations and financial covenants, including the maintenance of minimum liquidity, debt yield, debt service and cash flow coverage ratios, and specified levels of shareholders’ equity (all as specified in the Credit Facility). At September 30, 2015, the Company was in compliance with all of these financial covenants.
The following table summarizes available credit on the Credit Facility:
September 30, 2015 | December 31, 2014 | |||||
(in thousands) | ||||||
Maximum borrowings | $ | 500,000 | $ | 500,000 | ||
Less outstanding balances: | ||||||
Borrowings | — | — | ||||
Letters of credit | 70,276 | 85,768 | ||||
Surety bonds | — | — | ||||
Available credit | $ | 429,724 | $ | 414,232 | ||
In anticipation of the Company’s planned REIT conversion, the Company entered the market to refinance the Credit Facility. To date, discussions have been limited to a select group of banks the Company believes can lead a new facility. Terms are being finalized and loan documents are being drafted with the intent to close on the new facility with a subset of the existing bank group during the three months ended December 31, 2015. The new revolving credit facility, if consummated, is expected to provide at least the same level of borrowings and contain terms including restrictive and/or financial covenants customary for a REIT with a similar credit profile. However, there is no assurance the Company will be able to agree on favorable terms or at all.
D. Convertible Senior Debt
The following table summarizes the Company’s convertible senior debt:
September 30, 2015 | December 31, 2014 | |||||
(in thousands) | ||||||
5.000% Notes due 2016 | $ | 1,368 | $ | 50,000 | ||
4.250% Notes due 2018 | 154,526 | 350,000 | ||||
3.625% Notes due 2020 | 116,355 | 300,000 | ||||
Total | $ | 272,249 | $ | 700,000 | ||
During the three and nine months ended September 30, 2015, the Company entered into separate, privately negotiated exchange agreements with certain holders of the Company’s convertible senior notes. Under the terms of the agreements, holders agreed to exchange certain notes for shares of Class A common stock and cash payments. The cash payments were primarily for accrued and unpaid interest and in consideration for additional interest payable through maturity. The additional interest payable through maturity was based in part on the daily Volume Weighted Average Price during a 20-trading day measurement period following the agreement date for the 2018 and 2020 Senior Notes exchanges (that occurred in February 2015) and a 5-trading day measurement period commencing July 16, 2015 for the 2018 and 2020 Note exchanges (that occurred in July 2015). Under the accounting guidance for induced conversions of convertible debt, additional amounts paid to induce the holders to exchange the notes were expensed resulting in a non-tax deductible loss on extinguishment of debt. For the three and nine months ended September 30, 2015, the Company recorded $22,653,000 and $57,795,000, respectively, as a loss on extinguishment of debt related to the exchange agreement transactions.
12
Forest City Enterprises, Inc. and Subsidiaries
Notes to Consolidated Financial Statements
(Unaudited)
The following table summarizes exchange agreement transactions completed during the nine months ended September 30, 2015:
Agreement Date | Issuance | Aggregate Principal | Class A Common Shares Issued | Cash Payments to Noteholders | Loss on Extinguishment | |||||||
(in thousands, except share data) | ||||||||||||
First Quarter-2015 | ||||||||||||
February 26, 2015 | 2018 Senior Notes | $ | 120,087 | 5,541,115 | $ | 13,641 | $ | 13,372 | ||||
February 26, 2015 | 2020 Senior Notes | 128,238 | 5,297,885 | 19,283 | 19,038 | |||||||
March 5, 2015 | 2016 Senior Notes | 40,481 | 2,805,513 | 6,163 | 2,732 | |||||||
Total | $ | 288,806 | 13,644,513 | $ | 39,087 | $ | 35,142 | |||||
Third Quarter-2015 | ||||||||||||
July 15, 2015 | 2016 Senior Notes | $ | 8,151 | 555,016 | $ | 1,305 | $ | 489 | ||||
July 15/16, 2015 | 2018 Senior Notes | 75,387 | 3,478,511 | 13,052 | 11,664 | |||||||
July 15, 2015 | 2020 Senior Notes | 55,407 | 2,289,013 | 11,371 | 10,500 | |||||||
Total | $ | 138,945 | 6,322,540 | $ | 25,728 | $ | 22,653 | |||||
Grand Total | $ | 427,751 | 19,967,053 | $ | 64,815 | $ | 57,795 | |||||
Amounts paid to noteholders for consideration of additional interest through maturity are presented as cash used in financing activities in the Consolidated Statement of Cash Flows.
In connection with the 2016 Senior Notes issuance, the Company entered into a convertible note hedge transaction intended to reduce, subject to a limit, the potential dilution with respect to the Company’s Class A common stock upon conversion of the 2016 Senior Notes. On March 3, 2015, the Company terminated and settled the convertible note hedge and received proceeds of $17,818,000 and 258,350 shares of Class A common stock, which the Company initially put into treasury. Under the accounting guidance, the total consideration received was recorded as an increase to additional paid in capital.
All of the senior debt are unsecured senior obligations and rank equally with all existing and future unsecured indebtedness; however, they are effectively subordinated to the Credit Facility and all existing and future secured indebtedness and other liabilities of the Company’s subsidiaries to the extent of the value of the collateral securing that other debt.
E. Derivative Instruments and Hedging Activities
Risk Management Objective of Using Derivatives
The Company maintains an overall interest rate risk management strategy using derivative instruments to minimize significant unplanned impact on earnings and cash flows caused by interest rate volatility. The strategy uses interest rate swaps and option contracts having indices related to the pricing of specific liabilities. The Company enters into interest rate swaps to convert floating-rate debt to fixed-rate long-term debt, and vice-versa, depending on market conditions, or forward starting swaps to hedge the changes in benchmark interest rates on forecasted financings. Interest rate swaps are generally for periods of one to ten years. Option products are primarily interest rate caps for periods of one to three years. The use of option products is consistent with the Company’s risk management objective to reduce or eliminate exposure to variability in future cash flows primarily attributable to changes in benchmark rates relating to forecasted financings, and the variability in cash flows attributable to increases relating to interest payments on its floating-rate debt.
Cash Flow Hedges of Interest Rate Risk
The Company’s objectives in using interest rate derivatives are to add stability to interest expense and to manage exposure to interest rate movements. The Company primarily uses interest rate caps and swaps as part of its interest rate risk management strategy. Interest rate caps designated as cash flow hedges involve the receipt of variable-rate amounts from a counterparty if interest rates rise above the strike rate on the contract in exchange for an upfront premium. Interest rate swaps designated as cash flow hedges involve the receipt of variable-rate amounts from a counterparty in exchange for the Company making fixed-rate payments over the life of the agreements without exchange of the underlying notional amount.
13
Forest City Enterprises, Inc. and Subsidiaries
Notes to Consolidated Financial Statements
(Unaudited)
The effective portion of changes in the fair value of derivatives designated and qualifying as cash flow hedges is recorded in accumulated OCI and is subsequently reclassified into earnings during the period the hedged forecasted transaction affects earnings. The ineffective portion of the change in fair value is recognized directly in earnings. Ineffectiveness was insignificant during the three and nine months ended September 30, 2015, and the three months ended September 30, 2014. During the nine months ended September 30, 2014, the Company recorded $3,667,000 as an increase to interest expense primarily related to ineffectiveness from a missed forecasted transaction arising from the early reclassification of accumulated OCI related to debt associated with an entity that was disposed of during the nine months ended September 30, 2014. As of September 30, 2015, the Company expects it will reclassify amounts recorded in accumulated OCI into earnings as an increase in interest expense of approximately $24,512,000, net of tax, within the next twelve months. However, the actual amount reclassified could vary due to future changes in the fair value of these derivatives.
Fair Value Hedges of Interest Rate Risk
The Company enters into total rate of return swaps (“TROR”) on various tax-exempt fixed-rate borrowings. The TROR convert borrowings from a fixed rate to a variable rate. In exchange for a fixed rate, the TROR requires the payment of a variable interest rate, generally equivalent to the Securities Industry and Financial Markets Association (“SIFMA”) rate (0.02% at September 30, 2015) plus a spread. Additionally, the Company has guaranteed the fair value of the underlying borrowings. Fluctuation in the value of the TROR is offset by the fluctuation in the value of the underlying borrowings, resulting in minimal financial impact. At September 30, 2015, the aggregate notional amount of TROR designated as fair value hedging instruments is $471,985,000. The underlying TROR borrowings are subject to a fair value adjustment.
Nondesignated Hedges of Interest Rate Risk
The Company uses derivative contracts to hedge certain interest rate risk, even though the contracts do not qualify for, or the Company has elected not to apply, hedge accounting. In these situations, the derivative is recorded at its fair value with changes reflected in earnings.
In instances where the Company enters into separate derivative instruments effectively hedging the same debt for consecutive annual periods, the duplicate amount of notional is excluded from the following disclosure in an effort to provide information that enables the financial statement user to understand the Company’s volume of derivative activity.
The following table summarizes the fair values and location in the Consolidated Balance Sheets of all derivative instruments:
Fair Value of Derivative Instruments | |||||||||||||
September 30, 2015 | |||||||||||||
Asset Derivatives (included in Other Assets) | Liability Derivatives (included in Accounts Payable, Accrued Expenses and Other Liabilities) | ||||||||||||
Current Notional | Fair Value | Current Notional | Fair Value | ||||||||||
(in thousands) | |||||||||||||
Derivatives Designated as Hedging Instruments | |||||||||||||
Interest rate caps | $ | 330,000 | $ | — | $ | — | $ | — | |||||
Interest rate swaps | — | — | 734,497 | 61,096 | |||||||||
TROR | 149,200 | 7,977 | 322,785 | 10,282 | |||||||||
Total | $ | 479,200 | $ | 7,977 | $ | 1,057,282 | $ | 71,378 | |||||
Derivatives Not Designated as Hedging Instruments | |||||||||||||
Interest rate caps | $ | 316,396 | $ | — | $ | — | $ | — | |||||
TROR | 101,190 | 5,435 | 38,356 | 14,200 | |||||||||
Total | $ | 417,586 | $ | 5,435 | $ | 38,356 | $ | 14,200 | |||||
December 31, 2014 | |||||||||||||
Derivatives Designated as Hedging Instruments | |||||||||||||
Interest rate caps | $ | 330,000 | $ | 114 | $ | — | $ | — | |||||
Interest rate swaps | — | — | 869,154 | 75,281 | |||||||||
TROR | 149,200 | 6,379 | 217,785 | 11,983 | |||||||||
Total | $ | 479,200 | $ | 6,493 | $ | 1,086,939 | $ | 87,264 | |||||
Derivatives Not Designated as Hedging Instruments | |||||||||||||
Interest rate caps | $ | 205,522 | $ | 12 | $ | — | $ | — | |||||
TROR | 101,410 | 1,857 | 38,425 | 15,098 | |||||||||
Total | $ | 306,932 | $ | 1,869 | $ | 38,425 | $ | 15,098 | |||||
14
Forest City Enterprises, Inc. and Subsidiaries
Notes to Consolidated Financial Statements
(Unaudited)
The following table summarizes the impact of gains and losses related to derivative instruments designated as cash flow hedges included in the accumulated OCI section of the Consolidated Balance Sheets and in equity in earnings (loss) and interest expense in the Consolidated Statements of Operations:
Loss Reclassified from Accumulated OCI | |||||||||||
Derivatives Designated as Cash Flow Hedging Instruments | Gain (Loss) Recognized in OCI (Effective Portion) | Location on Consolidated Statements of Operations | Effective Amount | Ineffective Amount | |||||||
(in thousands) | |||||||||||
Three Months Ended September 30, 2015 | |||||||||||
Interest rate caps and interest rate swaps | $ | (7,854 | ) | Interest expense | $ | (9,759 | ) | $ | (16 | ) | |
Net gain on change in control of interests | — | — | |||||||||
Earnings (loss) from unconsolidated entities, gross of tax | (885 | ) | — | ||||||||
Total | $ | (7,854 | ) | $ | (10,644 | ) | $ | (16 | ) | ||
Nine Months Ended September 30, 2015 | |||||||||||
Interest rate caps and interest rate swaps | $ | (15,557 | ) | Interest expense | $ | (28,060 | ) | $ | (27 | ) | |
Net gain on change in control of interests | 900 | — | |||||||||
Earnings (loss) from unconsolidated entities, gross of tax | (2,851 | ) | (1 | ) | |||||||
Total | $ | (15,557 | ) | $ | (30,011 | ) | $ | (28 | ) | ||
Three Months Ended September 30, 2014 | |||||||||||
Interest rate caps and interest rate swaps | $ | 1,288 | Interest expense | $ | (9,561 | ) | $ | (1 | ) | ||
Earnings (loss) from unconsolidated entities, gross of tax | (1,002 | ) | — | ||||||||
Total | $ | 1,288 | $ | (10,563 | ) | $ | (1 | ) | |||
Nine Months Ended September 30, 2014 | |||||||||||
Interest rate caps and interest rate swaps | $ | (10,166 | ) | Interest expense | $ | (28,412 | ) | $ | (1 | ) | |
Discontinued operations | — | (3,666 | ) | ||||||||
Earnings (loss) from unconsolidated entities, gross of tax | (3,005 | ) | — | ||||||||
Total | $ | (10,166 | ) | $ | (31,417 | ) | $ | (3,667 | ) | ||
The following table summarizes the impact of gains and losses related to derivative instruments not designated as cash flow hedges in the Consolidated Statements of Operations:
Net Gain (Loss) Recognized | |||||||||||||
Three Months Ended September 30, | Nine Months Ended September 30, | ||||||||||||
2015 | 2014 | 2015 | 2014 | ||||||||||
(in thousands) | |||||||||||||
Derivatives Designated as Fair Value Hedging Instruments | |||||||||||||
TROR (1) | $ | 848 | $ | 68 | $ | 3,299 | $ | 2,279 | |||||
Derivatives Not Designated as Hedging Instruments | |||||||||||||
Interest rate caps and interest rate swap | $ | (180 | ) | $ | 62 | $ | (195 | ) | $ | (41 | ) | ||
TROR | (1,143 | ) | (42 | ) | 4,476 | 633 | |||||||
Total | $ | (1,323 | ) | $ | 20 | $ | 4,281 | $ | 592 | ||||
(1) | The net gain (loss) recognized in interest expense from the change in fair value of the underlying TROR borrowings was $(848) and $(3,299) for the three and nine months ended September 30, 2015, respectively, and $(68) and $(2,279) for the three and nine months ended September 30, 2014, respectively, offsetting the gain (loss) recognized on the TROR. |
15
Forest City Enterprises, Inc. and Subsidiaries
Notes to Consolidated Financial Statements
(Unaudited)
Credit-risk-related Contingent Features
The principal credit risk of the Company’s interest rate risk management strategy is the potential inability of a counterparty to cover its obligations. If a counterparty fails to fulfill its obligation, the risk of loss approximates the fair value of the derivative. To mitigate this exposure, the Company generally purchases derivative financial instruments from the financial institution that issues the related debt, from financial institutions with which the Company has other lending relationships, or from financial institutions with a minimum credit rating of AA at the time of the transaction.
Agreements with derivative counterparties contain provisions under which the counterparty could terminate the derivative obligations if the Company defaults on its obligations under the Credit Facility and designated conditions are fulfilled. In instances where the Company’s subsidiaries have derivative obligations secured by a mortgage, the derivative obligations could be terminated if the indebtedness between the two parties is terminated, either by loan payoff or default of the indebtedness. In addition, certain subsidiaries have agreements containing provisions whereby the subsidiaries must maintain certain minimum financial ratios. As of September 30, 2015, the Company does not have any derivative contracts containing credit-risk related contingent features, such as a credit rating downgrade, that may trigger collateral to be posted with a counterparty.
The following table summarizes information about collateral posted for derivatives in liability positions as of September 30, 2015:
Collateral Information | ||||||||||||||
Notional Amount | Fair Value Prior to Nonperformance Risk | Nonperformance Risk | Collateral Posted | Nature of Collateral | Credit Risk Contingent Feature | |||||||||
(in thousands) | ||||||||||||||
Property Specific Swaps | $ | 734,497 | $ | 63,553 | $ | (2,457 | ) | $ | — | Mortgage liens | None | |||
TROR | 361,141 | 24,426 | 56 | 50,569 | Restricted cash, notes receivable, letters of credit | None | ||||||||
Total | $ | 1,095,638 | $ | 87,979 | $ | (2,401 | ) | $ | 50,569 | |||||
F. Fair Value Measurements
Fair Value Measurements on a Recurring Basis
The Company’s financial assets consist of interest rate caps, interest rate swaps and TROR with positive fair values included in other assets. The Company’s financial liabilities consist of interest rate swaps and TROR with negative fair values included in accounts payable, accrued expenses and other liabilities and borrowings subject to TROR included in mortgage debt and notes payable, nonrecourse.
For all periods presented, the Company recorded the redeemable noncontrolling interest related to Brooklyn Arena, LLC at historical cost since its initial cost adjusted for contributions, distributions and the allocation of profits or losses, is greater than the estimated redemption value, which approximates fair value. In the event the redemption value of the redeemable noncontrolling interest exceeds historical cost, the Company would be required to record the redeemable noncontrolling interest at redemption value, with a corresponding adjustment to additional paid-in capital.
16
Forest City Enterprises, Inc. and Subsidiaries
Notes to Consolidated Financial Statements
(Unaudited)
The following table summarizes information about financial assets and liabilities and redeemable noncontrolling interest measured at fair value on a recurring basis (if applicable), and indicates the fair value hierarchy of the valuation techniques utilized to determine such fair value:
September 30, 2015 | ||||||||||||
Level 1 | Level 2 | Level 3 | Total | |||||||||
(in thousands) | ||||||||||||
Interest rate swaps (liabilities) | $ | — | $ | (2,873 | ) | $ | (58,223 | ) | $ | (61,096 | ) | |
TROR (assets) | — | — | 13,412 | 13,412 | ||||||||
TROR (liabilities) | — | — | (24,482 | ) | (24,482 | ) | ||||||
Fair value adjustment to the borrowings subject to TROR | — | — | 2,305 | 2,305 | ||||||||
Redeemable noncontrolling interest (1) | — | — | (168,226 | ) | (168,226 | ) | ||||||
Total | $ | — | $ | (2,873 | ) | $ | (235,214 | ) | $ | (238,087 | ) | |
December 31, 2014 | ||||||||||||
(in thousands) | ||||||||||||
Interest rate caps (assets) | $ | — | $ | 126 | $ | — | $ | 126 | ||||
Interest rate swaps (liabilities) | — | (1,745 | ) | (73,536 | ) | (75,281 | ) | |||||
TROR (assets) | — | — | 8,236 | 8,236 | ||||||||
TROR (liabilities) | — | — | (27,081 | ) | (27,081 | ) | ||||||
Fair value adjustment to the borrowings subject to TROR | — | — | 5,604 | 5,604 | ||||||||
Redeemable noncontrolling interest (1) | — | — | (183,038 | ) | (183,038 | ) | ||||||
Total | $ | — | $ | (1,619 | ) | $ | (269,815 | ) | $ | (271,434 | ) | |
(1) | Redeemable noncontrolling interest is recorded at historical cost as of the period presented. |
The following table presents a reconciliation of financial assets and liabilities and redeemable noncontrolling interest measured at fair value on a recurring basis using significant unobservable inputs (Level 3):
Redeemable Noncontrolling Interest | Interest Rate Swaps | Net TROR | Fair value adjustment to the borrowings subject to TROR | Total TROR Related | Total | ||||||||||||||||
(in thousands) | |||||||||||||||||||||
Nine Months Ended September 30, 2015 | |||||||||||||||||||||
Balance, January 1, 2015 (1) | $ | (183,038 | ) | $ | (73,536 | ) | $ | (18,845 | ) | $ | 5,604 | $ | (13,241 | ) | $ | (269,815 | ) | ||||
Loss attributable to redeemable noncontrolling interest | 14,812 | — | — | — | — | 14,812 | |||||||||||||||
Total realized and unrealized gains (losses): | |||||||||||||||||||||
Included in earnings | — | — | 7,775 | (3,299 | ) | 4,476 | 4,476 | ||||||||||||||
Included in other comprehensive income | — | 15,313 | — | — | — | 15,313 | |||||||||||||||
Balance, September 30, 2015 (1) | $ | (168,226 | ) | $ | (58,223 | ) | $ | (11,070 | ) | $ | 2,305 | $ | (8,765 | ) | $ | (235,214 | ) | ||||
Nine Months Ended September 30, 2014 | |||||||||||||||||||||
Balance, January 1, 2014 | $ | (171,743 | ) | $ | (97,360 | ) | $ | (24,346 | ) | $ | 8,869 | $ | (15,477 | ) | $ | (284,580 | ) | ||||
Loss attributable to redeemable noncontrolling interest | 13,299 | — | — | — | — | 13,299 | |||||||||||||||
Total realized and unrealized gains (losses): | |||||||||||||||||||||
Included in earnings | — | — | 2,912 | (2,279 | ) | 633 | 633 | ||||||||||||||
Included in other comprehensive income | — | 19,067 | — | — | — | 19,067 | |||||||||||||||
Included in additional paid-in capital | (28,390 | ) | — | — | — | — | (28,390 | ) | |||||||||||||
Balance, September 30, 2014 (1) | $ | (186,834 | ) | $ | (78,293 | ) | $ | (21,434 | ) | $ | 6,590 | $ | (14,844 | ) | $ | (279,971 | ) | ||||
(1) | Redeemable noncontrolling interest is recorded at historical cost as of the period presented. |
17
Forest City Enterprises, Inc. and Subsidiaries
Notes to Consolidated Financial Statements
(Unaudited)
The following table presents quantitative information about the significant unobservable inputs used to estimate the fair value of financial instruments measured on a recurring basis as of September 30, 2015:
Quantitative Information about Level 3 Fair Value Measurements | ||||||
Fair Value September 30, 2015 | Valuation Technique | Unobservable Input | Input Values | |||
(in thousands) | ||||||
Credit valuation adjustment of interest rate swap | $ | 2,276 | Potential future exposure | Credit spread | 4.00% | |
TROR | $ | (11,070 | ) | Third party bond pricing | Bond valuation | 79.59 - 115.87 |
Fair value adjustment to the borrowings subject to TROR | $ | 2,305 | Third party bond pricing | Bond valuation | 79.59 - 115.87 | |
Third party service providers involved in fair value measurements are evaluated for competency and qualifications. Fair value measurements, including unobservable inputs, are evaluated based on current transactions and experience in the real estate and capital markets.
The impact of changes in unobservable inputs used to determine the fair market value of the credit valuation adjustment, TROR and fair value adjustment to the borrowings subject to TROR are not deemed to be significant.
Fair Value of Other Financial Instruments
The carrying amount of notes and accounts receivable, excluding the Stapleton advances, and accounts payable, accrued expenses and other liabilities approximates fair value based upon the short-term nature of the instruments or the prevailing interest rate if long-term. The carrying amount of the Stapleton advances approximates fair value since the interest rates on these advances approximates current market rates. The Company estimates the fair value of its debt instruments by discounting future cash payments at interest rates the Company believes approximate the current market. Estimated fair value is based upon market prices of public debt, available industry financing data, current treasury rates, recent financing transactions, conversion features on convertible senior debt and loan to value ratios. The fair value of the Company’s debt instruments is classified as Level 3 in the fair value hierarchy.
The following table summarizes the fair value of nonrecourse mortgage debt and notes payable (exclusive of the fair value of derivatives), revolving credit facility and convertible senior debt:
September 30, 2015 | December 31, 2014 | ||||||||||||
Carrying Value | Fair Value | Carrying Value | Fair Value | ||||||||||
(in thousands) | |||||||||||||
Fixed Rate Debt | $ | 2,747,031 | $ | 3,062,517 | $ | 2,993,591 | $ | 3,421,373 | |||||
Variable Rate Debt | 2,026,387 | 2,015,261 | 1,944,610 | 1,924,823 | |||||||||
Total | $ | 4,773,418 | $ | 5,077,778 | $ | 4,938,201 | $ | 5,346,196 | |||||
G. Capital Stock
In May 2015, the Company issued 37,375,000 shares of its Class A common stock in an underwritten public offering at a price of $22.50 per share, which included the underwriters’ exercise of their over-allotment option in full. The offering generated net proceeds of $806,500,000 after deducting underwriting discounts, commissions and other offering expenses. The Company used $386,156,000 of the net proceeds to finance the June 2015 acquisition of the Company’s partner’s 49% equity interest in seven life science office properties and two parking facilities at University Park at MIT, a mixed-use life science office campus in Cambridge, Massachusetts. Subsequent to the acquisition, the Company owns 100% of these assets. The Company used substantially all of the remaining net proceeds to retire a combination of nonrecourse mortgage debt and revolving credit facility borrowings.
During the three and nine months ended September 30, 2015, the Company issued shares of Class A common stock in connection with the separate, privately negotiated exchange transactions involving a portion of the Company’s 2016, 2018 and 2020 Senior Notes. See Note D – Convertible Senior Debt for detailed information on these Class A common stock issuances, as well as the receipt of shares of Class A common stock in connection with the termination of a convertible note hedge related to the 2016 Senior Notes.
In addition, during the three months ended September 30, 2015, the Company issued shares of Class A common stock to certain BCR entities in exchange of Class A Common Units pursuant to the Master Contribution Agreement. See the “Related Party Transactions” section of Note A – Accounting Policies for detailed information on this transaction.
18
Forest City Enterprises, Inc. and Subsidiaries
Notes to Consolidated Financial Statements
(Unaudited)
H. Stock-Based Compensation
During the nine months ended September 30, 2015, the Company granted 28,240 stock options, 826,718 shares of restricted stock and 627,385 performance shares under the Company’s 1994 Stock Plan. The stock options had a grant-date fair value of $7.79, which was computed using the Black-Scholes option-pricing model using the following assumptions: expected term of 5.5 years, expected volatility of 30.8%, risk-free interest rate of 1.71%, and expected dividend yield of 0%. The exercise price of the options is $24.62, the closing price of the underlying Class A common stock on the date of grant. The restricted stock had a grant-date fair value of $24.62 per share, the closing price of the Class A common stock on the date of grant. The performance shares had a weighted-average grant-date fair value of $32.14 per share, which was computed using Monte Carlo simulations.
At September 30, 2015, $1,734,000 of unrecognized compensation cost related to stock options is expected to be recognized over a weighted-average period of 23 months, $23,600,000 of unrecognized compensation cost related to restricted stock is expected to be recognized over a weighted-average period of 27 months, and $18,573,000 of unrecognized compensation cost related to performance shares is expected to be recognized over a weighted-average period of 26 months.
The following table summarizes stock-based compensation costs and related deferred income tax benefit recognized in the financial statements:
Three Months Ended September 30, | Nine Months Ended September 30, | ||||||||||||
2015 | 2014 | 2015 | 2014 | ||||||||||
(in thousands) | |||||||||||||
Stock option costs | $ | 320 | $ | 698 | $ | 985 | $ | 2,677 | |||||
Restricted stock costs | 3,349 | 2,833 | 11,950 | 9,136 | |||||||||
Performance share costs | 3,541 | 1,087 | 8,601 | 3,027 | |||||||||
Total stock-based compensation costs | 7,210 | 4,618 | 21,536 | 14,840 | |||||||||
Less amount capitalized into qualifying real estate projects | (1,883 | ) | (1,490 | ) | (4,967 | ) | (4,110 | ) | |||||
Amount charged to operating expenses | 5,327 | 3,128 | 16,569 | 10,730 | |||||||||
Depreciation expense on capitalized stock-based compensation | 227 | 139 | 679 | 586 | |||||||||
Total stock-based compensation expense | $ | 5,554 | $ | 3,267 | $ | 17,248 | $ | 11,316 | |||||
Deferred income tax benefit | $ | 2,131 | $ | 1,214 | $ | 6,642 | $ | 4,235 | |||||
The amount of grant-date fair value expensed immediately for awards granted to retirement-eligible grantees during the nine months ended September 30, 2015 and 2014 was $1,926,000 and $1,358,000, respectively.
In connection with the vesting of restricted stock during the nine months ended September 30, 2015 and 2014, the Company repurchased 216,700 shares and 205,568 shares, respectively, of Class A common stock to satisfy the employees’ related minimum statutory tax withholding requirements. These shares were placed in treasury with an aggregate cost basis of $5,412,000 and $3,800,000, respectively.
I. Write-Offs of Abandoned Development Projects and Demolition Costs
On a quarterly basis, the Company reviews each project under development to determine whether it is probable the project will be developed. If management determines the project will not be developed, its project costs and other related expenses are written off as an abandoned development project cost. The Company abandons projects under development for a number of reasons, including, but not limited to, changes in local market conditions, increases in construction or financing costs or third party challenges related to entitlements or public financing. In addition, costs expensed to demolish existing structures, if any, are included in these amounts. The Company recorded write-offs of abandoned development projects and demolition costs of $0 and $5,778,000 during the three and nine months ended September 30, 2015 and $456,000 and $1,389,000 during the three and nine months ended September 30, 2014, respectively. The Company recorded write-offs of abandoned development projects of unconsolidated entities of $0 and $10,191,000 during the three and nine months ended September 30, 2015, which is included in equity in earnings (loss). There were no write-offs of abandoned development projects of unconsolidated entities during the three and nine months ended September 30, 2014.
19
Forest City Enterprises, Inc. and Subsidiaries
Notes to Consolidated Financial Statements
(Unaudited)
J. Impairment of Real Estate and Impairment of Unconsolidated Entities
Impairment of Real Estate
The Company reviews its real estate for impairment whenever events or changes indicate its carrying value may not be recoverable. In order to determine whether the carrying costs are recoverable from estimated future undiscounted cash flows, the Company uses various assumptions including future estimated net operating income, estimated holding periods, risk of foreclosure and estimated cash proceeds upon the disposition of the asset. If the carrying costs are not recoverable, the Company records an impairment charge to reduce the carrying value to estimated fair value. The assumptions used to estimate fair value are Level 2 or 3 inputs. The Company’s assumptions are based on current information. If the conditions deteriorate or if the Company’s plans regarding its assets change, additional impairment charges may occur in future periods.
The impairments recorded during the periods presented represent write-downs to estimated fair value due to a change in events, such as a change in strategy for certain assets, bona fide third-party purchase offers or changes in certain assumptions, including estimated holding periods and current market conditions and the impact of these assumptions to the properties’ estimated future cash flows.
The following table summarizes the Company’s impairment of real estate included in continuing operations:
Three Months Ended September 30, | Nine Months Ended September 30, | ||||||||||||
2015 | 2014 | 2015 | 2014 | ||||||||||
(in thousands) | |||||||||||||
Westchester's Ridge Hill (Regional Mall) | Yonkers, New York | $ | 372,587 | $ | — | $ | 372,587 | $ | — | ||||
Avenue at Tower City Center (Specialty Retail Center) | Cleveland, Ohio | — | — | — | 72,473 | ||||||||
Office Buildings: | |||||||||||||
Illinois Science and Technology Park | Skokie, Illinois | 26,246 | — | 26,246 | — | ||||||||
Terminal Tower | Cleveland, Ohio | — | — | — | 42,208 | ||||||||
Post Office Plaza | Cleveland, Ohio | — | — | — | 14,378 | ||||||||
Land inventory | Las Vegas, Nevada | 16,307 | — | 16,307 | — | ||||||||
Other | 10,323 | 966 | 10,323 | 1,736 | |||||||||
Total | $ | 425,463 | $ | 966 | $ | 425,463 | $ | 130,795 | |||||
During the three months ended September 30, 2015, the Company decided to pursue the partial sale, through a joint venture, of three of its consolidated regional malls, including Westchester's Ridge Hill. At September 30, 2015, discussions with a potential joint venture partner are ongoing and remain subject to further negotiation and applicable due diligence periods. The advanced status of the discussions triggered management to update its undiscounted cash flow analysis including its probability weighted estimated holding period of each asset. In each case the Company increased the likelihood of a near-term partial sale to a 70% probability at an estimated selling price equal to that indicated by the potential joint venture partner. The Company assigned a 30% probability that each of these assets would be held long-term. As a result, the updated estimated probability weighted undiscounted cash flows exceeded the carrying value of two of the malls but no longer exceeded the carrying value of Westchester’s Ridge Hill, requiring the Company to adjust the carrying value to its estimated fair value. The Company had been considering strategies to recapitalize Westchester’s Ridge Hill in the past but had not formally marketed or entered into advanced discussions until the three months ended September 30, 2015. The previous undiscounted cash flow analysis assigned a 10% probability of near-term sale. In order to adjust the carrying value of Westchester’s Ridge Hill to its estimated fair value, the Company recorded an impairment charge of $372,587,000 during the three months ended September 30, 2015.
The Company continues to execute its strategy of focusing on core products located in core markets. In executing this strategy, the Company had been marketing for sale all operating assets at Illinois Science & Technology Park in Skokie, Illinois. During 2015, the Company had several interested parties in the assets at pricing that approximated the carrying value of the assets. During the three months ended September 30, 2015, the high bidder withdrew their offer and certain market conditions, including the loss of possible redevelopment incentives, negatively impacted the pricing from other interested parties. At September 30, 2015, discussions with a potential purchaser are ongoing and remain subject to further negotiation. Based on these factors, the Company increased the likelihood of a near-term sale and reduced the pricing in such scenario in its estimated probability weighted undiscounted cash flows. As a result, these estimated undiscounted cash flows no longer exceeds the carrying value of the assets, requiring the Company to adjust the carrying value to its estimated fair value. As such, the Company recorded an impairment charge of $26,246,000 during the three months ended September 30, 2015.
20
Forest City Enterprises, Inc. and Subsidiaries
Notes to Consolidated Financial Statements
(Unaudited)
The Company currently owns 13.5 acres of land located in Las Vegas, Nevada, which is included in land inventory on its consolidated balance sheet. The Company has been marketing the land for sale for over twelve months without closing a sale of any of the parcels. During the three months ended September 30, 2015, it became evident the expected sale price was less than originally estimated and lower than carrying value. The Company has a letter of intent for a portion of the land and continues to market the remaining parcels. Using the letter of intent pricing, in addition to other information gathered from other market participants, including verbal bids, the Company adjusted its estimated selling price, less cost to sell, of this land, which was less than its carrying value. As such, the Company recorded an impairment charge of $16,307,000 during the three months ended September 30, 2015.
The Company began negotiations for the sale of several operating assets in Cleveland, Ohio during the three months ended June 30, 2014. At June 30, 2014, discussions with a potential purchaser were at various stages for each of the assets and remained subject to further negotiation and applicable due diligence periods. Based on the advanced status of the discussions, the Company reviewed and adjusted the estimated holding periods of each applicable asset and in each case increased the likelihood of a near term sale. As a result, the estimated probability weighted undiscounted cash flows no longer exceed the carrying value of certain assets, requiring the Company to adjust the carrying value of those assets as described in the above table, to their estimated fair value. During the three months ended September 30, 2014, the negotiations with the potential buyer ceased, as mutually agreeable terms could not be reached.
Impairment of Real Estate - Fair Value Information
The following table presents quantitative information about the significant unobservable inputs used to determine the fair value of the impairment of real estate for the nine months ended September 30, 2015 and 2014:
Quantitative Information about Level 3 Fair Value Measurements | ||||||
Fair Value | Valuation Technique | Unobservable Input | Range of Input Values | |||
(in thousands) | ||||||
September 30, 2015 | ||||||
Impairment of real estate | $ | 630,797 | Indicative bids | Indicative bids | N/A (1) | |
Impairment of real estate | $ | 5,128 | Comparable property market analysis | Price per square foot | $18 per square foot | |
September 30, 2014 | ||||||
Impairment of real estate | $ | 44,200 | Discounted cash flows | Market capitalization rate | 8.0% - 10.0% | |
Discount rate | 10.5% - 12.0% | |||||
Impairment of real estate | $ | 38,750 | Indicative bids | Indicative bids | N/A (1) | |
(1) | These fair value measurements were derived from bona fide purchase offers from third party prospective buyers, subject to the Company’s corroboration for reasonableness. |
Impairment of Unconsolidated Entities
The Company reviews its portfolio of unconsolidated entities for other-than-temporary impairments whenever events or changes indicate its carrying value in the investments may be in excess of fair value. An equity method investment’s value is impaired if management’s estimate of its fair value is less than the carrying value and the difference is deemed to be other-than-temporary. In estimating fair value, assumptions that may be used include comparable sale prices, market discount rates, market capitalization rates and estimated future discounted cash flows specific to the geographic region and property type, all of which are considered Level 3 inputs. For recently opened properties, assumptions also include the timing of initial property lease up. In the event initial property lease up assumptions differ from actual results, estimated future discounted cash flows may vary, resulting in impairment charges in future periods. The Company recorded $1,384,000 of impairments of unconsolidated entities during the three and nine months ended September 30, 2015. There were no impairments of unconsolidated entities recorded during the three and nine months ended September 30, 2014.
K. Net Loss on Disposition of Partial Interest in Development Project
On June 30, 2014, the Company entered into a joint venture with Greenland Atlantic Yards, LLC, a subsidiary of Shanghai-based Greenland Holding Group Company Limited (“Greenland”) to develop Pacific Park Brooklyn, a 22 acre mixed-use project in Brooklyn, New York. Greenland acquired 70% of the joint venture and will share in the total project costs in proportion to their ownership interests. The joint venture intends to co-develop the entire project including the infrastructure and vertical construction of the residential units, excluding Barclays Center arena and the under-construction B2 BKLYN apartment community. For its 70% equity interest, Greenland invested cash and assumed 70% of the nonrecourse mortgage debt on the project. The transaction resulted in net cash proceeds of $208,275,000, net of transaction costs, during the year ended December 31, 2014 and a net loss on disposition of partial interest in development project of $19,590,000 ($16,211,000, net of noncontrolling interests) during the nine months ended September 30, 2014. Upon closing, the Company determined it was not the primary beneficiary of the joint venture. As a result, the Company deconsolidated the Pacific Park Brooklyn development project and accounts for the joint venture on the equity method of accounting.
21
Forest City Enterprises, Inc. and Subsidiaries
Notes to Consolidated Financial Statements
(Unaudited)
L. Net Gain (Loss) on Disposition of Full or Partial Interest in Rental Properties
The following table summarizes the net gain (loss) on disposition of full or partial interest in rental properties:
Three Months Ended September 30, | Nine Months Ended September 30, | |||||||||||||
2015 | 2014 | 2015 | 2014 | |||||||||||
(in thousands) | ||||||||||||||
Office Buildings: | ||||||||||||||
Skylight Office Tower | Cleveland, Ohio | $ | 1,746 | $ | — | $ | 1,746 | $ | — | |||||
Stapleton - 3055 Roslyn | Denver, Colorado | — | (146 | ) | — | (146 | ) | |||||||
Other | — | — | — | (467 | ) | |||||||||
$ | 1,746 | $ | (146 | ) | $ | 1,746 | $ | (613 | ) | |||||
Effective April 1, 2014, the Company adopted the new accounting guidance for reporting discontinued operations. As a result, the dispositions summarized above did not qualify for discontinued operations. The gain (loss) on the dispositions is included in net gain (loss) on disposition of full or partial interest in rental properties.
M. Net Gain on Change in Control of Interests
The following table summarizes the net gain on change in control of interests:
Three Months Ended September 30, | Nine Months Ended September 30, | |||||||||||||
2015 | 2014 | 2015 | 2014 | |||||||||||
(in thousands) | ||||||||||||||
University Park at MIT | Cambridge, Massachusetts | $ | — | $ | — | $ | 463,643 | $ | — | |||||
Apartment Communities: | ||||||||||||||
Cherry Tree | Strongsville, Ohio | — | — | 7,391 | — | |||||||||
Chestnut Lake | Strongsville, Ohio | — | — | 8,525 | — | |||||||||
Stratford Crossing | Wadsworth, Ohio | — | — | 8,125 | — | |||||||||
Other | — | — | — | 2,759 | ||||||||||
Total | $ | — | $ | — | $ | 487,684 | $ | 2,759 | ||||||
Apartment Communities
In April 2015, the Company acquired its partner’s 50% equity ownership interest in three operating apartment communities (Cherry Tree, Chestnut Lake and Stratford Crossing) in exchange for the Company’s 50% equity ownership in five operating apartment communities (Arbor Glen, Eaton Ridge, Newport Landing, Parkwood Village and Sutton Landing) in a non-cash transaction. Subsequent to the transaction, the Company owns 100% of the three retained operating apartment communities. See Note P – Net Gain on Disposition of Interest in Unconsolidated Entities for detailed information on the net gain on disposition of interest in unconsolidated entities related to the five operating apartment communities exchanged.
University Park at MIT
In June 2015, the Company completed the share purchase and redemption agreement with its partner to acquire the partner’s 49% equity ownership interest in seven life science office properties and two parking facilities at University Park at MIT, a mixed-use life science office campus in Cambridge, Massachusetts (“MIT Assets”). The Company used $386,156,000 of the net proceeds from the May 2015 equity offering to finance this acquisition. See Note G – Capital Stock for information on the equity offering.
Prior to the acquisition, the Company owned 51% and had accounted for the MIT Assets using the equity method of accounting. Subsequent to the transaction, the Company owns 100% of the MIT Assets and has concluded it appropriate to consolidate the assets. As a result, the Company remeasured its equity interests, as required by the accounting guidance, at fair value (based upon the income approach using current rents and market cap rates and discount rates) and recorded a net gain on change in control of interests as noted above.
22
Forest City Enterprises, Inc. and Subsidiaries
Notes to Consolidated Financial Statements
(Unaudited)
The fair value of the acquisition was allocated as follows. All amounts are presented in thousands.
Real Estate, net | $ | 1,121,786 | |
Restricted cash | 17,235 | ||
Notes and accounts receivable, net | 1,801 | ||
Other assets (1) | 103,804 | ||
1,244,626 | |||
Mortgage debt and notes payable, nonrecourse | (363,147 | ) | |
Accounts payable, accrued expenses and other liabilities (2) | (94,214 | ) | |
Net Assets Acquired | $ | 787,265 | |
Net gain on change in control of interests | $ | 463,643 | |
Carrying value of previously held equity interests | (62,534 | ) | |
Fair value of previously held equity interests (3) | 401,109 | ||
Cash paid | 386,156 | ||
Total | $ | 787,265 | |
(1) | Primarily consists of $78,000 of in-place leases and $20,000 of below-market ground leases with weighted-average lives at the time of acquisition of 3.6 years and 60 years, respectively. |
(2) | Primarily consists of $49,000 of below-market tenant leases and $24,000 of above-market ground leases with weighted-average lives at the time of acquisition of 3.6 years and 58 years, respectively. |
(3) | The significant assumptions used to value the previously held equity interests in the MIT Assets were determined to be Level 3 inputs. The weighted-average discount rate applied to cash flows and the weighted-average terminal capitalization rate were 7.0% and 6.0%, respectively. |
Pro Forma Information
The following unaudited supplemental pro forma operating data is presented for the nine months ended September 30, 2015 and 2014, as if the step acquisition related to the MIT Assets was effective January 1, 2014. The gain on change in control of interests related to this acquisition was adjusted to the assumed acquisition date. The unaudited supplemental pro forma operating data is not necessarily indicative of what the Company’s actual results of operations would have been assuming the transactions had been effective as set forth above, nor do they purport to represent the Company’s results of operations for future periods. The qualitative and quantitative effect to the pro forma operating data related to the remaining acquisitions described in the table above was not material.
Pro Forma Adjustments | ||||||||||||
Nine Months Ended September 30, 2015 | Remove: Net Gain on Change in Control of Interests (1) | Other Pro Forma Adjustments (2) | Pro Forma Nine Months Ended September 30, 2015 | |||||||||
(in thousands, except share and per share data) | ||||||||||||
Revenues | $ | 785,898 | $ | — | $ | 43,742 | $ | 829,640 | ||||
Loss from continuing operations | $ | (57,038 | ) | $ | (283,828 | ) | $ | (15,211 | ) | $ | (356,077 | ) |
Net loss attributable to common shareholders | $ | (52,672 | ) | $ | (283,828 | ) | $ | (15,211 | ) | $ | (351,711 | ) |
Weighted average shares outstanding - Basic | 230,778,223 | 230,778,223 | ||||||||||
Net loss attributable to common shareholders - Basic | $ | (0.23 | ) | $ | (1.52 | ) | ||||||
Weighted average shares outstanding - Diluted | 230,778,223 | 230,778,223 | ||||||||||
Net loss attributable to common shareholders - Diluted | $ | (0.23 | ) | $ | (1.52 | ) | ||||||
23
Forest City Enterprises, Inc. and Subsidiaries
Notes to Consolidated Financial Statements
(Unaudited)
Pro Forma Adjustments | ||||||||||||
Nine Months Ended September 30, 2014 | Add: Net Gain on Change in Control of Interests (1) | Other Pro Forma Adjustments (2) | Pro Forma Nine Months Ended September 30, 2014 | |||||||||
(in thousands, except share and per share data) | ||||||||||||
Revenues | $ | 713,917 | $ | — | $ | 67,482 | $ | 781,399 | ||||
Earnings (loss) from continuing operations | $ | (100,526 | ) | $ | 283,828 | $ | (26,153 | ) | $ | 157,149 | ||
Net earnings (loss) attributable to common shareholders | $ | (76,786 | ) | $ | 283,828 | $ | (26,153 | ) | $ | 180,889 | ||
Weighted average shares outstanding - Basic | 198,328,900 | 198,328,900 | ||||||||||
Net earnings (loss) attributable to common shareholders - Basic | $ | (0.39 | ) | $ | 0.89 | |||||||
Weighted average shares outstanding - Diluted | 198,328,900 | 231,151,937 | ||||||||||
Net earnings (loss) attributable to common shareholders - Diluted | $ | (0.39 | ) | $ | 0.82 | |||||||
(1) | Gain on change in control of interests of $463,643, net of tax of $179,815. |
(2) | Represents additional depreciation and amortization expense related to the increased basis of real estate and intangible assets, plus pro forma earnings of the 100% ownership interests, less actual equity in earnings related to the Company’s 51% prior ownership for the periods presented. |
N. Loss on Extinguishment of Debt
For the three and nine months ended September 30, 2015, the Company recorded $23,609,000 and $61,953,000, respectively, as loss on extinguishment of debt. For the three and nine months ended September 30, 2014, the Company recorded $49,000 and $927,000, respectively, as loss on extinguishment of debt. The loss on extinguishment of debt recorded for 2015 primarily relates to the February, March and July 2015 separate, privately negotiated exchange transactions involving a portion of the Company’s 2016, 2018 and 2020 Senior Notes. See Note D – Convertible Senior Debt for detailed information on the non-tax deductible loss on extinguishment of debt.
O. Income Taxes
Income tax expense (benefit) was $(179,646,000) and $(365,000) for the three months ended September 30, 2015 and 2014, respectively, and $3,399,000 and $(43,381,000) for the nine months ended September 30, 2015 and 2014, respectively. The difference in recorded income tax expense/benefit versus income tax expense/benefit computed at the statutory federal income tax rate is primarily attributable to state income taxes, changes in state net operating losses, additional general business credits, changes to valuation allowances associated with certain deferred tax assets, and various permanent differences between pre-tax GAAP income and taxable income. The most significant permanent difference during the three and nine months ended September 30, 2015 was the non-tax deductible inducement payments recorded as a loss on extinguishment of debt in connection with the separate, privately negotiated exchanges of a portion of the Company’s Senior Notes.
At December 31, 2014, the Company had a federal net operating loss carryforward for tax purposes of $307,200,000 expiring in the years ending December 31, 2029 through 2034, a charitable contribution deduction carryforward of $16,234,000 expiring in the years ending December 31, 2015 through 2019, general business credit carryovers of $36,779,000 expiring in the years ending December 31, 2018 through 2034, and an alternative minimum tax (“AMT”) credit carryforward of $27,452,000 that is available until used to reduce federal tax to the AMT amount.
If the Company converts to REIT status, it is anticipated that certain subsidiaries may be treated as taxable REIT subsidiaries and would continue to be subject to corporate income taxes. In addition, the Company could be subject to corporate income taxes related to assets sold during the 10-year period following the date of conversion, to the extent such assets had a built-in gain on the date of conversion. This gain can be offset by any remaining federal net operating loss carryforwards. Furthermore, if the Company chooses to dispose of any assets after the REIT conversion within the specified period, the Company will attempt to utilize various tax planning strategies, including Internal Revenue Code Section 1031 like-kind exchanges, to mitigate the exposure to the built-in gains tax.
24
Forest City Enterprises, Inc. and Subsidiaries
Notes to Consolidated Financial Statements
(Unaudited)
P. Net Gain on Disposition of Interest in Unconsolidated Entities
The following table summarizes the net gain on disposition of interest in unconsolidated entities which are included in equity from unconsolidated entities.
Three Months Ended September 30, | Nine Months Ended September 30, | |||||||||||||
2015 | 2014 | 2015 | 2014 | |||||||||||
(in thousands) | ||||||||||||||
Mall at Stonecrest (Regional Mall) | Atlanta, Georgia | $ | — | $ | 7,952 | $ | — | $ | 7,952 | |||||
Liberty Center (Office Building) | Pittsburgh, Pennsylvania | — | 1,237 | — | 1,237 | |||||||||
Apartment Communities: | ||||||||||||||
Newport Landing | Coventry Township, Ohio | — | — | 5,765 | — | |||||||||
Eaton Ridge | Sagamore Hills, Ohio | — | — | 4,745 | — | |||||||||
Arbor Glen | Twinsburg, Ohio | — | — | 3,422 | — | |||||||||
Parkwood Village | Brunswick, Ohio | — | — | 2,817 | — | |||||||||
Sutton Landing | Brimfield, Ohio | — | — | 2,535 | — | |||||||||
Westwood Reserve | Tampa, Florida | — | — | — | 8,904 | |||||||||
Legacy Crossroads | Cary, North Carolina | — | — | — | 6,216 | |||||||||
Colonial Grand | Tampa, Florida | — | — | — | 4,904 | |||||||||
Legacy Arboretum | Charlotte, North Carolina | — | — | — | 3,257 | |||||||||
Barrington Place | Raleigh, North Carolina | — | — | — | 1,515 | |||||||||
Golden Gate (Specialty Retail Center) | Mayfield Heights, Ohio | — | — | — | 16,440 | |||||||||
Other | 1,009 | — | 1,009 | (350 | ) | |||||||||
$ | 1,009 | $ | 9,189 | $ | 20,293 | $ | 50,075 | |||||||
In April 2015, the Company acquired its partner’s 50% equity ownership interest in three operating apartment communities (Cherry Tree, Chestnut Lake and Stratford Crossing) in exchange for the Company’s 50% equity ownership in five operating apartment communities (Arbor Glen, Eaton Ridge, Newport Landing, Parkwood Village and Sutton Landing) in a non-cash transaction. As a result, the Company recorded gains on disposition of interest in unconsolidated entities as noted above during the nine months ended September 30, 2015. See Note M – Net Gain on Change in Control of Interests for detailed information on the net gain on change in control of interests related to the three retained operating apartment communities.
Q. Discontinued Operations
Effective April 1, 2014, the Company adopted the new accounting guidance for reporting discontinued operations. As a result, fewer rental property disposals qualify to be reported as discontinued operations. There were no rental property dispositions during the three and nine months ended September 30, 2015 that met the requirements for discontinued operations reporting.
The following tables summarize the rental properties included in discontinued operations during the three and nine months ended September 30, 2014:
Property | Location | Square Feet | Period Disposed | Three Months Ended 9/30/14 | Nine Months Ended 9/30/14 |
Commercial Group: | |||||
Promenade Bolingbrook | Bolingbrook, Illinois | 771,000 square feet | Q2-2014 | — | Yes |
Quartermaster Plaza | Philadelphia, Pennsylvania | 456,000 square feet | Q1-2014 | — | Yes |
Mesa del Sol - 5600 University SE | Albuquerque, New Mexico | 87,000 square feet | Q1-2014 | — | Yes |
25
Forest City Enterprises, Inc. and Subsidiaries
Notes to Consolidated Financial Statements
(Unaudited)
Three Months Ended September 30, | Nine Months Ended September 30, | ||||||
2014 | 2014 | ||||||
(in thousands) | |||||||
Revenues | $ | — | $ | 7,034 | |||
Expenses | |||||||
Operating expenses | — | 3,026 | |||||
Depreciation and amortization | — | 987 | |||||
— | 4,013 | ||||||
Gain on disposition of rental properties | — | 28,100 | |||||
Interest expense | — | (5,538 | ) | ||||
Amortization of mortgage procurement costs | — | (41 | ) | ||||
Loss on extinguishment of debt | — | (448 | ) | ||||
Earnings before income taxes | — | 25,094 | |||||
Income tax expense | — | 12,082 | |||||
Earnings from discontinued operations | — | 13,012 | |||||
Noncontrolling interest | |||||||
Gain on disposition of rental properties | — | 58 | |||||
Operating loss from rental properties | — | (8 | ) | ||||
— | 50 | ||||||
Earnings from discontinued operations attributable to Forest City Enterprises, Inc. | $ | — | $ | 12,962 | |||
The following table summarizes the pre-tax gain on disposition of rental properties:
Three Months Ended September 30, | Nine Months Ended September 30, | ||||||
2014 | 2014 | ||||||
(in thousands) | |||||||
Quartermaster Plaza (Specialty Retail Center) | $ | — | $ | 26,373 | |||
Promenade Bolingbrook (Regional Mall) | — | 1,276 | |||||
Mesa del Sol - 5600 University SE (Office Building) | — | 451 | |||||
$ | — | $ | 28,100 | ||||
26
Forest City Enterprises, Inc. and Subsidiaries
Notes to Consolidated Financial Statements
(Unaudited)
R. Earnings Per Share
The Company’s restricted stock is considered a participating security pursuant to the two-class method for computing earnings per share (“EPS”). The Class A Common Units (“Units”), which are reflected as noncontrolling interests in the Consolidated Balance Sheets, are considered convertible participating securities as they are entitled to participate in any dividends paid to the Company’s common shareholders. The Units are included in the computation of basic EPS using the two-class method. The Class A common stock issuable in connection with conversion of the 2016 Senior Notes, 2018 Senior Notes and 2020 Senior Notes is included in the computation of diluted EPS using the if-converted method. The loss from continuing operations attributable to Forest City Enterprises, Inc. for the three and nine months ended September 30, 2015 and nine months ended September 30, 2014 was allocated solely to holders of common stock as the participating security holders do not share in losses.
The reconciliation of the basic and diluted EPS computations is shown in the following table:
Three Months Ended September 30, | Nine Months Ended September 30, | ||||||||||||
2015 | 2014 | 2015 | 2014 | ||||||||||
Numerators (in thousands) | |||||||||||||
Earnings (loss) from continuing operations attributable to Forest City Enterprises, Inc. | $ | (302,219 | ) | $ | 686 | $ | (52,672 | ) | $ | (89,748 | ) | ||
Undistributed earnings allocated to participating securities | — | (17 | ) | — | — | ||||||||
Earnings (loss) from continuing operations attributable to common shareholders ‑ Basic and Diluted | $ | (302,219 | ) | $ | 669 | $ | (52,672 | ) | $ | (89,748 | ) | ||
Net earnings (loss) attributable to Forest City Enterprises, Inc. | $ | (302,219 | ) | $ | 686 | $ | (52,672 | ) | $ | (76,786 | ) | ||
Undistributed earnings allocated to participating securities | — | (17 | ) | — | — | ||||||||
Net earnings (loss) attributable to common shareholders ‑ Basic and Diluted | $ | (302,219 | ) | $ | 669 | $ | (52,672 | ) | $ | (76,786 | ) | ||
Denominators | |||||||||||||
Weighted average shares outstanding ‑ Basic | 255,417,396 | 198,893,584 | 230,778,223 | 198,328,900 | |||||||||
Effect of stock options and performance shares | — | 750,295 | — | — | |||||||||
Weighted average shares outstanding ‑ Diluted (1) | 255,417,396 | 199,643,879 | 230,778,223 | 198,328,900 | |||||||||
Earnings Per Share | |||||||||||||
Earnings (loss) from continuing operations attributable to common shareholders ‑ Basic and Diluted | $ | (1.18 | ) | $ | — | $ | (0.23 | ) | $ | (0.45 | ) | ||
Net earnings (loss) attributable to common shareholders ‑ Basic and Diluted | $ | (1.18 | ) | $ | — | $ | (0.23 | ) | $ | (0.39 | ) | ||
(1) | Incremental shares from dilutive options, restricted stock, performance shares and convertible units aggregating 17,959,278, 25,382,494 and 37,238,228, for the three and nine months ended September 30, 2015 and the nine months ended September 30, 2014, respectively, were not included in the computation of diluted EPS because their effect is anti-dilutive due to the loss from continuing operations. Incremental shares from restricted stock, Class A common units and convertible securities aggregating 36,120,026 for the three months ended September 30, 2014 were not included in the computation of diluted EPS because their effect is anti-dilutive. Weighted-average options, restricted stock and performance shares of 2,666,555 and 2,304,807 for the three and nine months ended September 30, 2015, respectively, and 3,240,497 and 3,470,348 for the three and nine months ended September 30, 2014, respectively, were not included in the computation of diluted EPS because their effect is anti-dilutive under the treasury stock method. |
27
Forest City Enterprises, Inc. and Subsidiaries
Notes to Consolidated Financial Statements
(Unaudited)
S. Segment Information
The following tables summarize financial data for the Company’s reportable operating segments. All amounts are presented in thousands.
September 30, 2015 | December 31, 2014 | |||||||||||||||||||||||
Identifiable Assets | ||||||||||||||||||||||||
Commercial Group | $ | 5,015,253 | $ | 4,210,714 | ||||||||||||||||||||
Residential Group | 3,583,466 | 3,172,188 | ||||||||||||||||||||||
Arena | 955,409 | 955,570 | ||||||||||||||||||||||
Land Development Group | 275,502 | 250,833 | ||||||||||||||||||||||
Corporate Activities | 130,611 | 225,635 | ||||||||||||||||||||||
$ | 9,960,241 | $ | 8,814,940 | |||||||||||||||||||||
Three Months Ended September 30, | Nine Months Ended September 30, | Three Months Ended September 30, | Nine Months Ended September 30, | |||||||||||||||||||||
2015 | 2014 | 2015 | 2014 | 2015 | 2014 | 2015 | 2014 | |||||||||||||||||
Revenues | Operating Expenses | |||||||||||||||||||||||
Commercial Group | $ | 159,706 | $ | 129,345 | $ | 422,858 | $ | 383,221 | $ | 79,720 | $ | 70,224 | $ | 226,929 | $ | 224,929 | ||||||||
Residential Group | 79,703 | 63,303 | 230,223 | 190,525 | 44,715 | 43,704 | 134,117 | 127,046 | ||||||||||||||||
Arena | 24,637 | 25,039 | 80,497 | 84,968 | 17,199 | 17,105 | 55,019 | 55,399 | ||||||||||||||||
Land Development Group | 25,011 | 17,056 | 52,320 | 55,203 | 11,869 | 5,358 | 23,234 | 24,307 | ||||||||||||||||
Corporate Activities | — | — | — | — | 19,706 | 13,763 | 61,393 | 35,383 | ||||||||||||||||
$ | 289,057 | $ | 234,743 | $ | 785,898 | $ | 713,917 | $ | 173,209 | $ | 150,154 | $ | 500,692 | $ | 467,064 | |||||||||
Depreciation and Amortization | Interest and Other Income | |||||||||||||||||||||||
Commercial Group | $ | 48,819 | $ | 29,304 | $ | 115,392 | $ | 91,756 | $ | 1,708 | $ | 1,579 | $ | 5,614 | $ | 5,585 | ||||||||
Residential Group | 21,670 | 16,608 | 62,363 | 49,660 | 3,030 | 5,101 | 9,790 | 18,145 | ||||||||||||||||
Arena | 8,811 | 8,793 | 26,403 | 25,999 | — | — | — | — | ||||||||||||||||
Land Development Group | 28 | 88 | 540 | 269 | 4,213 | 3,384 | 12,394 | 10,091 | ||||||||||||||||
Corporate Activities | 638 | 718 | 2,084 | 2,154 | 44 | 32 | 179 | 153 | ||||||||||||||||
$ | 79,966 | $ | 55,511 | $ | 206,782 | $ | 169,838 | $ | 8,995 | $ | 10,096 | $ | 27,977 | $ | 33,974 | |||||||||
Interest Expense | Capital Expenditures | |||||||||||||||||||||||
Commercial Group | $ | 29,040 | $ | 31,093 | $ | 89,211 | $ | 97,938 | $ | 50,788 | $ | 17,655 | $ | 122,001 | $ | 98,033 | ||||||||
Residential Group | 6,019 | 8,030 | 12,629 | 23,032 | 83,250 | 62,795 | 199,433 | 187,656 | ||||||||||||||||
Arena | 9,415 | 10,895 | 29,650 | 30,101 | 12,500 | 2,890 | 17,022 | 9,442 | ||||||||||||||||
Land Development Group | (189 | ) | (287 | ) | (1,059 | ) | (572 | ) | — | 20 | 15 | 36 | ||||||||||||
Corporate Activities | 4,722 | 9,581 | 18,904 | 28,418 | — | — | 19 | 15 | ||||||||||||||||
$ | 49,007 | $ | 59,312 | $ | 149,335 | $ | 178,917 | $ | 146,538 | $ | 83,360 | $ | 338,490 | $ | 295,182 | |||||||||
The Company uses Funds From Operations (“FFO”) to report its operating results. FFO, a non-GAAP measure as defined by the National Association of Real Estate Investment Trusts (“NAREIT”), is a measure of performance used by publicly traded REITs. Although the Company is not a REIT, management believes it is important to publish this measure to allow for easier comparison of its performance to its peers. FFO is defined by NAREIT as net earnings excluding the following items at the Company’s proportional share: i) gain (loss) on disposition of rental properties, divisions and other investments (net of tax); ii) non-cash charges for real estate depreciation and amortization; iii) impairment of depreciable real estate (net of tax); and iv) cumulative or retrospective effect of change in accounting principle (net of tax).
The Company believes that, although its business has many facets such as development, acquisitions, disposals, and property management, the core of its business is the recurring operations of its portfolio of real estate assets. The Company’s Chief Executive Officer, the chief operating decision maker, uses FFO, as presented, to assess performance of the Company’s real estate assets by reportable operating segment because it provides information on the financial performance of the core real estate portfolio operations. FFO measures the profitability of a real estate segment’s operations of collecting rent, paying operating expenses and servicing its debt.
28
Forest City Enterprises, Inc. and Subsidiaries
Notes to Consolidated Financial Statements
(Unaudited)
The reconciliations of net earnings (loss) to FFO by segment are shown in the following tables. All amounts are presented in thousands.
Three Months Ended September 30, 2015 | Commercial Group | Residential Group | Arena | Land Development Group | Corporate Activities | Total | ||||||||||||
Net earnings (loss) attributable to Forest City Enterprises, Inc. | $ | (407,249 | ) | $ | 604 | $ | (5,733 | ) | $ | 15,027 | $ | 95,132 | $ | (302,219 | ) | |||
Depreciation and amortization – Real Estate Groups | 60,852 | 25,549 | 5,075 | 14 | — | 91,490 | ||||||||||||
Net gain on disposition of full or partial interests in rental properties | (1,746 | ) | — | — | — | — | (1,746 | ) | ||||||||||
Gain on disposition of unconsolidated entities | (1,009 | ) | — | — | — | — | (1,009 | ) | ||||||||||
Impairment of consolidated depreciable real estate | 400,733 | 8,423 | — | — | — | 409,156 | ||||||||||||
Income tax expense (benefit) on non-FFO: | ||||||||||||||||||
Gain on disposition of rental properties | — | — | — | — | 1,088 | 1,088 | ||||||||||||
Impairment of depreciable real estate | — | — | — | — | (158,805 | ) | (158,805 | ) | ||||||||||
FFO attributable to Forest City Enterprises, Inc. | $ | 51,581 | $ | 34,576 | $ | (658 | ) | $ | 15,041 | $ | (62,585 | ) | $ | 37,955 | ||||
Three Months Ended September 30, 2014 | Commercial Group | Residential Group | Arena | Land Development Group | Corporate Activities | Total | ||||||||||||
Net earnings (loss) attributable to Forest City Enterprises, Inc. | $ | 12,190 | $ | 5,512 | $ | (5,575 | ) | $ | 13,171 | $ | (24,612 | ) | $ | 686 | ||||
Depreciation and amortization – Real Estate Groups | 41,725 | 24,175 | 4,986 | 41 | — | 70,927 | ||||||||||||
Net loss on disposition of full or partial interests in rental properties | 173 | — | — | — | — | 173 | ||||||||||||
Gain on disposition of unconsolidated entities | (9,189 | ) | — | — | — | — | (9,189 | ) | ||||||||||
Income tax expense on non-FFO: | ||||||||||||||||||
Gain on disposition of rental properties | — | — | — | — | 3,310 | 3,310 | ||||||||||||
FFO attributable to Forest City Enterprises, Inc. | $ | 44,899 | $ | 29,687 | $ | (589 | ) | $ | 13,212 | $ | (21,302 | ) | $ | 65,907 | ||||
Nine Months Ended September 30, 2015 | Commercial Group | Residential Group | Arena | Land Development Group | Corporate Activities | Total | ||||||||||||
Net earnings (loss) attributable to Forest City Enterprises, Inc. | $ | 52,631 | $ | 54,034 | $ | (15,763 | ) | $ | 38,254 | $ | (181,828 | ) | $ | (52,672 | ) | |||
Depreciation and amortization – Real Estate Groups | 152,708 | 74,657 | 15,192 | 427 | — | 242,984 | ||||||||||||
Net gain on disposition of full or partial interests in rental properties | (1,746 | ) | — | — | — | — | (1,746 | ) | ||||||||||
Gain on disposition of unconsolidated entities | (1,009 | ) | (19,284 | ) | — | — | — | (20,293 | ) | |||||||||
Impairment of consolidated depreciable real estate | 400,733 | 8,423 | — | — | — | 409,156 | ||||||||||||
Income tax expense (benefit) on non-FFO: | ||||||||||||||||||
Gain on disposition of rental properties | — | — | — | — | 8,549 | 8,549 | ||||||||||||
Impairment of depreciable real estate | — | — | — | — | (158,805 | ) | (158,805 | ) | ||||||||||
FFO attributable to Forest City Enterprises, Inc. | $ | 603,317 | $ | 117,830 | $ | (571 | ) | $ | 38,681 | $ | (332,084 | ) | $ | 427,173 | ||||
Nine Months Ended September 30, 2014 | Commercial Group | Residential Group | Arena | Land Development Group | Corporate Activities | Total | ||||||||||||
Net earnings (loss) attributable to Forest City Enterprises, Inc. | $ | (111,414 | ) | $ | 48,613 | $ | (13,378 | ) | $ | 36,257 | $ | (36,864 | ) | $ | (76,786 | ) | ||
Depreciation and amortization – Real Estate Groups | 130,198 | 71,367 | 14,927 | 116 | — | 216,608 | ||||||||||||
Net loss on disposition of full or partial interests in rental properties | 640 | — | — | — | — | 640 | ||||||||||||
Gain on disposition of unconsolidated entities | (25,279 | ) | (24,796 | ) | — | — | — | (50,075 | ) | |||||||||
Impairment of consolidated depreciable real estate | 129,059 | — | — | — | — | 129,059 | ||||||||||||
Discontinued operations: | ||||||||||||||||||
Depreciation and amortization – Real Estate Groups | 986 | — | — | — | — | 986 | ||||||||||||
Gain on disposition of rental properties | (28,042 | ) | — | — | — | — | (28,042 | ) | ||||||||||
Income tax expense (benefit) on non-FFO: | ||||||||||||||||||
Gain on disposition of rental properties | — | — | — | — | 32,028 | 32,028 | ||||||||||||
Impairment of depreciable real estate | — | — | — | — | (50,053 | ) | (50,053 | ) | ||||||||||
FFO attributable to Forest City Enterprises, Inc. | $ | 96,148 | $ | 95,184 | $ | 1,549 | $ | 36,373 | $ | (54,889 | ) | $ | 174,365 | |||||
29
Item 2. Management’s Discussion and Analysis of Financial Condition and Results of Operations
The following Management’s Discussion and Analysis of Financial Condition and Results of Operations (“MD&A”) of Forest City Enterprises, Inc. and subsidiaries should be read in conjunction with the financial statements and footnotes thereto contained in the annual report on Form 10-K for the year ended December 31, 2014, as amended.
RESULTS OF OPERATIONS
Corporate Description
We principally engage in the ownership, development, management and acquisition of commercial and residential real estate and land throughout the United States. We have approximately $10.0 billion of consolidated assets in 24 states and the District of Columbia at September 30, 2015. Our core markets include Boston, Chicago, Dallas, Denver, Los Angeles, Philadelphia, and the greater metropolitan areas of New York City, San Francisco and Washington D.C. We have regional offices in Boston, Dallas, Denver, Los Angeles, New York City, San Francisco, Washington, D.C., and our corporate headquarters in Cleveland, Ohio.
We operate through three strategic business units, which represent four reportable operating segments (collectively, the “Real Estate Groups”):
• | Commercial Group, our largest strategic business unit, owns, develops, acquires and operates regional malls, specialty/urban retail centers, office and life science buildings and mixed-use projects. Additionally, it operates Barclays Center, a sports and entertainment arena located in Brooklyn, New York, which is reported as a separate operating segment (“Arena”). |
• | Residential Group owns, develops, acquires and operates residential rental properties, including upscale and middle-market apartments, adaptive re-use developments and subsidized senior housing. Additionally, it owns interests in entities that develop and manage military family housing. |
• | Land Development Group acquires and sells both land and developed lots to residential, commercial and industrial customers at our Stapleton project in Denver, Colorado. |
Corporate Activities is the other reportable operating segment, which includes our equity method investment in the Brooklyn Nets (the “Nets”), a member of the National Basketball Association (“NBA”).
Significant milestones during the third quarter of 2015 include:
• | Announced that on September 16, 2015, the Securities and Exchange Commission (the “SEC”) declared our wholly owned subsidiary, Forest City Realty Trust, Inc.’s registration statement on Form S-4 effective; |
• | Filed a definitive proxy statement with the SEC on September 17, 2015 and Forest City Realty Trust, Inc. filed a prospectus in connection with our plan to convert to REIT status; |
• | Announced a new organizational structure effective concurrent with our planned REIT conversion on January 1, 2016. The new structure will be organized around function (operations, development and support services) instead of our historical structure which is organized primarily around asset type (retail, office and apartments); |
• | Entered into separate, privately negotiated exchanges of $8,151,000, $75,387,000 and $55,407,000 aggregate principal amount of our 5.00% Senior Notes due 2016, 4.25% Senior Notes due 2018 and 3.625% Senior Notes due 2020 for 6,322,540 shares of Class A common stock and a cash payment of $25,728,000 in the aggregate; |
• | Completed the sale of Skylight Office Tower, an office building located in Cleveland, Ohio. The sale generated net cash proceeds of $34,944,000. This disposition is part of our strategy to sell operating assets in non-core markets; |
• | Began the phased opening of Kapolei Lofts, an apartment community in Kapolei, Hawaii; |
• | Commenced construction at Broadway and Hill, an apartment community in Los Angeles, California; and |
• | Closed $145,550,000 of nonrecourse mortgage financing transactions. |
In addition, subsequent to September 30, 2015, we achieved the following significant milestone:
• | Announced that each of the proposals related to our conversion to REIT status presented to shareholders at our special shareholder meeting held on October 20, 2015 received the required number of affirmative votes, and as a result, each proposal was approved by the shareholders. |
30
Net Operating Income
Net Operating Income (“NOI”), a non-GAAP measure, reflects our share of the core operations of our rental real estate portfolio, prior to any financing activity. NOI is defined as revenues less operating expenses of consolidated and unconsolidated subsidiaries within our Commercial Group and our Residential Group, except for revenues and cost of sales associated with sales of land held in these segments. The activities of the Land Development Group and Corporate Activities do not involve the operations of our rental property portfolio and therefore are not included in NOI.
Our historical NOI was calculated based on an entire company perspective rather than focusing on the core operations of our rental real estate portfolio. It included amounts associated with the Land Development Group and Corporate Activities, all of which are now excluded to arrive at our new rental real estate portfolio NOI measure. In addition, we evaluated revenue and expense items in the Commercial and Residential segments and determined straight-line rent adjustments should be included in NOI (previously excluded) and land sales less cost of land sales, interest and other income and write-offs of abandoned development projects should be excluded (previously included). We believe the current NOI calculation provides a financial measure that better reflects the ongoing operating performance of our rental property portfolio and aligns our NOI reporting closer to that of our peers. Prior periods were adjusted for comparability purposes.
We believe NOI provides important information about our core operations and, along with earnings, is necessary to understand our business and operating results. A reconciliation between NOI and Earnings (Loss) Before Income Taxes, the most comparable financial measure calculated in accordance with GAAP, is presented below. Although NOI is not presented in accordance with accounting principles generally accepted in the United States of America (“GAAP”), investors can use this non-GAAP measure as supplementary information to evaluate our business. NOI is not intended to be a performance measure that should be regarded as an alternative to, or more meaningful than, our GAAP measures and may not be directly comparable to similarly-titled measures reported by other companies.
Reconciliation of Earnings (Loss) Before Income Taxes (GAAP) to Net Operating Income (non-GAAP) (in thousands):
Nine Months Ended September 30, | |||||||||||||
2015 | 2014 | ||||||||||||
Loss before income taxes (GAAP) | $ | (52,454 | ) | $ | (224,450 | ) | |||||||
Equity in earnings (loss) | $ | (20,094 | ) | $ | 30,468 | ||||||||
Exclude non-NOI activity from unconsolidated entities: | |||||||||||||
Land and non-rental activity, net | (4,420 | ) | 685 | ||||||||||
Interest and other income | (1,057 | ) | (293 | ) | |||||||||
Losses associated with the Nets | 38,435 | 2,361 | |||||||||||
Write offs of abandoned development projects | 10,191 | — | |||||||||||
Depreciation and amortization | 64,861 | 66,901 | |||||||||||
Interest expense and extinguishment of debt | 76,087 | 81,747 | |||||||||||
Total NOI from unconsolidated entities | $ | 164,003 | 164,003 | $ | 181,869 | 181,869 | |||||||
Land sales | (47,589 | ) | (50,367 | ) | |||||||||
Cost of land sales | 15,716 | 17,081 | |||||||||||
Land Development Group revenues | (5,342 | ) | (5,585 | ) | |||||||||
Land Development Group operating expenses | 7,608 | 7,486 | |||||||||||
Corporate general and administrative expenses | 35,895 | 35,383 | |||||||||||
REIT conversion and reorganization costs | 25,498 | — | |||||||||||
Write-offs of abandoned development projects and demolition costs | 5,778 | 1,389 | |||||||||||
Interest and other income | (27,977 | ) | (33,974 | ) | |||||||||
Interest expense | 149,335 | 178,917 | |||||||||||
Loss on extinguishment of debt | 61,953 | 927 | |||||||||||
Net loss on disposition of partial interest in development project | — | 19,590 | |||||||||||
Net (gain) loss on disposition of full or partial interest in rental properties | (1,746 | ) | 613 | ||||||||||
Net gain on change in control of interests | (487,684 | ) | (2,759 | ) | |||||||||
Impairment of real estate | 425,463 | 130,795 | |||||||||||
Depreciation and amortization | 206,782 | 169,838 | |||||||||||
Amortization of mortgage procurement costs | 5,756 | 5,967 | |||||||||||
Net operating income (Non-GAAP) | $ | 480,995 | $ | 432,720 | |||||||||
31
Comparable NOI
We use comparable NOI as a metric to evaluate the performance of our multifamily, office and retail properties. This measure provides a same-store comparison of operating results of all stabilized properties that are open and operating in all periods presented. Non-capitalizable development costs and unallocated management and service company overhead are not directly attributable to an operating property and are considered non-comparable NOI. In addition, certain income and expense items at the property level, such as lease termination income, real estate tax assessments or rebates and NOI impacts of changes in ownership percentages, are excluded from comparable NOI and are included in non-comparable NOI. Retained properties considered non-comparable are disclosed in the Segment Operating Results of the MD&A of this 10-Q. Other properties and activities such as Arena, subsidized senior housing, military housing, straight-line rent adjustments and participation payments as a result of refinancing transactions are not evaluated on a comparable basis and the NOI from these properties and activities is considered non-comparable NOI.
Comparable NOI is an operating statistic defined as NOI from stabilized properties operated in all periods presented, net of noncontrolling interests. Comparable NOI is useful because it measures the performance of the same properties on a period-to-period basis and is used to assess operating performance and resource allocation of the operating properties within our strategic business units. While property dispositions, acquisitions or other factors impact net earnings in the short term, we believe comparable NOI presents a more consistent view of the overall performance of our operating portfolio from period to period.
For the nine months ended September 30, 2015, comparable NOI increased 5.1% for retail, 4.0% for office and 4.5% for residential compared with the same period in the prior year.
The following is a reconciliation of comparable NOI to total NOI.
Net Operating Income (in thousands) | |||||||||||||||||||
Nine Months Ended September 30, 2015 | Nine Months Ended September 30, 2014 | ||||||||||||||||||
Full Consolidation | Comparable | Non-Comparable | Total | Comparable | Non-Comparable | Total | |||||||||||||
Retail | $ | 125,373 | $ | 11,389 | $ | 136,762 | $ | 119,289 | $ | 10,228 | $ | 129,517 | |||||||
Office | 178,230 | 12,634 | 190,864 | 171,106 | 4,197 | 175,303 | |||||||||||||
Apartments | 123,456 | 17,852 | 141,308 | 117,670 | 1,731 | 119,401 | |||||||||||||
Arena | — | 25,336 | 25,336 | — | 29,448 | 29,448 | |||||||||||||
Subsidized Senior Housing | — | 13,191 | 13,191 | — | 12,130 | 12,130 | |||||||||||||
Military Housing | — | 19,616 | 19,616 | — | 15,796 | 15,796 | |||||||||||||
Straight-line rent adjustments | — | 4,709 | 4,709 | — | 2,834 | 2,834 | |||||||||||||
Participation payments | — | (11 | ) | (11 | ) | — | (1,469 | ) | (1,469 | ) | |||||||||
Other | — | (50,780 | ) | (50,780 | ) | — | (50,240 | ) | (50,240 | ) | |||||||||
Grand Total | $ | 427,059 | $ | 53,936 | $ | 480,995 | $ | 408,065 | $ | 24,655 | $ | 432,720 | |||||||
Nine Months Ended September 30, | ||||||||||
Comparable NOI (net of Noncontrolling Interests (“NCI”)) | 2015 | 2014 | % Change | |||||||
(in thousands) | ||||||||||
Retail Comparable NOI | $ | 125,373 | $ | 119,289 | ||||||
NOI attributable to NCI | — | — | ||||||||
Subtotal Retail | 125,373 | 119,289 | 5.1 | % | ||||||
Office Comparable NOI | 178,230 | 171,106 | ||||||||
NOI attributable to NCI | (7,320 | ) | (6,788 | ) | ||||||
Subtotal Office | 170,910 | 164,318 | 4.0 | % | ||||||
Apartments Comparable NOI | 123,456 | 117,670 | ||||||||
NOI attributable to NCI | (8,312 | ) | (7,473 | ) | ||||||
Subtotal Apartments | 115,144 | 110,197 | 4.5 | % | ||||||
Grand Total Comparable NOI (net of NCI) | $ | 411,427 | $ | 393,804 | 4.5 | % | ||||
32
Net Operating Income by Product Type
Full Consolidation (in thousands)
Nine Months Ended September 30, 2015 | Nine Months Ended September 30, 2014 | |||
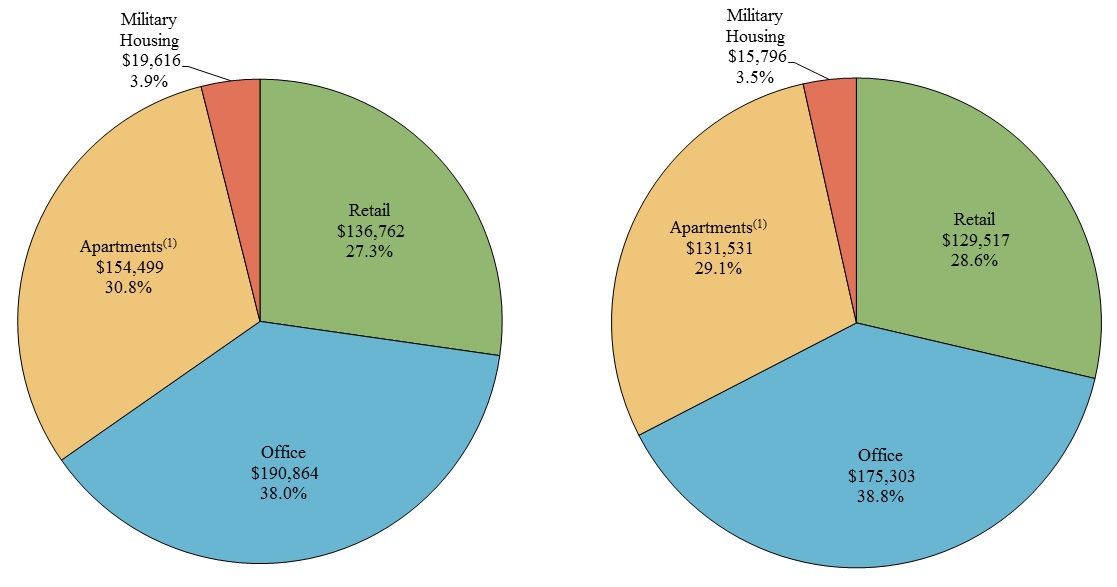
NOI by Product Type | $ | 501,741 | NOI by Product Type | $ | 452,147 | |||
Arena | 25,336 | Arena | 29,448 | |||||
Straight-line rent adjustments | 4,709 | Straight-line rent adjustments | 2,834 | |||||
Participation payments | (11 | ) | Participation payments | (1,469 | ) | |||
Other (2) | (50,780 | ) | Other (2) | (50,240 | ) | |||
Grand Total NOI | $ | 480,995 | Grand Total NOI | $ | 432,720 | |||
(1) | Includes limited-distribution subsidized senior housing. |
(2) | Includes non-capitalizable development costs and unallocated management and service company overhead. |
33
FFO
We believe Funds From Operations (“FFO”), along with net earnings, provides additional information about our core operations. While property dispositions, acquisitions or other factors impact net earnings in the short-term, we believe FFO presents a more consistent view of the overall financial performance of our business from period-to-period since the core of our business is the recurring operations of our portfolio of real estate assets. FFO is used by the chief operating decision maker and management to assess operating performance and resource allocations by strategic business unit and on a consolidated basis.
The majority of our peers in the publicly traded real estate industry are REITs and report operations using FFO as defined by the National Association of Real Estate Investment Trusts (“NAREIT”). Although we are not a REIT, management believes it is important to publish this measure to allow for easier comparison of our performance to our peers. The major difference between us and our REIT peers is that we are a taxable entity and any taxable income we generate could result in payment of federal or state income taxes. Our REIT peers typically do not pay federal or state income taxes on their qualified REIT investments, but distribute a significant portion of their taxable income to shareholders. Due to our effective tax management policies, we have not historically been a significant payer of income taxes. This has allowed us to retain our internally generated cash flows but has also resulted in large expenses for deferred taxes as required by GAAP.
FFO is defined by NAREIT as net earnings excluding the following items at our proportional share: i) gain (loss) on full or partial disposition of rental properties, divisions and other investments (net of tax); ii) non-cash charges for real estate depreciation and amortization; iii) impairment of depreciable real estate (net of tax); and iv) cumulative or retrospective effect of change in accounting principle (net of tax).
The table below reconciles net earnings (loss), the most comparable GAAP measure, to FFO, a non-GAAP measure.
Three Months Ended September 30, | Nine Months Ended September 30, | ||||||||||||
2015 | 2014 | 2015 | 2014 | ||||||||||
(in thousands) | |||||||||||||
Net earnings (loss) attributable to Forest City Enterprises, Inc. | $ | (302,219 | ) | $ | 686 | $ | (52,672 | ) | $ | (76,786 | ) | ||
Depreciation and Amortization—Real Estate Groups (1) | 91,490 | 70,927 | 242,984 | 217,594 | |||||||||
Gain on disposition of full or partial interests in rental properties | (2,755 | ) | (9,016 | ) | (22,039 | ) | (77,477 | ) | |||||
Impairment of depreciable rental properties | 409,156 | — | 409,156 | 129,059 | |||||||||
Income tax expense (benefit) adjustment — current and deferred (2): | |||||||||||||
Gain on disposition of full or partial interests in rental properties | 1,088 | 3,310 | 8,549 | 32,028 | |||||||||
Impairment of depreciable rental properties | (158,805 | ) | — | (158,805 | ) | (50,053 | ) | ||||||
FFO attributable to Forest City Enterprises, Inc. | $ | 37,955 | $ | 65,907 | $ | 427,173 | $ | 174,365 | |||||
FFO Per Share - Diluted | |||||||||||||
Numerator (in thousands): | |||||||||||||
FFO attributable to Forest City Enterprises, Inc. | $ | 37,955 | $ | 65,907 | $ | 427,173 | $ | 174,365 | |||||
If-Converted Method (adjustments for interest, net of tax): | |||||||||||||
5.000% Notes due 2016 | 24 | 382 | 407 | 1,147 | |||||||||
4.250% Notes due 2018 | 1,112 | 2,277 | 4,641 | 6,830 | |||||||||
3.625% Notes due 2020 | 712 | 1,664 | 3,108 | 4,993 | |||||||||
FFO for per share data | $ | 39,803 | $ | 70,230 | $ | 435,329 | $ | 187,335 | |||||
Denominator: | |||||||||||||
Weighted average shares outstanding—Basic | 255,417,396 | 198,893,584 | 230,778,223 | 198,328,900 | |||||||||
Effect of stock options, restricted stock and performance shares | 1,748,909 | 1,758,916 | 2,559,270 | 1,741,929 | |||||||||
Effect of convertible debt | 13,416,727 | 32,138,215 | 19,910,541 | 32,138,215 | |||||||||
Effect of convertible Class A Common Units | 2,793,642 | 2,973,190 | 2,912,683 | 3,358,084 | |||||||||
Weighted average shares outstanding - Diluted | 273,376,674 | 235,763,905 | 256,160,717 | 235,567,128 | |||||||||
FFO Per Share | $ | 0.15 | $ | 0.30 | $ | 1.70 | $ | 0.80 | |||||
34
(1) | The following table provides detail of depreciation and amortization: |
Three Months Ended September 30, | Nine Months Ended September 30, | ||||||||||||
2015 | 2014 | 2015 | 2014 | ||||||||||
(in thousands) | |||||||||||||
Full Consolidation | $ | 79,966 | $ | 55,511 | $ | 206,782 | $ | 169,838 | |||||
Non-Real Estate | (1,123 | ) | (1,217 | ) | (3,495 | ) | (3,484 | ) | |||||
Real Estate Groups Full Consolidation | 78,843 | 54,294 | 203,287 | 166,354 | |||||||||
Real Estate Groups related to noncontrolling interest | (7,710 | ) | (4,888 | ) | (22,856 | ) | (14,250 | ) | |||||
Real Estate Groups Unconsolidated | 20,357 | 21,521 | 62,553 | 64,504 | |||||||||
Real Estate Groups Discontinued Operations | — | — | — | 986 | |||||||||
Real Estate Groups at our proportional share | $ | 91,490 | $ | 70,927 | $ | 242,984 | $ | 217,594 | |||||
(2) | The following table provides detail of income tax expense (benefit): |
Three Months Ended September 30, | Nine Months Ended September 30, | ||||||||||||
2015 | 2014 | 2015 | 2014 | ||||||||||
(in thousands) | |||||||||||||
Income tax expense (benefit) on FFO | |||||||||||||
Operating Earnings: | |||||||||||||
Current taxes | $ | 1,088 | $ | (6,922 | ) | $ | 1,730 | $ | (13,504 | ) | |||
Deferred taxes | (23,017 | ) | 3,247 | 151,925 | 230 | ||||||||
Total income tax expense (benefit) on FFO | (21,929 | ) | (3,675 | ) | 153,655 | (13,274 | ) | ||||||
Income tax expense (benefit) on non-FFO | |||||||||||||
Disposition of full or partial interests in rental properties: | |||||||||||||
Current taxes | $ | 5,438 | $ | 10,415 | $ | 8,320 | $ | 26,171 | |||||
Deferred taxes | (4,350 | ) | (7,105 | ) | 229 | 5,857 | |||||||
Disposition of full or partial interests in rental properties | 1,088 | 3,310 | 8,549 | 32,028 | |||||||||
Impairment of depreciable rental properties | |||||||||||||
Deferred taxes | $ | (158,805 | ) | $ | — | $ | (158,805 | ) | $ | (50,053 | ) | ||
Total income tax expense (benefit) on non-FFO | (157,717 | ) | 3,310 | (150,256 | ) | (18,025 | ) | ||||||
Grand Total | $ | (179,646 | ) | $ | (365 | ) | $ | 3,399 | $ | (31,299 | ) | ||
Operating FFO
In addition to reporting FFO, we report Operating FFO as an additional measure of our operating performance. We believe it is appropriate to adjust FFO for significant items driven by transactional activity and factors relating to the financial and real estate markets, rather than factors specific to the on-going operating performance of our properties. We use Operating FFO as an indicator of continuing operating results in planning and executing our business strategy. Operating FFO should not be considered to be an alternative to net earnings computed under GAAP as an indicator of our operating performance and may not be directly comparable to similarly titled measures reported by other companies.
We define Operating FFO as FFO adjusted to exclude: i) impairment of non-depreciable real estate; ii) write-offs of abandoned development projects and demolition costs; iii) income recognized on state and federal historic and other tax credits; iv) gains or losses from extinguishment of debt; v) change in fair market value of nondesignated hedges; vi) gains or losses on change in control of interests; vii) the adjustment to recognize rental revenues and rental expense using the straight-line method; viii) participation payments to ground lessors on refinancing of our properties; ix) other transactional items; x) the Nets pre-tax FFO; and xi) income taxes on FFO.
35
The table below reconciles FFO to Operating FFO.
Three Months Ended September 30, | Nine Months Ended September 30, | ||||||||||||
2015 | 2014 | 2015 | 2014 | ||||||||||
(in thousands) | |||||||||||||
FFO attributable to Forest City Enterprises, Inc. | $ | 37,955 | $ | 65,907 | $ | 427,173 | $ | 174,365 | |||||
Impairment of non-depreciable real estate | 17,691 | 966 | 17,691 | 1,736 | |||||||||
Write-offs of abandoned development projects and demolition costs | — | 456 | 15,969 | 1,389 | |||||||||
Tax credit income | (3,308 | ) | (3,515 | ) | (10,520 | ) | (12,942 | ) | |||||
(Gain) loss on extinguishment of debt | 23,018 | (300 | ) | 61,970 | 1,322 | ||||||||
Change in fair market value of nondesignated hedges | 1,033 | 55 | (4,059 | ) | 3,046 | ||||||||
Net gain on change in control of interests | — | — | (487,684 | ) | (2,759 | ) | |||||||
Straight-line rent adjustments | (4,111 | ) | 779 | (4,471 | ) | (2,596 | ) | ||||||
Participation payments | 11 | — | 11 | 1,469 | |||||||||
Net loss on disposition of partial interest in development project | — | — | — | 16,211 | |||||||||
REIT conversion and reorganization costs | 9,515 | — | 25,498 | — | |||||||||
Nets pre-tax FFO | 36,842 | 947 | 38,435 | 2,361 | |||||||||
Income tax expense (benefit) on FFO | (21,929 | ) | (3,675 | ) | 153,655 | (13,274 | ) | ||||||
Operating FFO attributable to Forest City Enterprises, Inc. | $ | 96,717 | $ | 61,620 | $ | 233,668 | $ | 170,328 | |||||
Operating FFO Per Share - Diluted | |||||||||||||
Numerator (in thousands): | |||||||||||||
Operating FFO attributable to Forest City Enterprises, Inc. | $ | 96,717 | $ | 61,620 | $ | 233,668 | $ | 170,328 | |||||
If-Converted Method (adjustments for interest, pre-tax): | |||||||||||||
5.000% Notes due 2016 | 39 | 625 | 665 | 1,875 | |||||||||
4.250% Notes due 2018 | 1,816 | 3,719 | 7,581 | 11,156 | |||||||||
3.625% Notes due 2020 | 1,164 | 2,719 | 5,078 | 8,156 | |||||||||
Operating FFO for per share data | $ | 99,736 | $ | 68,683 | $ | 246,992 | $ | 191,515 | |||||
Denominator: | |||||||||||||
Weighted average shares outstanding - Diluted | 273,376,674 | 235,763,905 | 256,160,717 | 235,567,128 | |||||||||
Operating FFO Per Share | $ | 0.36 | $ | 0.29 | $ | 0.96 | $ | 0.81 | |||||
36
Commercial Group
Comparable leased occupancy is 93.2% and 95.9% for retail and office, respectively, as of September 30, 2015 compared with 92.1% and 94.3%, respectively, as of September 30, 2014. Leased occupancy percentage is calculated by dividing the sum of the total tenant occupied space under the lease and vacant space under lease by total gross leasable area (“GLA”). Retail and office occupancy as of September 30, 2015 and 2014 represents leased occupancy at the end of the quarter. Occupancy data includes leases with original terms of one year or less. Comparable occupancy relates to stabilized properties opened and operated in both the three months ended September 30, 2015 and 2014.
We monitor retail and office leases expiring in the short to mid-term. Management’s plan to obtain lease renewals for expiring retail and office leases includes signing of lease extensions, if available, and active marketing for available or soon to be available space to new or existing tenants in the normal course of business.
Retail Centers
The following tables represent those new leases and GLA signed and rent per square foot (“SF”) on the same space in which there was a former tenant and existing tenant renewals.
Regional Malls
Quarter | Number of Leases Signed | GLA Signed | Contractual Rent Per SF (1) | Expired Rent Per SF (1) | Cash Basis % Change over Prior Rent | ||||||||||||
Q4 2014 | 31 | 115,496 | $ | 59.57 | $ | 47.42 | 25.6 | % | |||||||||
Q1 2015 | 34 | 169,951 | $ | 46.51 | $ | 36.92 | 26.0 | % | |||||||||
Q2 2015 | 21 | 48,967 | $ | 63.79 | $ | 49.62 | 28.6 | % | |||||||||
Q3 2015 | 38 | 174,228 | $ | 46.82 | $ | 37.55 | 24.7 | % | |||||||||
Total | 124 | 508,642 | $ | 51.25 | $ | 40.66 | 26.0 | % | |||||||||
Specialty Retail Centers
Quarter | Number of Leases Signed | GLA Signed | Contractual Rent Per SF (1) | Expired Rent Per SF (1) | Cash Basis % Change over Prior Rent | ||||||||||||
Q4 2014 | 3 | 23,198 | $ | 52.55 | $ | 50.48 | 4.1 | % | |||||||||
Q1 2015 | 11 | 40,421 | $ | 34.55 | $ | 35.41 | (2.4 | )% | |||||||||
Q2 2015 | 7 | 42,562 | $ | 31.74 | $ | 29.95 | 6.0 | % | |||||||||
Q3 2015 | 3 | 45,814 | $ | 36.81 | $ | 33.78 | 9.0 | % | |||||||||
Total | 24 | 151,995 | $ | 37.19 | $ | 35.67 | 4.3 | % | |||||||||
Office Buildings
The following table represents those new leases and GLA signed on the same space in which there was a former tenant and existing tenant renewals along with all other new leases signed within the rolling 12-month period.
Same-Space Leases | Other New Leases | ||||||||||||||||||||||
Quarter | Number of Leases Signed | GLA Signed | Contractual Rent Per SF (1) | Expired Rent Per SF (1) | Cash Basis % Change over Prior Rent | Number of Leases Signed | GLA Signed | Contractual Rent Per SF (1) | Total GLA Signed | ||||||||||||||
Q4 2014 | 38 | 450,848 | $ | 40.31 | $ | 38.36 | 5.1 | % | 5 | 44,432 | $ | 36.26 | 495,280 | ||||||||||
Q1 2015 | 18 | 75,460 | $ | 22.49 | $ | 21.40 | 5.1 | % | 2 | 8,196 | $ | 21.94 | 83,656 | ||||||||||
Q2 2015 | 24 | 223,312 | $ | 33.34 | $ | 31.82 | 4.8 | % | 4 | 4,696 | $ | 20.89 | 228,008 | ||||||||||
Q3 2015 | 12 | 168,622 | $ | 69.08 | $ | 68.50 | 0.8 | % | 2 | 5,582 | $ | 17.18 | 174,204 | ||||||||||
Total | 92 | 918,242 | $ | 42.55 | $ | 40.87 | 4.1 | % | 13 | 62,906 | $ | 31.55 | 981,148 | ||||||||||
(1) | Retail and Office contractual rent per square foot includes base rent and fixed additional charges for common area maintenance and real estate taxes as of rental commencement. Retail contractual rent per square foot also includes fixed additional marketing/promotional charges. For all expiring leases, contractual rent per square foot includes any applicable escalations. |
37
Residential Group
Comparable economic occupancy for the Residential Group is 95.2% and 94.8% for the nine months ended September 30, 2015 and 2014, respectively. Economic residential occupancy is calculated by dividing gross potential rent (“GPR”) less vacancy by GPR. GPR is calculated based on actual rents per lease agreements for occupied apartment units and at market rents for vacant apartment units. Market rental rates are determined using a variety of factors which include availability of specific apartment unit types (one bedroom, two bedroom, etc.), seasonality factors and rents offered by competitive properties for similar apartment types in the same geographic market. Comparable economic occupancy relates to stabilized properties that operated in both the nine months ended September 30, 2015 and 2014.
The following tables present leasing information of our apartment communities. Prior period amounts may differ from data as reported in previous quarters since the properties that qualify as comparable change from period to period.
Quarterly Comparison
Monthly Average Residential Rental Rates (2) | Economic Residential Occupancy | |||||||||||||||||
Comparable Apartment | Leasable Units | Three Months Ended September 30, | Three Months Ended September 30, | |||||||||||||||
Communities (1) | at Pro-Rata % (3) | 2015 | 2014 | % Change | 2015 | 2014 | % Change | |||||||||||
Core Markets | 8,170 | $ | 1,911 | $ | 1,850 | 3.3 | % | 95.7 | % | 95.8 | % | (0.1 | )% | |||||
Non-Core Markets | 7,401 | $ | 907 | $ | 879 | 3.2 | % | 93.6 | % | 94.4 | % | (0.8 | )% | |||||
Total Comparable Apartments | 15,571 | $ | 1,434 | $ | 1,388 | 3.3 | % | 95.1 | % | 95.4 | % | (0.3 | )% | |||||
Year-to-Date Comparison
Monthly Average Residential Rental Rates (2) | Economic Residential Occupancy | |||||||||||||||||
Comparable Apartment | Leasable Units | Nine Months Ended September 30, | Nine Months Ended September 30, | |||||||||||||||
Communities (1) | at Pro-Rata % (3) | 2015 | 2014 | % Change | 2015 | 2014 | % Change | |||||||||||
Core Markets | 7,967 | $ | 1,899 | $ | 1,845 | 2.9 | % | 95.6 | % | 95.5 | % | 0.1 | % | |||||
Non-Core Markets | 7,401 | $ | 893 | $ | 871 | 2.5 | % | 94.1 | % | 93.2 | % | 0.9 | % | |||||
Total Comparable Apartments | 15,368 | $ | 1,415 | $ | 1,376 | 2.8 | % | 95.2 | % | 94.8 | % | 0.4 | % | |||||
Sequential Comparison
Monthly Average Residential Rental Rates (2) | Economic Residential Occupancy | |||||||||||||||||
Three Months Ended | Three Months Ended | |||||||||||||||||
Comparable Apartment | Leasable Units | September 30, | June 30, | September 30, | June 30, | |||||||||||||
Communities (1) | at Pro-Rata % (3) | 2015 | 2015 | % Change | 2015 | 2015 | % Change | |||||||||||
Core Markets | 8,586 | $ | 1,907 | $ | 1,879 | 1.5 | % | 95.5 | % | 95.7 | % | (0.2 | )% | |||||
Non-Core Markets | 8,549 | $ | 928 | $ | 912 | 1.8 | % | 93.9 | % | 95.0 | % | (1.1 | )% | |||||
Total Comparable Apartments | 17,135 | $ | 1,419 | $ | 1,396 | 1.6 | % | 95.0 | % | 95.5 | % | (0.5 | )% | |||||
(1) | Includes stabilized apartment communities completely opened and operated in the periods presented. These apartment communities include units leased at affordable apartment rates which provide a discount from average market rental rates. For the three months ended September 30, 2015, 17.4% of leasable units in core markets and 4.2% of leasable units in non-core markets were affordable housing units. Excludes all military and limited-distribution subsidized senior housing units. |
(2) | Represents GPR less concessions. |
(3) | Leasable units at pro-rata represent our share of comparable leasable units at the apartment community. |
38
Segment Operating Results - Quarterly Comparison
The following tables present revenues, operating expenses, interest expense and equity in earnings (loss) by segment for the three months ended September 30, 2015 compared with the three months ended September 30, 2014. Other results of operations are discussed on a consolidated basis. All amounts in the following tables are presented in thousands.
Commercial Group | Residential Group | Arena | Land Development Group | Total | |||||||||||
Revenues for the three months ended September 30, 2014 | $ | 129,345 | $ | 63,303 | $ | 25,039 | $ | 17,056 | $ | 234,743 | |||||
Increase (decrease) due to: | |||||||||||||||
Comparable portfolio | 2,733 | 2,166 | — | — | 4,899 | ||||||||||
Non-comparable properties (1) | (91 | ) | 5,162 | (402 | ) | — | 4,669 | ||||||||
Change in accounting method due to partial sale or acquisition | 29,884 | 10,980 | — | — | 40,864 | ||||||||||
Recently disposed properties | (1,228 | ) | (3,597 | ) | — | — | (4,825 | ) | |||||||
Land sales | — | 611 | — | 7,801 | 8,412 | ||||||||||
Military housing | — | 736 | — | — | 736 | ||||||||||
Other | (937 | ) | 342 | — | 154 | (441 | ) | ||||||||
Revenues for the three months ended September 30, 2015 | $ | 159,706 | $ | 79,703 | $ | 24,637 | $ | 25,011 | $ | 289,057 | |||||
Corporate Activities | Commercial Group | Residential Group | Arena | Land Development Group | Total | |||||||||||||
Operating expenses for the three months ended September 30, 2014 | $ | 13,763 | $ | 70,224 | $ | 43,704 | $ | 17,105 | $ | 5,358 | $ | 150,154 | ||||||
Increase (decrease) due to: | ||||||||||||||||||
Comparable portfolio | — | 179 | 1,267 | — | — | 1,446 | ||||||||||||
Non-comparable properties (1) | — | 186 | 104 | 94 | — | 384 | ||||||||||||
Change in accounting method due to partial sale or acquisition | — | 8,928 | 3,836 | — | — | 12,764 | ||||||||||||
Recently disposed properties | — | (749 | ) | (2,817 | ) | — | — | (3,566 | ) | |||||||||
Land cost of sales | — | — | 90 | — | 6,220 | 6,310 | ||||||||||||
Military housing | — | — | (20 | ) | — | — | (20 | ) | ||||||||||
REIT conversion and reorganization costs | 9,515 | — | — | — | — | 9,515 | ||||||||||||
Development, management, corporate and other expenses | (3,572 | ) | 952 | (1,449 | ) | — | 291 | (3,778 | ) | |||||||||
Operating expenses for the three months ended September 30, 2015 | $ | 19,706 | $ | 79,720 | $ | 44,715 | $ | 17,199 | $ | 11,869 | $ | 173,209 | ||||||
Corporate Activities | Commercial Group | Residential Group | Arena | Land Development Group | Total | |||||||||||||
Interest expense for the three months ended September 30, 2014 | $ | 9,581 | $ | 31,093 | $ | 8,030 | $ | 10,895 | $ | (287 | ) | $ | 59,312 | |||||
Increase (decrease) due to: | ||||||||||||||||||
Comparable portfolio | — | (4,226 | ) | (296 | ) | — | — | (4,522 | ) | |||||||||
Non-comparable properties (1) | — | (26 | ) | 1,008 | (1,480 | ) | — | (498 | ) | |||||||||
Change in accounting method due to partial sale or acquisition | — | 4,071 | 731 | — | — | 4,802 | ||||||||||||
Recently disposed properties | — | (477 | ) | (475 | ) | — | — | (952 | ) | |||||||||
Capitalized interest | — | (1,476 | ) | (3,909 | ) | — | 69 | (5,316 | ) | |||||||||
Mark-to-market adjustments on non-designated swaps | 224 | 9 | 930 | — | 29 | 1,192 | ||||||||||||
Corporate borrowings | (5,083 | ) | — | — | — | — | (5,083 | ) | ||||||||||
Other | — | 72 | — | — | — | 72 | ||||||||||||
Interest expense for the three months ended September 30, 2015 | $ | 4,722 | $ | 29,040 | $ | 6,019 | $ | 9,415 | $ | (189 | ) | $ | 49,007 | |||||
Corporate Activities | Commercial Group | Residential Group | Arena | Land Development Group | Total | |||||||||||||
Equity in earnings (loss) for the three months ended September 30, 2014 | $ | (947 | ) | $ | 6,086 | $ | 5,577 | $ | — | $ | (559 | ) | $ | 10,157 | ||||
Increase (decrease) due to: | ||||||||||||||||||
Comparable portfolio | — | 911 | (569 | ) | — | — | 342 | |||||||||||
Recently disposed equity method properties | — | (218 | ) | (332 | ) | — | — | (550 | ) | |||||||||
Recently opened equity method properties | — | — | 1,168 | — | — | 1,168 | ||||||||||||
Change in accounting method due to partial sale or acquisition | — | (2,406 | ) | (2,125 | ) | — | — | (4,531 | ) | |||||||||
Military housing | — | — | 190 | — | — | 190 | ||||||||||||
Subsidized senior housing | — | — | 72 | — | — | 72 | ||||||||||||
The Nets | (35,895 | ) | — | — | — | — | (35,895 | ) | ||||||||||
Other | — | 943 | (2,413 | ) | — | 1,385 | (85 | ) | ||||||||||
Equity in earnings (loss) for the three months ended September 30, 2015 | $ | (36,842 | ) | $ | 5,316 | $ | 1,568 | $ | — | $ | 826 | $ | (29,132 | ) | ||||
39
(1) | The following table presents the increases (decreases) in revenues, operating expenses and interest expense for Commercial and Residential properties in lease-up or recently stabilized but not comparable and other consolidated non-comparable properties: |
Three Months Ended September 30, 2015 vs. 2014 | ||||||||||
Property | Quarter Opened | Revenues | Operating Expenses | Interest Expense | ||||||
Commercial: | ||||||||||
Property recently stabilized or in lease-up: | ||||||||||
The Yards - Lumbershed | Q3-13 | $ | 83 | $ | 121 | $ | — | |||
Non-comparable property: | ||||||||||
Ballston Common | (174 | ) | 65 | (26 | ) | |||||
Total Commercial | $ | (91 | ) | $ | 186 | $ | (26 | ) | ||
Residential: | ||||||||||
Properties recently stabilized or in lease-up: | ||||||||||
1111 Stratford | Q3-13/Q1-14 | $ | 132 | $ | (293 | ) | $ | (112 | ) | |
2175 Market Street | Q4-14 | 892 | (46 | ) | 224 | |||||
Aster Conservatory Green | Q3-13/14 | 588 | 71 | 189 | ||||||
The Yards - Twelve12 | Q2-14 | 1,941 | 273 | 230 | ||||||
Winchester Lofts | Q4-14 | 446 | 144 | 327 | ||||||
Non-comparable properties: | ||||||||||
Heritage | 564 | (197 | ) | (135 | ) | |||||
500 Sterling Place | 599 | 152 | 285 | |||||||
Total Residential | $ | 5,162 | $ | 104 | $ | 1,008 | ||||
Commercial Group - Quarterly Comparison
The increases in revenues, operating expenses, interest expense and decrease in equity in earnings related to the change in accounting method are due to the change from equity method to full consolidation method of accounting for Boulevard Mall (Q4-2014), a regional mall located in Amherst, New York and the seven life science office properties and two parking facilities at University Park at MIT (Q2-2015) upon the acquisition of our partner’s equity interests in those properties. The decreases in revenues, operating expenses and interest expense related to recent disposals are due to our ongoing strategy to sell operating assets in non-core markets. The decrease in interest expense for the comparable portfolio is primarily due to the paydown of nonrecourse mortgage notes for One MetroTech Center (Q2-2015), Harlem Office (Q3-2014), and Ballston Common Office Center (Q1-2015).
Ballston Common, a regional mall in Arlington, Virginia, is classified as a non-comparable property due to its upcoming planned renovation project.
Residential Group - Quarterly Comparison
The increases in revenues, operating expenses, interest expense and decrease in equity in earnings related to the change in accounting method are due to the change from equity method to full consolidation method of accounting for Bayside Village (Q4-2014), an apartment community in San Francisco, California and the three operating apartment communities located in Northeast Ohio (Q2-2015) upon the acquisition of our partner’s 50% equity interests. The decreases in revenues, operating expenses and interest expense related to recent disposals are due to our ongoing strategy to sell operating assets in non-core markets. The decrease in interest expense related to capitalized interest is due to the increased number of projects under construction and development as we increased our construction pipeline.
Heritage is classified as a non-comparable property due to its recently completed renovation project resulting in a significant number of units being off-line.
500 Sterling Place, an apartment community in Brooklyn, New York, was acquired (Q1-2015) and is classified as a non-comparable property.
Corporate Activities - Quarterly Comparison
The decrease in interest expense is due to the separate, privately negotiated exchanges of a portion of our Senior Notes due 2016, 2018 and 2020 for Class A common stock during 2015. The decrease in equity in earnings is related to an increase in our equity in loss of the Nets in 2015. See the “Investments in Unconsolidated Entities” section of Note A – Accounting Policies in the Notes to Consolidated Financial Statements in Item 1 of this Form 10-Q for detailed information on the Nets activity.
40
Segment Operating Results - Year-to-Date Comparison
The following tables present revenues, operating expenses, interest expense and equity in earnings (loss) by segment for the nine months ended September 30, 2015 compared with the nine months ended September 30, 2014. Other results of operations are discussed on a consolidated basis. All amounts in the following tables are presented in thousands.
Commercial Group | Residential Group | Arena | Land Development Group | Total | |||||||||||
Revenues for the nine months ended September 30, 2014 | $ | 383,221 | $ | 190,525 | $ | 84,968 | $ | 55,203 | $ | 713,917 | |||||
Increase (decrease) due to: | |||||||||||||||
Comparable portfolio | 9,229 | 5,887 | — | — | 15,116 | ||||||||||
Non-comparable properties (1) | (69 | ) | 16,323 | (4,471 | ) | — | 11,783 | ||||||||
Change in accounting method due to partial sale or acquisition | 39,064 | 29,170 | — | — | 68,234 | ||||||||||
Recently disposed properties | (4,189 | ) | (10,634 | ) | — | — | (14,823 | ) | |||||||
Land sales | (600 | ) | 461 | — | (2,639 | ) | (2,778 | ) | |||||||
Military housing | — | (368 | ) | — | — | (368 | ) | ||||||||
Other | (3,798 | ) | (1,141 | ) | — | (244 | ) | (5,183 | ) | ||||||
Revenues for the nine months ended September 30, 2015 | $ | 422,858 | $ | 230,223 | $ | 80,497 | $ | 52,320 | $ | 785,898 | |||||
Corporate Activities | Commercial Group | Residential Group | Arena | Land Development Group | Total | |||||||||||||
Operating expenses for the nine months ended September 30, 2014 | $ | 35,383 | $ | 224,929 | $ | 127,046 | $ | 55,399 | $ | 24,307 | $ | 467,064 | ||||||
Increase (decrease) due to: | ||||||||||||||||||
Comparable portfolio | — | 1,763 | 2,313 | — | — | 4,076 | ||||||||||||
Non-comparable properties (1) | — | (276 | ) | 4,088 | (380 | ) | — | 3,432 | ||||||||||
Change in accounting method due to partial sale or acquisition | — | 12,359 | 9,425 | — | — | 21,784 | ||||||||||||
Recently disposed properties | — | (2,889 | ) | (7,977 | ) | — | — | (10,866 | ) | |||||||||
Land cost of sales | — | (244 | ) | 73 | — | (1,194 | ) | (1,365 | ) | |||||||||
Military housing | — | — | (3,927 | ) | — | — | (3,927 | ) | ||||||||||
REIT conversion and reorganization costs | 25,498 | — | — | — | — | 25,498 | ||||||||||||
Development, management, corporate and other expenses | 512 | (8,713 | ) | 3,076 | — | 121 | (5,004 | ) | ||||||||||
Operating expenses for the nine months ended September 30, 2015 | $ | 61,393 | $ | 226,929 | $ | 134,117 | $ | 55,019 | $ | 23,234 | $ | 500,692 | ||||||
Corporate Activities | Commercial Group | Residential Group | Arena | Land Development Group | Total | |||||||||||||
Interest expense for the nine months ended September 30, 2014 | $ | 28,418 | $ | 97,938 | $ | 23,032 | $ | 30,101 | $ | (572 | ) | $ | 178,917 | |||||
Increase (decrease) due to: | ||||||||||||||||||
Comparable portfolio | — | (8,330 | ) | (921 | ) | — | — | (9,251 | ) | |||||||||
Non-comparable properties (1) | — | 140 | 4,115 | (451 | ) | — | 3,804 | |||||||||||
Change in accounting method due to partial sale or acquisition | — | 5,818 | 1,664 | — | — | 7,482 | ||||||||||||
Recently disposed properties | — | (1,416 | ) | (1,473 | ) | — | — | (2,889 | ) | |||||||||
Capitalized interest | — | (5,164 | ) | (8,465 | ) | — | 247 | (13,382 | ) | |||||||||
Mark-to-market adjustments on non-designated swaps | 180 | (73 | ) | (3,285 | ) | — | (706 | ) | (3,884 | ) | ||||||||
Corporate borrowings | (9,694 | ) | — | — | — | — | (9,694 | ) | ||||||||||
Other | — | 298 | (2,038 | ) | — | (28 | ) | (1,768 | ) | |||||||||
Interest expense for the nine months ended September 30, 2015 | $ | 18,904 | $ | 89,211 | $ | 12,629 | $ | 29,650 | $ | (1,059 | ) | $ | 149,335 | |||||
Corporate Activities | Commercial Group | Residential Group | Arena | Land Development Group | Total | |||||||||||||
Equity in earnings (loss) for the nine months ended September 30, 2014 | $ | (2,361 | ) | $ | 17,974 | $ | 14,918 | $ | — | $ | (63 | ) | $ | 30,468 | ||||
Increase (decrease) due to: | ||||||||||||||||||
Comparable portfolio | — | 5,395 | (1,603 | ) | — | — | 3,792 | |||||||||||
Recently disposed equity method properties | — | (74 | ) | (778 | ) | — | — | (852 | ) | |||||||||
Recently opened equity method properties | — | — | 218 | — | — | 218 | ||||||||||||
Change in accounting method due to partial sale or acquisition | — | (4,072 | ) | (4,622 | ) | — | — | (8,694 | ) | |||||||||
Military housing | — | — | 1,643 | — | — | 1,643 | ||||||||||||
Subsidized senior housing | — | — | 648 | — | — | 648 | ||||||||||||
The Nets | (36,074 | ) | — | — | — | — | (36,074 | ) | ||||||||||
Other | — | 1,084 | (14,382 | ) | — | 2,055 | (11,243 | ) | ||||||||||
Equity in earnings (loss) for the nine months ended September 30, 2015 | $ | (38,435 | ) | $ | 20,307 | $ | (3,958 | ) | $ | — | $ | 1,992 | $ | (20,094 | ) | |||
41
(1) | The following table presents the increases (decreases) in revenues, operating expenses and interest expense for Commercial and Residential properties in lease-up or recently stabilized but not comparable and other consolidated non-comparable properties: |
Nine Months Ended September 30, 2015 vs. 2014 | ||||||||||
Property | Quarter Opened | Revenues | Operating Expenses | Interest Expense | ||||||
Commercial: | ||||||||||
Property recently stabilized or in lease-up: | ||||||||||
The Yards - Lumbershed | Q3-13 | $ | 146 | $ | 125 | $ | 39 | |||
Non-comparable property: | ||||||||||
Ballston Common | (215 | ) | (401 | ) | 101 | |||||
Total Commercial | $ | (69 | ) | $ | (276 | ) | $ | 140 | ||
Residential: | ||||||||||
Properties recently stabilized or in lease-up: | ||||||||||
1111 Stratford | Q3-13/Q1-14 | $ | 899 | $ | (422 | ) | $ | (112 | ) | |
2175 Market Street | Q4-14 | 2,170 | 397 | 485 | ||||||
Aster Conservatory Green | Q3-13/14 | 2,580 | 411 | 804 | ||||||
The Yards - Twelve12 | Q2-14 | 5,671 | 1,861 | 1,274 | ||||||
Winchester Lofts | Q4-14 | 695 | 736 | 1,126 | ||||||
Non-comparable properties: | ||||||||||
Heritage | 2,514 | 228 | (274 | ) | ||||||
500 Sterling Place | 1,794 | 877 | 812 | |||||||
Total Residential | $ | 16,323 | $ | 4,088 | $ | 4,115 | ||||
Commercial Group - Year-to-Date Comparison
The increases in revenues, operating expenses, interest expense and decrease in equity in earnings related to the change in accounting method are due to the change from equity method to full consolidation method of accounting for Boulevard Mall (Q4-2014), a regional mall located in Amherst, New York and the seven life science office properties and two parking facilities at University Park at MIT (Q2-2015) upon the acquisition of our partner’s equity interests in those properties. The decreases in revenues, operating expenses and interest expense related to recent disposals are due to our ongoing strategy to sell operating assets in non-core markets. The decrease in interest expense for the comparable portfolio is primarily due to the paydown of nonrecourse mortgage notes for One MetroTech Center (Q2-2015), Harlem Office (Q3-2014), and Ballston Common Office Center (Q1-2015).
Ballston Common, a regional mall in Arlington, Virginia, is classified as a non-comparable property due to its upcoming planned renovation project.
Residential Group - Year-to-Date Comparison
The increases in revenues, operating expenses, interest expense and decrease in equity in earnings related to the change in accounting method are due to the change from equity method to full consolidation method of accounting for Bayside Village (Q4-2014), an apartment community in San Francisco, California, and the three operating apartment communities located in Northeast Ohio (Q2-2015) upon the acquisition of our partner’s 50% equity interests. The decreases in revenues, operating expenses and interest expense related to recent disposals are due to our ongoing strategy to sell operating assets in non-core markets. The decrease in equity in earnings for other is primarily related to the $10,191,000 write-off of abandoned development projects of unconsolidated entities. The decrease in interest expense related to capitalized interest is due to the increased number of projects under construction and development as we increased our construction pipeline.
Heritage is classified as a non-comparable property due to its recently completed renovation project resulting in a significant number of units being off-line.
500 Sterling Place, an apartment community in Brooklyn, New York, was acquired (Q1-2015) and is classified as a non-comparable property.
Corporate Activities - Year-to-Date Comparison
The decrease in interest expense is due to the separate, privately negotiated exchanges of a portion of our Senior Notes due 2016, 2018 and 2020 for Class A common stock during 2015. The decrease in equity in earnings is related to an increase in our equity in loss of the Nets in 2015. See the “Investments in Unconsolidated Entities” section of Note A – Accounting Policies in the Notes to Consolidated Financial Statements in Item 1 of this Form 10-Q for detailed information on the Nets activity.
42
Depreciation and Amortization
Depreciation and amortization expense was $79,966,000 and $206,782,000 for the three and nine months ended September 30, 2015, respectively, and $55,511,000 and $169,838,000 for the three and nine months ended September 30, 2014, respectively. The increases for the three and nine months ended September 30, 2015 compared to the same periods in the prior year are primarily attributable to the change from equity method accounting to full consolidation for Boulevard Mall (Q4-2014), Bayside Village (Q4-2014) and the MIT Assets (Q2-2015).
Impairment of Real Estate
We recorded impairment charges of $425,463,000 during the three months ended September 30, 2015. The most significant impairment charge in the period relates to Westchester’s Ridge Hill and amounted to $372,587,000. Westchester’s Ridge Hill is our largest regional mall on a square foot basis and originally opened in phases in 2011 and 2012, while the economy was still suffering from the effects of the deep recession. With the challenging market conditions, lease-up of this large asset was significantly slower than originally anticipated resulting in increased project costs and equity requirements. Despite these challenges, we believe the long term outlook for this asset is positive. The primary trade area for Westchester’s Ridge Hill has strong demographics which should drive improved performance as it reaches stabilization. During the three months ended September 30, 2015, we decided to explore the new strategic possibility of a partial sale as we had better clarity around the timing for the stabilization of the asset. The pursuit of this potential joint venture would also allow us to raise capital as part of our overall investment strategy. We are currently in advanced discussions with a potential buyer and believe there is a reasonable possibility that we will be able to execute on the partial sale.
Due to the challenges with this asset, we continually monitored our estimate of probability-weighted undiscounted cash flows to determine if an impairment charge was required. As our previous strategy was to hold the asset long-term and create value in the asset through the continued lease-up of the vacant space, we assigned a low probability of a near-term sale of the asset. Based upon our decision to pursue a potential joint venture and the status of our negotiations with a potential buyer, we updated our probability of a near-term sale to 70%. This change significantly reduced the amount of estimated probability-weighted undiscounted cash flows and resulted in the cash flows no longer exceeding the carrying value of the asset. As a result, we were required to record an impairment charge of $372,587,000 related to Westchester’s Ridge Hill during the three months ended September 30, 2015.
Whether or not we are able to execute on a partial sale of the asset, we plan to continue to investigate ways to get to stabilization as quickly as possible and maximize the level of NOI of this unique asset. However, we cannot give assurances that we will be able to close on any partial sale or improve NOI to the level we are striving to reach.
See Note J – Impairment of Real Estate and Impairment of Unconsolidated Entities in the Notes to Consolidated Financial Statements in Item 1 of this Form 10‑Q for detailed information.
Interest and Other Income
Interest and other income was $8,995,000 and $27,977,000 for the three and nine months ended September 30, 2015, respectively, and $10,096,000 and $33,974,000 for the three and nine months ended September 30, 2014, respectively. The decreases are primarily related to income recognized for a legal settlement at Heritage in 2014, which did not recur in 2015, and decreases in the income recognition on the allocation of state and federal historic preservation, low income housing and new market tax credits.
Amortization of Mortgage Procurement Costs
Amortization of mortgage procurement costs was $1,793,000 and $5,756,000 for the three and nine months ended September 30, 2015, respectively, and $2,074,000 and $5,967,000 for the three and nine months ended September 30, 2014, respectively.
Loss on Extinguishment of Debt
See Note N – Loss on Extinguishment of Debt and Note D – Convertible Senior Debt in the Notes to Consolidated Financial Statements in Item 1 of this Form 10‑Q for detailed information.
Discontinued Operations
See Note Q – Discontinued Operations in the Notes to Consolidated Financial Statements in Item 1 of this Form 10-Q for detailed information.
43
Net Earnings (Loss) Attributable to Forest City Enterprises, Inc. - Quarterly Comparison
Net loss attributable to Forest City Enterprises, Inc. for the three months ended September 30, 2015 was $(302,219,000) versus net earnings of $686,000 for the three months ended September 30, 2014. Although we have substantial recurring revenue sources, significant transactions often create substantial variances in operating results between periods. The variance to the prior year period is primarily attributable to the following fluctuations, which are pre-tax, include unconsolidated investment activity and are net of noncontrolling interests:
Asset Dispositions - $(6,161,000)
• | $(6,261,000) related to decreased gains on disposition of full or partial interest in rental properties and unconsolidated investments in 2015 compared to 2014; |
• | $1,433,000 related to increased Land Development Group sales in 2015 compared with 2014, primarily at our Stapleton project; and |
• | $(1,333,000) related to a combined fluctuation in revenues, operating expenses and interest expense at properties in which we disposed of our full or partial interest during 2015 and 2014. |
Financing Transactions - $(15,699,000)
• | $(23,318,000) related to increased losses on extinguishment of debt compared with 2014 primarily due to the July 2015 separate, privately negotiated exchange transactions involving a portion of our Senior Notes due 2016, 2018 and 2020; |
• | $5,083,000 related to a decrease in interest expense on corporate debt due to separate, privately negotiated exchange transactions involving certain of our Senior Notes due 2016, 2018 and 2020 during February, March and July 2015; |
• | $3,705,000 related to a decrease in interest expense in 2015 compared with 2014 due to increased capitalized interest on projects under construction and development as we increased our construction pipeline; and |
• | $(1,169,000) related to the change in fair market value of certain derivatives not qualifying for hedge accounting between the comparable periods, which was marked to market through interest expense. |
Non-Cash Transactions - $(446,350,000)
• | $(425,881,000) related to increased impairment of real estate in 2015 compared to 2014 primarily driven by the impairment recorded at Westchester's Ridge Hill in the amount of $372,587,000. See the Impairment of Real Estate section of the MD&A of this 10-Q for further information; and |
• | $(20,469,000) related to an increase in depreciation and amortization expense in 2015 compared with 2014 primarily due to recently opened properties and the change from equity method of accounting to full consolidation method upon the acquisition of our partner’s interest in the MIT Assets and three operating apartment communities in Q2 2015, and one apartment community and one regional mall in Q4 2014. These increases were partially offset by the disposition of full or partial interests in several properties during 2015 and 2014. |
Operations - $(18,750,000)
• | $(35,895,000) related to an increase in our equity in loss of the Nets in 2015 compared to 2014. See Note A - Accounting Policies in the Notes to Consolidated Financial Statements in Item 1 of this Form 10-Q for detailed information; |
• | $13,481,000 related to a combined fluctuation in revenues, operating expenses and interest expense in properties in which we recently acquired our partners’ interest; |
• | $(9,515,000) related to REIT conversion and reorganization costs incurred in 2015; |
• | $9,444,000 related to a combined fluctuation in revenues, operating expenses and interest expense in our comparable portfolio in 2015 compared with 2014; and |
• | $3,735,000 related to a combined fluctuation in revenues, operating expenses and interest expense at properties in lease-up at September 30, 2015. |
Income Taxes
• | $179,281,000 due to increased income tax benefit attributable to continuing operations primarily related to the fluctuations in pre-tax earnings. These fluctuations are primarily due to the various transactions discussed herein. |
44
Net Earnings (Loss) Attributable to Forest City Enterprises, Inc. - Year-to-Date Comparison
Net loss attributable to Forest City Enterprises, Inc. for the nine months ended September 30, 2015 was $(52,672,000) versus $(76,786,000) for the nine months ended September 30, 2014. The variance to the prior year period is primarily attributable to the following fluctuations, which are pre-tax, include unconsolidated investment activity and are net of noncontrolling interests:
Asset Dispositions - $(42,745,000)
• | $(55,438,000) related to decreased gains on disposition of full or partial interest in rental properties and unconsolidated investments in 2015 compared to 2014; |
• | $16,211,000 related to the net loss on partial disposition of our interest in Pacific Park Brooklyn, related to the formation of a new joint venture with Greenland in 2014; |
• | $(1,965,000) related to a combined fluctuation in revenues, operating expenses and interest expense at properties in which we disposed of our full or partial interest during 2015 and 2014; and |
• | $(1,553,000) related to decreased Land Development Group sales in 2015 compared with 2014, primarily at our Stapleton project. |
Financing Transactions - $(35,346,000)
• | $(60,648,000) related to increased losses on extinguishment of debt compared with 2014 primarily due to the February, March and July 2015 separate, privately negotiated exchange transactions involving a portion of our Senior Notes due 2016, 2018 and 2020; |
• | $11,771,000 related to a decrease in interest expense in 2015 compared with 2014 due to increased capitalized interest on projects under construction and development as we increased our construction pipeline; |
• | $9,694,000 related to a decrease in interest expense on corporate debt due to separate, privately negotiated exchange transactions involving certain of our Senior Notes due 2016, 2018 and 2020 in February, March and July 2015; and |
• | $3,837,000 related to the change in fair market value of certain derivatives not qualifying for hedge accounting between the comparable periods, which was marked to market through interest expense. |
Non-Cash Transactions - $148,892,000
• | $484,925,000 related to increased gains on change in control of interest in 2015 compared with 2014 activity primarily from the June 2015 acquisition of our partner’s 49% equity ownership interest in the MIT Assets, and the April 2015 acquisition of our partner’s 50% equity ownership interest in three operating apartment communities (Cherry Tree, Chestnut Lake and Stratford Crossing) offset by 2014 activity; |
• | $(296,052,000) related to increased impairment of real estate in 2015 compared to 2014 primarily driven by the impairment recorded at Westchester's Ridge Hill in the amount of $372,587,000. See the Impairment of Real Estate section of the MD&A of this 10-Q for further information; |
• | $(25,401,000) related to an increase in depreciation and amortization expense in 2015 compared with 2014 primarily due to recently opened properties and the change from equity method of accounting to full consolidation method upon the acquisition of our partner’s interest in the MIT Assets and three operating apartment communities in Q2 2015, and one apartment community and one regional mall in Q4 2014. These increases were partially offset by the disposition of full or partial interests in several properties during 2015 and 2014; and |
• | $(14,580,000) related to increased write-offs of abandoned development projects, including $(10,191,000) related to unconsolidated entities, in 2015 compared to 2014. |
Operations - $(14,931,000)
• | $(36,074,000) related to an increase in our equity in loss of the Nets in 2015 compared to 2014. See Note A - Accounting Policies in the Notes to Consolidated Financial Statements in Item 1 of this Form 10-Q for detailed information; |
• | $26,466,000 related to a combined fluctuation in revenues, operating expenses and interest expense in our comparable portfolio in 2015 compared with 2014; |
• | $(25,498,000) related to REIT conversion and reorganization costs incurred in 2015; |
• | $17,459,000 related to a combined fluctuation in revenues, operating expenses and interest expense in properties in which we recently acquired our partners’ interest; |
• | $5,887,000 related to a combined fluctuation in revenues, operating expenses and interest expense at properties in lease-up at September 30, 2015; |
45
• | $(5,167,000) in interest and other income primarily related to income recognized for a legal settlement at Heritage in 2014, which did not recur in 2015, and decreases in the income recognition on the allocation of state and federal historic preservation, low income housing and new market tax credits in 2015 compared with 2014; |
• | $3,135,000 related to a combined fluctuation in revenues and operating expenses in our Military Housing business unit in 2015 compared with 2014; |
• | $(2,200,000) related to a combined fluctuation in revenues, operating expenses and interest expense at Barclays Center in 2015 compared with 2014; and |
• | $1,061,000 related to a combined fluctuation in revenues and operating expenses in our Subsidized Senior Housing business unit in 2015 compared with 2014. |
Income Taxes
• | $(34,698,000) due to increased income tax expense attributable to both continuing and discontinued operations primarily related to the fluctuations in pre-tax earnings, including gains included in discontinued operations. These fluctuations are primarily due to the various transactions discussed herein. |
46
Development Pipeline
Phased Property Opening and Projects Under Construction
September 30, 2015
In addition to the growth in our operating portfolio through driving improved NOI at our existing properties, we have used development as a primary source of growth in our real estate operations. The following tables summarize projects currently under construction as of September 30, 2015 and properties we have opened, commenced phased opening and have acquired during the nine months ended September 30, 2015.
Anticipated | |||||||||||||||||||||
Opening | Legal | Consolidated (C) | Cost at | Cost Incurred to Date (b) | No. of | Lease % | |||||||||||||||
Location | Date | Ownership % | Unconsolidated (U) | Completion (a) | Consolidated | Unconsolidated | Units | GLA | (c) | ||||||||||||
(in millions) | |||||||||||||||||||||
2015 Phased Opening | |||||||||||||||||||||
Other: | |||||||||||||||||||||
Kapolei Lofts (d) | Kapolei, HI | Q3-15/Q1-17 | 100 | % | C | $ | 154.8 | $ | 84.9 | $ | 0.0 | 499 | — | 14% | |||||||
Projects Under Construction | |||||||||||||||||||||
Residential: | |||||||||||||||||||||
Arizona State Retirement System Joint Venture: | |||||||||||||||||||||
The Yards - Arris | Washington, D.C. | Q1-16 | 25 | % | C | $ | 145.1 | $ | 100.2 | $ | 0.0 | 327 | 19,000 | ||||||||
Blossom Plaza | Los Angeles, CA | Q2-16 | 25 | % | C | 104.9 | 51.0 | 0.0 | 237 | 19,000 | |||||||||||
Eliot on 4th | Washington, D.C. | Q4-16 | 25 | % | C | 143.0 | 36.6 | 0.0 | 365 | 5,000 | |||||||||||
Museum Towers II | Philadelphia, PA | Q4-16 | 25 | % | C | 114.0 | 30.8 | 0.0 | 286 | — | |||||||||||
Broadway and Hill | Los Angeles, CA | Q1-17 | 25 | % | C | 139.8 | 49.7 | 0.0 | 391 | 15,000 | |||||||||||
646.8 | 268.3 | 0.0 | 1,606 | 58,000 | |||||||||||||||||
Greenland Joint Venture: | |||||||||||||||||||||
535 Carlton | Brooklyn, NY | Q4-16/17 | 30 | % | U | 169.6 | 0.0 | 49.5 | 298 | — | |||||||||||
550 Vanderbilt (condominiums) | Brooklyn, NY | Q1-17/18 | 30 | % | U | 361.5 | 0.0 | 162.9 | 278 | 7,000 | |||||||||||
38 Sixth Ave | Brooklyn, NY | Q2-17/18 | 30 | % | U | 202.7 | 0.0 | 40.4 | 303 | 28,000 | |||||||||||
Pacific Park - Parking (e) | Brooklyn, NY | Q3-16/18 | 30 | % | U | 99.6 | 0.0 | 21.5 | — | — | |||||||||||
833.4 | 0.0 | 274.3 | 879 | 35,000 | |||||||||||||||||
Aster Town Center North | Denver, CO | Q4-15 | 90 | % | C | $ | 23.4 | $ | 16.4 | $ | 0.0 | 135 | — | ||||||||
The Bixby (The Lofts at Capitol Quarter) | Washington, D.C. | Q1-16 | 25 | % | U | 54.0 | 0.0 | 22.8 | 195 | — | |||||||||||
B2 BKLYN | Brooklyn, NY | Q3-16 | 100 | % | C | 192.1 | 105.7 | 0.0 | 363 | 4,000 | |||||||||||
$ | 1,749.7 | $ | 390.4 | $ | 297.1 | 3,178 | 97,000 | ||||||||||||||
Office: | |||||||||||||||||||||
300 Massachusetts Ave | Cambridge, MA | Q1-16 | 50 | % | U | $ | 175.3 | $ | 0.0 | $ | 118.2 | — | 246,000 | 99% | |||||||
1812 Ashland Ave | Baltimore, MD | Q3-16 | 85 | % | C | 60.7 | 28.7 | 0.0 | — | 164,000 | 70% | ||||||||||
The Bridge at Cornell Tech | Roosevelt Island, NY | Q2-17 | 100 | % | C | 164.1 | 29.3 | 0.0 | — | 235,000 | 39% | ||||||||||
$ | 400.1 | $ | 58.0 | $ | 118.2 | — | 645,000 | ||||||||||||||
Retail Expansion: | |||||||||||||||||||||
Boulevard Mall | Buffalo, NY | Q4-15 | 100 | % | C | 10.9 | 7.3 | 0.0 | — | 46,000 | 100% | ||||||||||
Total Projects Under Construction | $ | 2,160.7 | $ | 455.7 | $ | 415.3 | |||||||||||||||
See footnotes on the following page.
47
Development Pipeline
Property Acquisition and Expansion
September 30, 2015
Location | Date Acquired/ Opened | Legal Ownership % | Consolidated (C) Unconsolidated (U) | Cost at Completion (a) | No. of Units | GLA | Lease % (c) | ||||||||
(in millions) | |||||||||||||||
2015 Property Acquisition | |||||||||||||||
Residential: | |||||||||||||||
500 Sterling Place | Brooklyn, NY | Q1-15 | 100 | % | C | $ | 48.1 | 77 | — | 92% | |||||
2015 Property Expansion Opening | |||||||||||||||
Retail: | |||||||||||||||
Galleria at Sunset | Henderson, NV | Q2-15 | 51 | % | U | $ | 24.7 | — | 32,000 | 59% | |||||
(a) | Represents estimated project costs to achieve stabilization. Amounts exclude capitalized interest not allocated to the underlying joint venture. |
(b) | Represents total capitalized project costs incurred to date, including all capitalized interest related to the development project. |
(c) | Lease commitments as of October 27, 2015. |
(d) | Kapolei Lofts is a residential project currently under construction on land leased by the Company. The land lessor is entitled to a preferred return that currently exceeds anticipated operating cash flow of the project. However, in accordance with the waterfall provisions of the distribution Agreement, the Company expects to share in the net proceeds upon a sale of the project. As of September 30, 2015, 36 of the 499 units were open. |
(e) | Expected to include 950 parking spaces. |
48
FINANCIAL CONDITION AND LIQUIDITY
Multifamily rental properties continue to perform well throughout the majority of the United States. Other types of commercial real estate are improving to varying degrees depending on product type and geographic market. Access to bank credit and capital have continued to improve with banks and permanent lenders originating new loans for real estate projects. Originations of new loans for commercial mortgage backed securities have continued to improve as well. Although underwriting standards are less restrictive, lenders continue favoring high quality operating assets in strong markets. While banks continue to originate construction loans for multifamily projects, construction loans for office or retail projects remain difficult to obtain, unless the project has substantial pre-leasing in place or higher than historical equity commitments from the developer.
Source of Funds
Our principal sources of funds are cash provided by operations including land sales, our revolving credit facility, nonrecourse mortgage debt and notes payable, dispositions of operating properties or development projects through sales or equity joint ventures, proceeds from the issuance of senior notes, common or preferred equity and other financing arrangements. We have consistently disposed of assets in an effort to recycle capital and reposition our portfolio. Over the last ten years, we have generated cash proceeds from sales and/or disposition of partial interests in rental properties averaging in excess of $100,000,000 per year. Given the diversity of our portfolio by market and product type, we believe the market for property dispositions will continue to be available. The current market should allow us to continue our ongoing strategy to recycle capital and reposition the portfolio through asset sales or equity joint ventures.
Our strategic plan drives our capital strategy and business focus on core products located in core markets. In order to achieve our strategic goals, we evaluate each individual asset in our operating and development portfolio to identify those having the best opportunity to provide capital through full or partial sale in conjunction with our strategy of focusing on core products located in core markets. This process may result in reductions to estimated holding periods and the total estimated undiscounted cash flows used for impairment calculations on our individual consolidated real estate assets. In some cases, this may result in estimated undiscounted cash flows being less than the carrying value of the consolidated asset and necessitating an impairment charge to write down the asset to its estimated fair value.
In addition, our capital strategy includes potentially entering into equity joint ventures to provide capital through the sales of partial interests of operating properties or to reduce our equity requirements and development risk on development opportunities. Entering into joint ventures could result in us granting joint control or losing control of the asset and, accordingly, the asset would no longer be consolidated. Upon deconsolidation, our investment balance in the joint venture would be compared to estimated fair value and recorded at the lesser of fair value or book value. Additionally, evaluation for other than temporary impairment on a quarterly basis would be required. This could result in future impairments, some of which could be significant, that would not otherwise be required if the real estate asset remained consolidated.
Use of Funds
Our principal uses of funds include the financing of our real estate operating and development projects, capital expenditures for our existing operating portfolio, principal and interest payments on our nonrecourse mortgage debt and notes payable, revolving credit facility and senior notes, and selective operating asset acquisitions, including joint venture partner acquisitions.
Our primary capital strategy seeks to isolate the operating and financial risk at the property level to maximize returns and reduce risk on and of our equity capital. We do not cross-collateralize our mortgage debt and notes payable outside of a single identifiable project. As such, most of our operating and development properties are separately encumbered with nonrecourse mortgage debt or notes payable, which provides protection by only allowing the lender to commence foreclosure proceedings on the single collateralized asset in the event of a default.
Currently we operate as a C-corporation and retain substantially all of our internally generated cash flows. This cash flow, together with refinancing and property sale proceeds, has historically provided us with the necessary liquidity to take advantage of investment opportunities. The economic downturn and its impact on the lending and capital markets reduced our ability to finance development and acquisition opportunities and also modified the required rates of return to make new investment opportunities appealing. As a result of these market changes, we have established limitations on entering into new development activities.
We continue to make progress on certain other pre-development projects, primarily multifamily projects located in core markets. The cash required to fund our equity in projects under construction and development plus cash necessary to extend or pay down our 2015 debt maturities is anticipated to exceed our cash from operations. As a result, we intend to extend maturing debt or repay it with net proceeds from property sales, equity joint ventures, borrowings on our revolving credit facility or future debt or equity financing.
The Nets and Barclays Center
Our ownership interest in the Nets and Barclays Center is through our consolidated subsidiary Nets Sports & Entertainment (“NS&E”). NS&E owns 20% of the Nets and 55% of Barclays Center. We own approximately 62% of NS&E, with the remaining 38% of NS&E being owned by minority partners. NS&E consolidates its interest in the Barclays Center and accounts for its interests in the Nets on the equity method of accounting.
49
During 2014, we began discussions with several interested parties for the potential sale of our ownership interests in the Nets. Through those discussions, certain parties have also expressed interest in acquiring all or a portion of our ownership interests in Barclays Center. In the event of a sale of our ownership interests, NS&E would be entitled to the remaining cash proceeds after assumption of our proportionate debt, which approximates $50,000,000 related to the Nets and $350,000,000 related to Barclays Center. We have also made certain loans to the minority members of NS&E and such loans are required to be repaid to us prior to the minority partners of NS&E being able to participate in the distributable cash flow from any sale. At September 30, 2015, approximately $260,000,000 of priority member loans and related accrued interest remain outstanding. Any remaining cash flows after satisfaction of the priority loans would be distributed in accordance with the legal ownership of NS&E (approximately 62% to us and 38% to the minority partners).
During the nine months ended September 30, 2015, we continued to discuss the disposal of NS&E’s ownership interests in these two assets. We have not entered into any binding agreement for the sale of these ownership interests and cannot give assurance that we will close on the sale of a portion or all of these ownership interests on terms favorable to us or at all.
During 2013 and 2014, we did not fund the Nets capital calls related to the 2013-2014 and 2014-2015 NBA basketball seasons, respectively. This did not constitute a default under the agreements related to our investment in the Nets because, in 2013, NS&E entered into a forbearance agreement with the majority partner. Under the forbearance agreement, the majority partner agreed to fund NS&E’s portion of Nets capital calls through July 12, 2015 (subsequently amended to September 8, 2015) and forbear the majority partner’s right to dilute NS&E’s ownership interests in the Nets through the forbearance period in exchange for a fee. Upon expiration of the forbearance agreement on September 8, 2015, NS&E repaid the majority partner $26,800,000 related to the 2013-2014 and 2014-2015 NBA seasons and extended the due date related to the 2015-2016 NBA season capital call to October 31, 2015 (subsequently amended to December 28, 2015). As a result of the funding, NS&E recognized $36,842,000 of losses related to its ownership interest in the Nets during the three months ended September 30, 2015.
B2 BKLYN
B2 BKLYN is an apartment building under construction in Brooklyn, New York adjacent to the Barclays Center at the Pacific Park Brooklyn project. This modular construction project has encountered, and may continue to encounter, delays and increased costs in the fabrication and assembly of the modular units. We had a fixed price contract (the “CM Contract”) with Skanska USA to construct the apartment building. In 2014, Skanska USA ceased construction and we terminated the CM Contract for cause. Each party has filed lawsuits relating primarily to the project’s delays and associated additional completion costs. We continue to vigorously pursue legal action against Skanska USA for damages related to their default of the CM Contract. However, there is no assurance that we will be successful in recovering these damages.
Based on these events, including the temporary ceasing of construction and litigation, we investigated and evaluated alternatives to restart and complete the construction. During the three months ended December 31, 2014, we decided to continue using the modular construction method, purchased Skanska USA’s entire 50% ownership interest in the factory used to construct the modular units and engaged a new construction manager to oversee the completion of B2 BKLYN. During the three months ended March 31, 2015, we re-started work at the factory, including fabrication and assembly of modular units and resumed vertical construction during the three months ended June 30, 2015. Based on the latest information available, we estimate the construction will be completed in the third quarter of 2016.
At September 30, 2015, we have $105,700,000 capitalized on the Consolidated Balance Sheet related to B2 BKLYN. Based on the most current information available, total project costs are estimated to be $192,100,000, after giving effect to an impairment charge recorded in 2014. Significant estimates and assumptions were used to develop the estimated total project costs and may change in the future.
Subsequent to the construction stoppage in 2014, we received a notice of default on the nonrecourse mortgage secured by B2 BKLYN. We had entered into a forbearance agreement with our lender which was set to expire on October 8, 2015. On October 6, 2015, we repaid the $45,000,000 nonrecourse mortgage loan in full using funds that were recorded as restricted cash at June 30, 2015.
Nonrecourse Mortgage Financings
As of September 30, 2015, we had $75,578,000 of nonrecourse mortgage financings with scheduled maturities during the year ending December 31, 2015, of which $9,001,000 represents regularly scheduled amortization payments. Subsequent to September 30, 2015, we have addressed $45,000,000 of these maturities through closed transactions. We are currently in negotiations to refinance and/or extend the remaining nonrecourse debt scheduled to mature during the year ending December 31, 2015. We cannot give assurance as to the ultimate result of these negotiations. As with all nonrecourse mortgages, if we are unable to negotiate an extension or otherwise refinance the mortgage, we could go into default and the lender could commence foreclosure proceedings on the single collateralized asset, which would likely result in a loss of the asset or an impairment which could be significant.
As of September 30, 2015, we had three nonrecourse mortgages greater than five percent of our total nonrecourse mortgage debt and notes payable. The mortgages, encumbering the New York Times office building, Barclay’s Center, and Westchester’s Ridge Hill, a regional mall in Yonkers, New York, have outstanding balances of $640,000,000, $413,704,000 and $332,096,000, respectively, at September 30, 2015.
50
As of September 30, 2015, our share of nonrecourse mortgage debt and notes payable recorded on our unconsolidated subsidiaries amounted to $2,202,682,000, of which $35,741,000 ($5,798,000 represents scheduled principal payments) was scheduled to mature during the year ending December 31, 2015. Negotiations are ongoing on the remaining 2015 maturities, but we cannot give assurance we will obtain these financings on favorable terms or at all.
2015 Liquidity Transactions
During the nine months ended September 30, 2015, we completed the following transactions which increased liquidity, reduced debt resulting in lower future fixed charges for interest, reduced future development equity requirements and development risk and strengthened our balance sheet.
• | On February 26, 2015 and March 5, 2015, we entered into separate, privately negotiated exchange agreements whereby we exchanged $40,481,000, $120,087,000 and $128,238,000 in aggregate principal amount of our 5.00% Senior Notes due 2016 (“2016 Senior Notes”), 4.25% Senior Notes due 2018 (“2018 Senior Notes”) and 3.625% Senior Notes due 2020 (“2020 Senior Notes”) for 13,644,513 shares of Class A common stock and a cash payment of $39,087,000 in the aggregate. |
• | In connection with the 2016 Senior Notes issuance, we entered into a convertible note hedge transaction intended to reduce, subject to a limit, the potential dilution with respect to our Class A common stock upon conversion of the 2016 Senior Notes. On March 3, 2015, we terminated and settled the convertible note hedge and received cash proceeds of $17,818,000 and 258,350 shares of Class A common stock, which we initially put into treasury. |
• | We contributed Museum Towers II, an apartment building under construction in Philadelphia, Pennsylvania, into our residential strategic capital partnership with Arizona State Retirement System. This transaction reduces our future equity requirements and development risk relative to our development pipeline. |
• | In May 2015, we issued 37,375,000 shares of our Class A common stock, which included the underwriters’ exercise of their over-allotment option in full, in an underwritten public offering at a price of $22.50 per share. We received net proceeds of $806,500,000 after deducting underwriting discounts, commissions and other offering expenses. |
• | On June 23, 2015, we closed on a share purchase and redemption agreement with our partner to acquire its 49% equity interest in seven life science office properties and two parking facilities at University Park at MIT, a mixed-use life science office campus in Cambridge, Massachusetts (“MIT Assets”). We used $386,156,000 of the net proceeds from our May 2015 equity offering to finance this acquisition. Upon closing, we own 100% of the MIT Assets. |
• | We used substantially all of the remaining net proceeds from our May 2015 equity offering to retire a combination of nonrecourse mortgage debt and revolving credit facility borrowings. |
• | On July 15 and July 16, 2015, we entered into separate, privately negotiated exchange agreements whereby we exchanged $8,151,000, $75,387,000 and $55,407,000 in aggregate principal amount of our 2016, 2018 and 2020 Senior Notes for 6,322,540 shares of Class A common stock and a cash payment of $25,728,000 in the aggregate. |
• | We generated net cash proceeds of $34,944,000 related to the sale of Skylight Office Tower. This disposition is part of our strategy to sell operating assets in non-core markets. |
Subsequent to September 30, 2015, we completed the following transaction.
• | On October 6, 2015, we repaid the $45,000,000 nonrecourse mortgage loan secured by B2 BKLYN in full using funds that were recorded as restricted cash at June 30, 2015. |
We continue to explore various options to strengthen our balance sheet and enhance our liquidity, but can give no assurance we can accomplish any of these other options on terms favorable to us or at all. If we cannot enhance our liquidity, it could adversely impact our growth and result in further curtailment of development activities.
Planned REIT Conversion
On January 13, 2015, our Board of Directors approved a plan to pursue conversion to real estate investment trust (“REIT”) status. On September 16, 2015, the Securities and Exchange Commission (“SEC”) declared our wholly owned subsidiary, Forest City Realty Trust, Inc.’s registration statement on Form S-4 effective. On September 17, 2015, we filed with the SEC a definitive proxy statement and Forest City Realty Trust, Inc. filed a prospectus in connection with our plan to convert to REIT status. Our special shareholder meeting to present proposals related to our conversion to REIT status was held on October 20, 2015. Each of the proposals presented to the shareholders received the required number of affirmative votes, and as a result, each proposal was approved by the shareholders.
51
We expect to elect REIT status for our taxable year ending December 31, 2016, subject to business conditions, the completion of related preparatory work and obtaining necessary third-party consents. As a REIT, we will be subject to a number of organizational and operational requirements, including an annual requirement to distribute to our shareholders an amount equal to at least 90% of our REIT taxable income. We intend to hold and operate certain of our assets through one or more taxable REIT subsidiaries (“TRS”) that would remain subject to applicable corporate income tax. Our REIT taxable income typically will not include income earned by our TRS except to the extent that our TRS pay dividends to the REIT. In addition, we anticipate incurring significant conversion and other reorganization costs associated with the REIT conversion. During the nine months ended September 30, 2015, we incurred $25,498,000 of these REIT conversion and reorganization costs. Upon a successful conversion to REIT status, we intend to commence paying regular dividends. However, the amount, timing and frequency of these future distributions will be at the sole discretion of our Board of Directors and will depend upon various factors.
Currently we operate as a C-corporation. A REIT is not permitted to retain earnings and profits accumulated during the period it was taxed as a C-corporation or accumulated by its TRS not converted to a qualified REIT subsidiary, and must make one or more distributions to shareholders that equal or exceed those amounts (the “E&P Distribution”). As of September 30, 2015, we estimate the E&P Distribution will be less than $75,000,000, if any at all, and expect to pay the E&P Distribution, if necessary, by the end of the first quarter of 2016. This estimate of the E&P Distribution will be affected by the earnings and profits for the remaining portion of the year ended December 31, 2015, which could be significantly different from this estimate based on the mix and level of our operating or development asset sales and any resulting taxable gains or losses, including the possible partial sale of Westchester's Ridge Hill, which if closed, is expected to generate a significant taxable E&P loss. We expect to pay the total E&P Distribution, if required, with a combination of cash (limited to a maximum amount of 20% of the value of the total distribution) and common stock (80%). The timing, amount and composition (cash and common stock) of the E&P Distribution, which may or may not occur, may be affected by potential changes in federal tax regulations, 2015 financial results, including the number of operating assets sold and any resulting gains, the completion of various phases of the REIT conversion process and other factors beyond our control.
As a REIT, we plan to fund all of our capital needs, including any required distributions of our REIT taxable income in order to maintain our REIT qualification under the Code, from our operating cash flow, borrowings under our revolving credit facility, nonrecourse mortgage debt and notes payable, dispositions of operating properties or development projects through sales or equity joint ventures, proceeds from the issuance of senior notes, common or preferred equity and other financing arrangements.
Subsequent Events
Subsequent to September 30, 2015, at our Westchester’s Ridge Hill regional mall in Yonkers, New York, we have received a permit from the City of Yonkers for site work needed to bring Lowe’s to the center on the five-acre parcel at the southern end of the project, and we expect to have a signed lease in the near future. Together with the addition of other recent new tenants, this puts Westchester’s Ridge Hill on a clear path to stabilization. With that, we have reached an agreement with QIC under which we expect to expand our existing regional mall joint ventures to include Westchester’s Ridge Hill during the three months ended December 31, 2015, with plans to add The Shops at Wiregrass near Tampa, Florida and Ballston Commons in Arlington, Virginia, during the first half of 2016. The advanced status of the discussions triggered management to update its undiscounted cash flow analysis including it probability weighted estimated holding period. As a result, the updated estimated probability weighted undiscounted cash flows did not exceed the carrying value of Westchester’s Ridge Hill. As such, we adjusted the carrying value to estimated fair value, resulting in an impairment charge of $372,587,000 during the three months ended September 30, 2015. See the Impairment of Real Estate section of the MD&A of this 10-Q for further information. If consummated, the expansion of the joint ventures to include these three additional regional malls is expected to generate net proceeds of approximately $150,000,000.
Subsequent to September 30, 2015, we have negotiated an agreement in principle to sell our military housing portfolio to the Hunt Companies Inc., a leading player in the military housing sector. We expect to execute a purchase agreement in the near future and are targeting a closing, subject to appropriate consents and customary closing conditions, during the three months ended December 31, 2015. Upon closing, we expect net proceeds from this disposition to approximate $200,000,000 and is expected to generate a gain on disposal.
On October 30, 2015, we executed a purchase and sale agreement with The Rabsky Group for the sale of 625 Fulton Avenue, a development site in Brooklyn, New York adjacent to our DKLB BKLN apartment community, with an anticipated closing during the three months ended December 31, 2015. Upon closing, we expect gross proceeds from this disposition to approximate $158,000,000 and is expected to generate a gain on disposal.
None of the three liquidity transactions have closed. We cannot give assurances that any of the transactions will close at the current negotiated terms or that they will close at all.
52
Financial Covenants
Our revolving credit facility contains certain restrictive financial covenants. A summary of the key financial covenants as defined in the agreement, all of which we are compliant with at September 30, 2015, follows:
Requirement | As of | |||||
Per Agreement | September 30, 2015 | |||||
(dollars in thousands) | ||||||
Credit Facility Financial Covenants | ||||||
Debt Service Coverage Ratio | 1.45x | 2.10 | x | |||
Debt Yield Ratio | >9.50% | 12.75 | % | |||
Cash Flow Coverage Ratio | 3.00x | 11.04 | x | |||
Total Development Ratio | <17% | 7.31 | % | |||
Minimum Consolidated Shareholders’ Equity, as defined | $ | 2,925,050 | $ | 5,165,297 | ||
Revolving Credit Facility
See Note C – Revolving Credit Facility in the Notes to Consolidated Financial Statements in Item 1 of this Form 10-Q for detailed information.
Convertible Senior Debt
See Note D – Convertible Senior Debt in the Notes to Consolidated Financial Statements in Item 1 of this Form 10-Q for detailed information.
Nonrecourse Debt Financings
We use taxable and tax-exempt nonrecourse debt for our real estate projects. Substantially all of our operating and development properties are separately encumbered with nonrecourse mortgage debt, which in some limited circumstances is supplemented by nonrecourse notes payable (collectively “nonrecourse debt”). For real estate projects financed with tax-exempt debt, we generally utilize variable-rate debt. For construction loans, we generally pursue variable-rate financings with maturities ranging from two to five years. For those real estate projects financed with taxable debt, we generally seek long-term, fixed-rate financing for those operating projects whose loans mature or are projected to open and achieve stabilized operations.
We are actively working to refinance and/or extend the maturities of the nonrecourse debt coming due in the next 24 months. During the nine months ended September 30, 2015, we completed the following financings:
Purpose of Financing | Amount | ||
(in thousands) | |||
Refinancing | $ | 176,180 | |
Construction and development projects | 249,850 | ||
Loan extensions/Financing of acquired property | 93,448 | ||
$ | 519,478 | ||
53
Cash Flows
Operating Activities
Net cash provided by operating activities was $158,550,000 and $161,229,000 for the nine months ended September 30, 2015 and 2014, respectively. The net decrease in cash provided by operating activities of $2,679,000 is primarily the result of changes in operating assets and liabilities between the comparable periods offset by reduced interest payments.
Investing Activities
Net cash (used in) provided by investing activities was $(756,673,000) and $38,952,000 for the nine months ended September 30, 2015 and 2014, respectively, and consisted of the following:
Nine Months Ended September 30, | ||||||
2015 | 2014 | |||||
(in thousands) | ||||||
Capital expenditures: | ||||||
Construction and development costs: | ||||||
B2 BKLYN | $ | (49,890 | ) | $ | (33,512 | ) |
The Yards - Arris, an apartment community in Washington, D.C. | (44,491 | ) | (16,382 | ) | ||
Kapolei Lofts, an apartment community in Kapolei, Hawaii | (29,864 | ) | (1,542 | ) | ||
1812 Ashland Ave, a life-science office building in Baltimore, Maryland | (19,110 | ) | (1,159 | ) | ||
Winchester Lofts, an apartment community in New Haven, Connecticut | (7,449 | ) | (21,563 | ) | ||
2175 Market Street, an apartment community in San Francisco, California | (4,505 | ) | (19,024 | ) | ||
The Yards - Twelve12, an apartment community in Washington, D.C. | (3,695 | ) | (32,178 | ) | ||
Pacific Park Brooklyn (1) | — | (36,234 | ) | |||
Other | (108,675 | ) | (99,033 | ) | ||
Total construction and development costs (2) | (267,679 | ) | (260,627 | ) | ||
Operating properties: | ||||||
Commercial Segment | (20,016 | ) | (12,211 | ) | ||
Residential Segment | (9,941 | ) | (10,191 | ) | ||
Arena | (6,777 | ) | (1,582 | ) | ||
Other | (22 | ) | (51 | ) | ||
Total operating properties | (36,756 | ) | (24,035 | ) | ||
Tenant improvements: | ||||||
Commercial Segment | (34,055 | ) | (10,520 | ) | ||
Total capital expenditures | $ | (338,490 | ) | $ | (295,182 | ) |
Acquisitions: | ||||||
Partner’s interest in University Park at MIT | $ | (386,156 | ) | $ | — | |
500 Sterling Place | (11,119 | ) | — | |||
Partner’s interest in 91 Sidney, an apartment building in Cambridge, Massachusetts | — | (19,988 | ) | |||
Total acquisitions | $ | (397,275 | ) | $ | (19,988 | ) |
Payment of lease procurement costs (3) | (8,063 | ) | (7,212 | ) | ||
(Increase) decrease in notes receivable | (10,934 | ) | 10,580 | |||
Decrease (increase) in restricted cash used for investing purposes: | ||||||
One MetroTech Center, an office building in Brooklyn, New York | $ | 24,306 | $ | (4,936 | ) | |
1812 Ashland Ave | 14,730 | — | ||||
The Yards - Twelve12 | 5,045 | 30,085 | ||||
The Bridge at Cornell Tech, an office building in Roosevelt Island, New York | 4,000 | — | ||||
Pacific Park Brooklyn (1) | — | 96,183 | ||||
Collateral released (posted) for various interest rate swaps and total rate of return swaps | 2,261 | (8,235 | ) | |||
Stapleton, a mixed-use community in Denver, Colorado | (5,949 | ) | — | |||
Other | (2,131 | ) | (6,932 | ) | ||
Total decrease in restricted cash used for investing purposes | $ | 42,262 | $ | 106,165 | ||
Proceeds from disposition of rental properties or development project: | ||||||
Skylight Office Tower | $ | 34,944 | $ | — | ||
Disposition of partial interest in Pacific Park Brooklyn | — | 203,923 | ||||
Quartermaster Plaza, a specialty retail center in Philadelphia, Pennsylvania | — | 23,045 | ||||
Mesa del Sol - 5600 University SE, an office building in Albuquerque, New Mexico | — | 4,247 | ||||
Stapleton - 3055 Roslyn, an office building in Denver, Colorado | — | 4,197 | ||||
Other, primarily release of escrow funds from prior year dispositions | 1,650 | 1,496 | ||||
Total proceeds from disposition of rental properties or development project | $ | 36,594 | $ | 236,908 | ||
54
Investing Activities (continued)
Nine Months Ended September 30, | ||||||
2015 | 2014 | |||||
(in thousands) | ||||||
Change in investments in and advances to unconsolidated entities—(contributions to) or distributions from investment: | ||||||
Acquisitions: | ||||||
Partners' interests in East River Plaza, a specialty retail center, and 8 Spruce Street and DKLB BKLN, apartment communities, all located in the New York metropolitan area | $ | — | $ | (14,286 | ) | |
Dispositions: | ||||||
Barrington Place, Legacy Arboretum and Legacy Crossroads, apartment communities in North Carolina | — | 17,532 | ||||
818 Mission Street and Bulletin Building, office buildings in San Francisco, California | — | 11,733 | ||||
Colonial Grand and Westwood Reserve, apartment communities in Tampa, Florida | — | 10,612 | ||||
Residential projects: | ||||||
Pacific Park Brooklyn joint venture (1) | (41,075 | ) | (78,570 | ) | ||
Development project in Jersey City, New Jersey | (16,020 | ) | — | |||
Liberty Hills, an apartment community in Solon, Ohio, refinancing proceeds | 4,000 | — | ||||
Glendora Gardens, a senior housing apartment community in Glendora, California, refinancing proceeds | — | 6,755 | ||||
Bayside Village, an apartment community in San Francisco, Califonia, primarily refinancing proceeds | — | 4,567 | ||||
The Nets, a National Basketball Association member | (24,900 | ) | — | |||
Commercial projects: | ||||||
Regional retail mall joint venture, primarily to fund rehabilitation and expansion projects | (5,591 | ) | (17,269 | ) | ||
Westfield San Franciso Centre, a regional mall in San Francisco, California | (5,092 | ) | — | |||
Victoria Gardens, a regional mall in Rancho Cucamonga, California, primarily refinancing proceeds | — | 37,357 | ||||
Atlantic Terminal Mall, a specialty retail center in Brooklyn, New York, refinancing proceeds | — | 14,751 | ||||
40 Landsdowne Street, an office building in Cambridge, Massachusetts, refinancing proceeds | — | 9,279 | ||||
Other | 7,911 | 5,220 | ||||
Total change in investments in and advances to unconsolidated entities | (80,767 | ) | 7,681 | |||
Net cash (used in) provided by investing activities | $ | (756,673 | ) | $ | 38,952 | |
(1) | Pacific Park Brooklyn changed from the full consolidation method of accounting to equity method during the six months ended June 30, 2014. Capital expenditures and changes in restricted cash represent activity prior to the change to equity method of accounting while changes in investments in and advances to unconsolidated entities represent activity subsequent to the change to equity method of accounting. |
(2) | We capitalized internal costs related to projects under construction and development of $27,565 and $32,733, including compensation related costs of $23,661 and $26,559, for the nine months ended September 30, 2015 and 2014, respectively. Total capitalized internal costs represent approximately 8.1% and 11.1% of total capital expenditures for the nine months ended September 30, 2015 and 2014, respectively. |
(3) | We capitalized internal costs related to leasing activities of $1,899 and $1,648, including compensation related costs of $1,625 and $1,385, for the nine months ended September 30, 2015 and 2014, respectively. |
Financing Activities
Net cash provided by (used in) financing activities was $603,054,000 and $(298,731,000) for the nine months ended September 30, 2015 and 2014, respectively. The net increase in cash provided by financing activities of $901,785,000 is primarily the result of the issuance of 37,375,000 shares of our Class A common stock in an underwritten public equity offering. Of the proceeds received from the equity offering, $386,156,000 was used to finance the acquisition of the MIT Assets, which is an investing activity, with the remaining net proceeds used to retire debt, consistent with our ongoing strategy of deleveraging the balance sheet and for general operating purposes.
LEGAL PROCEEDINGS
We are involved in various claims and lawsuits incidental to our business, and management and legal counsel believe these claims and lawsuits will not have a material adverse effect on our consolidated financial statements.
NEW ACCOUNTING GUIDANCE
See the “New Accounting Guidance” section of Note A – Accounting Policies in the Notes to Consolidated Financial Statements in Item 1 of this Form 10-Q for detailed information.
55
INFORMATION RELATED TO FORWARD-LOOKING STATEMENTS
This Form 10-Q, together with other statements and information publicly disseminated by us, contains “forward-looking statements” within the meaning of Section 27A of the Securities Act of 1933, as amended, and Section 21E of the Securities Exchange Act of 1934, as amended. Such statements reflect management’s current views with respect to financial results related to future events and are based on assumptions and expectations that may not be realized and are inherently subject to risks and uncertainties, many of which cannot be predicted with accuracy and some of which might not even be anticipated. Future events and actual results, financial or otherwise, may differ, perhaps materially, from the results discussed in the forward-looking statements. Risk factors discussed in Item 1A of this Form 10-Q and Item 1A of our Form 10-K for the year ended December 31, 2014 and other factors that might cause differences, some of which could be material, include, but are not limited to, the inability of the company to complete the conversion to REIT status in a timely manner, its failure to satisfy any conditions to completion of the conversion to REIT status, including receipt of required third party consents, its failure to complete the conversion to REIT status for any other reason, its ability to qualify or to remain qualified as a REIT, the possibility that the anticipated benefits of qualifying as a REIT will not be realized, or will not be realized within the expected time period, its inability to meet expectations regarding the accounting and tax treatments of qualifying as a REIT, the possibility that the conversion to REIT status may be more expensive to complete than anticipated, including as a result of unexpected factors or events, diversion of management’s attention from ongoing business operations and opportunities, the impact of issuing equity, debt or both to satisfy its E&P Distribution and any other future distributions it would be required to make as a REIT, the impact of the amount and timing of any future distributions, the impact of covenants that would prevent it from satisfying REIT distribution requirements, its lack of experience operating as a REIT if it successfully converts, legislative, administrative, regulatory or other actions affecting real estate investment trusts, including positions taken by the Internal Revenue Service, the effect on the market price of its common stock following its conversion to REIT status and the E&P Distribution, the impact to its deferred tax liability balance upon conversion to REIT status, the impact of current lending and capital market conditions on its liquidity, its ability to finance or refinance projects or repay its debt, the impact of the slow economic recovery on its ownership, development and management of its commercial real estate portfolio, general real estate investment and development risks, using modular construction as a new construction methodology and owning a factory to produce modular units, vacancies in its properties, risks associated with developing and managing properties in partnership with others, downturns in the housing market, competition, illiquidity of real estate investments, bankruptcy or defaults of tenants, anchor store consolidations or closings, international activities, the impact of terrorist acts and other armed conflicts, risks of owning and operating an arena, risks associated with an investment in a professional sports team, the ability to sell all or a portion of its ownership interests in a professional sports team and arena, its substantial debt leverage and the ability to obtain and service debt, the impact of restrictions imposed by its credit facility and senior debt, exposure to hedging agreements, the level and volatility of interest rates, the continued availability of tax-exempt government financing, the impact of credit rating downgrades, effects of uninsured or underinsured losses, effects of a downgrade or failure of its insurance carriers, environmental liabilities, conflicts of interest, risks associated with the sale of tax credits, the ability to maintain effective internal controls, compliance with governmental regulations, increased legislative and regulatory scrutiny of the financial services industry, changes in federal, state or local tax laws, volatility in the market price of its publicly traded securities, inflation risks, litigation risks, cybersecurity risks, cyber incidents, its ability to achieve its strategic goals are based on significant assumptions, and its ability to complete non-core asset sales as well as other risks listed from time to time in the company’s SEC filings, including but not limited to, the company’s annual and quarterly reports. We have no obligation to revise or update any forward-looking statements, other than as imposed by law, as a result of future events or new information. Readers are cautioned not to place undue reliance on such forward-looking statements.
Item 3. Quantitative and Qualitative Disclosures About Market Risk
Our market risk includes the inability to obtain construction loans, refinance existing construction loans into long-term fixed-rate nonrecourse financing, refinance existing nonrecourse financing at maturity, obtain renewals or replacement of credit enhancement devices, such as letters of credit, or otherwise obtain funds by selling real estate assets or by raising equity. We also have interest-rate exposure on our current variable-rate debt portfolio. During the construction period, we have historically used variable-rate debt to finance developmental projects. At September 30, 2015, our outstanding variable-rate debt, including borrowings under our revolving credit facility, consisted of $1,412,473,000 of taxable debt and $613,914,000 of tax-exempt debt. Upon opening and achieving stabilized operations, we have historically procured long-term fixed-rate financing for our rental properties. If we are unable to procure long-term fixed-rate financing, we would pursue extending maturities with existing lenders. Additionally, we are exposed to interest rate risk upon maturity of our long-term fixed-rate financings.
56
Interest Rate Exposure
At September 30, 2015, the composition of nonrecourse debt was as follows:
Operating Properties | Development Projects | Total | Total Weighted Average Rate | |||||||||
(dollars in thousands) | ||||||||||||
Fixed Rate | $ | 2,416,972 | $ | 57,810 | $ | 2,474,782 | 5.44 | % | ||||
Variable Rate | ||||||||||||
Taxable | 1,382,906 | 29,567 | 1,412,473 | 4.77 | % | |||||||
Tax-Exempt | 534,438 | 79,476 | 613,914 | 1.17 | % | |||||||
$ | 4,334,316 | $ | 166,853 | $ | 4,501,169 | 4.65 | % | |||||
Total gross commitment from lenders | $ | 615,718 | ||||||||||
To mitigate short-term variable interest rate risk, we have purchased interest rate hedges for our variable-rate debt as follows:
Taxable (Priced off of LIBOR Index)
Caps | Swaps | ||||||||
Notional | Average Base | Notional | Average Base | ||||||
Period Covered | Amount | Rate | Amount | Rate | |||||
(dollars in thousands) | |||||||||
10/01/15 - 01/01/16 | $ | 562,705 | 2.13% | $ | 734,497 | 5.03% | |||
01/01/16 - 01/01/17 | 350,000 | 2.00% | 734,278 | 5.03% | |||||
01/01/17 - 01/01/18 | — | —% | 738,914 | 5.02% | |||||
01/01/18 - 05/08/24 | — | —% | 97,450 | 1.87% | |||||
Tax-Exempt (Priced off of Securities Industry and Financial Markets Association (“SIFMA”) Index)
Caps | ||||
Notional | Average Base | |||
Period Covered | Amount | Rate | ||
(dollars in thousands) | ||||
10/01/15 - 01/01/16 | $ | 70,405 | 5.90% | |
01/01/16 - 01/01/17 | 70,405 | 5.90% | ||
01/01/17 - 08/15/17 | 28,400 | 6.00% | ||
The tax-exempt caps generally were purchased in conjunction with lender hedging requirements that require the borrower to protect against significant fluctuations in interest rates. Except for those requirements, we generally do not hedge tax-exempt debt due to its historically low interest rates.
Sensitivity Analysis to Changes in Interest Rates
Including the effect of the protection provided by the interest rate swaps, caps and long-term contracts in place as of September 30, 2015, a 100 basis point increase in taxable interest rates (including properties accounted for under the equity method, corporate debt and the effect of interest rate floors) would increase the annual pre-tax interest cost for the next 12 months of our variable-rate debt by approximately $6,897,000 at September 30, 2015. Although tax-exempt rates generally move in an amount smaller than corresponding changes in taxable interest rates, a 100 basis point increase in tax-exempt rates (including properties accounted for under the equity method) would increase the annual pre-tax interest cost for the next 12 months of our tax-exempt variable-rate debt by approximately $6,623,000 at September 30, 2015. This analysis includes a portion of our taxable and tax-exempt variable-rate debt related to construction loans for which the interest expense is capitalized.
We enter into total rate of return swaps (“TROR”) on various tax-exempt fixed-rate borrowings. The TROR convert borrowings from a fixed rate to a variable rate. In exchange for a fixed rate, the TROR requires the payment of a variable interest rate, generally equivalent to the SIFMA rate (0.02% at September 30, 2015) plus a spread. Additionally, we have guaranteed the fair value of the underlying borrowings. Fluctuation in the value of the TROR is offset by the fluctuation in the value of the underlying borrowings, resulting in minimal financial impact. At September 30, 2015, the aggregate notional amount of TROR that are designated as fair value hedging instruments is $471,985,000. The underlying TROR borrowings are subject to a fair value adjustment. In addition, we have TROR with notional amounts aggregating $139,546,000 that are not designated as fair value hedging instruments and marked-to-market through earnings and are subject to interest rate risk.
57
We estimate the fair value of our hedging instruments based on interest rate market and bond pricing models. At September 30, 2015 and December 31, 2014, we recorded interest rate caps and TROR with positive fair values of approximately $13,412,000 and $8,362,000, respectively, in other assets. At September 30, 2015 and December 31, 2014, we recorded interest rate swaps and TROR that had a negative fair value of approximately $85,578,000 and $102,362,000, respectively, in accounts payable, accrued expenses and other liabilities.
We estimate the fair value of our long-term debt instruments by market rates, if available, or by discounting future cash payments at interest rates that approximate the current market. Estimated fair value is based upon market prices of public debt, available industry financing data, current treasury rates and recent financing transactions. Based on these parameters, the table below contains the estimated fair value of our long-term debt at September 30, 2015.
Carrying Value | Fair Value | Fair Value with 100 bp Decrease in Market Rates | |||||||||
(in thousands) | |||||||||||
Fixed | $ | 2,747,031 | $ | 3,062,517 | $ | 3,271,865 | |||||
Variable | |||||||||||
Taxable | 1,412,473 | 1,403,939 | 1,406,808 | ||||||||
Tax-Exempt | 613,914 | 611,322 | 610,021 | ||||||||
Total Variable | $ | 2,026,387 | $ | 2,015,261 | $ | 2,016,829 | |||||
Total Long-Term Debt | $ | 4,773,418 | $ | 5,077,778 | $ | 5,288,694 | |||||
The following table provides information about our long-term debt instruments that are sensitive to changes in interest rates.
58
Item 3. Quantitative and Qualitative Disclosures About Market Risk (continued)
September 30, 2015
Expected Maturity Date | |||||||||||||||||||||||||||||||
Year Ending December 31, | |||||||||||||||||||||||||||||||
Long-Term Debt | 2015 | 2016 | 2017 | 2018 | 2019 | Period Thereafter | Total Outstanding | Fair Market Value | |||||||||||||||||||||||
(dollars in thousands) | |||||||||||||||||||||||||||||||
Fixed: | |||||||||||||||||||||||||||||||
Fixed-rate debt | $ | 9,657 | $ | 209,181 | $ | 271,992 | $ | 208,870 | $ | 115,144 | $ | 1,659,938 | $ | 2,474,782 | $ | 2,771,092 | |||||||||||||||
Weighted average interest rate | 5.75 | % | 7.86 | % | 5.64 | % | 4.56 | % | 3.98 | % | 5.32 | % | 5.44 | % | |||||||||||||||||
Convertible senior debt (1) | — | 1,368 | — | 154,526 | — | 116,355 | 272,249 | 291,425 | |||||||||||||||||||||||
Weighted average interest rate | — | % | 5.00 | % | — | % | 4.25 | % | — | % | 3.63 | % | 3.99 | % | |||||||||||||||||
Total Fixed-Rate Debt | 9,657 | 210,549 | 271,992 | 363,396 | 115,144 | 1,776,293 | 2,747,031 | 3,062,517 | |||||||||||||||||||||||
Variable: | |||||||||||||||||||||||||||||||
Variable-rate debt | 20,921 | 73,866 | 987,961 | 37,039 | 239,443 | 53,243 | 1,412,473 | 1,403,939 | |||||||||||||||||||||||
Weighted average interest rate (2) | 2.94 | % | 2.34 | % | 5.78 | % | 3.01 | % | 2.17 | % | 3.09 | % | 4.77 | % | |||||||||||||||||
Tax-exempt | 45,000 | — | — | 114,801 | 8,500 | 445,613 | 613,914 | 611,322 | |||||||||||||||||||||||
Weighted average interest rate (2) | 2.21 | % | — | % | — | % | 1.34 | % | 2.97 | % | 0.99 | % | 1.17 | % | |||||||||||||||||
Revolving credit facility (1) | — | — | — | — | — | — | — | — | |||||||||||||||||||||||
Weighted average interest rate (2) | — | % | — | % | — | % | — | % | — | % | — | % | — | % | |||||||||||||||||
Total Variable-Rate Debt | 65,921 | 73,866 | 987,961 | 151,840 | 247,943 | 498,856 | 2,026,387 | 2,015,261 | |||||||||||||||||||||||
Total Long-Term Debt | $ | 75,578 | $ | 284,415 | $ | 1,259,953 | $ | 515,236 | $ | 363,087 | $ | 2,275,149 | $ | 4,773,418 | $ | 5,077,778 | |||||||||||||||
Weighted average interest rate | 2.86 | % | 6.41 | % | 5.75 | % | 3.64 | % | 2.76 | % | 4.33 | % | 4.61 | % | |||||||||||||||||
(1) | Represents recourse debt. |
(2) | Weighted average interest rate is based on current market rates as of September 30, 2015. |
59
Item 4. Controls and Procedures
The Company maintains a set of disclosure controls and procedures designed to ensure that information required to be disclosed by the Company in reports that it files or furnishes under the Securities Exchange Act of 1934 (“Securities Exchange Act”) is recorded, processed, summarized and reported within the time periods specified in Securities and Exchange Commission rules and forms and that such information is accumulated and communicated to the Company’s management, including the Chief Executive Officer (“CEO”) and Chief Financial Officer (“CFO”), as appropriate, to allow timely decisions regarding required disclosure. As of the end of the period covered by this quarterly report, an evaluation of the effectiveness of the Company’s disclosure controls and procedures, as defined in Rules 13a-15(e) and 15d-15(e) under the Securities Exchange Act, was carried out under the supervision and with the participation of the Company’s management, which includes the CEO and CFO. Based on that evaluation, the CEO and CFO have concluded that the Company’s disclosure controls and procedures were effective as of September 30, 2015.
There have been no changes in the Company’s internal control over financial reporting that occurred during the fiscal quarter ended September 30, 2015 that have materially affected, or are reasonably likely to materially affect, the Company’s internal control over financial reporting.
In connection with the rules, the Company continues to review and document its disclosure controls and procedures, including the Company’s internal control over financial reporting, and may from time to time make changes aimed at enhancing their effectiveness and ensuring that the Company’s systems evolve with the business.
PART II — OTHER INFORMATION
Item 1. Legal Proceedings
The Company is involved in various claims and lawsuits incidental to its business, and management and legal counsel believe these claims and lawsuits will not have a material adverse effect on the Company’s consolidated financial statements.
Item 1A. Risk Factors
You should carefully consider the risks and uncertainties described below and under “Information Related to Forward-Looking Statements” in this Quarterly Report on Form 10-Q, as well as in Part I-Item 1A under the heading “Risk Factors” and the information contained under the heading “Information Related to Forward-Looking Statements” in our Annual Report on Form 10-K for the year ended December 31, 2014 (the “2014 Annual Report”), and the other information included or incorporated by reference in this Quarterly Report on Form 10-Q and in other documents that we file with the SEC from time to time. If any of the events or circumstances described in the following risks actually occur, our business, financial condition and/or results of operations could be materially adversely affected and the price of our common shares could decline.
The information presented below updates and should be read in connection with the risk factors and information disclosed in our 2014 Annual Report.
Our Ability to Achieve Our Strategic Goals Are Based on Significant Assumptions, and Our Actual Results May Differ, Possibly Materially and Adversely, From These Goals.
From time to time, the Company provides forward looking statements regarding certain strategic goals. We have made, and may continue to make, forward projections regarding sales of our non-core assets, leverage ratios, debt for equity exchanges, development exposure, operating margins and overhead expenses, the reinstatement of quarterly dividends, the acquisition of the interests of our joint venture partners or the sale of our interests in joint ventures, the expected range and composition of the E&P Distribution (as hereinafter defined), if required, the projected aggregate yield of the Company’s development pipeline, our planned conversion to REIT status and other forward looking statements. In setting our strategic goals, we have made significant assumptions that represent our expectations regarding future events. These assumptions are not historical facts but instead represent only the Company’s expectations regarding future events, many of which, by their nature, are inherently subject to significant uncertainties and contingencies and are outside of the Company’s control. It is very likely that one or more of the assumptions will not be met or will deviate materially from what has been assumed. Accordingly, the Company’s actual results are likely to differ from these strategic goals and the difference may be material and adverse.
The strategic goals and their underlying assumptions are forward-looking statements. We strongly caution our shareholders and our investors not to place undue reliance on any of these assumptions or strategic goals. We are not under any obligation (and we expressly disclaim any obligation) to update or alter any assumptions, goals, projections or other related statements, whether written or oral, that may be made from time to time, whether as a result of new information, future events or otherwise. See “Information Related to Forward-Looking Statements” in the 2014 Annual Report for additional information regarding the forward-looking statements.
60
Risks Relating to Our Business
In the “We Are Exposed to Additional Development Risk in Connection with Using a New Construction Methodology on B2 BKLYN Modular Construction, Litigation Risks, and Owning a Factory to Produce the Modular Units” risk factor in the 2014 Annual Report, we disclosed risks associated with the construction of B2 BKLYN, an apartment building under construction in Brooklyn, New York. The following updates and supplements that information as of September 30, 2015.
During the three months ended March 31, 2015, we restarted work at the factory, including fabrication and assembly of modular units and resumed vertical construction during the three months ended June 30, 2015. Based on the latest information available, we estimate the construction will be completed in the third quarter of 2016. Although work has been resumed at the factory, the project may continue to encounter delays, and we may fail to satisfy completion deadlines set forth under the lending arrangements for the project and the lenders may not be willing to extend such deadlines. Failure to meet the completion deadlines could result in a default under such lending arrangements with a resulting acceleration of the debt and foreclosure of the project, as well as reputational damage.
In the “We May Be Unable to Sell All or a Portion of Our Ownership Interests in the Nets and Barclays Center” risk factor in the 2014 Annual Report, we disclosed risks associated with our inability to sell our interests in the Nets and Barclays Center. The following updates and supplements that information as of September 30, 2015.
During the three months ended September 30, 2015, we continued to discuss the disposal of Nets Sports & Entertainment (“NS&E’s”) ownership interest in the Nets and Barclays Center with several interested parties. However, we have not entered into any binding agreement for the sale of these ownership interests and cannot give assurance that we will close on the sale of a portion or all of these ownership interests on terms favorable to us or at all. We did not fund the July 2013 or 2014 capital calls related to the 2013-2014 and 2014-2015 NBA basketball seasons, respectively. This did not constitute a default under the agreements related to our investment in the Nets. However, under the terms of the operating agreement, the entities controlled by Mikhail Prokhorov (“MP Entities”) that hold the controlling ownership interests in the Nets had the right to dilute NS&E’s ownership interests upon NS&E not funding capital calls. During 2013, we entered into an agreement with the MP Entities, in which they agreed to fund NS&E’s portion of future capital calls through July 12, 2015 (subsequently amended to September 8, 2015) and forbear the right to dilute NS&E’s ownership interests for the forbearance period in exchange for a fee. Upon expiration of the forbearance agreement on September 8, 2015, NS&E repaid the MP Entities $26,800,000 related to the 2013-2014 and 2014-2015 NBA seasons and extended the due date related to the 2015-2016 NBA season capital call to October 31, 2015 (subsequently amended to December 28, 2015). If we are unable to sell our ownership interest in the Nets by the time we are required to repay the MP Entities the amounts owed to them (by December 28, 2015) or if we decide we are unable or unwilling to fund any future capital calls, then our interest may be diluted and could result in up to a total loss of our investment in the Nets.
In the “Our High Debt Leverage May Prevent Us from Responding to Changing Business and Economic Conditions” risk factor in our 2014 Annual Report, we disclosed our ratio of debt (consisting of nonrecourse mortgage debt, a revolving credit facility and convertible senior debt) to total market capitalization. The following updates and supplements that information as of September 30, 2015.
Our high degree of debt leverage could limit our ability to obtain financing or adversely affect our liquidity and financial condition. We had a ratio of debt (consisting of nonrecourse mortgage debt, a revolving credit facility and convertible senior debt) to total market capitalization of approximately 47.9% at September 30, 2015, based on debt outstanding at that date and the market value of our outstanding common stock. Our high leverage may adversely affect our ability to obtain financing for working capital, capital expenditures, acquisitions, development or other general corporate purposes and may make us more vulnerable to a prolonged downturn in the economy. While we are actively trying to reduce our debt leverage through conversions or exchanges of our senior notes for Class A common stock, repayments with proceeds of asset sales, operating margin expansion, improved property and operational performance and additional equity issuances, we cannot assure you that we will be able to significantly reduce our high debt leverage.
We have identified opportunities for costs savings and margin expansion in the Company. We are only in the early stages of analyzing these opportunities, which, if ultimately implemented, would not be substantially realizable until after 2016 following our conversion to REIT status. The realization of these opportunities, accordingly, will not immediately contribute to our strategy to delever. Further, the level of operating expenses will depend on the level of our development pipeline and the amount of costs being capitalized as opposed to expensed. Moreover, the full realization of these opportunities may also involve changes to our operating segments after we have converted to REIT status and these changes may also increase operating costs.
61
Risks Related to Our Conversion to REIT Status
In the “Although We Have Chosen to Pursue Conversion to REIT Status, We May Not Be Successful in Converting to REIT Status Effective January 1, 2016, or at All” risk factor in our 2014 Annual Report, we disclosed risks associated with our conversion to REIT status. The following updates that information as of September 30, 2015.
On January 13, 2015, our Board of Directors approved a plan to pursue conversion to REIT status. On September 16, 2015, the SEC declared our wholly owned subsidiary, Forest City Realty Trust, Inc.’s registration statement on Form S-4 effective. On September 17, 2015, we filed with the SEC a definitive proxy statement and Forest City Realty Trust, Inc. filed a prospectus in connection with our plan to convert to REIT status. Our special shareholder meeting to present proposals related to our conversion to REIT status was held on October 20, 2015. Each of the proposals presented to the shareholders received the required number of affirmative votes, and as a result, each proposal was approved by the shareholders.
There are significant implementation and operational complexities to address to qualify for taxation as a REIT, including completing internal reorganizations and modifying accounting, information technology and real estate systems, receiving shareholder approvals and third party consents, obtaining one or more favorable private letter rulings (“PLR”) from the Internal Revenue Service (“IRS”) and making a special distribution to our shareholders of accumulated earnings and profits (the “E&P Distribution”). Further, changes in legislation, federal tax rules and interpretations thereof could adversely impact our ability to convert to REIT status and/or the attractiveness of converting to REIT status. Similarly, even if we are able to satisfy the existing REIT requirements, the tax laws, regulations and interpretations governing REITs may change at any time in ways that could be disadvantageous to us.
Additionally, many conditions must be met in order to complete the conversion to REIT status, and the timing and outcome of several of these conditions are beyond our control. For example, we cannot provide assurance that all required consents will be obtained, that the IRS will provide us with a favorable PLR or that any favorable PLR will be received in a timely manner for us to convert successfully to REIT status for the taxable year ending December 31, 2016. Even if the transactions necessary to implement the REIT conversion are effected, our Board of Directors may decide not to elect REIT status, or to delay such election, if it determines in its sole discretion that such election is not in our best interest or in the best interest of our shareholders. We can provide no assurance if or when conversion to REIT status will occur or be successful. Furthermore, the effective date of the REIT conversion could be delayed beyond the taxable year ending December 31, 2016, in which event we could not elect REIT status until the taxable year ending December 31, 2017, at the earliest.
Further, the process required to undertake a conversion to REIT status will involve significant management time and attention, and may divert their attention from the operation of our day-to-day business.
In Connection With Our Conversion to REIT Status, We Anticipate Making Significant Asset Sales of Non-Core Assets.
In May 2015, we announced details of our strategic plan to convert to REIT status. A key element of this strategy includes our plan to sell certain non-core assets. To date, we have not entered into any definitive agreements relating to such asset sales, nor do we have firm expressions of interest from third party buyers for many of the assets we intend to sell. Consequently, there can be no assurance that we will be able to complete any asset sales on terms that are favorable to us, or at all.
Further, even if we are able to undertake the asset sales required to achieve our strategic objectives, negotiating and executing the sale of multiple assets in multiple transactions may require a significant amount of management time and resources. This diversion of management’s attention may hinder our ability to operate our existing and continuing businesses on a day-to-day basis. Further, such asset sales may distract management from other steps required to be completed as part of the REIT conversion process, which may delay our ability to complete the planned REIT conversion for the taxable year ending December 31, 2016.
Further, the amount of the E&P Distribution, if required, will be directly impacted by the asset sales we complete prior to the conversion to REIT status; asset sales that generate taxable gain will increase the amount of the E&P Distribution we will need to make. As a result, if we are able to make profitable asset sales, the amount of the E&P Distribution will likely grow. Since our current intention is to fund any E&P Distribution in the form of 80% common stock and 20% cash, to the extent the E&P Distribution increases, this may require us to raise additional cash and may have dilutive effects on our shareholders, and the amount of such dilution may be significant.
We May Not Qualify or Remain Qualified as a REIT.
If we convert to REIT status, we plan to operate in a manner consistent with the REIT qualification rules; however, we cannot provide assurance that we will, in fact, qualify as a REIT or remain so qualified. REIT qualification involves the application of highly technical and complex provisions of the Code to our operations as well as various factual determinations concerning matters and circumstances not entirely within our control. Changes in legislation, federal tax rules and interpretations thereof could also prevent us from converting to REIT status or remaining qualified as a REIT.
If we fail to qualify as a REIT in any taxable year after the REIT conversion, we may become subject to U.S. federal income tax, including any applicable alternative minimum tax, on our taxable income at regular corporate rates with respect to each such taxable year for which the statute of limitations remains open. In addition, we will be subject to monetary penalties for the failure. This treatment
62
would significantly reduce our net earnings and cash flow because of our additional tax liability and the penalties for the years involved, which could significantly impact our financial condition.
We May Not Realize the Anticipated Benefits to Shareholders, Including the Achievement of Significant Tax Savings For Us and Regular Distributions to Our Shareholders.
Even if we successfully elect REIT status, we cannot provide assurance that our shareholders will experience benefits attributable to our qualification and taxation as a REIT, including our ability to reduce our corporate level federal tax through distributions to shareholders and to make regular distributions to shareholders. The realization of the anticipated benefits to shareholders will depend on numerous factors, many of which are outside our control. In addition, future cash distributions to shareholders will depend on our cash flows, as well as the impact of alternative, more attractive investments as compared to dividends. Further, changes in legislation or the federal tax rules could adversely impact the benefits of being a REIT.
Complying with REIT Qualification Requirements May Limit Our Flexibility or Cause Us to Forgo Otherwise Attractive Opportunities.
To qualify as a REIT for federal income tax purposes, we must, on an ongoing basis, satisfy tests concerning, among other things, the sources of our income, the nature and diversification of our assets, the amounts we distribute to our shareholders and the ownership of our common stock. For example, under the Code, no more than 25% of the value of the assets of a REIT may be represented by securities of one or more of our U.S. taxable REIT subsidiaries and other nonqualifying assets. This limitation may affect our ability to make large investments in non-REIT qualifying operations or assets. In addition, in order to maintain qualification as a REIT, we will be required to distribute at least 90% of our REIT taxable income annually, determined without regard to the dividends paid deduction and excluding any net capital gains. As such, compliance with REIT tests may hinder our ability to make certain attractive investments, including the purchase of significant nonqualifying assets and the material expansion of non-real estate activities.
In the “There are Uncertainties Relating to the Amount of the E&P Distribution, as well as the Timing of Such E&P Distribution and the Composition of Common Stock and Cash We May Distribute” risk factor in the 2014 Annual Report, we disclosed risks associated with the timing, amount and composition of the E&P Distribution. The following updates that information as of September 30, 2015.
We have indicated that we expect to issue a special distribution to our shareholders of accumulated earnings and profits, referred to as the E&P Distribution. Assuming we are able to implement the REIT conversion for 2016, we currently expect to pay the E&P Distribution at a time and in a manner that will comply with the requirements under the Code to be a REIT. As of September 30, 2015, we estimate the E&P Distribution will be less than $75,000,000, if any at all, and expect to pay the E&P Distribution, if necessary, by the end of the first quarter of 2016. This estimate of the E&P Distribution will be affected by the earnings and profits for the remaining portion of the year ended December 31, 2015, which could be significantly different from this estimate based on the mix and level of our operating or development asset sales and any resulting taxable gains or losses, including the possible partial sale of Westchester's Ridge Hill, which if closed, is expected to generate a significant taxable E&P loss.We expect to pay the total E&P Distribution, if required, with a combination of cash (limited to a maximum amount of 20% of the value of the total distribution) and common stock (80%). The timing, amount and composition (cash and common stock) of the E&P Distribution, which may or may not occur, may be affected by potential changes in federal tax regulations, 2015 financial results, including the number of operating assets sold and any resulting gains, the completion of various phases of the REIT conversion process and other factors beyond our control. In addition, our actual taxable income and performance for 2015 may be materially different from our current estimates and projections, and may be impacted by the steps we take to prepare for the REIT conversion. See “In Connection With Our Conversion to REIT Status, We Anticipate Making Significant Asset Sales of Non-Core Assets.” for a further discussion of the potential dilutive effect of, and need to raise additional funds for, the E&P Distribution. For these reasons and others, the actual E&P Distribution may be materially different from our estimated range.
The Current Market Price of Our Common Stock May Not Be Indicative of the Market Price of Our Common Stock Following Our E&P Distribution and Our Conversion to REIT Status.
The current share prices of either or both classes of our common stock may not be indicative of the share prices of either class of our common stock after giving effect to the E&P Distribution, and there can be no way to predict how the markets will value either or both classes of REIT common stock following our conversion to REIT status because Forest City Enterprises, Inc. is a “C” corporation and we anticipate that the REIT will qualify as a real estate investment trust under the Code effective for the taxable year ending December 31, 2016. The current share prices of either or both classes of our common stock do not necessarily take the foregoing into account, and the share prices of either or both classes of REIT common stock after REIT conversion may consequently be lower than the current share prices of either or both classes of our common stock. Furthermore, one of the factors that may influence the price of REIT common stock will be the yield from distributions on REIT common stock when compared to yields on other financial instruments. If, for example, an increase in market interest rates results in higher yields on other financial instruments, the market price of REIT common stock could be adversely affected. The market price of REIT common stock also will be affected by general market conditions (as the price of our common stock currently is) and will be potentially affected by the economic and market perception of securities issued by companies that qualify as REITs under the Code.
63
In the “Restrictive Loan Covenants Could Prevent Us from Satisfying REIT Distribution Requirements” risk factor in our 2014 Annual Report, we disclosed risks associated with restrictive loan covenants preventing us from satisfying REIT distribution requirements. The following updates that information as of September 30, 2015.
Our Fourth Amended and Restated Credit Agreement and Fourth Amended and Restated Guaranty of Payment of Debt, as amended to the date hereof (collectively, the “Credit Facility”), contain covenants restricting or limiting our ability to, among other things, pay dividends or make other restricted payments. We will need to amend the Credit Facility, or obtain a waiver under the Credit Facility, to permit our payment of the E&P Distribution and to operate as a REIT. We can provide no assurance that we will be able to amend the Credit Facility, or obtain a waiver, in a manner that enables us to complete our conversion to REIT status.
In anticipation of the planned REIT conversion, we entered the market to refinance the Credit Facility during the nine months ended September 30, 2015. Based on discussions with a select group of banks and current negotiations, the Company intends to close on a new facility during the three months ended December 31, 2015. The new revolving credit facility, if consummated, may contain less favorable terms than our current Credit Facility.
Our Conversion to REIT Status Will Likely Result In an Adjustment to Our Deferred Tax Liability Balance that Could Be Significant, and the Impact of Contemplated Reorganization Is Still Being Analyzed and Could Be Material.
The change in tax status in converting to a REIT will impact the accounting for income taxes of the Company, particularly the current deferred tax liability balance. We are in the process of structuring the REIT and analyzing the components of the deferred tax liability and anticipate that the conversion to REIT status will result in an adjustment to our deferred tax liability balance that could be significant.
Further, the cost savings and margin improvement initiatives identified as part of our strategic plan may result in a change to our segment reporting. In the event we determine it is necessary to change our segment reporting as part of, or following, our conversion to REIT status, the impact of such a change may require a significant investment in systems and processes to generate the required information and may delay our ability to produce required reports.
We Have No Experience Operating as a REIT, Which May Adversely Affect Our Business, Financial Condition or Results of Operations if We Successfully Convert to REIT Status.
We have no experience operating as a REIT and our senior management has no experience operating a REIT. Our pre-REIT operating experience may not be sufficient to prepare us to operate successfully as a REIT. Our inability to operate successfully as a REIT, including the failure to operate in a manner that satisfies the requirements for maintaining REIT status, could adversely affect our business, financial condition or results of operations.
We May Not Be Able to Obtain the Consents of Lenders, Joint Venture Partners, Governmental Agencies, or Other Third Parties Needed to Complete the REIT Conversion on the Time Table Contemplated, or at All; We May Be Forced to Make Payments, Provide Indemnifications or Make Other Accommodations in Order to Facilitate Our Obtaining Requisite Consents or Implement Other Strategies that May Be Disadvantageous to Us.
Our ability to undertake a conversion to REIT status will depend upon our ability to obtain the necessary third party consents, which include consents from our lenders, joint venture partners and government agencies. There can be no guarantee that we will be able to obtain these consents, or that, if we do, we will not need to make certain cash payments, provide indemnifications with respect to structural changes and make other accommodations for such third parties in order to obtain these consents. Any such indemnity or other accommodation may reduce our interest in the property and may adversely affect the profitability of the project to us. Even if we are able to obtain such consents, doing so will require a significant amount of management time and attention, which may divert their attention from running the day-to-day business and from accomplishing the other aspects of the REIT conversion and thus may delay our time table.
Further, in the event we are unable to obtain certain consents, we may be forced to implement alternative solutions to permit us to continue with the REIT conversion, such as treating our subsidiary that is the counterparty to a particular agreement as a taxable REIT subsidiary. Such alternative arrangements may be disadvantageous to us, and there can be no guarantee that such arrangements will not cause further adverse impacts to us in the future.
Item 2. Unregistered Sales of Equity Securities and Use of Proceeds
(a) and (b) – Not applicable.
(c) – Repurchase of equity securities during the quarter.
For the three months ended September 30, 2015, there were no repurchases of stock.
64
Item 6. Exhibits
Exhibit Number | Description of Document | ||
2.1 | - | Agreement and Plan of Merger, dated as of September 15, 2015, between Forest City Enterprises, Inc., Forest City Realty Trust, Inc., FCILP, LLC and FCE Merger Sub, Inc., incorporated by reference to Exhibit 2.1 to the Company’s Form 8-K filed on September 15, 2015 (File No. 1-4372). | |
10.1 | - | Form of Exchange Agreement for the 5.00% Convertible Senior Notes due 2016, incorporated by reference to Exhibit 10.1 to the Company’s Form 8-K filed on July 16, 2015 (File No. 1-4372). | |
10.2 | - | Form of Exchange Agreement for the 4.25% Convertible Senior Notes due 2018, incorporated by reference to Exhibit 10.2 to the Company’s Form 8-K filed on July 16, 2015 (File No. 1-4372). | |
10.3 | - | Form of Exchange Agreement for the 3.625% Convertible Senior Notes due 2020, incorporated by reference to Exhibit 10.3 to the Company’s Form 8-K filed on July 16, 2015 (File No. 1-4372). | |
*31.1 | - | Principal Executive Officer’s Certification pursuant to Section 302 of the Sarbanes-Oxley Act of 2002. | |
*31.2 | - | Principal Financial Officer’s Certification pursuant to Section 302 of the Sarbanes-Oxley Act of 2002. | |
**32.1 | - | Certification pursuant to 18 U.S.C. Section 1350, as adopted pursuant to Section 906 of the Sarbanes-Oxley Act of 2002. | |
*101 | - | The following financial information from Forest City Enterprises, Inc.’s Quarterly Report on Form 10-Q for the quarter ended September 30, 2015, formatted in XBRL (eXtensible Business Reporting Language): (i) Consolidated Balance Sheets (unaudited); (ii) Consolidated Statements of Operations (unaudited); (iii) Consolidated Statements of Comprehensive Income (Loss) (unaudited); (iv) Consolidated Statements of Equity (unaudited); (v) Consolidated Statements of Cash Flows (unaudited); and (vi) Notes to Consolidated Financial Statements (unaudited). | |
* | Filed herewith. |
** | Furnished herewith. |
65
SIGNATURES
Pursuant to the requirements of the Securities Exchange Act of 1934, the registrant has duly caused this report to be signed on its behalf by the undersigned thereunto duly authorized.
FOREST CITY ENTERPRISES, INC. (Registrant) | |||
Date: | November 3, 2015 | /s/ ROBERT G. O’BRIEN | |
Name: Robert G. O’Brien | |||
Title: Executive Vice President and Chief Financial Officer | |||
Date: | November 3, 2015 | /s/ CHARLES D. OBERT | |
Name: Charles D. Obert | |||
Title: Senior Vice President, Chief Accounting Officer and Corporate Controller | |||
66