Attached files
| file | filename |
|---|---|
| 8-K - 8-K - InvenTrust Properties Corp. | a12-13570_18k.htm |
| EX-99.1 - EX-99.1 - InvenTrust Properties Corp. | a12-13570_1ex99d1.htm |
Exhibit 99.2
|
|
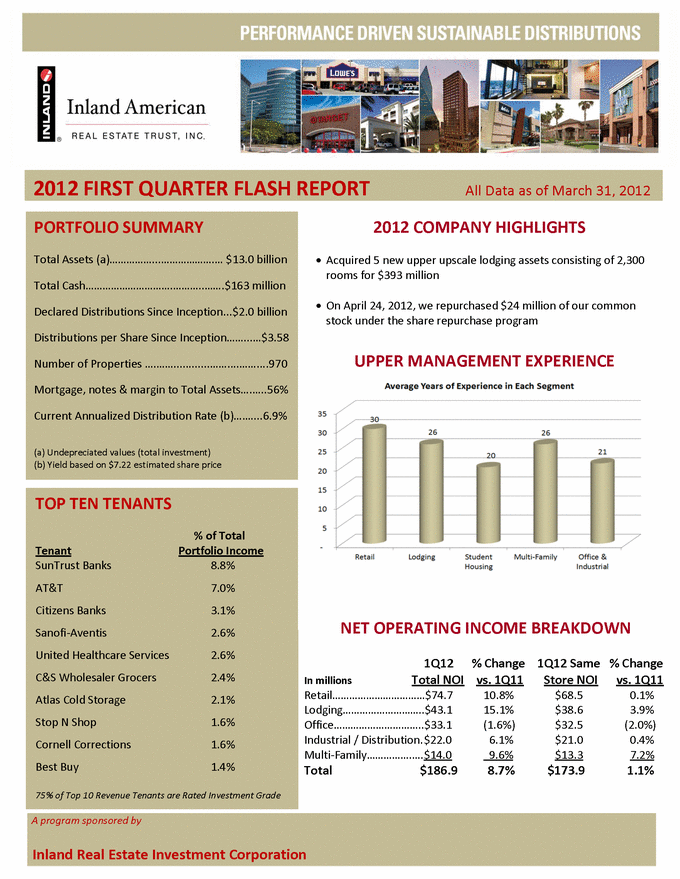
2012 FIRST QUARTER FLASH REPORT All Data as of March 31, 2012 PORTFOLIO SUMMARY Total Assets (a) $13.0 billion Total Cash $163 million Declared Distributions Since Inception $2.0 billion Number of Properties Mortgage, notes & margin 56% Current Annualized Distribution Rate (b)% (a) Undepreciated values (total investment) (b) Yield based on $7.22 estimated share price TOP TEN TENANTS % of Total Tenant Portfolio Income SunTrust Banks 8.8% AT&T 7.0% Citizens Banks 3.1% Sanofi-Aventis 2.6% United Healthcare Services 2.6% C&S Wholesaler Grocers 2.4% Atlas Cold Storage 2.1% Stop N Shop 1.6% Cornell Corrections 1.6% Best Buy 1.4% 75% of Top 10 Revenue Tenants are Rated Investment Grade 2012 COMPANY HIGHLIGHTS Acquired 5 new upper upscale lodging assets consisting of 2,300 rooms for $393 million On April 24, 2012, we repurchased $24 million of our common stock under the share repurchase program UPPER MANAGEMENT EXPERIENCE NET OPERATING INCOME BREAKDOWN 1Q12 % Change 1Q12 Same % Change In millions Total NOI vs. 1Q11 Store NOI vs. 1Q11 10.8% $68.5 0.1% 15.1% $38.6 3.9% (1.6%) $32.5 (2.0%) Industrial / Distribution. $22.0 6.1% $21.0 0.4% Multi- $14.0 9.6% $13.3 7.2% Total $186.9 8.7% $173.9 1.1% A program sponsored by Inland Real Estate Investment Corporation Distributions per Share Since Inception $3.58 to Total Assets 6.9% Retail 474.7 Lodging $43.1 Office $33.1 Industrial / Distribution. $ 22.0 Family $14.0 $186.9 |
|
|
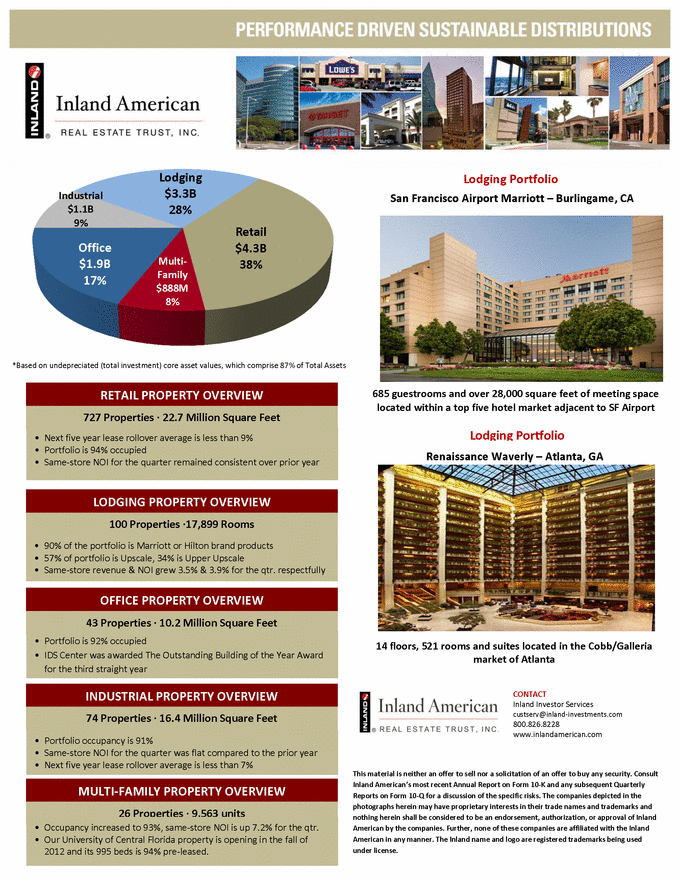
Retail $4.3B 38% Multi-Family $888M 8% Office $1.9B 17% Industrial $1.1B 9% Lodging $3.3B 28% *Based on undepreciated (total investment) core asset values, which comprise 87% of Total Assets RETAIL PROPERTY OVERVIEW 727 Properties 22.7 Million Square Feet Next five year lease rollover average is less than 9% Portfolio is 94% occupied Same-store NOI for the quarter remained consistent over prior year LODGING PROPERTY OVERVIEW 100 Properties 17,899 Rooms 90% of the portfolio is Marriott or Hilton brand products 57% of portfolio is Upscale, 34% is Upper Upscale Same-store revenue & NOI grew 3.5% & 3.9% for the qtr. respectfully INDUSTRIAL PROPERTY OVERVIEW 74 Properties 16.4 Million Square Feet Portfolio occupancy is 91% Same-store NOI for the quarter was flat compared to the prior year Next five year lease rollover average is less than 7% OFFICE PROPERTY OVERVIEW 43 Properties 10.2 Million Square Feet Portfolio is 92% occupied IDS Center was awarded The Outstanding Building of the Year Award for the third straight year Lodging Portfolio CONTACT Inland Investor Services custserv@inland-investments.com 800.826.8228 www.inlandamerican.com This material is neither an offer to sell nor a solicitation of an offer to buy any security. Consult Inland American’s most recent Annual Report on Form 10-K and any subsequent Quarterly Reports on Form 10-Q for a discussion of the specific risks. The companies depicted in the photographs herein may have proprietary interests in their trade names and trademarks and nothing herein shall be considered to be an endorsement, authorization, or approval of Inland American by the companies. Further, none of these companies are affiliated with the Inland American in any manner. The Inland name and logo are registered trademarks being used under license. MULTI-FAMILY PROPERTY OVERVIEW 26 Properties 9,563 units Occupancy increased to 93%, same-store NOI is up 7.2% for the qtr. Our University of Central Florida property is opening in the fall of 2012 and its 995 beds is 94% pre-leased. 685 guestrooms and over 28,000 square feet of meeting space located within a top five hotel market adjacent to SF Airport Lodging Portfolio Renaissance Waverly Atlanta, GA 14 floors, 521 rooms and suites located in the Cobb/Galleria market of Atlanta San Francisco Airport Marriott Burlingame, CA |