Attached files
| file | filename |
|---|---|
| 8-K - 8-K - InvenTrust Properties Corp. | a12-13570_18k.htm |
| EX-99.2 - EX-99.2 - InvenTrust Properties Corp. | a12-13570_1ex99d2.htm |
Exhibit 99.1
|
|
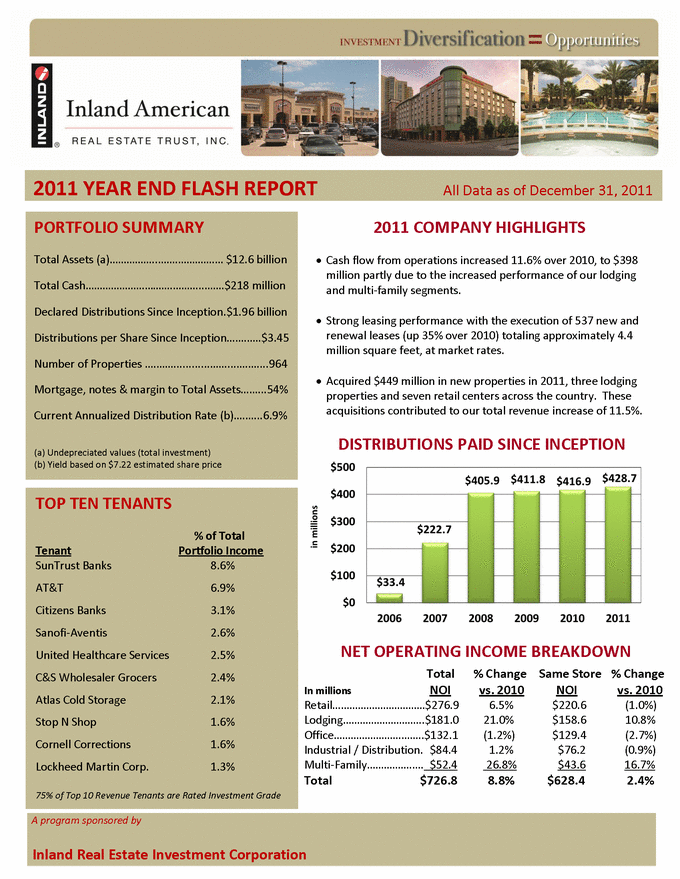
2011 YEAR END FLASH REPORT All Data as of December 31, 2011 PORTFOLIO SUMMARY Total Assets (a) $12.6 billion Total Cash $218 million Declared Distributions Since Inception $1.96 billion Distributions per Share Since Inception $3.45 Number of Properties Mortgage, notes & margin to Total Assets 54% Current Annualized Distribution Rate (b) 6.9% (a) Undepreciated values (total investment) (b) Yield based on $7.22 estimated share price TOP TEN TENANTS % of Total Tenant Portfolio Income SunTrust Banks 8.6% AT&T 6.9% Citizens Banks 3.1% Sanofi-Aventis 2.6% United Healthcare Services 2.5% C&S Wholesaler Grocers 2.4% Atlas Cold Storage 2.1% Stop N Shop 1.6% Cornell Corrections 1.6% Lockheed Martin Corp. 1.3% 75% of Top 10 Revenue Tenants are Rated Investment Grade 2011 COMPANY HIGHLIGHTS Cash flow from operations increased 11.6% over 2010, to $398 million partly due to the increased performance of our lodging and multi-family segments. Strong leasing performance with the execution of 537 new and renewal leases (up 35% over 2010) totaling approximately 4.4 million square feet, at market rates. Acquired $449 million in new properties in 2011, three lodging properties and seven retail centers across the country. These acquisitions contributed to our total revenue increase of 11.5%. DISTRIBUTIONS PAID SINCE INCEPTION NET OPERATING INCOME BREAKDOWN Total % Change Same Store % Change In millions NOI vs. 2010 NOI vs. 2010 6.5% $220.6 (1.0%) 21.0% $158.6 10.8% (1.2%) $129.4 (2.7%) Industrial / Distribution $84.4 1.2% $76.2 (0.9%) Multi-Family $52.4 26.8% $43.6 16.7% Total $726.8 8.8% $628.4 2.4% A program sponsored by Inland Real Estate Investment Corporation |
|
|
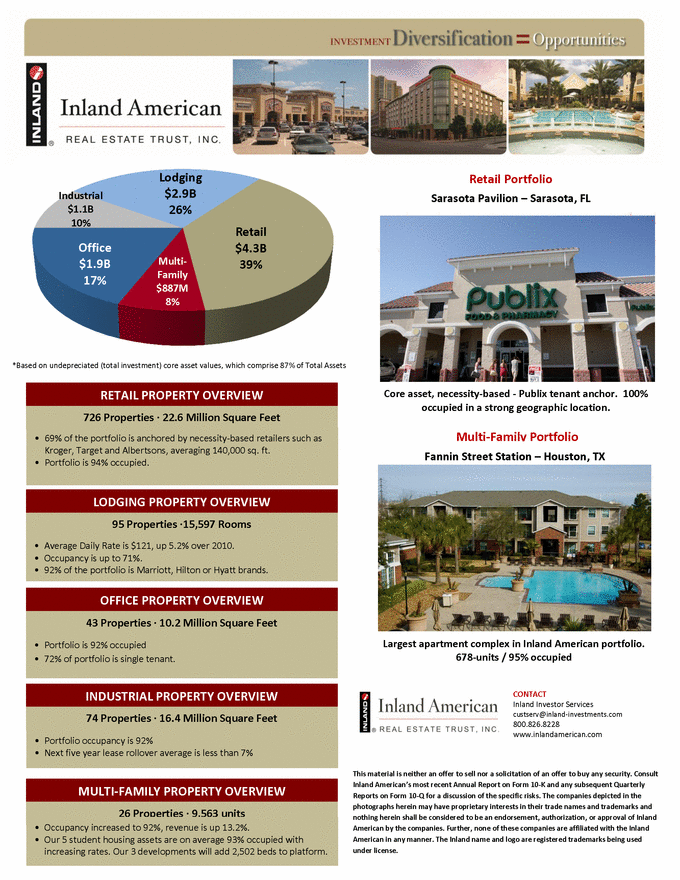
Retail $4.3B 39% Multi-Family $887M 8% Office $1.9B 17% Industrial $1.1B 10% Lodging $2.9B 26% *Based on undepreciated (total investment) core asset values, which comprise 87% of Total Assets RETAIL PROPERTY OVERVIEW 726 Properties 22.6 Million Square Feet 69% of the portfolio is anchored by necessity-based retailers such as Kroger, Target and Albertsons, averaging 140,000 sq. ft. Portfolio is 94% occupied. LODGING PROPERTY OVERVIEW 95 Properties 15,597 Rooms Average Daily Rate is $121, up 5.2% over 2010. Occupancy is up to 71%. 92% of the portfolio is Marriott, Hilton or Hyatt brands. INDUSTRIAL PROPERTY OVERVIEW 74 Properties 16.4 Million Square Feet Portfolio occupancy is 92% Next five year lease rollover average is less than 7% OFFICE PROPERTY OVERVIEW 43 Properties 10.2 Million Square Feet Portfolio is 92% occupied 72% of portfolio is single tenant. Retail Portfolio IDS Building Minneapolis, MN CONTACT Inland Investor Services custserv@inland-investments.com 800.826.8228 www.inlandamerican.com This material is neither an offer to sell nor a solicitation of an offer to buy any security. Consult Inland American’s most recent Annual Report on Form 10-K and any subsequent Quarterly Reports on Form 10-Q for a discussion of the specific risks. The companies depicted in the photographs herein may have proprietary interests in their trade names and trademarks and nothing herein shall be considered to be an endorsement, authorization, or approval of Inland American by the companies. Further, none of these companies are affiliated with the Inland American in any manner. The Inland name and logo are registered trademarks being used under license. MULTI-FAMILY PROPERTY OVERVIEW 26 Properties 9.563 units Occupancy increased to 92%, revenue is up 13.2%. Our 5 student housing assets are on average 93% occupied with increasing rates. Our 3 developments will add 2,502 beds to platform. Core asset, necessity-based - Publix tenant anchor. 100% occupied in a strong geographic location. Multi-Family Portfolio Fannin Street Station — Houston, TX Largest apartment complex in Inland American portfolio. 678-units / 95% occupied Sarasota Pavilion — Sarasota, FL |