Attached files
| file | filename |
|---|---|
| 8-K - GT ADVANCED TECHNOLOGIES INC. 8-K - GT Advanced Technologies Inc. | a50280590.htm |
| EX-99.1 - EXHIBIT 99.1 - GT Advanced Technologies Inc. | a50280590ex991.htm |
Exhibit 99.2
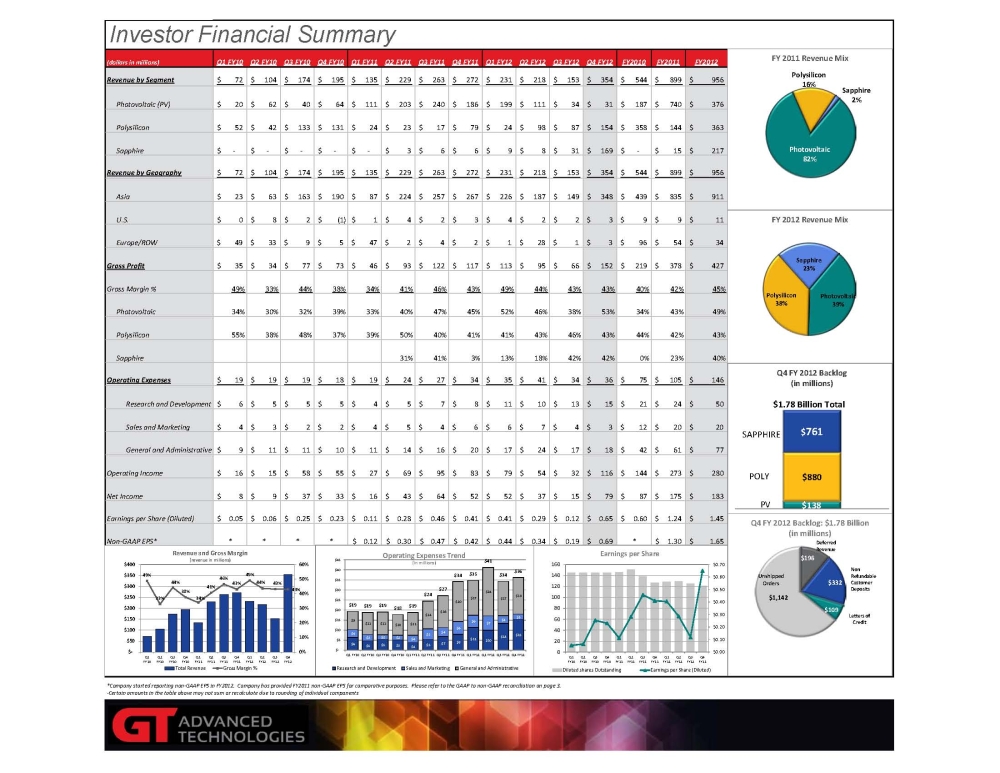
Investor Financial Summary (dollars in millions)Q1 FY10Q2 FY10Q3 FY10Q4 FY10Q1 FY11Q2 FY11Q3 FY11Q4 FY11Q1 FY12Q2 FY12Q3 FY12Q4 FY12FY2010FY2011FY2012Revenue by Segment72$ 104$ 174$ 195$ 135$ 229$ 263$ 272$ 231$ 218$ 153$ 354$ 544$ 899$ 956$ Photovoltaic (PV)20$ 62$ 40$ 64$ 111$ 203$ 240$ 186$ 199$ 111$ 34$ 31$ 187$ 740$ 376$ Polysilicon52$ 42$ 133$ 131$ 24$ 23$ 17$ 79$ 24$ 98$ 87$ 154$ 358$ 144$ 363$ Sapphire -$ -$ -$ -$ -$ 3$ 6$ 6$ 9$ 8$ 31$ 169$ -$ 15$ 217$ Revenue by Geography72$ 104$ 174$ 195$ 135$ 229$ 263$ 272$ 231$ 218$ 153$ 354$ 544$ 899$ 956$ Asia23$ 63$ 163$ 190$ 87$ 224$ 257$ 267$ 226$ 187$ 149$ 348$ 439$ 835$ 911$ U.S.0$ 8$ 2$ (1)$ 1$ 4$ 2$ 3$ 4$ 2$ 2$ 3$ 9$ 9$ 11$ Europe/ROW49$ 33$ 9$ 5$ 47$ 2$ 4$ 2$ 1$ 28$ 1$ 3$ 96$ 54$ 34$ Gross Profit35$ 34$ 77$ 73$ 46$ 93$ 122$ 117$ 113$ 95$ 66$ 152$ 219$ 378$ 427$ Gross Margin %49%33%44%38%34%41%46%43%49%44%43%43%40%42%45%Photovoltaic34%30%32%39%33%40%47%45%52%46%38%53%34%43%49%Polysilicon55 %38%48%37%39%50%40%41%41%43%46%43%44%42%43%Sapphire31%41%3%13%18%42%42%0%23%40%Operating Expenses19$ 19$ 19$ 18$ 19$ 24$ 27$ 34$ 35$ 41$ 34$ 36$ 75$ 105$ 146$ Research and Development6$ 5$ 5$ 5$ 4$ 5$ 7$ 8$ 11$ 10$ 13$ 15$ 21$ 24$ 50$ Sales and Marketing4$ 3$ 2$ 2$ 4$ 5$ 4$ 6$ 6$ 7$ 4$ 3$ 12$ 20$ 20$ General and Administrative9$ 11$ 11$ 10$ 11$ 14$ 16$ 20$ 17$ 24$ 17$ 18$ 42$ 61$ 77$ Operating Income16$ 15$ 58$ 55$ 27$ 69$ 95$ 83$ 79$ 54$ 32$ 116$ 144$ 273$ 280$ Net Income8$ 9$ 37$ 33$ 16$ 43$ 64$ 52$ 52$ 37$ 15$ 79$ 87$ 175$ 183$ Earnings per Share (Diluted)0.05$ 0.06$ 0.25$ 0.23$ 0.11$ 0.28$ 0.46$ 0.41$ 0.41$ 0.29$ 0.12$ 0.65$ 0.60$ 1.24$ 1.45$ Non-GAAP EPS*****0.12$ 0.30$ 0.47$ 0.42$ 0.44$ 0.34$ 0.19$ 0.69$ *1.30$ 1.65$ 15.937*Company started reporting non-GAAP EPS in FY2012. Company has provided FY2011 non-GAAP EPS for comparative purposes. Please refer to the GAAP to non-GAAP reconciliation on page 3.-Certain amounts in the table above may not sum or recalculate due to rounding of individual componentsFY 2012 Revenue Mix Sapphire 23% Polysilicon 38% Photovoltaic 39% 49% 33% 44% 38% 34% 41% 46% 43% 49% 44% 43% 43% 0% 10% 20% 30% 40% 50% 60% $- $50 $100 $150 $200 $250 $300 $350 $400 Q1 FY10 Q2 FY10 Q3 FY10 Q4 FY10 Q1 FY11 Q2 FY11 Q3 FY11 Q4 FY11 Q1 FY12 Q2 FY12 Q3 FY12 Q4 FY12 Revenue and Gross Margin (revenue in millions) Total Revenue Gross Margin % FY 2011 Revenue Mix Polysilicon 16% Photovoltaic 82% Sapphire 2% $0.00 $0.10 $0.20 $0.30 $0.40 $0.50 $0.60 $0.70 0 20 40 60 80 100 120 140 160 Q1 FY10 Q2 FY10 Q3 FY10 Q4 FY10 Q1 FY11 Q2 FY11 Q3 FY11 Q4 FY11 Q1 FY12 Q2 FY12 Q3 FY12 Q4 FY12 Earnings per Share Diluted shares Outstanding Earnings per Share (Diluted) $6 $5 $5 $5 $4 $5 $7 $8 $11 $10 $13 $15 $4 $3 $2 $2 $4 $5 $4 $6 $6 $7 $4 $3 $9 $11 $11 $10 $11 $14 $16 $20 $17 $24 $17 $18 $19 $19 $19 $18 $19 $24 $27 $34 $35 $41 $34 $36 $- $5 $10 $15 $20 $25 $30 $35 $40 $45 Q1 FY10 Q2 FY10 Q3 FY10 Q4 FY10 Q1 FY11 Q2 FY11 Q3 FY11 Q4 FY11 Q1 FY12 Q2 FY12 Q3 FY12 Q4 FY12 Operating Expenses Trend (in millions) Research and Development Sales and Marketing General and Administrative $138 $880 $761 Q4 FY 2012 Backlog (in millions) PV POLY SAPPHIRE $1.78 Billion Total $196 $332 $109 $1,142 Q4 FY 2012 Backlog: $1.78 Billion (in millions) Deferred Revenue Letters of Credit Non Refundable Customer Deposits Unshipped Orders
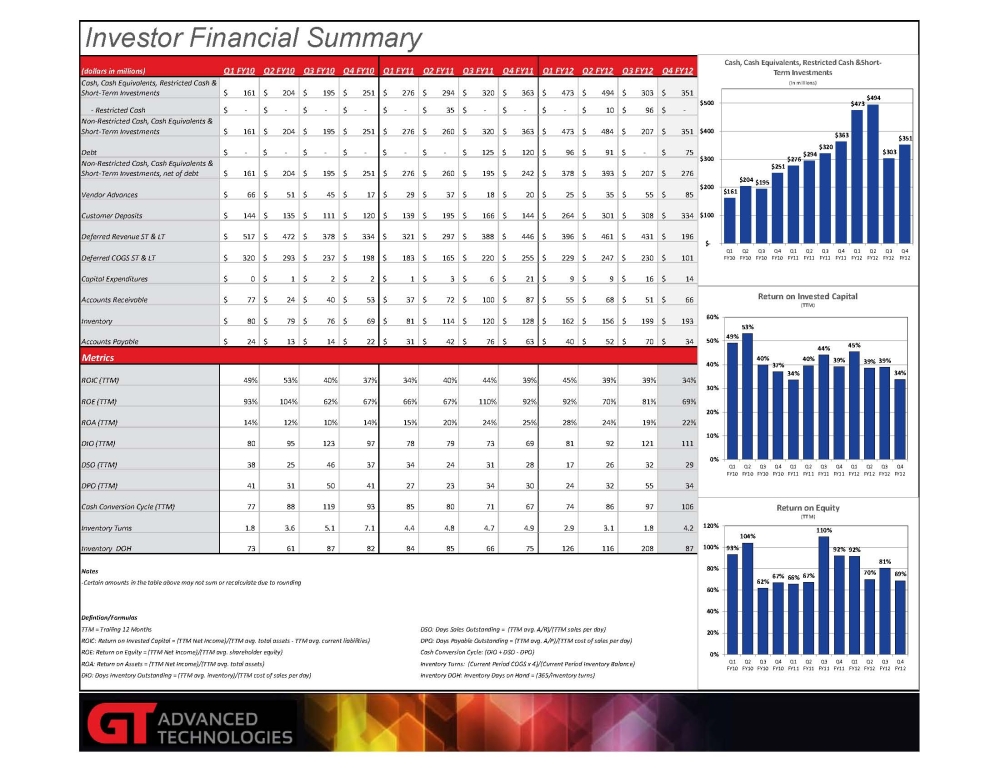
Investor Financial Summary(dollars in millions)Q1 FY10Q2 FY10Q3 FY10Q4 FY10Q1 FY11Q2 FY11Q3 FY11Q4 FY11Q1 FY12Q2 FY12Q3 FY12Q4 FY12Cash, Cash Equivalents, Restricted Cash & Short-Term Investments161$ 204$ 195$ 251$ 276$ 294$ 320$ 363$ 473$ 494$ 303$ 351$ 1,254 - Restricted Cash-$ -$ -$ -$ -$ 35$ -$ -$ -$ 10$ 96$ -$ 35 Non-Restricted Cash, Cash Equivalents & Short-Term Investments161$ 204$ 195$ 251$ 276$ 260$ 320$ 363$ 473$ 484$ 207$ 351$ 1,219 Debt-$ -$ -$ -$ -$ -$ 125$ 120$ 96$ 91$ -$ 75$ 245 Non-Restricted Cash, Cash Equivalents & Short-Term Investments, net of debt161$ 204$ 195$ 251$ 276$ 260$ 195$ 242$ 378$ 393$ 207$ 276$ Vendor Advances66$ 51$ 45$ 17$ 29$ 37$ 18$ 20$ 25$ 35$ 55$ 85$ 104 Customer Deposits144$ 135$ 111$ 120$ 139$ 195$ 166$ 144$ 264$ 301$ 308$ 334$ 645 Deferred Revenue ST & LT517$ 472$ 378$ 334$ 321$ 297$ 388$ 446$ 396$ 461$ 431$ 196$ 1,452 Deferred COGS ST & LT320$ 293$ 237$ 198$ 183$ 165$ 220$ 255$ 229$ 247$ 230$ 101$ 823 Capital Expenditures0$ 1$ 2$ 2$ 1$ 3$ 6$ 21$ 9$ 9$ 16$ 14$ 31 Accounts Receivable77$ 24$ 40$ 53$ 37$ 72$ 100$ 87$ 55$ 68$ 51$ 66$ 296 Inventory80$ 79$ 76$ 69$ 81$ 114$ 120$ 128$ 162$ 156$ 199$ 193$ 442 Accounts Payable24$ 13$ 14$ 22$ 31$ 42$ 76$ 63$ 40$ 52$ 70$ 34$ 213 MetricsROIC (TTM)49%53%40%37%34%40%44%39%45%39%39%34%2 ROE (TTM)93%104%62%67%66%67%110%92%92%70%81%69%3 ROA (TTM)14%12%10%14%15%20%24%25%28%24%19%22%DIO (TTM)80 95 123 97 78 79 73 69 81 92 121 111 DSO (TTM)38 25 46 37 34 24 31 28 17 26 32 29 DPO (TTM)41 31 50 41 27 23 34 30 24 32 55 34 Cash Conversion Cycle (TTM)77 88 119 93 85 80 71 67 74 86 97 106 Inventory Turns1.8 3.6 5.1 7.1 4.4 4.8 4.7 4.9 2.9 3.1 1.8 4.2 Inventory DOH73 61 87 82 84 85 66 75 126 116 208 87 Notes-Certain amounts in the table above may not sum or recalculate due to roundingDefintion/FormulasTTM = Trailing 12 MonthsDSO: Days Sales Outstanding = (TTM avg. A/R)/(TTM sales per day)ROIC: Return on Invested Capital = (TTM Net Income)/(TTM avg. total assets - TTM avg. current liabilities)DPO: Days Payable Outstanding = (TTM avg. A/P)/(TTM cost of sales per day)ROE: Return on Equity = (TTM Net Income)/(TTM avg. shareholder equity)Cash Conversion Cycle: (DIO + DSO - DPO)ROA: Return on Assets = (TTM Net Income)/(TTM avg. total assets)Inventory Turns: (Current Period COGS x 4)/(Current Period Inventory Balance)DIO: Days Inventory Outstanding = (TTM avg. inventory)/(TTM cost of sales per day)Inventory DOH: Inventory Days on Hand = (365/inventory turns) $161 $204 $195 $251 $276 $294 $320 $363 $473 $494 $303 $351 $- $100 $200 $300 $400 $500 Q1 FY10 Q2 FY10 Q3 FY10 Q4 FY10 Q1 FY11 Q2 FY11 Q3 FY11 Q4 FY11 Q1 FY12 Q2 FY12 Q3 FY12 Q4 FY12 Cash, Cash Equivalents, Restricted Cash &Short-Term Investments (in millions) 49% 53% 40% 37% 34% 40% 44% 39% 45% 39% 39% 34% 0% 10% 20% 30% 40% 50% 60% Q1 FY10 Q2 FY10 Q3 FY10 Q4 FY10 Q1 FY11 Q2 FY11 Q3 FY11 Q4 FY11 Q1 FY12 Q2 FY12 Q3 FY12 Q4 FY12 Return on Invested Capital (TTM) 93% 104% 62% 67% 66% 67% 110% 92% 92% 70% 81% 69% 0% 20% 40% 60% 80% 100% 120% Q1 FY10 Q2 FY10 Q3 FY10 Q4 FY10 Q1 FY11 Q2 FY11 Q3 FY11 Q4 FY11 Q1 FY12 Q2 FY12 Q3 FY12 Q4 FY12 Return on Equity (TTM)
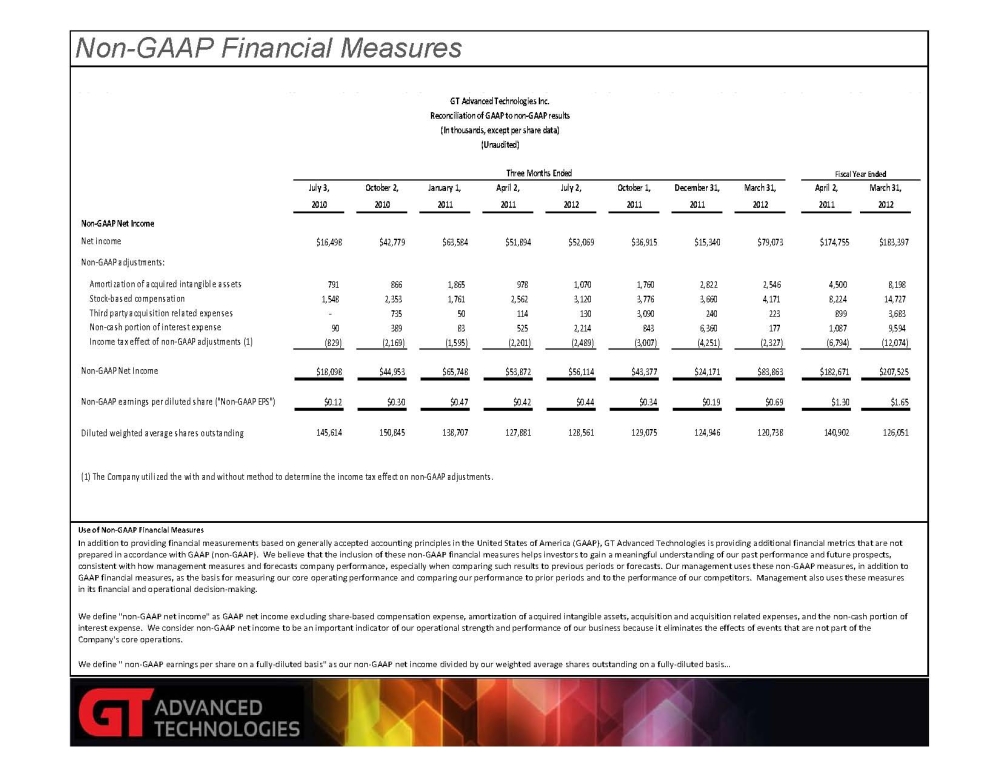
Non-GAAP Financial MeasuresUse of Non-GAAP Financial Measures In addition to providing financial measurements based on generally accepted accounting principles in the United States of America (GAAP), GT Advanced Technologies is providing additional financial metrics that are not prepared in accordance with GAAP (non-GAAP). We believe that the inclusion of these non-GAAP financial measures helps investors to gain a meaningful understanding of our past performance and future prospects, consistent with how management measures and forecasts company performance, especially when comparing such results to previous periods or forecasts. Our management uses these non-GAAP measures, in addition to GAAP financial measures, as the basis for measuring our core operating performance and comparing our performance to prior periods and to the performance of our competitors. Management also uses these measures in its financial and operational decision-making. We define "non-GAAP net income" as GAAP net income excluding share-based compensation expense, amortization of acquired intangible assets, acquisition and acquisition related expenses, and the non-cash portion of interest expense. We consider non-GAAP net income to be an important indicator of our operational strength and performance of our business because it eliminates the effects of events that are not part of the Company's core operations. We define " non-GAAP earnings per share on a fully-diluted basis" as our non-GAAP net income divided by our weighted average shares outstanding on a fully-diluted basis... July 3,October 2,January 1,April 2,July 2,October 1,December 31,March 31,April 2,March 31,2010201020112011201220112011201220112012Non-GAAP Net IncomeNet income$16,498$42,779$63,584$51,894$52,069$36,915$15,340$79,073$174,755$183,397Non-GAAP adjustments:Amortization of acquired intangible assets791 866 1,865 978 1,070 1,760 2,822 2,546 4,500 8,198 Stock-based compensation1,548 2,353 1,761 2,562 3,120 3,776 3,660 4,171 8,224 14,727 Third party acquisition related expenses- 735 50 114 130 3,090 240 223 899 3,683 Non-cash portion of interest expense90 389 83 525 2,214 843 6,360 177 1,087 9,594 Income tax effect of non-GAAP adjustments (1)(829) (2,169) (1,595) (2,201) (2,489) (3,007) (4,251) (2,327) (6,794) (12,074) Non-GAAP Net Income$18,098$44,953$65,748$53,872$56,114$43,377$24,171$83,863$182,671$207,525Non-GAAP earnings per diluted share ("Non-GAAP EPS")$0.12$0.30$0.47$0.42$0.44$0.34$0.19$0.69$1.30$1.65Diluted weighted average shares outstanding145,614150,845138,707127,881128,561129,075124,946120,738140,902126,051(1) The Company utilized the with and without method to determine the income tax effect on non-GAAP adjustments.GT Advanced Technologies Inc.Reconciliation of GAAP to non-GAAP results(In thousands, except per share data)(Unaudited)Three Months EndedFiscal Year Ended