Attached files
| file | filename |
|---|---|
| EX-31.2 - EXHIBIT 31.2 - GT Advanced Technologies Inc. | a2199027zex-31_2.htm |
| EX-23.1 - EXHIBIT 23.1 - GT Advanced Technologies Inc. | a2199027zex-23_1.htm |
| EX-32.1 - EXHIBIT 32.1 - GT Advanced Technologies Inc. | a2199027zex-32_1.htm |
| EX-31.1 - EXHIBIT 31.1 - GT Advanced Technologies Inc. | a2199027zex-31_1.htm |
| EX-21.1 - EXHIBIT 21.1 - GT Advanced Technologies Inc. | a2199027zex-21_1.htm |
| EX-10.71 - EXHIBIT 10.71 - GT Advanced Technologies Inc. | a2199027zex-10_71.htm |
Use these links to rapidly review the document
TABLE OF CONTENTS
Item 8. Financial Statements and Supplementary Data
UNITED STATES
SECURITIES AND EXCHANGE COMMISSION
Washington, D.C. 20549
Form 10-K
ý |
ANNUAL REPORT PURSUANT TO SECTION 13 OR 15(d) OF THE SECURITIES EXCHANGE ACT OF 1934 |
|
For the fiscal year ended April 3, 2010 |
||
or |
||
o |
TRANSITION REPORT PURSUANT TO SECTION 13 OR 15(d) OF THE SECURITIES EXCHANGE ACT OF 1934 |
|
For the transition period from to |
||
Commission file number: 001-34133
GT Solar International, Inc.
(Exact name of registrant as specified in its charter)
| Delaware (State or other jurisdiction of incorporation or organization) |
03-0606749 (I.R.S. Employer Identification No.) |
243 Daniel Webster Highway
Merrimack, New Hampshire 03054
(Address of principal executive offices, including zip code)
(603) 883-5200
(Registrant's telephone number, including area code)
Securities registered pursuant to Section 12(b) of the Act:
| Title of each class | Name of each exchange on which registered | |
|---|---|---|
| Common stock, $0.01 par value | The NASDAQ Global Select Market |
Securities registered pursuant to Section 12(g) of the Act: None
Indicate by check mark if the registrant is a well-known seasoned issuer, as defined in Rule 405 of the Securities Act. Yes o No ý
Indicate by check mark if the registrant is not required to file reports pursuant to Section 13 or Section 15(d) of the Exchange Act. Yes o No ý
Indicate by check mark whether the registrant: (1) has filed all reports required to be filed by Section 13 or 15(d) of the Securities Exchange Act of 1934 during the preceding 12 months (or for such shorter period that the registrant was required to file such reports) and (2) has been subject to such filing requirements for the past 90 days. Yes ý No o
Indicate by check mark whether the registrant has submitted electronically and posted on its corporate Web site, if any, every Interactive Data File required to be submitted and posted pursuant to Rule 405 of Regulation S-T during the preceding 12 months (or for such shorter period that the registrant was required to submit and post such files). Yes o No o
Indicate by check mark if disclosure of delinquent filers pursuant to Item 405 of Regulation S-K is not contained herein and will not be contained, to the best of registrant's knowledge, in definitive proxy or information statements incorporated by reference in Part III of this Form 10-K or any amendment to this Form 10-K. ý
Indicate by check mark whether the registrant is a large accelerated filer, an accelerated filer, a non-accelerated filer, or a smaller reporting company. See the definitions of "large accelerated filer," "accelerated filer" and "smaller reporting company" in Rule 12b-2 of the Exchange Act. (Check one):
| Large accelerated filer o | Accelerated filer ý | Non-accelerated filer o (Do not check if a smaller reporting company) |
Smaller reporting company o |
Indicate by check mark whether the registrant is a shell company (as defined in Rule 12b-2 of the Exchange Act). Yes o No ý
The aggregate market value of the registrant's common stock, $0.01 par value per share, held by non-affiliates of the registrant on September 26, 2009, the last business day of the registrant's most recently completed second fiscal quarter, was approximately $212.0 million (based on the closing sales price of the registrant's common stock on that date). As of May 28, 2010, 143,974,904 shares of the registrant's common stock, $0.01 par value per share, were issued and outstanding.
DOCUMENTS INCORPORATED BY REFERENCE
The information required by Part III of this Annual Report on Form 10-K, to the extent not set forth herein, is incorporated by reference from the registrant's definitive proxy statement relating to the Annual Meeting of Shareholders to be held in 2010, which will be filed with the Securities and Exchange Commission within 120 days after the end of the fiscal year to which this Annual Report on Form 10-K relates.
GT Solar International, Inc.
Form 10-K
Year Ended April 3, 2010
TABLE OF CONTENTS
2
Cautionary Statements Concerning Forward-Looking Statements
This Annual Report on Form 10-K contains "forward-looking statements" that involve risks and uncertainties, as well as assumptions that, if they never materialize or prove incorrect, could cause our results to differ materially from those expressed or implied by such forward-looking statements. The statements contained in this Annual Report on Form 10-K that are not purely historical are forward-looking statements within the meaning of Section 27A of the Securities Act of 1933, as amended, and Section 21E of the Securities Exchange Act of 1934, as amended. Forward-looking statements are often identified by the use of words such as, but not limited to, "anticipate," "believe," "continue," "could," "estimate," "expect," "intend," "may," "will," "plan," "target," "continue," and similar expressions or variations intended to identify forward-looking statements. These statements are based on the beliefs and assumptions of our management based on information currently available to management. Such forward-looking statements are subject to risks, uncertainties and other important factors that could cause actual results and the timing of certain events to differ materially from future results expressed or implied by such forward-looking statements. Factors that could cause or contribute to such differences include, but are not limited to, the following factors and any other factors discussed under the heading titled "Risk Factors" included elsewhere in this Annual Report on Form 10-K:
- •
- the potential adverse impact of general economic conditions on demand for our
products;
- •
- current future credit and financial market
conditions;
- •
- the failure of amounts in our order backlog to result in actual revenue or to translate into
profits;
- •
- our dependence on a small number of customers;
- •
- our dependence on the sale of a limited number of
products;
- •
- our dependence on a limited number of third party
suppliers;
- •
- product liability claims and/or claims in relation to third party
equipment;
- •
- loss of any of our management team or our inability to attract and retain key employees or
integrate new employees into our management team;
- •
- our inability to attract, train and retain technical
personnel;
- •
- our inability to protect our intellectual property and the possibility of litigation to protect
our intellectual property rights;
- •
- risks associated with the international nature of our business, including of unfavorable
political, regulatory, labor and tax conditions in foreign countries;
- •
- claims relating to the infringement, misappropriation or other violation of proprietary
manufacturing expertise, technological innovation and other intellectual property rights;
- •
- compliance with legal systems in other countries in which we offer and sell our
products;
- •
- commercial, jurisdictional and legal risks associated with our business in China and the increase
in those risks as we expand our operations in China;
- •
- concentration of credit risk related to our cash equivalents and short term
investments;
- •
- our inability to comply with covenants in our credit
facilities;
- •
- our exposure to warranty claims;
- •
- our exposure to exchange rate fluctuations;
- •
- the effect of increases in interest rates or the reduced availability of financing on demand for our products;
3
- •
- the securities class action lawsuits relating to our initial public
offering;
- •
- the effect that the interpretation of existing or new accounting pronouncements could have on our
revenue recognition and operating results;
- •
- our lack of ownership of the technology underlying our CVD
reactor;
- •
- factors that impact revenue recognition of our polysilicon business, some of which are beyond our
control;
- •
- cyclicality in the market for polysilicon and variation in demand for products sold in our
polysilicon business;
- •
- direct and indirect competition for our polysilicon production
equipment;
- •
- our reliance on a limited number of suppliers and manufacturers for our polysilicon
business;
- •
- competition from other manufacturers of photovoltaic
products;
- •
- the loss of or changes in government subsidiaries or economic incentives for on-grid
solar electricity applications;
- •
- existing regulations and policies or changes to regulations and policies relating to the electric
utility industry;
- •
- inability of the photovoltaic industry to compete successfully with conventional power generation
or other sources of renewable energy; and
- •
- technological changes in the photovoltaic industry that render existing products and technologies uncompetitive or obsolete.
The foregoing factors should not be construed as exhaustive and should be read in conjunction with the other statements that are included under the heading "Risk Factors" included in this Annual Report on Form 10-K. Forward-looking statements speak only as of the date of this report. We undertake no obligation to publicly update or review any forward-looking statements to reflect events or circumstances after the date of such statements.
4
Our Company
GT Solar International, Inc., through its subsidiaries (referred to collectively herein as "we," "us" and "our") is a leading global provider of polysilicon production technology, crystalline ingot growth systems and related photovoltaic manufacturing services for the solar industry. Our customers include several of the world's largest solar companies as well as companies in the chemical industry.
Our principal products are:
- •
- Chemical vapor deposition (CVD) reactors and related equipment used to produce polysilicon, the key raw material used in
silicon-based solar wafers and cells; and
- •
- Directional solidification systems (DSS) furnaces and related equipment used to cast multicrystalline ingots by melting and cooling polysilicon in a precisely controlled process. These ingots are used to make photovoltaic (PV) wafers which are, in turn, used to make solar cells.
Our business was founded in 1994. Effective January 1, 2006, our business was acquired (the "Acquisition") by GT Solar Holdings, LLC, a newly formed company controlled by investment funds affiliated with G3W Ventures LLC, or "G3W", a private equity investment firm focused on the energy sector, and Oaktree Capital Management, L.P., or "OCM", a global alternative and non-traditional investment manager. We use the term "Predecessor" to refer to the operations of our predecessor for accounting purposes, GT Equipment Technologies, Inc. (now known as GT Solar Incorporated), for periods prior to the Acquisition by GT Solar Holdings, LLC on January 1, 2006 and the term "GT Solar" to refer to us with respect to our results of operations for periods following the Acquisition.
GT Solar International, Inc. was originally incorporated in Delaware in September 2006. On September 27, 2006, we completed an internal reorganization through which GT Solar International, Inc. became the parent company of GT Solar Incorporated, our principal operating subsidiary.
In July 2008, we completed an initial public offering of 30,300,000 shares of common stock by GT Solar Holdings, LLC. In March 2010, we completed a secondary public offering of 28,750,000 shares of common stock by GT Solar Holdings, LLC.
Industry Overview
Today, the majority of the world's electricity supply is generated by fossil fuels such as oil, coal and natural gas. Volatile global energy prices, increasing demand for electricity, particularly in developing economies, growing environmental awareness of the consequences of fossil fuel-based energy sources and the desire for energy security are driving the growth of renewable energy sources such as solar systems. Solar systems are used in industrial, commercial and residential applications to convert sunlight directly into electricity. Today, electricity costs generated from solar PV energy are higher than electricity generated by traditional energy sources. To offset the higher costs associated with solar energy and to encourage the adoption of alternative energy supplies, governments around the world have implemented various tax credits and other incentives.
According to Solarbuzz, the global PV market, as measured by total customer installations, grew at a compound annual growth rate of 50% between 2005 and 2009. The global economic recession which began in 2008 slowed expansion of the solar industry through the middle of 2009 when the industry began to experience an increase in demand. According to Solarbuzz, annual PV installations at end-user sites worldwide for 2009 were an estimated 7,300 megawatts (MW) with global PV industry revenues of approximately $38.5 billion for 2009. In its "Green World" scenario, Solarbuzz estimates
5
that in 2014 the annual PV installations at end-user sites may reach approximately 24,700 MW with global PV industry revenues of approximately $78 billion for 2009.
The anticipated long-term growth of the solar PV industry is expected to increase investment in manufacturing capacity by polysilicon producers and solar manufacturing companies. Total capital expenditures associated with new manufacturing capacity for the production of mono-crystalline and multicrystalline silicon PV products in 2009 was approximately $17.0 billion, according to Solarbuzz, of which approximately $10.0 billion was spent on new polysilicon production capacity. In its "Green World" scenario, Solarbuzz estimates that, excluding emerging technologies, approximately 173,000 metric tons (MT) of polysilicon production capacity will be added from 2009 to 2014.
Information regarding markets, market size, market growth rates, forecasts and other industry data contained in this Annual Report on Form 10-K consists of estimates based on data and reports compiled by professional organizations, industry consultants and analysts, on data from other external sources, and on our knowledge and internal surveys of the solar and polysilicon industries. Marketbuzz 2010, an annual report dated March 2010 prepared by Solarbuzz LLC, an international solar energy market research and consulting company, was the primary source for third party industry data and forecasts.
In view of the emerging nature of the solar and polysilicon industries and the absence of publicly available information on most of the PV equipment and polysilicon manufacturers (including, without limitation, their existing production capacity, business plans and strategies), the estimates for the size of the solar and polysilicon markets and their projected growth rates set out in this Annual Report on Form 10-K should be considered with caution. Certain market share information and other statements in this Annual Report on Form 10-K regarding the solar and polysilicon industries and our position relative to our competitors is not based on published statistical data or information obtained by independent third parties. Rather, such information and statements reflect our management's best estimates based upon information obtained from trade and industry organizations and associations and other contacts within the solar and polysilicon industries. While we believe our internal estimates to be reasonable, they have not been verified by independent sources.
Manufacturing Trends
Manufacturers across the various segments comprising the PV manufacturing process are lowering their manufacturing costs and improving cell efficiency in an effort to make solar generated electricity more price competitive with electricity generated from traditional sources. According to the Solarbuzz Marketbuzz 2010 report, solar module prices have fallen from an average of $3.30 per watt in the fourth quarter of 2008 to an estimated $2.14 per watt in the first quarter of 2010. In the absence of a significant reduction in the cost of electricity generated from traditional sources, we believe that end user demand for solar energy will increase as production costs for solar energy decrease.
China continues to be one of the fastest growing global regions for PV manufacturing and polysilicon production. According to the Solarbuzz Marketbuzz 2010 report, at the end of 2009, 65% of the world's PV silicon wafer production capacity was located in China (including Taiwan) , up from 59% in 2008. Economic incentives offered by the Chinese government and the availability of low cost labor have accelerated the expansion of PV manufacturing capacity within the country. As a result, demand for PV capital equipment into the region is increasing and demand in traditional solar PV capital equipment markets such as Europe is decreasing. As a result of this trend, some capital equipment suppliers to the global PV manufacturing industry are choosing to locate manufacturing and operations to Asia. In the fiscal year ended April 3, 2010, 81% of our revenue was from existing or new customers in Asia, with 63% generated from customers in China.
We also believe that the desire to reduce overall cost is driving the growth of PV manufacturing and polysilicon production in China and is creating a trend towards PV manufacturers vertically
6
integrating and expanding manufacturing capacity. Larger, better capitalized manufacturers improve their competitive position by controlling a greater range of the PV manufacturing process. The expanded scale of their operations enhances their ability to control costs, preserve margins, and manage through the volatility in raw material prices. We have provided equipment to four of the five largest PV manufacturers in China based on wafer manufacturing capacity, according to Solarbuzz data.
The PV Manufacturing Process
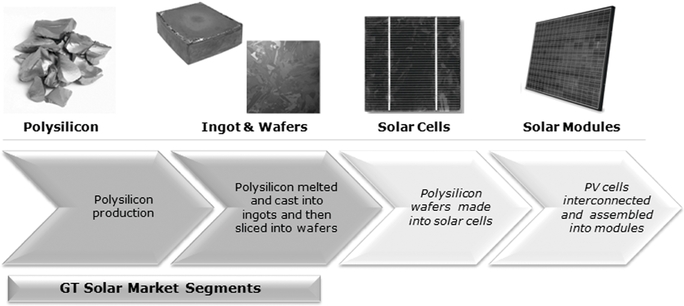
The production of multicrystalline-based PV modules includes a number of manufacturing steps. The first step involves the production of raw polysilicon using one of several production techniques. Raw polysilicon is then cast into a multicrystalline ingot in a DSS furnace. The ingot then moves into the wafering operation where it is sawed into bricks and the bricks are then sawed into thin wafers. Next the wafers are processed into solar cells through a series of etching, doping, coating and electrical contact processes. The next step involves interconnecting and assembling solar cells into solar modules. Finally, solar modules along with other system components such as batteries and inverters are installed as solar power systems.
We design and sell capital equipment and related services used in both the polysilicon production and ingot production segments of the PV manufacturing process.
Our Business Segments
Polysilicon Business
Polysilicon is a highly purified form of silicon that is a key raw material used to produce solar wafers. The same material is also used to make semiconductor wafers for microelectronic applications. Our polysilicon business offers CVD reactors and related equipment engineering services such as trichlorosilane (TCS) and silane engineering services to existing polysilicon producers and new market entrants. Our CVD reactors utilize the non-proprietary Siemens process, a widely used and proven polysilicon production process which has been in existence for nearly fifty years. In July 2006, our polysilicon business received its first order for CVD reactors from OCI Company, Ltd. (formerly DC Chemical Co., Ltd.,) a leading Korean chemical company. From July 31, 2007 through April 3, 2010 we shipped over 170 CVD reactors representing over 45,000 metric tons (MT) of polysilicon capacity.
7
CVD reactors—We sell CVD reactors that produce polysilicon. We market our CVD reactors under the names SDR200 and SDR300. We began offering these products commercially in April 2006. Our SDR200 CVD reactors are producing at levels of approximately 200 MT of polysilicon annually and our SDR300 CVD reactors, which were introduced during our fiscal year ended March 31, 2008, are producing at levels of approximately 300 MT of polysilicon annually.
Customers for our polysilicon products include chemical companies and power generation companies that are entering the polysilicon market and solar wafer and cell manufacturers that are vertically integrating the production of polysilicon into their operations to become more cost competitive and meet their own production needs. All of the components for our CVD reactors are manufactured by third parties using our designs. Our personnel focus on product design, engineering services and project management providing technical know-how and process development related to the commissioning and production of polysilicon.
Polysilicon services, parts and other—In addition to CVD reactors for polysilicon manufacturing, we also provide technology and engineering services for the commissioning, start-up and optimization of our equipment and technology. We provide the basic engineering packages and process licenses for the production and purification of trichlorosilane and silane. We recently began offering hydrochlorination technology which lowers the capital costs and power consumption of polysilicon production. Hydrochlorination technology eliminates the need for silicon tetrachloride converters which are required when using other technology. Our personnel also support the commissioning and startup of our equipment and technology.
Photovoltaic Business
The primary focus of our PV business includes the manufacture and sales of DSS crystallization furnaces and ancillary equipment required in the operation of DSS crystallization furnaces to cast multicrystalline silicon ingots. We believe we have established a leading position in the market for specialized furnace technology for the production of multicrystalline solar wafers. From April 1, 2005 through April 3, 2010, we shipped over 1,450 DSS crystallization furnaces representing approximately 7 gigawatts of ingot production capacity.
DSS crystallization furnaces—Our DSS furnace is a specialized furnace used to melt polysilicon and cast multicrystalline ingots. Polysilicon is placed into a quartz crucible and the crucible is then loaded into the chamber of the DSS furnace where it is cast into multicrystalline ingots under precise heating and cooling conditions. Multicrystalline ingots are used to produce solar wafers, which ultimately become solar cells. Solar cells made from multicrystalline wafers represented approximately 46% of all solar cells produced in 2009 according to Solarbuzz. Our DSS crystallization furnaces are capable of applying precise incremental temperature changes, which is critical to forming quality ingots required for high efficiency solar cells. We have developed proprietary control software systems to automate the operation of the furnace during all stages of the crystal growth process. Our DSS furnaces share a common architecture, which allows customers to efficiently upgrade systems thus protecting their investment and increasing their return on investment. We market our DSS crystallization furnaces under the names DSS240, DSS450, and DSS450HP.
All of the components and assemblies for our DSS furnaces are manufactured by third parties using our designs. Our manufacturing personnel focus on final assembly, integration and testing of the DSS furnace prior to shipping the product to the customer. We also provide engineering and product design, quality control, process engineering and engineering services related to the operation of our DSS furnaces.
Ancillary equipment—Our largest capacity DSS furnaces, the DSS450 and DSS450HP are capable of producing ingots that weigh up to 450 kilograms. Our ancillary equipment provides operators with
8
material handling assistance during the preparation of the crucible before it is loaded with silicon and during the loading and unloading of the crucible into the DSS furnace chamber at the start of the growth process and out of the DSS furnace chamber at the conclusion of the ingot growth process. Our ancillary equipment includes crucible coating stations, crucible manipulators, extraction tools and other material handling systems required to safely transport material during the ingot growth process. We report ancillary equipment revenue as other PV equipment.
Photovoltaic parts and services—The use of our products requires substantial technical know-how and many of our customers rely on us to design and optimize their production processes as well as train their employees in the use of our equipment. We sell replacement parts and consumables used in our DSS furnaces and other PV equipment. We also offer a range of services in connection with the sale of equipment, including facility design, equipment installation and integration, technical training and manufacturing process optimization. We typically charge for these services separately from the price of our equipment. As the number of our installed DSS crystallization furnaces continues to expand, we believe that sales of upgrades, parts and services will grow as well. We report revenue from PV parts and services as PV services, parts and other.
Turnkey integration services—We offer complete turnkey integration services, using third party wafer, cell and module production equipment designed to produce a specified level of output. These services are sold to new market entrants in connection with the construction of new PV manufacturing facilities. Most of our turnkey revenues have historically been from sales of wafer production lines, which provide additional sales opportunities for our DSS crystallization furnaces. We report turnkey revenue, exclusive of the DSS units, as other PV equipment. Our market for turnkey services has substantially decreased in recent years due to the maturity of the industry. As our activity in this area has correspondingly decreased, we have limited our marketing and sales efforts to identifying only highly qualified prospects that are well capitalized. We are reviewing our turnkey integration services and our plans with regards to this business will depend on the success of our current marketing efforts.
Our Competitive Strengths
We believe that our competitive strengths include:
- •
- Large and growing presence in China, a major growth market for solar manufacturing—Today, many of the world's leading solar manufacturing companies are based in China (including Taiwan), which according to Solarbuzz, accounted for approximately 65% of the world's solar wafer manufacturing capacity in 2009. We have provided equipment to four of the top five leading PV manufacturers in China based on wafer manufacturing capacity, according to Solarbuzz data.
- •
- Leading market position in crystal growth equipment for the multicrystalline solar industry—We believe our DSS crystallization furnaces are the most widely used furnaces for casting multicrystalline ingots in the solar industry. Since the introduction of our DSS240 in 2005, we have shipped over 1,450 furnaces to customers worldwide, the majority of which were to
We have been doing business in China since 2002 and are continuing to expand our base of operations to better serve the growing number of our China-based customers. In September 2009, we opened our Shanghai production facility to provide spare parts inventory, a demo and training center and other customer service capabilities for our Asia-based customers. We are also establishing our new Asia subsidiary, based in Hong Kong, which will become our new Asia headquarters. We expect this new facility to be operational in 2010. We believe that our relationships with leading Chinese solar companies and our expanding base of operations in China will enhance our ability to compete against the lower cost Chinese PV capital equipment companies in our markets.
9
- •
- Recognized supplier to new entrants to the polysilicon
industry—Our polysilicon production technology is recognized for its ability to produce very high quality polysilicon at a low cost per kilogram. Our first
commissioned new polysilicon production facilities was for OCI Company, Ltd (formerly DC Chemical Co. Ltd.), a large South Korean chemical company. In its "Green World" scenario,
Solarbuzz estimates that from 2009 to 2014, at the low end of its forecasts and excluding emerging technologies, approximately 173,000 MT of polysilicon production capacity will be added by existing
producers and new entrants. As one of a small number of companies providing CVD reactors commercially, we believe we are well positioned to successfully compete for these opportunities.
- •
- Supplier of equipment to many of the world's leaders in the solar
industry—We have been providing manufacturing equipment to the solar industry for over 14 years and have supplied equipment to many of the world's leading
polysilicon, solar wafer, cell and module manufacturers, including OCI Company, Ltd, (formerly DC Chemical Co., Ltd.), LDK Solar Co., Ltd., (LDK), Baoding Tianwei
Yingli New Energy Resources Co., Ltd. (Yingli), Changzhou Trina Solar Energy Co., Ltd. (Trina) AG, and GCL—Poly Energy Holdings Limited. We believe our customer
relationships will support continued growth in our business.
- •
- Large installed base—We believe our installed base of DSS
units and other PV equipment promotes recurring sales of additional equipment because of the high costs associated with changing equipment suppliers. In addition, we believe our large and growing
installed base will support higher sales of parts and service in the future as our customers' equipment ages.
- •
- Outsourced manufacturing model—Our manufacturing model is
different from many capital equipment manufacturers in that we outsource most of the components used in our PV equipment and the manufacturing of our polysilicon equipment. All of the components of
our polysilicon products are shipped directly from our qualified vendors to the customer installation site. Components for our DSS crystallization furnaces are shipped to our facility in Merrimack,
New Hampshire, where they are integrated into the final system prior to shipping to the customer. This model results in a highly flexible cost structure, modest working capital and physical plant
requirements and a relatively small number of manufacturing employees. Our flexible model provides a strategic advantage during downward market swings because it creates a low cost structure for our
operations.
- •
- Strong balance sheet with no debt—Our strong financial position allows us to use our cash flows from operations on strategic initiatives such as investments in new products or services or other growth opportunities rather than on debt service. Additionally, we believe that our liquid working capital position is important due to the volatility that has occurred and may occur in the future in the solar industry.
manufacturers in China. Our furnaces produce high quality crystalline ingots with high reliability and low cost of ownership.
Our Growth Strategies
The significant components of our strategy include the following:
- •
- Better serve our customers by expanding our customer service and sales operations in Asia—Approximately 81% of our revenue for the fiscal year ended April 3, 2010 was generated from customers located in Asia, with the highest percentage of those customers located in China. To better serve their needs, we are establishing a new base of operations located in Hong Kong. We expect to commence operations there in 2010. We believe that expanding our Asia operations will allow us to improve our competitiveness against other low cost capital equipment suppliers based primarily in China. It will also allow us to be more responsive to our customers when they require service. Our Shanghai facility will continue to provide rapid shipment of replacement parts to customers when service is required, which will minimize our customers' production downtime.
10
- •
- Protect our customers' investments in capital equipment by providing technical improvements for existing products that enhance their productivity and efficiency—As a capital equipment supplier we believe product innovation and technology research and development are critical to preserving our market leadership. Our strategy is to offer improvements on our products in terms of performance and cost reductions which help our customers lower their manufacturing costs and improve their return on investment.
- •
- Develop or acquire complementary technologies or businesses—We believe that the solar PV market is still fragmented but is moving toward higher levels of vertical integration throughout the PV manufacturing process. We believe our expertise in crystallization technology and the consolidation of the PV manufacturing industry will lead to opportunities for us to expand our product offerings through selective acquisitions. We will look for opportunities that build upon our core strengths in crystallization technologies.
During the fiscal year ended April 3, 2010, we began offering equipment and engineering services to assist companies with the production of trichlorosilane ("TCS"), an essential raw material in both the semiconductor and solar industries and introduced the DSS450HP, our latest version of the DSS450 product architecture. We also offer DSS450HP upgrades for sale which allows customers to achieve productivity increases of approximately 15% using their current DSS450 and approximately 50% using their current DSS240. We intend to continue to introduce new products that protect our customers' capital equipment investment and that lower their PV manufacturing costs.
Competition
We compete on the basis of reputation, technology, delivery, service (both installation and aftermarket) and price. While our turnkey business participates in all stages of the PV manufacturing process, we principally compete with equipment manufacturers in markets for CVD reactors for the production of polysilicon and DSS furnaces for the production of multicrystalline ingots.
Polysilicon business—Our CVD reactor products and other related services face direct competition from a small number of new entrants to the polysilicon production market. These competitors include MSA Apparatus Construction for Chemical Equipment Ltd, Centrotherm Elektrische Anlagen GmbH & Co., Morimatsu Industry Co. Ltd. and Poly Plant Project, Inc. We also face indirect competition from large, well-established companies that produce polysilicon primarily for the semiconductor industry. These companies have developed polysilicon production technology for their own use which they do not market to third parties. These indirect competitors include Hemlock Semiconductor Corporation, Wacker Chemie AG, Tokuyama Corporation, MEMC Electronic Materials, Inc., Renewable Energy Corporation ASA and M Setek Company Ltd.
Photovoltaic business—Over the past several years, we have seen the emergence of new, low-cost competitors to our DSS crystallization furnaces. These competitors include ALD Vacuum Technologies AG, JYT Corporation, Ferrotec Corporation, PVA TePla AG, Centrotherm Elektrische Anlagen GmbH & Co., Jing Gong Technology as well as a number of other furnace manufacturers. Several of these competitors, such as Centrotherm and Ferrotec are large integrated manufacturers with significant resources capable of competing for business globally.
Customers
We sell our products and services globally to polysilicon producers and solar wafer, cell and module manufacturers. Our customers include, or are suppliers to, some of the world's leading solar wafer and cell manufacturers.
11
In any one year, we typically have a small number of customers, with any one customer representing a significant percentage of our total revenue. However, our customers and/or their contribution to our revenue typically change from year to year, as different customers replace equipment and undertake projects to add manufacturing capacity. The following customers comprised 10% or more of the Company's total net revenues for the fiscal years ended April 3, 2010, March 28, 2009 and March 31, 2008:
| |
Fiscal Year Ended | ||||||||||||||||
|---|---|---|---|---|---|---|---|---|---|---|---|---|---|---|---|---|---|
| |
April 3, 2010 | March 28, 2009 | March 31, 2008 | ||||||||||||||
| |
Revenue | % of Total |
Revenue | % of Total |
Revenue | % of Total |
|||||||||||
| |
(dollars in thousands) |
||||||||||||||||
LDK Solar Co., Ltd |
$185,249 | 34 | % | $ | 108,781 | 20 | % | $152,271 | 62 | % | |||||||
OCI Company Ltd (formerly DC Chemical Co. Ltd) |
* | * | % | 92,544 | 17 | % | * | * | % | ||||||||
Baoding Tianwei, Yingli New Energy Resources Co., Ltd |
* | * | % | 74,533 | 14 | % | * | * | % | ||||||||
Glory Silicon Energy Co., Ltd |
* | * | % | 57,896 | 11 | % | * | * | % | ||||||||
- *
- Revenue from these customers was either zero or less than 10% of the total revenue during the period.
We believe that our sales to customers in Asia will continue to be a significant portion of sales over the next several years as polysilicon and PV manufacturing continues to grow in that region. For more information about our revenue by geographic region and our revenue, gross profit and assets by segment, please refer to Note 16 in our Consolidated Financial Statements included elsewhere in this Annual Report on Form 10-K.
Sales, Marketing and Customer Support
We market our products principally through a direct sales force, as well as through regional indirect sales representatives who solicit orders and identify potential sales opportunities in markets where our business is less established. All sales are made directly by us to the customer and our indirect sales representatives are not authorized to enter into sales contracts on our behalf.
Sales terms
We have established standard terms and conditions of sale for our products; however, sales contracts and prices can vary and are generally negotiated on a case-by-case basis. Customers are generally required to make a cash deposit when the order is placed. Customers occasionally require us to provide a standby letter of credit to secure the cash deposit. In addition to cash deposits, customers are also generally required to either post a letter of credit or make advance payments of typically 90% of the value of the equipment prior to shipment. The balance, typically 10%, is paid upon customer acceptance of the products sold, which typically occurs within a two to twelve month period after shipping based upon contract terms. Because of the longer production times associated with our CVD reactors, customers are also required to make a series of installment payments as production milestones are achieved in addition to the initial cash deposit. In the event market conditions deteriorate, our existing terms and conditions may not be sustainable.
Product warranty
Our polysilicon products are generally sold with a standard warranty typically for a period not exceeding twenty-four months from delivery. Our PV products are generally sold with a standard
12
warranty for technical defects for a period equal to the shorter of: (i) twelve months from the date of acceptance by the customer; or (ii) fifteen months from the date of shipment. The warranty is typically provided on a repair or replacement basis and includes both products we manufacture and products that we supply our customers from other manufacturers. Our warranty expenses were $1.1 million for the fiscal year ended April 3, 2010, $2.3 million for the fiscal year ended March 28, 2009, and $1.9 million for the fiscal year ended March 31, 2008.
Customer support
Our polysilicon production equipment and crystallization furnaces are critical to the operation of our customers manufacturing operations. Prior to an order being placed, a customer service representative advises the customer with respect to its facilities requirements and undertakes modeling of expected operating costs. Following delivery, our engineers assist with installation and integration of equipment at the customer's facility. After the sale is complete we often provide support services for a fee. As the number of our product installations increases, we will continue to enhance our service and support.
Manufacturing and Suppliers
Our manufacturing model is different from many capital equipment manufacturers in that we outsource most of the components used in our PV equipment. Our factory focuses on assembly operations and the production of proprietary components. Nearly all of the components of our polysilicon products are shipped directly from our qualified vendors to the customer installation site. Components for our DSS crystallization furnaces are shipped to our facility in Merrimack, New Hampshire, where they are integrated into the final system prior to shipping to the customer. This model results in a highly flexible cost structure, modest working capital and physical plant requirements and a relatively small number of manufacturing employees. Our flexible model provides a strategic advantage during downward market swings because it creates a low cost structure for our operations.
Our DSS manufacturing operation uses a "forecast manufacturing" methodology to project our raw material needs sufficiently in advance of manufacturing lead times, diminishing the threat of spot price volatility and generally minimizing the effect of supply shortages and disruptions. We believe this approach reduces product delivery times and increases scalability and factory utilization. Our polysilicon and turnkey operations procure materials when customer orders are received.
We purchase a range of materials and components for use in our products from other manufacturers. We also purchase equipment from third party manufacturers for resale as part of our turnkey solutions. Many component parts purchased by us are made to our specifications and under appropriate confidentiality arrangements. Purchased components represented approximately 87%, 85%, and 81% of cost of goods sold in the fiscal year ended April 3, 2010, March 28, 2009, and March 31, 2008, respectively. We attempt to secure multiple suppliers of our components to ensure adequate supply. In addition, we do not use any single supplier to produce all of the components for any single product in order to reduce the risk that a supplier could replicate our products. We believe that these materials and components are readily available from multiple sources and that we are not dependent on any single supplier or limited group of suppliers. We have well-established relationships with various domestic and foreign suppliers of the components used in our products. We generally are required to make a series of pre-payments to these vendors, which we fund from the deposits we receive from customers.
Research, Development and Engineering
Our research and development activities are focused on advancing, developing and improving technologies for the markets we serve. We also have cooperative research and development agreements
13
with certain universities, customers and suppliers. Our research and development expense was $21.4 million in the fiscal year ended April 3, 2010; $18.3 million in the fiscal year ended March 28, 2009; and $10.5 million in the fiscal year ended March 31, 2008.
Intellectual Property
We believe that our competitive position depends, in part, on our ability to protect our intellectual property resulting from our research, development, engineering, manufacturing, marketing, and technical and customer service activities. Under our intellectual property strategy we protect our proprietary technology through a combination of patents, trademarks, copyrights, know-how, trade secrets, as well as employee and third party confidentiality and assignment of rights agreements. We focus on developing, identifying and protecting our technology and resulting intellectual property in a manner that supports our overall business and technology objectives. Although we rely on intellectual property that is primarily developed in-house for our solar and polysilicon equipment and related products, we also enter into patent and/or technology licenses with other parties when such licenses would advance or complement our products and technology or would otherwise be in our best interest.
One of the principal means of protecting our proprietary technology, including technical processes and equipment designs, is through trade secret protection and confidentiality agreements. Our personnel, including our research and development personnel, enter into confidentiality agreements and non-competition agreements with us. These agreements further address intellectual property protection issues and require our employees to assign to us, among other things, all of the inventions, designs and technologies they develop during the course of their employment with us. We also generally require our customers and business partners to enter into confidentiality agreements before we disclose any sensitive aspects of our technology or business plans.
We seek patent protection in various countries when it is consistent with our strategy and the protection afforded justifies the required disclosure costs associated with the filing. We own, or have applied for, various patents and patent applications in the United States and other countries relating to our products, product uses and manufacturing processes. The patents and patent applications vary in scope and duration. As of April 3, 2010, we owned twelve issued patents in the PV and semiconductor fields in the United States and had held seven patents in other jurisdictions. Although the products made, sold or used under our patents or technology licenses are important to us, we believe at this time that our business as a whole is not materially dependent on any particular patent or technology license, or on the licensing of our patents or technology to third parties, other than our customers.
We have not been subject to any material claims for infringement, misappropriation or other violation of intellectual property rights, claims for compensation by employee inventors or claims disputing ownership of our proprietary technologies.
Order Backlog
Our order backlog consists of signed purchase orders or other written contractual commitments. The table below sets forth our order backlog as of April 3, 2010 and March 28, 2009 by product category:
| |
April 3, 2010 | March 28, 2009 | |||||||||||
|---|---|---|---|---|---|---|---|---|---|---|---|---|---|
Product Category
|
Amount | % of Backlog |
Amount | % of Backlog |
|||||||||
| |
(dollars in millions) |
||||||||||||
Photovoltaic business |
$ | 441 | 49 | % | $ | 341 | 29 | % | |||||
Polysilicon business |
465 | 51 | % | 836 | 71 | % | |||||||
Total |
$ | 906 | 100 | % | $ | 1,177 | 100 | % | |||||
14
Our order backlog as of April 3, 2010, included deferred revenue of $82.1 million related to our photovoltaic business and $252.2 million related to our polysilicon business. Deferred revenue represents equipment that had been shipped to customers but not yet recognized as revenue. Cash received in deposits related to our order backlog were $119.6 million as of April 3, 2010, and substantially all of the contracts in our order backlog require the customer to either post a standby letter of credit in our favor or make advance payment prior to shipment of equipment. From the date of a written commitment, we generally would expect to deliver PV products over a period ranging from three to nine months and polysilicon products over a period ranging from twelve to eighteen months, although portions of the related revenue are expected to be recognized over longer periods in many cases. Disregarding the effect of any contract terminations or modifications, we would expect to convert approximately 50% of our April 3, 2010 order backlog into revenue during fiscal year 2011, and approximately 50% during fiscal 2012 and 2013. Although, most of our orders require substantial non-refundable deposits, our order backlog as of any particular date should not be relied upon as indicative of our revenues for any future period. We began tracking our backlog as a performance measure on a consistent basis during 2007.
If a customer fails to perform on a timely basis, and such failure continues after notice of breach and a cure period, we may terminate the contract. Our contracts do not contain cancellation provisions and in the event of a customer breach, the customer may be liable for contractual damages. During the fiscal year ended April 3, 2010, we terminated or modified contracts resulting in a $105 million reduction in our order backlog (95% of the reduction was from 9 contracts) as compared to the fiscal year ended March 28, 2009, during which we terminated or modified contracts resulting in a $39 million reduction in our order backlog (95% of the reduction was from 7 contracts). During the fiscal years ended April 3, 2010 and March 28, 2009 we recorded revenues of $21.1 million and $4.0 million, respectively, from terminated contracts.
Although we have a reasonable expectation that most of our customers will substantially perform on their contractual obligations, we monitor those contracts that we believe to be at risk which include contracts with customers to whom we have sent notices of breach for failure to provide letters of credit or to make payments when due. We conduct negotiations with certain customers who have requested that we extend their delivery schedules or make other contract modifications or who have not provided letters of credit or made payments in accordance with the terms of their contracts. We engage in a certain level of these negotiations in the ordinary course. We monitor the effect, if any, that these negotiations may have on our future revenue recognition. If we cannot come to an agreement with these customers, our order backlog could be reduced.
As a result of the economic downturn that began during the fiscal year ended March 28, 2009, we experienced an increase in the amount of backlog that we considered to be at risk which was substantially higher than in prior periods. As a result of contract terminations which occurred during the fiscal year ended April 3, 2010 and the satisfactory resolution of other contracts that were considered at risk, our assessment of the risk in our order backlog as of April 3, 2010 is substantially lower than our estimates in prior interim periods. However, other customers with contracts in our order backlog that are not currently under negotiation may approach us with similar requests in the future, or may fail to provide letters of credit or to make payments when due, which could further reduce our order backlog. If we cannot come to an agreement with these customers, our order backlog could be further reduced.
As of April 3, 2010, our order backlog consisted of contracts with 26 PV customers, 14 of which have orders of $3 million or greater and contracts with 7 polysilicon customers, 6 of which have orders of $3 million or greater. Our order backlog as of April 3, 2010, included $619 million attributed to three customers each representing 10% or more our order backlog.
15
Employees
As of April 3, 2010, we employed 384 full-time employee equivalents and contract personnel, consisting of 121 engineering and research and development employees; 41 customer service representatives; 8 executives; 18 sales and marketing employees; 85 finance, general and administrative employees; 101 manufacturing staff; and 10 information technology employees. As of April 3, 2010, 268 employees were located at our headquarters in New Hampshire, 57 employees were located at our Montana facility and 70 employees were located at our Asia facilities. None of our employees are currently represented by labor unions or covered by a collective bargaining agreement. We believe that relations with our employees are satisfactory.
Environmental Matters
Our facility in Merrimack, New Hampshire is subject to an industrial user discharge permit governing the discharge of wastewater to the Merrimack sewer system. There are no further environmental related permits required by us that are material to our business. We are not aware of any environmental issues that would have a material adverse effect on our operations generally.
Available Information
Our internet website address is http://www.gtsolar.com. Through our website, we make available, free of charge, our annual report on Form 10-K, quarterly reports on Form 10-Q, current reports on Form 8-K and any amendments to those reports, as soon as reasonably practicable after such materials are electronically filed, or furnished to, the Securities & Exchange Commission ("SEC"). These SEC reports can be accessed through the investor relations section of our website. The information found on our website is not part of this or any other report we file with or furnish to the SEC.
The charters of our Audit Committee, Compensation Committee, Nominating and Corporate Governance Committee, as well as our Code of Conduct and Code of Ethics for Senior Financial Officers, and Corporate Governance Guidelines are available on our website at www.gtsolar.com under "Corporate Governance". These items are also available in print to any stockholder who requests them by calling (603) 883-5200. This information is also available by writing to us, attention: Corporate Secretary, at the address on the cover of this Annual Report on Form 10-K.
Our business, operating results and cash flows can be impacted by a number of factors, any one of which could cause our actual results to vary materially from recent results or from our anticipated future results. You should carefully consider the risks described below and the other information in this report before deciding to invest in shares of our common stock. These are the risks and uncertainties we believe are most important for you to consider. Additional risks and uncertainties not presently known to us, which we currently deem immaterial or which are similar to those faced by other companies in our industry or business in general, may also impair our business operations. If any of the following risks or uncertainties actually occurs, our business, financial condition and operating results would likely suffer. In that event, the market price of our common stock could decline and an investor in our common stock could lose all or part of their investment.
Risks Related to Our Business Generally
General economic conditions may have an adverse impact on demand for our products.
Demand for products requiring significant capital expenditures, such as our DSS units and CVD reactors, is affected by general economic conditions. A downturn in the global construction market reduces demand for solar panels in new residential and commercial buildings, which in turn reduces
16
demand for our products that are used in the manufacture of PV wafers, cells and modules and polysilicon for the solar power industry. Uncertainties about economic conditions, negative financial news, tighter credit markets and declines in asset values have caused our customers to postpone making purchases of capital equipment. Increasing budgetary pressures could reduce or eliminate government subsidies and economic incentives for on-grid solar electricity applications. A prolonged downturn in the global economy could have a material adverse effect on our business in a number of ways, including decreased demand for our products, which would result in lower sales and reduced backlog.
Uncertainty about future economic conditions makes it challenging for us to forecast our operating results, make business decisions and identify the risks that may affect our business. If we are not able to timely and appropriately adapt to changes resulting from the difficult macroeconomic environment, our business, results of operations and financial condition may be materially and adversely affected.
Current or future credit and financial market conditions could materially and adversely affect our business and results of operations in several ways.
As widely reported, financial markets in the United States, Europe and Asia experienced extreme disruption recently, including, among other things, extreme volatility in security prices, severely diminished liquidity and credit availability, rating downgrades of certain investments and declining valuations of others. There can be no assurance that there will not be further deterioration in credit and financial markets and confidence in economic conditions. These economic developments affect businesses such as ours in a number of ways. The current tightening of credit in financial markets has resulted in reduced funding worldwide and a higher level of uncertainty for solar module manufacturers. As a result, some of our customers have been delayed in securing or prevented from securing funding adequate to honor their existing contracts with us or to enter into new contracts to purchase our products. We believe the reduced availability of funding for new manufacturing facilities and facility expansions, together with reduced demand for solar panels, has caused a decrease in orders for our products. We currently require most of our customers to prepay a portion of the purchase price of their orders. We use these customer deposits to prepay our suppliers to reduce the need to borrow to cover our cash needs for working capital. This practice may not be sustainable if the recent market conditions continue. Some of our customers who have become financially distressed have failed to provide letters of credit or make payments in accordance with the terms of their existing contracts. If customers fail to post letters of credit or make payments, and we do not agree to revised terms, it could have a significant impact on our business, results of operations and financial condition.
During the fiscal years ended April 3, 2010 and March 28, 2009, some of our customers failed to make deposits when due under their contracts, and we terminated those contracts. In addition, certain customers requested extensions of delivery dates and other modifications. The resulting contract modifications included lower pricing and reductions in the number of units deliverable under the contracts, thereby reducing our order backlog. As a result of these terminations and other contract modifications, our order backlog was reduced by $105 million during the fiscal year ended April 3, 2010 and by $39 million during the fiscal year ended March 28, 2009.
As a result of customer delays or contract terminations, we often reschedule or cancel purchase orders with our vendors to procure materials and reimburse the vendor for costs incurred to the date of termination plus predetermined profits. In cases where we are not able to cancel or modify purchase orders impacted by customer delays or terminations, our purchase commitments may exceed our order backlog requirements and we may be unable to redeploy the undelivered equipment. For example, during the year ended March 28, 2009, we rescheduled and/or cancelled commitments to our vendors as a result of customer delays, contract modifications and terminations and we recorded losses of $11.3 million relating to expected forfeitures of vendor advances and reserves against advances on inventory purchases with vendors that had become financially distressed.
17
Delays in deliveries could cause us to have inventories in excess of our short-term needs and may delay our ability to recognize revenue on contracts in our order backlog. Additional contract breaches or cancellation of orders would prevent us from recognizing revenue on contracts in our order backlog and may require us to reschedule and/or cancel additional commitments to vendors in the future.
Such credit and financial market conditions may similarly affect our suppliers. We may lose advances we make to our suppliers in the event they become insolvent because our advances are not secured or backed by letters of credit. The inability of our suppliers to obtain credit to finance development or manufacture our products could result in delivery delays or prevent us from delivering our products to our customers. In addition, the volatility in the credit markets has severely diminished liquidity and capital availability. While the ultimate outcome of the disruptions in the credit markets cannot be predicted, they may result in events that could prevent us from obtaining new financing on commercially acceptable terms.
We are unable to predict the likely duration and severity of the disruption in financial markets and adverse worldwide economic conditions and any resulting effects or changes, including those described above, may have a material and adverse effect on our business, results of operations and financial condition.
Amounts included in our order backlog may not result in actual revenue or translate into profits.
Although our order backlog is based on signed purchase orders or other written contractual commitments, we cannot guarantee that our order backlog will result in actual revenue in the originally anticipated period or at all. In addition, the contracts included in our order backlog may not generate margins equal to our historical operating results. We began to track our order backlog on a consistent basis as a performance measure in 2007, and as a result, we do not have significant experience in determining the level of realization that we will actually achieve on our backlog. Our customers may experience project delays or defaults on the terms of their contracts with us as a result of external market factors and economic or other factors beyond our control. If a customer fails to perform its contractual obligations and we do not reasonably expect such customer to perform its obligations, we may terminate the contract. In addition, our backlog is at risk to varying degrees to the extent customers request that we extend the delivery schedules and make other modifications under their contracts in our order backlog. Any contract modifications that we negotiate could likely include an extension of delivery dates, and could result in lower pricing or in a reduction in the number of units deliverable under the contract, thereby reducing our order backlog. Our order backlog includes contracts with customers to whom we have sent notices of breach for failure to provide letters of credit or to make payments when due. If we cannot come to an agreement with these customers, it could result in a further reduction of our order backlog. Other customers with contracts in our order backlog that are not currently under negotiation may approach us with requests for delays in the future, or may fail to make payments when due, which could further reduce our order backlog. As a result of terminations and other contract revisions, our order backlog was reduced by $105 million during the fiscal year ended April 3, 2010 and by $39 million during the fiscal year ended March 28, 2009. If our order backlog fails to result in revenue in a timely manner, or at all, we could experience a reduction in revenue, profitability and liquidity.
18
We currently depend on a small number of customers in any given fiscal year for a substantial part of our sales and revenue.
In each fiscal year, we depend on a small number of customers for a substantial part of our sales and revenue. For example, in the fiscal year ended April 3, 2010, one customer accounted for 34% of our revenue, in the fiscal year ended March 28, 2009, four customers accounted for 62% of our revenue and in the fiscal year ended March 31, 2008, one customer accounted for 62% of our revenue. In addition, as of April 3, 2010, we had a $907 million order backlog of which $619 million was attributable to three customers. As a result, the default in payment by any of our major customers, the loss of existing orders or lack of new orders in the future, or a change in the product acceptance schedule by such customers could significantly reduce our revenues and have a material adverse effect on our financial condition, results of operations, business and/or prospects. We anticipate that our dependence on a limited number of customers in any given fiscal year will continue for the foreseeable future. There is a risk that existing customers will elect not to do business with us in the future or will experience financial difficulties. Furthermore, many of our customers are at an early stage and many are dependent on the equity capital markets to finance their purchase of our products. As a result, these customers could experience financial difficulties and become unable to fulfill their contracts with us. There is also a risk that our customers will attempt to impose new or additional requirements on us that reduce the profitability of sales to those customers for us. If we do not develop relationships with new customers, we may not be able to increase, or even maintain, our revenue, and our financial condition, results of operations, business and/or prospects may be materially adversely affected.
Our success depends on the sale of a limited number of products.
A significant portion of our operating profits has historically been derived from sales of DSS units, CVD reactors and STC converters, which sales accounted for 91% of our revenue for the fiscal year ended April 3, 2010, 89% of our revenue in the fiscal year ended March 28, 2009 and 79% of our revenue in the fiscal year ended March 31, 2008. There can be no assurance that DSS units and CVD reactors sales will increase beyond, or be maintained at, past levels. We believe that sales of our STC converters will be substantially lower in the future due to changes in technology. Factors affecting the level of future sales of these products include factors beyond our control, including, but not limited to, demand for solar products and competing product offerings by other equipment manufacturers. There can be no assurance that we will be able to successfully diversify our product offering and thereby increase our revenue and/or maintain our profits in the event of a decline in DSS units and CVD reactors sales. If sales of these products decline for any reason, our financial condition, results of operations, business and/or prospects could be materially adversely affected.
We depend on a limited number of third party suppliers.
We use component parts supplied by a small number of third party suppliers in our products and source most equipment used in our turnkey solutions from third party suppliers. Our supplier agreements are typically short-term in nature, which leaves us vulnerable to the risk that our suppliers may change the terms on which they have previously supplied products to us or cease supplying products to us at any time and for any reason. There is no guarantee that we will maintain relationships with our existing suppliers or develop new relationships with other suppliers. In addition, many of our suppliers are small companies that may cease operations for any reason, including financial viability reasons, and/or may be unable to meet increases in our demand for component parts and equipment, as we expand and grow our business. We are also dependent on our suppliers to maintain the quality of the components we use and the increased demands placed on these suppliers as we continue to grow may result in quality control problems. We may be unable to identify replacement or additional suppliers or qualify their products in a timely manner and on commercially reasonable terms. Component parts supplied by new suppliers may also be less suited to our products than the
19
component parts supplied by our existing suppliers. Certain of the component parts used in our products have been developed, made or adapted specifically for us. Such parts are not generally available from many vendors and could be difficult to obtain elsewhere. As a result, there may be a significant time lag in securing an alternative source of supply.
Our failure to obtain sufficient component parts and/or third party equipment that meet our requirements in a timely manner and on commercially reasonable terms could interrupt or impair our ability to assemble our products and provide turnkey solutions, and may adversely impact our plans to expand and grow our business, as well as result in a loss of market share. Further, such failure may prevent us from delivering our products as required by the terms of our contracts with our customers, and may harm our reputation and result in breach of contract and other claims being brought against us by our customers. Any changes to our current supply arrangements, whether to the terms of supply from existing suppliers or a change in our suppliers, may also increase our costs.
As a result of any of the foregoing factors, our financial condition, results of operations, business and/or prospects could be materially adversely affected.
We may face product liability claims and/or claims in relation to third party equipment.
It is possible that our products could result in property damage and/or personal injury, whether by product malfunctions, defects, improper use or installation or other causes. We cannot predict whether or not product liability claims will be brought against us or the effect of any resulting negative publicity on our business, which may include loss of existing customers, failure to attract new customers and a decline in sales. The successful assertion of product liability claims against us could result in potentially significant monetary damages being payable by us, and we may not have adequate resources to satisfy any judgment against us. Furthermore, it may be difficult to determine whether any damage or injury was due to product malfunction or operator error. For example, two of our customers have experienced accidents at their respective facilities involving our DSS units, one of which occurred in December 2006, and resulted in two deaths. To date, we have not received any product liability or other claims with respect to these or any other accidents. The bringing of product liability claims against us, whether ultimately successful or not, could have a material adverse effect on our financial condition, results of operations, business and/or prospects.
We provide third party equipment in connection with both turnkey solutions and stand-alone sales. There can be no guarantee that such third party equipment will function in accordance with our intended or specified purpose or that the customer's personnel, in particular those who are inexperienced in the use of the specialized equipment sold by us, will be able to install and operate it, which may result in the return of products and/or claims by the customer against us. In the event of a claim against us, there is no guarantee that we will be able to recover all or any of our loss from the third party equipment provider. Any such claim, in particular in the case of a turnkey solution where the customer may return other equipment sold by us or cancel related orders, could have a material adverse effect on our financial condition, results of operations, business and/or prospects.
Our future success depends on our management team and on our ability to attract and retain key employees and to integrate new employees into our management team successfully.
We are dependent on the services of our management team. Although certain of these individuals are subject to service agreements with us, any and all of them may choose to terminate their employment with us on thirty or fewer days' notice. The loss of any member of the management team could have a material adverse effect on our financial condition, results of operations, business and/or prospects. There is a risk that we will not be able to retain or replace these or other key employees. Integrating new employees into our management team could prove disruptive to our daily operations, require a disproportionate amount of resources and management attention and ultimately prove
20
unsuccessful. This may have a material adverse effect on our financial condition, results of operations, business and/or prospects.
We may be unable to attract, train and retain technical personnel.
Our future success depends, to a significant extent, on our ability to continue to develop and improve our technology and to attract, train and retain experienced and knowledgeable technical personnel. Recruiting and retaining capable personnel, particularly those with expertise in the polysilicon or solar products industries, is vital to our success. There is substantial competition for qualified technical personnel, and qualified personnel are currently, and for the foreseeable future are likely to remain, a limited resource. Locating candidates with the appropriate qualifications can be costly, time-consuming and difficult. There can be no assurance that we will be able to attract new, or retain existing, technical personnel. We may need to provide higher compensation or increased training to our personnel than current levels. If we are unable to attract and retain qualified personnel, or are required to change the terms on which our personnel are employed, our financial condition, results of operations, business and/or prospects may be materially adversely affected.
We may be unable to protect our intellectual property adequately and may face litigation to enforce our intellectual property rights.
Our ability to compete effectively against other solar equipment manufacturers will depend, in part, on our ability to protect our current and future proprietary technologies, product designs, product uses and manufacturing processes under relevant intellectual property laws including, but not limited, to laws relating to patents and trade secrets.
We own various patents and patent applications in the United States and other countries relating to our products, product uses and manufacturing processes. To the extent that we rely on patent protection, our patents may provide only limited protection for our technology and may not be sufficient to provide competitive advantages to us. For example, competitors could develop similar or more advantageous technologies or design around our patents or otherwise employ alternative products, equipment or processes that may successfully compete with our products and technology. In addition, patents are of limited duration. Any issued patents may also be challenged, invalidated or declared unenforceable. If our patents are challenged, invalidated or declared unenforceable, other companies will be better able to develop products that compete with ours, which could adversely affect our competitive business position, business prospects and financial condition. Further, we may not have, or be able to obtain, effective patent protection in all of our key sales territories. Our patent applications may not result in issued patents and, even if they do result in issued patents, the patents may not include rights of the scope that we seek. The patent position of technology-oriented companies, including ours, is uncertain and involves complex legal and factual considerations. Accordingly, we do not know what degree of protection we will obtain from our proprietary rights or the breadth of the claims allowed in patents issued to us or to others. Further, given the costs of obtaining patent protection, we may choose not to protect certain innovations that later turn out to be important to our business.
Third parties may infringe, misappropriate or otherwise violate our proprietary technologies, product designs, manufacturing processes and our intellectual property rights therein, which could have a material adverse effect on our financial condition, results of operations, business and/or prospects. Because the laws and enforcement mechanisms of various countries that we seek protection in may not allow us to adequately protect our intellectual property rights, the strength of our intellectual property rights will vary from country to country. Litigation to prevent, or seek compensation for such infringement, misappropriation or other violation may be costly and may divert management attention and other resources away from our business without any guarantee of success.
21
We also rely upon proprietary manufacturing expertise, continuing technological innovation and other know-how or trade secrets to develop and maintain our competitive position. While we generally enter into confidentiality and non-disclosure agreements with our employees and third parties to protect our intellectual property, such confidentiality and non-disclosure agreements could be breached and are limited, in some instances, in duration and may not provide meaningful protection for the trade secrets or proprietary manufacturing expertise that we hold. We have had in the past and may continue to have certain of our employees terminate their employment with us to work for one of our customers or competitors. Adequate or timely remedies may not be available in the event of misappropriation, unauthorized use or disclosure of our manufacturing expertise, technological innovations and trade secrets. In addition, others may obtain knowledge of our manufacturing expertise, technological innovations and trade secrets through independent development or other legal means and, in such cases, we may not be able to assert any trade secret rights against such a party.
We may face claims in relation to the infringement or misappropriation of third-party intellectual property rights.
Notwithstanding our intellectual property rights, we may be subject to claims that our products, processes or product uses infringe the intellectual property rights of others. These claims, even if meritless, could be expensive and time consuming to defend. In addition, if we are not successful in our defense of such claims, we could be subject to injunctions and/or damages, or be required to enter into licensing arrangements requiring royalty payments and/or use restrictions. In some instances, licensing arrangements may not be available to us or, if available, may not be available on acceptable terms.
We face potential claims by third parties of infringement, misappropriation or other violation of such third parties' intellectual property rights. From time to time we have received and may in the future receive notices or inquiries from other companies regarding our services or products suggesting that we may be infringing their patents or misappropriating their intellectual property rights. Such notices or inquiries may, among other things, threaten litigation against us. Furthermore, the issuance of a patent does not guarantee that we have the right to practice the patented invention. Third parties may have blocking patents that could be used to prevent us from marketing our own patented product and practicing our own patented technology. In addition, third parties could allege that our products and processes make use of their unpatented proprietary manufacturing expertise and/or trade secrets, whether in breach of confidentiality and non-disclosure agreements or otherwise. If an action for infringement, misappropriation, or other violation of third party rights were successfully brought against us, we may be required to cease our activities on an interim or permanent basis and could be ordered to pay compensation, which could have a material adverse effect on our financial condition, results of operations, business and/or prospects. Additionally, if we are found to have willfully infringed certain intellectual property rights of another party, we may be subject to treble damages and/or be required to pay the other party's attorney's fees. Alternatively, we may need to seek to obtain a license of the third party's intellectual property rights or trade secrets, which may not be available, whether on reasonable terms or at all. In addition, any litigation required to defend such claims brought by third parties may be costly and may divert management attention and other resources away from our business, without any guarantee of success. Moreover, we may also not have adequate resources to devote to our business in the event of a successful claim against us.
From time to time, we hire personnel who may have obligations to preserve the secrecy of confidential information and/or trade secrets of their former employers. Some former employers monitor compliance with these obligations. For example, a former employer of three of our current employees, one of whom is one of our executive officers, contacted us seeking assurance that its ex-employees were honoring their confidentiality obligations to the former employer. We also received a similar inquiry from the former employers of two other employees. In both instances, we believe that we have provided such former employers with such assurance. While we have policies and procedures
22
in place to guard against the risk of breach by our employees of confidentiality obligations to their former employers, there can be no assurance that a former employer of one or more of our employees will not allege a breach and seek compensation for alleged damages. If such a former employer were to successfully bring such a claim, our know-how and/or skills base could be restricted and our ability to produce certain products and/or to continue certain business activities could be affected, to the detriment of our financial condition, results of operations, business and/or prospects.
The international nature of our business subjects us to a number of risks, including unfavorable political, regulatory, labor and tax conditions in foreign countries.
A substantial majority of our marketing and distribution takes place outside the United States, and a substantial percentage of our sales are to customers outside the United States. In the fiscal year ended April 3, 2010, we derived 81% of our revenue from sales to customers in Asia, and in the fiscal year ended March 28, 2009, we derived 87% of our revenue from sales to customers in Asia. We also have contracts with customers in Europe and expect to recognize revenue from sales to customers in Asia and Europe in the future. As a result, we are subject to the legal, political, social and regulatory requirements and economic conditions of many jurisdictions other than the United States. Risks inherent to maintaining international operations, include, but are not limited to, the following:
- •
- withholding taxes or other taxes on our foreign income, tariffs or other restrictions on foreign trade and investment,
including currency exchange controls imposed by or in other countries;
- •
- the inability to obtain, maintain or enforce intellectual property rights in other jurisdictions, at a reasonable cost or
at all;
- •
- difficulty with staffing and managing widespread operations;
- •
- trade barriers such as export requirements, tariffs, taxes and other restrictions and expenses, which could increase the
prices of our products and make our product offering less competitive in some countries; and
- •
- our establishing ourselves and becoming tax resident in foreign jurisdictions.
Our business in foreign markets requires us to respond to rapid changes in market conditions in these countries. Our overall success as a global business depends, in part, on our ability to succeed under differing legal, regulatory, economic, social and political conditions. There can be no assurance that we will be able to develop, implement and maintain policies and strategies that will be effective in each location where we do business. As a result of any of the foregoing factors, our financial condition, results of operations, business and/or prospects could be materially adversely affected.
We are subject to the legal systems of the countries in which we offer and sell our products.
We offer and sell our products internationally, including in some emerging markets. As a result, we are and/or may become subject to the laws, regulations and legal systems of the various jurisdictions in which we carry on business and/or in which our customers or suppliers are located. Among the laws and regulations applicable to our business are health and safety and environmental regulations, which vary from country to country and from time to time. We must therefore design our products and ensure their manufacture so as to comply with all applicable standards. Compliance with legal and regulatory requirements, including any change in existing legal and regulatory requirements, may cause us to incur costs and may be difficult, impractical or impossible. Accordingly, foreign laws and regulations which are applicable to us may have a material adverse effect on our financial condition, results of operations, business and/or prospects.
As a result of the procedural requirements or laws of the foreign jurisdictions in which we carry on business and/or in which our customers or suppliers are located, we may experience difficulty in
23
enforcing supplier or customer agreements or certain provisions thereof, including, for example, the limitations on the product warranty we typically provide to our customers. In some jurisdictions, enforcement of our rights may not be commercially practical in light of the duration, cost and unpredictability of such jurisdiction's legal system. Any inability by us to enforce, or any difficulties experienced by us in enforcing, our contractual rights in foreign jurisdictions may have a material adverse effect on our financial condition, results of operations, business and/or prospects.
We face particular market, commercial, jurisdictional and legal risks associated with our business in China.
We have had significant sales in China, accounting for 63% of our revenue in the fiscal year ended April 3, 2010, and 62% of our revenue in the fiscal year ended March 28, 2009. Further, we have recently opened facilities in China. Accordingly, our financial condition, results of operations, business and/or prospects could be materially adversely affected by economic, political and legal conditions or developments in China.
Examples of economic and political developments that could adversely affect us include government control over capital investments or changes in tax regulations that are applicable to us. In addition, a substantial portion of the productive assets in China remain government owned. The Chinese government also exercises significant control over Chinese economic growth through the allocation of resources, controlling payment of foreign currency denominated obligations, setting monetary policy and providing preferential treatment to particular industries or companies. Efforts by the Chinese government to slow the pace of growth of the Chinese economy could result in decreased capital expenditures by solar product manufacturers, which in turn could reduce demand for our products. Additionally, China has historically adopted laws, regulations and policies which impose additional restrictions on the ability of foreign companies to conduct business in China or otherwise place them at a competitive disadvantage in relation to domestic companies. Any adverse change in economic conditions or government policies in China could have a material adverse effect on our overall economic growth and therefore have an adverse effect on our financial condition, results of operations, business or prospects.
We also face risks associated with Chinese laws and the Chinese legal system. China's legal system is rapidly evolving and, as a result, the interpretation and enforcement of many laws, regulations and rules are not always uniform and legal proceedings in China often involve uncertainties. The legal protections available to us may therefore be uncertain and may be limited. Enforcement of Chinese intellectual property related laws has historically been weak, primarily because of ambiguities in Chinese laws and difficulties in enforcement. Accordingly, the intellectual property rights and confidentiality protections available to us in China may not be as effective as in the United States or other countries. In addition, any litigation brought by or against us in China may be protracted and may result in substantial costs and diversion of resources and management attention and the anticipated outcome would be highly uncertain. As a result of the foregoing factors, our financial condition, results of operations, business and/or prospects may be materially adversely affected.
We are in the process of expanding our presence in China, including in the areas of customer service, sales and research and development. As we expand our presence in China, we are increasingly exposed to the economic, political and legal conditions and developments in China, which could further exacerbate these risks.
Our ability to supply a sufficient number of products to meet demand could be severely hampered by natural disasters or other catastrophes.
Currently, a portion of our operations are located in Asia and we expect to increase our operations in Asia by opening new facilities in Hong Kong in 2010. Additionally, a significant portion of our revenue is generated from customers that install our equipment in Asia. These areas are subject
24
to natural disasters such as earthquakes or floods. A significant catastrophic event such as war, acts of terrorism or global threats, including, but not limited to, the outbreak of epidemic disease, could disrupt our operations and impair distribution of our products, damage inventory, interrupt critical functions, cause our suppliers to be unable to meet our demand for parts and equipment, reduce demand for our products, prevent our customers from honoring their contractual obligations to us or otherwise affect our business negatively. To the extent that such disruptions or uncertainties result in delays or cancellations of customer orders, or the manufacture or shipment of our products, our business, operating results and financial condition could be materially and adversely affected.
We may potentially be subject to concentration of credit risk related to our cash equivalents and short-term investments.
We may potentially be exposed to losses in the event of nonperformance by the financial counterparties to our cash equivalent investments and short term investments. This risk may be heightened as a result of the financial crisis and volatility in the markets. We manage the concentration risk by making investments that comply with our investment policy. Currently, our cash equivalents are invested in exchange traded money market mutual funds and our short term investments are invested in commercial paper. Although we do not currently believe the principal amounts of these investments are subject to any material risk of loss, the recent volatility in the financial markets is likely to significantly impact the investment income we receive from these investments. In general, increases of credit risk related to our cash equivalents and short-term investments could have a material adverse effect on our financial condition, results of operations, business and/or prospects.
Our credit facilities contain covenants that impose significant restrictions on us.
We have entered into a senior credit facility and a cash-collateralized letter of credit facility, in each case, with a syndicate of financial institutions. We have the capacity to incur substantial indebtedness under the senior credit facility. Furthermore, the credit agreements contain covenants that restrict our ability to make certain distributions with respect to our capital stock, prepay other debt, encumber our assets, incur additional indebtedness, engage in business combinations and undertake various other corporate activities. These covenants require us also to maintain certain specified financial ratios, including those relating to net leverage and fixed charge coverage.
Our failure to comply with any of these covenants could result in the acceleration of our outstanding indebtedness, if any, under these facilities. If such acceleration occurs, we would be required to repay our indebtedness, and we may not have the ability to do so or the ability to refinance our indebtedness. Even if new financing is made available to us, it may not be available on acceptable or reasonable terms. An acceleration of our indebtedness could impair our ability to operate as a going concern.
We may face significant warranty claims.
Our DSS products are generally sold with a standard warranty for technical defects for a period equal to the shorter of: (i) twelve months from the date of acceptance by the customer; or (ii) fifteen months from the date of shipment. We provide longer warranty coverage in our polysilicon business, typically covering a period not exceeding twenty-four months from delivery. The warranty is typically provided on a repair or replace basis, and is not limited to products or parts manufactured by us. As a result, we bear the risk of warranty claims on all products we supply, including equipment and component parts manufactured by third parties. There can be no assurance that we will be successful in claiming under any warranty or indemnity provided to us by our suppliers in the event of a successful warranty claim against us by a customer or that any recovery from such supplier would be adequate. There is a risk that warranty claims made against us could have a material adverse effect on our financial condition, results of operations, business and/or prospects.
25
Exchange rate fluctuations may make our products less attractive to non-U.S. customers and otherwise have a negative impact on our operating results.
Our reporting currency is the U.S. dollar and almost all of our contracts are denominated in U.S. dollars. However, greater than 98% of our revenue was generated from sales to customers located outside the United States in each of the fiscal years ended April 3, 2010, March 28, 2009, and March 31, 2008 respectively, and we expect that a large percentage of our future revenue will continue to be derived from sales to customers located outside the United States. Changes in exchange rates between foreign currencies and the U.S. dollar could make our products less attractive to non-U.S. customers and therefore decrease our sales and gross margins. In addition, we incur costs in the local currency of the countries outside the United States in which we operate and as a result are subject to currency translation risk. Exchange rates between a number of foreign currencies and the U.S. dollar have fluctuated significantly over the last few years and future exchange rate fluctuations may occur. Our largest foreign currency exposure is the euro. In order to mitigate foreign currency fluctuations, we typically enter into forward foreign exchange contracts to hedge portions of equipment purchases from vendors located primarily in Europe. Our hedging activities may not be successful in reducing our exposure to foreign exchange rate fluctuations. Future exchange rate fluctuations may have a material adverse effect on our financial condition, results of operations, business and/or prospects.
An increase in interest rates or the reduced availability of financing could reduce the demand for our products.
Our customers may use debt or equity financing to purchase our products and otherwise run their businesses. As a result, an increase in interest rates or the reduced availability of financing in any of the markets in which our customers operate, including Europe, Asia and the United States, could make it difficult for existing and potential customers to secure the financing necessary to purchase our products. In addition, end users of PV products may depend on debt financing to fund the capital expenditures required to purchase and install PV applications. As a result, an increase in interest rates or the reduced availability of financing could make it difficult for end-users to secure necessary financing on favorable terms, or at all and therefore could reduce demand for PV products. Any such decrease in demand for PV products could, in turn, result in decreased demand for our products, which are used in the manufacture of PV products. Thus, an increase in interest rates or the reduced availability of financing could lower demand for our products, reduce our revenues and have a material adverse effect on our financial condition, results of operations, business and/or prospects.
We are subject to securities class action lawsuits that could adversely affect our business. This litigation, and potential similar or related litigation, could result in substantial damages and may divert management's time and attention from our business.
Beginning on August 1, 2008, a series of putative securities class action lawsuits were commenced in both the United States District Court for the District of New Hampshire, which has been consolidated in a single action under the caption Braun et al. v. GT Solar International, Inc., et al., as well as New Hampshire state court in the Superior Court for Hillsborough County, Southern District, under the caption Hamel v. GT Solar International, Inc., et al., alleging that we, certain of our officers and directors, the underwriters in our July 2008 initial public offering and others, including certain of our investors, violated various sections of the Securities Act. A derivative suit, captioned Fan v. GT Solar Int'l, Inc., et al., was filed in New Hampshire state court on January 14, 2009 (the "derivative action"). The derivative complaint is asserted nominally on our behalf against certain of our directors and officers and alleges various claims for breach of fiduciary duty, unjust enrichment, abuse of control and gross mismanagement and is premised on the same purported misconduct alleged in the federal action. The complaints, among other things, allege that the registration statement for our July 2008 initial public offering contained material misstatements and omissions regarding the status of our
26
business relationship with LDK Solar, Ltd. The lawsuits seek, among other things, unspecified compensatory damages plus rescission, interest, attorneys' fees and costs. All of the federal lawsuits have been consolidated. On September 22, 2009, the federal court denied the defendants' motion to dismiss the federal lawsuits. Following the court's denial of the motion, the parties submitted a proposed joint case management order which requires coordination of any discovery to be taken in the state class action with that taken in the federal class action. The court approved the motion on November 16, 2009 and the parties have exchanged initial discovery requests. The case management order provides for discovery to close on May 25, 2011.
We intend to defend these claims vigorously. Nonetheless, the lawsuits discussed above may result in costly and protracted litigation, which may require significant commitment of our financial and management resources and time. The ultimate outcome of any litigation is uncertain and could result in substantial damages. Either favorable or unfavorable outcomes could have a material negative impact on our financial condition or results of operations, due to defense costs, diversion of management resources and other factors. In addition, we may in the future be the target of securities class action lawsuits similar to those described above.
New interpretations of existing accounting standards or the application of new standards could affect our revenue recognition and other accounting policies, which could have an adverse effect on the way we report our operating results.
Generally accepted accounting principles in the United States are subject to interpretations by the Financial Accounting Standards Board ("FASB"), the American Institute of Certified Public Accountants, the SEC and various other organizations formed to promulgate and interpret accounting principles. A change in these accounting principles or their interpretations could affect the reporting of transactions that were completed before the announcement of a change in principles or interpretations.
In October 2009, the FASB issued authoritative guidance that provides amendments to the revenue recognition criteria for separating consideration in multiple-deliverable revenue arrangements. It establishes a hierarchy of selling prices to determine the selling price of each specific deliverable which includes vendor-specific objective evidence (if available), third-party evidence (if vendor-specific evidence is not available), or estimated selling price if neither of the first two are available. This guidance also eliminates the residual method for allocating revenue between the elements of an arrangement and requires that arrangement consideration be allocated at the inception of the arrangement and expands the disclosure requirements regarding a vendor's multiple-deliverable revenue arrangements. This guidance is effective for fiscal years beginning on or after June 15, 2010, and earlier adoption is permitted.
We are currently assessing the potential impact, if any, the adoption of this FASB guidance will have on our consolidated financial statements; however, at this time we are unable to quantify its impact on our consolidated financial statements and we are in the process of determining the timing and method of its adoption.
27
Risks Relating to Our Polysilicon Business
Our polysilicon business faces direct and indirect competition.
We are not the only provider of polysilicon production equipment to the market. Further, the technology underlying our CVD reactor product is not the only known technology for producing polysilicon. Our CVD reactor is based on the Siemens process, which is a method whereby silicon depositions from silane or trichlorosilane, or TCS, gas are grown on heated rods inside a cooled bell jar. An alternative polysilicon production method is the fluidized bed reactor, or FBR, process, in which polysilicon is grown from hot polysilicon granules suspended in an upward flow of silane or TCS gas inside a specially designed chamber. A large scale FBR process has certain advantages over the Siemens process, including allowing for the continuous production and extraction of polysilicon, consuming less energy and being less labor intensive. There can be no assurance that the FBR process or other polysilicon growth technologies will not supersede the Siemens process as the most commonly used method of polysilicon production. If other technologies for producing polysilicon become more widely used or more widely available, demand for our CVD reactor product, and thus our financial condition, results of operations, business and/or prospects, may be adversely affected.
Existing direct competitors of our polysilicon business include two German companies, one Chinese company and a U.S. company that we believe deliver CVD reactors based upon what we believe is a Siemens process reactor design. There can be no assurance that our polysilicon business will compete successfully with these companies. Although we believe our CVD reactor to be distinct from the competing products offered by our competitors, there can be no assurance that our CVD reactor will compete successfully with their products. If we are unable to compete successfully with these other products, it may have a material adverse effect on our financial condition, results of operations, business and/or prospects.
Polysilicon producers currently compete indirectly with our polysilicon business, as demand for our CVD reactor is likely to be adversely affected by increases in polysilicon supply. Announcements have indicated that major polysilicon producers, including Hemlock Semiconductor Corporation, Wacker Chemie AG, Renewable Energy Corporation ASA, MEMC Electronic Materials, Inc., M Setek Company Ltd. and Tokuyama Corporation, may be planning increases in their polysilicon production capacity.
Our polysilicon business may also face competition from competitors of which we are not currently aware or which enter into competition with our polysilicon business in the future. Our competitors may have substantially greater financial, technical, manufacturing and other resources than us. Therefore, other manufacturers may have a competitive advantage because they can realize economies of scale, synergies and purchase certain raw materials and key components at lower prices. Our potential competitors may also have greater brand name recognition, more established distribution networks and larger customer bases, and may be able to devote more resources to the research, development, promotion and sale of their products or to respond more quickly to evolving industry standards and changes in market conditions. Our failure to adapt to changing market conditions and to compete successfully with existing or new competitors may have a material adverse effect on our financial condition, results of operations, business and/or prospects.
We license and do not own certain components of the technology underlying our CVD reactor and STC converter products.
Certain components of the technology underlying our CVD reactor and STC converter products is not owned by us, but is licensed under a ninety-nine year license agreement that could be terminated in the event of a material breach by us of such agreement that remains uncured for more than thirty days, or upon our bankruptcy or insolvency. To the extent such components are deemed to be incorporated into our current or future products, any termination of our rights to use such technology could have a
28
material adverse effect on our ability to offer our polysilicon products and therefore on our financial condition, results of operations, business and/or prospects if our company was unable to secure these rights in a different manner or from an alternative arrangement.
Revenue recognition on sales of our CVD reactor and STC converter products may be affected by a number of factors, some of which are outside our control.
Revenue from sales of our CVD reactors and STC converters is recognized by us only upon customer acceptance in accordance with our revenue recognition policy. The timing of customer acceptance depends on many factors, some of which are outside our control. Acceptance of our polysilicon products does not occur until after they have been received by the customer, are operational and have performed satisfactorily in agreed upon tests. Due to the complexity of integrating the reactors into the customers' plants, it is possible that there may be significant delays between our shipping the reactors and the reactors becoming operational and capable of being tested. There is therefore a risk that we may be unable to recognize revenue on our existing orders in our backlog for polysilicon products in a timely manner or at all, even if we fully perform our obligations in respect of such orders in a timely manner. Delays in customer acceptance of such orders could adversely affect further demand for our reactors and STC converters, and may adversely affect our financial condition, results of operations, business and/or prospects.
Additionally, due to the nature of our CVD contracts, there continues to be a risk that if we fail to perform our obligations in respect of an order, such order may be terminated and/or we may be required to pay damages or refund all or a portion of the purchase price.
Our quarterly operating results may fluctuate significantly in the future as a result of our revenue recognition policy relating to our polysilicon products and the significant size of our individual contracts for polysilicon products.
The market for polysilicon has been cyclical, resulting in periods of insufficient or excess production capacity and could result in variation in demand for our products.
The market for polysilicon has been cyclical. Polysilicon supply has increased due to an increase in polysilicon production capacity as a result of new entrants to the polysilicon production industry during 2008 and 2009. Polysilicon supply has also increased due to a slowdown in the solar panel market. These factors, among others, have resulted in excess polysilicon manufacturing capacity and declining prices in polysilicon. An excess in production capacity for polysilicon could adversely affect demand for our CVD reactors. A lack of demand for our CVD reactors could have a material adverse effect on our financial condition, results of operations, business and/or prospects. Conversely, if there are shortages of polysilicon in the future, the PV industry may be unable to continue to grow and/or may decline, and, as a result, demand for our solar products may decrease or may be eliminated.
We rely upon a limited number of suppliers of key components and manufacturers for our polysilicon products.
We use specialist manufacturers to provide vessels and power supplies which are essential to the manufacture and operation of our polysilicon products. Although we currently use five vessel manufacturers and three power supply manufacturers, there can be no assurance that we will be successful in maintaining relationships with any supplier, or that any suppliers will perform as we expect. Our failure to obtain components that meet our quality, quantity and cost requirements in a timely manner could interrupt or impair our ability to manufacture CVD reactors and/or STC converters, and/or increase our costs. In particular, there is a risk that manufacturers being used by us for the CVD reactors may not be able to deliver our products to us in a sufficiently timely manner to enable us to fulfill our obligations to the customer. As a result, we may face breach of contract claims
29
and our reputation may be harmed, which could interrupt or impair our ability to conduct and/or expand our polysilicon business and thereby have a material adverse effect on our financial condition, results of operations, business and/or prospects.
Risks Relating to the Photovoltaic Industry
We face competition from other manufacturers of equipment for photovoltaic products.
The solar energy industry and wider renewable energy industry are both highly competitive and continually evolving as participants strive to distinguish themselves within their niche markets and compete with the larger conventional electric power industry. In addition to solar equipment manufacturers, we face competition from companies producing and/or developing other PV technologies. Many of these competitors have, and future competitors may also have, substantially greater financial, technical, manufacturing and other resources than we do. These resources may provide these other manufacturers with a competitive advantage because they can realize economies of scale, synergies and purchase certain raw materials and key components at lower prices. Current and potential competitors of ours may also have greater brand name recognition, more established distribution networks and larger customer bases, and may be able to devote more resources to the research, development, promotion and sale of their products or to respond more quickly to evolving industry standards and changes in market conditions. Our failure to adapt to changing market conditions and to compete successfully with existing or new competitors may have a material adverse effect on our financial condition, results of operations, business and/or prospects.
Government subsidies and economic incentives for on-grid solar electricity applications could be reduced or eliminated.
Demand for PV equipment, including on-grid applications, has historically been dependant in part on the availability and size of government subsidies and economic incentives. Currently, the cost of solar electricity substantially exceeds the retail price of electricity in most major markets in the world. As a result, federal, state and local governmental bodies in many countries, most notably Germany, Italy, Spain, South Korea, Japan, China and the United States, have provided subsidies in the form of feed-in tariffs, rebates, tax write-offs and other incentives to end-users, distributors, systems integrators and/or manufacturers of PV products to promote the use of solar energy in on-grid applications and to reduce dependency on other forms of energy. Many of these government incentives are due to expire in time, phase out over time, cease upon exhaustion of the allocated funding and/or are subject to cancellation or non-renewal by the applicable authority. For example, in March, 2010 Germany announced a 16% reduction in their solar feed-in tariff rate for roof-top solar systems and the elimination of subsidies of ground-based solar systems on agricultural land, both of which become effective in July 2010. Spain, which has also been a major market for PV products, reduced subsidies in 2009 from 2,400 MW per year to 500 MW of solar projects. The reduction, expiration or elimination of relevant government subsidies or other economic incentives may result in the diminished competitiveness of solar energy relative to conventional and other renewable sources of energy, and adversely affect demand for PV equipment or result in increased price competition, all of which could cause our sales and revenue to decline and have a material adverse effect on our financial condition, results of operations, business and/or prospects.
Further, any government subsidies and economic incentives could be reduced or eliminated altogether at any time and for any reason. Relevant statutes or regulations may be found to be anti-competitive, unconstitutional or may be amended or discontinued for other reasons. For example, the predecessor to Germany's Renewable Energy Act, or EEG, was challenged in Germany on constitutional grounds and in the European Court of Justice as impermissible state aid. Although such challenge was unsuccessful, new proceedings challenging the EEG or comparable minimum price regulations in other countries in which we conduct our business may be initiated. Amendments to the
30
EEG are currently being discussed and there can be no assurance that subsidies and economic incentives under the EEG or other similar legislation in other countries will not be reduced or eliminated.
The reduction, expiration or elimination of relevant government subsidies or other economic incentives may result in the diminished competitiveness of solar energy relative to conventional and other renewable sources of energy, and adversely affect demand for PV equipment or result in increased price competition, all of which could cause our sales and revenue to decline and have a material adverse effect on our financial condition, results of operations, business and/or prospects.
Existing regulations and policies and changes to these regulations and policies may present technical, regulatory and economic barriers to the purchase and use of photovoltaic products.
The market for electricity generation products is heavily influenced by government regulations and policies concerning the electric utility industry, as well as policies promulgated by electric utilities. These regulations and policies often relate to electricity pricing and technical interconnection of user-owned electricity generation. In the United States and in a number of other countries, these regulations and policies are currently being modified and may be modified again in the future. These regulations and policies could deter end-user purchases of PV products and investment in the research and development of PV technology. For example, without a mandated regulatory exception for PV systems, utility customers are often charged interconnection or standby fees for putting distributed power generation on the electric utility grid. These fees could increase the cost to end-users of PV systems and make such systems less attractive to potential customers, which may have a material adverse effect on demand for our products and our financial condition, results of operations, business and/or prospects.
The photovoltaic industry may not be able to compete successfully with conventional power generation or other sources of renewable energy.
Although the PV industry has experienced substantial growth over the last five years, it still comprises a relatively small component of the total power generation market and competes with other sources of renewable energy, as well as conventional power generation. Many factors may affect the viability of widespread adoption of PV technology and thus demand for solar wafer manufacturing equipment, including the following:
- •
- cost-effectiveness of solar energy compared to conventional power generation and other renewable energy
sources;
- •
- performance and reliability of solar modules compared to conventional power generation and other renewable energy sources
and products;
- •
- availability and size of government subsidies and incentives to support the development of the solar energy industry;
- •
- success of other renewable energy generation technologies such as hydroelectric, wind, geothermal and biomass; and
- •
- fluctuations in economic and market conditions that affect the viability of conventional power generation and other renewable energy sources, such as increases or decreases in the prices of oil and other fossil fuels.
As a result of any of the foregoing factors, our financial condition, results of operations, business and/or prospects could be materially adversely affected.
31
Technological changes in the photovoltaic industry could render existing products and technologies uncompetitive or obsolete.
The PV industry is rapidly evolving and is highly competitive. Technological advances may result in lower manufacturing costs for PV products and/or PV product manufacturing equipment, and may render existing PV products and/or PV product manufacturing equipment obsolete. We will therefore need to keep pace with technological advances in the industry, including committing resources to ongoing research and development, acquiring new technologies, continually improving our existing products and continually expanding and/or updating our product offering, in order to compete effectively in the future. Our failure to further refine our technology and/or develop and introduce new solar power products could cause our products to become uncompetitive or obsolete, which could adversely affect demand for our products, and our financial condition, results of operations, business and/or prospects.
Risks Relating to Our Common Stock
The owners of our major stockholder, OCM and G3W, have significant influence over all matters submitted to a stockholder vote, which limit the ability of other stockholders to influence corporate activities and may adversely affect the market price of our common stock.
As of April 3, 2010, GT Solar Holdings, LLC owned or controlled approximately 53.4% of our common stock. Investment funds managed by OCM and G3W are the managing members and principal shareholders of GT Solar Holdings, LLC. As a result, OCM and G3W have substantial influence over the outcome of votes on all matters requiring approval by our stockholders, including the election of directors, the adoption of amendments to our certificate of incorporation and by-laws and approval of significant corporate transactions. OCM and G3W can also take actions that have the effect of delaying or preventing a change in control of us or discouraging others from making tender offers for our shares, which could prevent stockholders from receiving a premium for their shares. These actions may be taken even if other stockholders oppose them. Moreover, this concentration of stock ownership may make it difficult for stockholders to replace management. In addition, this significant concentration of stock ownership may adversely affect the trading price for our common stock because investors often perceive disadvantages in owning stock in companies with controlling stockholders. This concentration of control could be disadvantageous to other stockholders with interests different from those of our officers, directors and principal stockholder and the trading price of shares of our common stock could be adversely affected.
Conflicts of interest may arise because some of our directors are principals of our principal stockholder.
One managing director and one vice president of OCM serve on our eight-member board of directors. OCM and its affiliates may invest in entities that directly or indirectly compete with us or companies in which they currently invest may begin competing with us. As a result of these relationships, when conflicts between the interests of OCM and the interests of our other stockholders arise, these directors may not be disinterested. Although our directors and officers have a duty of loyalty to us under Delaware law and our certificate of incorporation, transactions that we enter into in which a director or officer has a conflict of interest are generally permissible so long as (1) the material facts relating to the director's or officer's relationship or interest as to the transaction are disclosed to our board of directors and a majority of our disinterested directors, or a committee consisting solely of disinterested directors, approves the transaction, (2) the material facts relating to the director's or officer's relationship or interest as to the transaction are disclosed to our stockholders and a majority of our disinterested stockholders approves the transaction or (3) the transaction is otherwise fair to us.
32
OCM and its affiliates and investment funds do not have any duty to refrain from engaging directly or indirectly in the same or similar business activities or lines of business that we do.
Under our certificate of incorporation, none of OCM/GFI Power Opportunities Fund II, L.P., OCM/GFI Power Opportunities Fund II (Cayman), L.P. or any of their respective affiliates and investment funds (together an "OCM/GFI Entity"), nor any director, officer, stockholder, member, manager and/or employee of an OCM/GFI Entity, has any duty to refrain from engaging directly or indirectly in the same or similar business activities or lines of business that we do. In the event that any OCM/GFI Entity acquires knowledge of a potential transaction or matter which may be a corporate opportunity for itself and us, we will not have any expectancy in such corporate opportunity, and the OCM/GFI Entity will not have any duty to communicate or offer such corporate opportunity to us and may pursue or acquire such corporate opportunity for itself or direct such opportunity to another person. In addition, OCM/GFI's representatives will not be required to offer to us any transaction opportunity of which they become aware and could take any such opportunity for themselves or offer it to other companies in which they have an investment, unless such opportunity is expressly offered to them solely in their capacity as a director of ours.
Future sales of our common stock, or the perception in the public markets that these sales may occur, could depress our stock price.
Future sales of substantial amounts of our common stock in the public market or the perception that these sales could occur, could adversely affect the price of our common stock and could impair our ability to raise capital through the sale of additional equity securities. In addition, future equity financings could also result in dilution to our stockholders and new securities could have rights, preferences and privileges that are senior to those of the shares offered hereby.
Our certificate of incorporation currently authorizes us to issue up to 500 million shares of common stock, and as of April 3, 2010, we had 143.8 million shares of common stock outstanding. Of these shares, 67.0 million shares are freely tradable, without restriction, in the public market. After the lockup agreements pertaining to our March 2010 offering expire on June 7, 2010, an additional 76.8 million shares will be eligible for sale in the public market, subject to applicable manner of sale and other limitations with respect to shares held by our affiliates under Rule 144 under the Securities Act of 1933, as amended, or Securities Act. Following the expiration of the lock-up period, investment funds managed by OCM and G3W will have demand registration rights under the Securities Act with respect to the sale of its remaining shares. If this right is exercised and a large number of shares are sold, these holders could cause the price of our common stock to decline. Moreover, as of April 3, 2010, 8.8 million shares of our common stock were issuable upon the exercise of outstanding vested and unvested options and upon vesting of restricted stock units.
Our certificate of incorporation and by-laws contain provisions that could discourage another company from acquiring us and may prevent attempts by our stockholders to replace or remove our current management.
Some provisions of our certificate of incorporation and by-laws may have the effect of delaying, discouraging or preventing a merger or acquisition that our stockholders may consider favorable, including transactions in which stockholders may receive a premium for their shares. In addition, these provisions may frustrate or prevent any attempts by our stockholders to replace or remove our current management by making it more difficult for stockholders to replace or remove our board of directors. These provisions include:
- •
- the removal of directors only by the affirmative vote of the holders of two-thirds of the shares of our
capital stock entitled to vote;
- •
- any vacancy on our board of directors, however occurring, including a vacancy resulting from an enlargement of the board, may only be filled by vote of the directors then in office;
33
- •
- inability of stockholders to call special meetings of stockholders or take action by written consent;
- •
- advance notice requirements for board nominations and proposing matters to be acted on by stockholders at stockholder
meetings; and
- •
- authorization of the issuance of "blank check" preferred stock without the need for action by stockholders.
Our common stock has only been publicly traded since July 24, 2008, and we expect that the price of our common stock may fluctuate substantially.
There has been a public market for our common stock only since July 24, 2008. Broad market, industry and economic factors may adversely affect the market price of our common stock, regardless of our actual operating performance. Factors that could cause fluctuations in our stock price may include, among other things:
- •
- actual or anticipated variations in quarterly operating results;
- •
- changes in market prices for our products or for our raw materials;
- •
- changes in our financial guidance or estimates made by us or by any securities analysts who may cover our stock or our
failure to meet the estimates made by securities analysts;
- •
- changes in the market valuations of other companies operating in our industry;
- •
- announcements by us or our competitors of significant acquisitions, strategic partnerships, divestitures or significant
contracts;
- •
- changes in governmental policies with respect to energy;
- •
- additions or departures of key personnel; and
- •
- sales of our common stock, including sales of our common stock by our directors and officers or by our principal stockholders.
Announcements of contract awards could have a significant impact on our stock price.
It is common in the PV sector for equipment manufacturers to enter into contracts for the sale and delivery of substantial amounts of equipment, involving highly competitive bidding situations. Public announcements of contract awards often cause a reaction in the stock market and affect, sometimes significantly, the trading price of the stock of the manufacturer that received a contract award. It could also have a negative effect on the trading price of stock of competitors that did not receive such contract. This reaction may be unrelated to the historical results of operations or financial condition of the affected companies or, in the case of unsuccessful competitors, any guidance they may have provided with respect to their future financial results. An announcement that a competitor of ours was awarded a significant customer contract could have a material adverse effect on the trading price of our stock.
Our quarterly operating results have fluctuated significantly in the past and we expect that our quarterly results will continue to fluctuate significantly in the future.
Our quarterly operating results have fluctuated significantly in the past and we expect that our quarterly results will continue to fluctuate significantly in the future. Future quarterly fluctuations may result from a number of factors, including:
- •
- the size of new contracts and when we are able to recognize the related revenue, especially with respect to our polysilicon products;
34
- •
- requests for delays in deliveries by our customers;
- •
- delays in customer acceptances of our products;
- •
- delays in deliveries from our vendors;
- •
- our rate of progress in the fulfillment of our obligations under our contracts;
- •
- the degree of market acceptance of our products and service offerings;
- •
- the mix of products and services sold;
- •
- budgeting cycles of our customers;
- •
- product lifecycles;
- •
- changes in demand for our products and services;
- •
- the level and timing of expenses for product development and sales, general and administrative expenses;
- •
- competition by existing and emerging competitors in the PV industry;
- •
- announcements by our competitors or customers of the awarding of a significant contract;
- •
- termination of contracts in our backlog;
- •
- our success in developing and selling new products and services, controlling costs, attracting and retaining qualified
personnel and expanding our sales force;
- •
- changes in government subsidies and economic incentives for on-grid solar electricity applications;
- •
- changes in our strategy;
- •
- foreign exchange fluctuations; and
- •
- general economic conditions.
Based on these factors, we believe our future operating results will vary significantly from quarter-to-quarter and year-to-year. As a result, quarter-to-quarter and year-to-year comparisons of operating results are not necessarily meaningful nor do they indicate what our future performance will be.
We currently do not intend to pay dividends on our common stock and as a result, the only opportunity to achieve a return on an investment in our common stock is if the price appreciates.
On August 1, 2008 we paid a dividend in the aggregate amount of $90.0 million to our then existing stockholders, including GT Solar Holdings, LLC. We currently do not expect to declare or pay dividends on our common stock in the foreseeable future. As a result, the only opportunity to achieve a return on an investment in our common stock will be if the market price of our common stock appreciates and the shares are sold at a profit. We cannot assure our investors that the market price for our common stock will ever exceed the price that was paid.
Our actual operating results may differ significantly from our guidance.
From time to time, we release guidance in our quarterly earnings releases, quarterly earnings conference call or otherwise, regarding our future performance that represent our management's estimates as of the date of release. This guidance, which includes forward-looking statements, is based on projections prepared by our management. These projections are not prepared with a view toward compliance with published guidelines of the American Institute of Certified Public Accountants, and
35
neither our registered public accountants nor any other independent expert or outside party compiles or examines the projections and, accordingly, no such person expresses any opinion or any other form of assurance with respect thereto.
Projections are based upon a number of assumptions and estimates that, while presented with numerical specificity, are inherently subject to significant business, economic and competitive uncertainties and contingencies, many of which are beyond our control and are based upon specific assumptions with respect to future business decisions, some of which will change. We generally state possible outcomes as high and low ranges which are intended to provide a sensitivity analysis as variables are changed but are not intended to represent that actual results could not fall outside of the suggested ranges. The principal reason that we release guidance is to provide a basis for our management to discuss our business outlook with analysts and investors. We do not accept any responsibility for any projections or reports published by any such persons. Guidance is necessarily speculative in nature, and it can be expected that some or all of the assumptions of the guidance furnished by us will not materialize or will vary significantly from actual results. Accordingly, our guidance is only an estimate of what management believes is realizable as of the date of release. Actual results will vary from our guidance and the variations may be material. In light of the foregoing, investors are urged not to rely upon, or otherwise consider, our guidance in making an investment decision in respect of our common stock.
Any failure to successfully implement our operating strategy or the occurrence of any of the events or circumstances set forth in our "Risk Factors" in this Annual Report on Form 10-K could result in the actual operating results being different from our guidance, and such differences may be adverse and material.
Item 1B. Unresolved Staff Comments
None.
Our headquarters and principal manufacturing facility are located in Merrimack, New Hampshire. The facility has approximately 106,000 square feet, and includes an advanced manufacturing center, as well as administrative, product development, sales, marketing and customer service facilities. Our manufacturing facility is equipped with advanced CAD software, computers and plotters for mechanical and electrical designs. We also own several additional acres of undeveloped land connected to our Merrimack facility, which could be used to accommodate future growth. In addition to increasing the size of our principal manufacturing facility, we believe we can expand our production capacity by way of additional shifts, further outsourcing agreements and the transfer of DSS and other product assembly and testing to the customer site.
36
In addition to our Merrimack, New Hampshire property, we conduct our operations through twelve leased facilities. Certain information regarding our leased facilities is set forth below:
Location
|
Approximate Size |
Expiration Date | Principal Function | |||
|---|---|---|---|---|---|---|
| Missoula, Montana | 14,744 sq. ft. | January 2013 | Office facility | |||
| Missoula, Montana | 6,180 sq. ft. | December 2012 | Manufacturing, warehousing | |||
| Missoula, Montana | 3,090 sq. ft. | December 2012 | Manufacturing, testing and research | |||
| Missoula, Montana | 3,090 sq. ft. | December 2010 | Equipment storage | |||
| Merrimack, New Hampshire | 19,500 sq. ft. | November 2011 | Manufacturing, office facilities and warehousing | |||
| Merrimack, New Hampshire | 50,360 sq. ft. | November 2010 | Warehousing | |||
| Shanghai, China | 50,000 sq. ft. | September 2013 | Light manufacturing, warehouse, offices | |||
| Shanghai, China | 4,629 sq. ft. | January 2011 | Warehousing | |||
| Shanghai, China | 3,128 sq. ft. | November 2011 | Office facilities | |||
| Shanghai, China | 388 sq. ft. | August 2010 | Office facilities | |||
| Beijing, China | 1,740 sq. ft. | September 2010 | Office facilities | |||
| Chupei City, Taiwan | 2,776 sq. ft. | July 2012 | Office facilities |
General
Beginning on August 1, 2008, seven putative securities class action lawsuits were commenced in the United States District Court for the District of New Hampshire (the "Court"), against us, certain of our officers and directors, certain underwriters of our July 24, 2008 initial public offering and others, including certain investors in us. On October 3, 2008, the Court entered an order consolidating these actions under the caption Braun et al. v. GT Solar International, Inc., et al (the "federal class action"). The Court selected the lead plaintiff and lead plaintiff's counsel in the federal class action on October 29, 2008. The lead plaintiff filed an amended consolidated complaint on December 22, 2008. The lead plaintiff asserts claims under various sections of the Securities Act. The amended consolidated complaint alleges, among other things, that the defendants made false and materially misleading statements and failed to disclose material information in certain SEC filings, including the registration statement and Prospectus for our July 24, 2008 initial public offering, and other public statements, regarding the status of our business relationship with LDK Solar, Ltd. Among other relief, the amended consolidated complaint seeks class certification, unspecified compensatory damages, rescission, interest, attorneys' fees, costs and such other relief as the Court should deem just and proper.
The defendants moved to dismiss the amended consolidated complaint on February 5, 2009. On September 22, 2009, the Court denied the defendants' motion. Following the Court's denial of the motion, the parties submitted a proposed joint case management order, which the Court approved on November 16, 2009. The case management order provides for discovery to close on May 25, 2011.
In addition, on September 18, 2008 a putative securities class action was filed in New Hampshire state court in the Superior Court for Hillsborough County, Southern District (the "State Court"), under the caption Hamel v. GT Solar International, Inc., et al., against us, certain of our officers and directors and certain underwriters of our July 24, 2008 initial public offering (the "state class action"). The state class action plaintiff asserts claims under various sections of the Securities Act of 1933, as amended. The state class action complaint alleges, among other things, that the defendants made false and materially misleading statements and failed to disclose material information in certain SEC filings, including the registration statement for our July 24, 2008 initial public offering, and other public
37
statements, regarding the status of our business relationship with LDK Solar. Among other relief, the state class action complaint seeks class certification, unspecified compensatory damages, rescission, interest, attorneys' fees, costs and such other relief as the State Court should deem just and proper.
We removed the state class action to the United States District Court for the District of New Hampshire on October 22, 2008. The state class action was consolidated with the federal class action on November 25, 2008. On February 2, 2009, the federal Court granted the plaintiff's motion to remand the state class action to New Hampshire State Court. On May 4, 2009, the parties agreed to a stay of the state class action, pending resolution of the motion to dismiss in the consolidated federal case. At a case structuring conference on June 3, 2009, the state court endorsed the proposed joint case management order filed by the parties which requires coordination of any discovery to be taken in the state class action with that taken in the federal class action. With the denial of the motion to dismiss the federal action, the parties submitted a proposed joint case management order to the State Court on November 6, 2009. On January 12, 2010, the State Court granted a joint motion of the parties to transfer the state class action to the State Court's Business and Commercial Dispute Docket.
A derivative suit, captioned Fan v. GT Solar Int'l, Inc., et al., was filed in New Hampshire State Court on January 14, 2009 (the "derivative action"). The derivative complaint is asserted nominally on behalf of the Company against certain of our directors and officers and alleges various claims for breach of fiduciary duty, unjust enrichment, abuse of control, and gross mismanagement. The derivative complaint is premised on the same allegations asserted in the federal class action. On April 10, 2009, the State Court granted our motion to stay the derivative action, pending resolution of the motion to dismiss in the federal action. In accordance with the terms of the stay the parties have conferred regarding a case management schedule for the derivative action. The derivative action remains stayed.
We intend to defend these actions vigorously. There can be no assurance, however, that we will be successful, and an adverse resolution of any of the lawsuits could have a material adverse effect on our consolidated financial position and results of operations. We are not presently able to reasonably estimate potential losses, if any, related to the lawsuits.
We are subject to various other routine legal proceedings and claims incidental to our business, which we believe will not have a material adverse effect on our financial position, results of operations or cash flows.
Item 4. (Removed and Reserved)
38
Item 5. Market for Registrant's Common Equity, Related Stockholder Matters and Issuer Purchases of Equity Securities
Price Range of Common Stock
Our common stock has been listed on The NASDAQ Global Select Market under the symbol "SOLR" since July 24, 2008. Prior to this time, there was no public market for our common stock. The following table sets forth the range of high and low closing sales prices per share as reported on The NASDAQ Global Select Market for the periods indicated.
| |
High | Low | ||||||
|---|---|---|---|---|---|---|---|---|
Fiscal 2010 |
||||||||
Fourth Quarter |
$ | 6.40 | $ | 5.06 | ||||
Third Quarter |
$ | 6.05 | $ | 4.64 | ||||
Second Quarter |
$ | 6.98 | $ | 4.77 | ||||
First Quarter |
$ | 8.27 | $ | 5.14 | ||||
Fiscal 2009 |
||||||||
Fourth Quarter |
$ | 6.64 | $ | 2.62 | ||||
Third Quarter |
$ | 10.85 | $ | 1.75 | ||||
Second Quarter (since July 24, 2008) |
$ | 14.59 | $ | 8.47 | ||||
The closing sales price of our common stock on The NASDAQ Global Select Market was $5.46 per share on May 28, 2010. As of May 28, 2010 there were approximately 156 record holders of our common stock. Because many of such shares are held by brokers and other institutions on behalf of stockholders, we are unable to estimate the total number of stockholders represented by these record holders.
Dividend Policy
On June 30, 2008, we declared a cash dividend of $90.0 million to our stockholders of record as of June 30, 2008, including GT Solar Holdings, LLC. That dividend was paid on August 1, 2008. We do not intend to pay any other dividends on our common stock for the foreseeable future. Our credit facilities place restrictions on our ability and the ability of our subsidiaries to pay cash dividends.
Use of Proceeds from Public Offerings
We did not receive any proceeds from our July 2008 initial public offering or our March 2009 secondary public offering. All of the shares of common stock were sold by GT Solar Holdings, LLC, the selling stockholder named in the prospectus. GT Solar Holdings, LLC used the net proceeds it received to make distributions to its shareholders.
Stock Price Performance Graph
The following graph compares the cumulative return attained by shareholders on GT Solar International, Inc.'s common stock since July 24, 2008 relative to the cumulative total returns of the NASDAQ Composite Index, the NASDAQ Clean Edge U.S. Index and the Ardour Solar Energy Index. An investment of $100 (with reinvestment of all dividends) is assumed to have been made in our common stock and in each index on July 24, 2008 and its relative performance is tracked through April 3, 2010. No cash dividends have been declared on shares of our common stock since July 24, 2008, the date the shares commenced trading. This performance graph is not "soliciting material," is not deemed filed with the SEC and is not to be incorporated by reference in any filing by us under the Securities Act of 1933, as amended (the "Securities Act"), or the Exchange Act, whether made before
39
or after the date hereof and irrespective of any general incorporation language in any such filing. The stock price performance shown on the graph represents past performance and should not be considered an indication of future price performance.
COMPARISON OF 20 MONTH CUMULATIVE TOTAL RETURN*
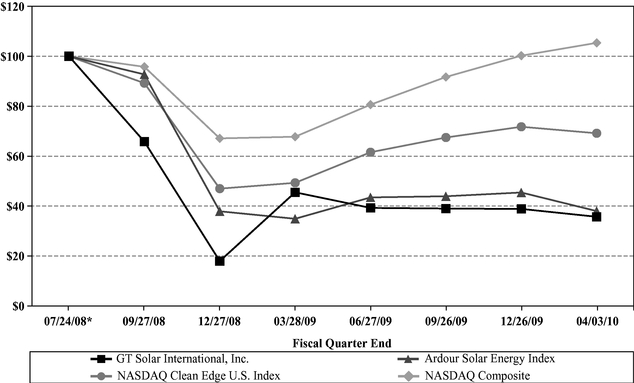
| |
07/24/08* | 09/27/08 | 12/27/08 | 03/28/09 | 06/27/09 | 09/26/09 | 12/26/09 | 04/03/10 | |||||||||||||||||
|---|---|---|---|---|---|---|---|---|---|---|---|---|---|---|---|---|---|---|---|---|---|---|---|---|---|
GT Solar International, Inc. |
100.00 | 65.80 | 17.96 | 45.51 | 39.27 | 39.00 | 38.86 | 35.71 | |||||||||||||||||
Ardour Solar Energy Index |
100.00 | 92.72 | 37.91 | 34.91 | 43.47 | 43.93 | 45.44 | 37.99 | |||||||||||||||||
NASDAQ Clean Edge U.S. Index |
100.00 | 89.23 | 46.98 | 49.31 | 61.56 | 67.46 | 71.76 | 69.16 | |||||||||||||||||
NASDAQ Composite |
100.00 | 95.76 | 67.11 | 67.77 | 80.62 | 91.70 | 100.24 | 105.37 | |||||||||||||||||
- *
- $100 invested on 7/24/08 in stock and in index, including, for purposes of each index, reinvestment of dividends.
Note:
- (1)
- GT
Solar International, Inc. (SOLR) total return based upon $14.59 per share price at close of first day trading. The IPO price was $16.50 per share.
- (2)
- The
Ardour Solar Energy Index (SOLRX) is a rules-based, modified global-capitalization-weighted, float-adjusted index consisting of companies engaged in
solar power and related products and services with market capitalization exceeding $100 million and average three months trading volumes equal to or greater than $1 million a day.
- (3)
- The NASDAQ® Clean Edge® Green Energy Index (CELS) is a modified market capitalization-weighted index consisting of companies that are primarily manufacturers, developers, distributors, or installers of clean-energy technologies with market capitalization exceeding $150 million and average daily trading volumes of at least 100 thousand shares year-to-date.
40
Recent Sales of Unregistered Securities
On February 9, 2010, we issued 10,772 restricted stock units to Oaktree Capital Management, L.P. in lieu of issuing restricted stock units to Mr. R. Chad Van Sweden, one of our directors. The restricted stock units were issued in reliance upon applicable exemptions from registration under Section 4(2) of the Securities Act and Section 506 of Regulation D promulgated thereunder. Each restricted stock unit represents the right to receive one share of our common stock and will vest one year from the date of grant, subject to the continued service of Mr. Van Sweden as a director.
Purchases of Equity Securities by the Issuer and Affiliate Purchases
The following table sets forth information in connection with purchases made by, or on behalf of, us or any affiliated purchaser, of shares of our common stock during the three months ended April 3, 2010:
| |
(a) Total Number of Shares Purchased |
(b) Average Price Paid per Share |
(c) Total Number of Shares Purchased as Part of Publicly Announced Plans or Programs |
(d) Maximum Number (or Approximate Dollar Value) of Shares that May Yet Be Purchased Under the Plans or Programs |
|||||||||
|---|---|---|---|---|---|---|---|---|---|---|---|---|---|
Month ended January 30, 2010 |
11,033 | $ | 5.90 | — | — | ||||||||
Month ended February 27, 2010 |
4,504 | $ | 5.63 | — | — | ||||||||
Month ended April 3, 2010 |
3,015 | $ | 5.43 | — | — | ||||||||
We did not repurchase any of our common stock on the open market as part of a stock repurchase program during the fiscal year ended April 3, 2010; however, our employees surrendered, and we subsequently retired, 117,687 shares of our common stock to satisfy the minimum tax withholding obligations on the vesting of restricted stock awards issued under our 2008 Equity Incentive Plan.
Item 6. Selected Consolidated Financial Data
The following selected consolidated financial data should be read together with "Item 7. Management's Discussion and Analysis of Financial Conditions and Results of Operations" and our consolidated financial statements and the accompanying notes thereto included elsewhere in this Annual Report on Form 10-K.
The selected financial data as of December 31, 2005 and for the period from April 1, 2005 through December 31, 2005 have been derived from the historical consolidated financial statements of the Predecessor, and the selected financial data as of March 31, 2006 and for the period from January 1, 2006 through March 31, 2006 have been derived from the historical consolidated financial statements of GT Solar. Historical results are not necessarily indicative of the results expected in the future.
The financial data as of March 31, 2006, for the period from January 1, 2006 through March 31, 2006 and as of and for the fiscal years ended March 31, 2007, March 31, 2008, and March 28, 2009 reflect the consolidated financial position, results of operations and cash flows of GT Solar subsequent to the date of the Acquisition and includes adjustments required under the purchase method of accounting. In addition, the balance sheet data of GT Solar as of January 1, 2006, include adjustments required under the purchase method of accounting. In accordance with the requirements of purchase accounting, the assets and liabilities of GT Solar were adjusted to their estimated fair values and the resulting goodwill was recorded as of the transaction date. The application of purchase accounting will generally result in higher depreciation and amortization expense in future periods. Accordingly, the accompanying consolidated financial information of the Predecessor and GT Solar are not comparable in all material respects because of the effects of purchase accounting.
41
Effective April 1, 2008 we changed our reporting period to be based on a 52-week year that ends on the Saturday closest to March 31, which in our fiscal year ended April 3, 2010 resulted in a 53-week fiscal year.
| |
GT Solar | Combined Predecessor/ GT Solar |
GT Solar | Predecessor | |||||||||||||||||||
|---|---|---|---|---|---|---|---|---|---|---|---|---|---|---|---|---|---|---|---|---|---|---|---|
| |
(in thousands, except per share amounts) |
||||||||||||||||||||||
| |
Fiscal Year Ended April 3, 2010 |
Fiscal Year Ended March 28, 2009 |
Fiscal Year Ended March 31, 2008 |
Fiscal Year Ended March 31, 2007 |
Fiscal Year Ended March 31, 2006(2) |
January 1, 2006 to March 31, 2006 |
April 1, 2005 to Dec. 31, 2005(1) |
||||||||||||||||
Statement of Operations Data: |
|||||||||||||||||||||||
Revenue |
$ | 544,245 | $ | 541,027 | $ | 244,052 | $ | 60,119 | $ | 46,754 | $ | 2,106 | $ | 44,648 | |||||||||
Cost of Revenue |
325,263 | 326,358 | 151,709 | 36,284 | 28,334 | 2,442 | 25,892 | ||||||||||||||||
Gross Profit (Loss) |
218,982 | 214,669 | 92,343 | 23,835 | 18,420 | (336 | ) | 18,756 | |||||||||||||||
Research and Development |
21,410 | 18,323 | 10,517 | 3,810 | 1,816 | 659 | 1,157 | ||||||||||||||||
Selling and Marketing |
11,823 | 17,469 | 10,452 | 7,747 | 4,175 | 334 | 3,841 | ||||||||||||||||
General and Administrative |
38,623 | 32,228 | 21,435 | 10,562 | 28,618 | 4,068 | 24,550 | ||||||||||||||||
Amortization of Intangible Assets(3) |
3,164 | 3,105 | 3,018 | 15,446 | 4,426 | 3,862 | 564 | ||||||||||||||||
Income (Loss) from Operations |
143,962 | 143,544 | 46,921 | (13,730 | ) | (20,615 | ) | (9,259 | ) | (11,356 | ) | ||||||||||||
Interest Income(4) |
420 | 2,996 | 6,543 | 1,686 | 227 | 79 | 148 | ||||||||||||||||
Interest Expense(4) |
(758 | ) | (483 | ) | (816 | ) | (2,346 | ) | (584 | ) | (299 | ) | (285 | ) | |||||||||
Interest component of forward foreign exchange contracts(4) |
(625 | ) | 2,135 | (835 | ) | (114 | ) | — | — | — | |||||||||||||
Other Income (Expense)(5) |
(3,125 | ) | (6,012 | ) | (1,244 | ) | (5,667 | ) | (3,489 | ) | (82 | ) | (3,407 | ) | |||||||||
Income (Loss) before Income Taxes |
139,874 | 142,180 | 50,569 | (20,171 | ) | (24,461 | ) | (9,561 | ) | (14,900 | ) | ||||||||||||
Provision for (benefit from) Income Taxes |
52,618 | 54,212 | 14,464 | (1,816 | ) | (2,627 | ) | (2,627 | ) | — | |||||||||||||
Net Income (Loss) |
$ | 87,256 | $ | 87,968 | $ | 36,105 | $ | (18,355 | ) | $ | (21,834 | ) | $ | (6,934 | ) | $ | (14,900 | ) | |||||
Income (Loss) per Common Share: |
|||||||||||||||||||||||
Basic |
$ | 0.61 | $ | 0.62 | $ | 0.25 | $ | (0.13 | ) | $ | (0.15 | ) | $ | (0.05 | ) | $ | (48.67 | ) | |||||
Diluted |
0.60 | 0.61 | 0.25 | (0.13 | ) | (0.15 | ) | (0.05 | ) | (48.67 | ) | ||||||||||||
Shares used to compute Income (Loss) per Common Share: |
|||||||||||||||||||||||
Basic |
143,409 | 142,582 | 142,290 | 142,290 | 142,290 | 142,290 | 306 | ||||||||||||||||
Diluted |
145,390 | 144,471 | 144,059 | 142,290 | 142,290 | 142,290 | 306 | ||||||||||||||||
Dividends paid per Common Share(6) |
— | $ | 0.632 | — | — | — | — | — | |||||||||||||||
Balance Sheet Data (at end of period)(7): |
|||||||||||||||||||||||
Cash and Cash Equivalents |
$ | 230,748 | $ | 107,148 | $ | 54,839 | $ | 74,059 | $ | 6,026 | $ | 6,026 | $ | 3,192 | |||||||||
Short-term Investments |
19,967 | — | — | — | — | — | — | ||||||||||||||||
Restricted Cash(8) |
— | — | 164,028 | 9,322 | 567 | 567 | 1,846 | ||||||||||||||||
Deferred Revenue |
334,347 | 348,127 | 164,190 | 64,667 | 24,076 | 24,076 | 1,865 | ||||||||||||||||
Working Capital(9) |
177,150 | 57,672 | 33,039 | (11,234 | ) | (3,273 | ) | (3,273 | ) | (1,517 | ) | ||||||||||||
Total Assets |
732,081 | 737,423 | 600,611 | 241,429 | 122,337 | 122,337 | 107,346 | ||||||||||||||||
Total Debt |
— | — | — | 15,934 | 15,000 | 15,000 | 15,000 | ||||||||||||||||
Stockholders' Equity |
178,986 | 81,905 | 91,641 | 47,098 | 63,827 | 63,827 | 67,763 | ||||||||||||||||
Cash Flow Data: |
|||||||||||||||||||||||
Cash provided by (used in): |
|||||||||||||||||||||||
Operating Activities |
$ | 147,276 | $ | 152,872 | $ | 1,532 | $ | 70,659 | $ | 6,816 | $ | 3,045 | $ | 3,771 | |||||||||
Investing Activities |
(24,540 | ) | (10,959 | ) | (4,841 | ) | (2,324 | ) | (767 | ) | (211 | ) | (556 | ) | |||||||||
Financing Activities |
863 | (89,614 | ) | (15,934 | ) | (305 | ) | (3,701 | ) | — | (3,701 | ) | |||||||||||
Other |
1 | 10 | 23 | 3 | — | — | — | ||||||||||||||||
Increase (Decrease) in Cash and Cash Equivalents |
$ | 123,600 | $ | 52,309 | $ | (19,220 | ) | $ | 68,033 | $ | 2,348 | $ | 2,834 | $ | (486 | ) | |||||||
Other Financial Data: |
|||||||||||||||||||||||
Depreciation and Amortization |
$ | 6,870 | $ | 5,111 | $ | 4,052 | $ | 16,067 | $ | 4,427 | $ | 3,995 | $ | 432 | |||||||||
Capital Expenditures |
4,573 | 10,509 | 4,483 | 1,801 | 612 | 115 | 497 | ||||||||||||||||
- (1)
- In connection with the Acquisition, the Predecessor repurchased all of its outstanding stock options for approximately $24.1 million, which is calculated as the aggregate of the difference between the exercise price of such options and the
42
common stock acquisition price. This payment was subsequently reimbursed by GT Solar Holdings, LLC, and was recorded as compensation expense by the Predecessor in the period from April 1, 2005 to December 31, 2005. This compensation expense was allocated to employees associated with the following expenses: Cost of Revenues—$0.4 million; Research and Development—$0.1 million; Selling and Marketing—$0.8 million; and General and Administrative—$23.0 million.
- (2)
- The
combined fiscal year ended March 31, 2006, represents the mathematical addition of our Predecessor's results of operations from April 1,
2005 to December 31, 2005, and GT Solar's results of operations from January 1, 2006 to March 31, 2006. We have included the combined financial information in order to facilitate
a comparison with our other fiscal years. This presentation is not consistent with generally accepted accounting principles in the United States, or U.S. GAAP, and may yield results that are
not strictly comparable on a period-to-period basis primarily due to (i) the impact of required purchase accounting adjustments and (ii) the new basis of
accounting established on the closing date of the Acquisition. Such results are not necessarily indicative of what the results for the respective periods would have been had the Acquisition not
occurred.
- (3)
- The
application of purchase accounting in connection with the Acquisition resulted in the recording of $30.3 million of intangible assets, the
amortization of which amounted to $3.9 million for the period from January 1, 2006 to March 31, 2006 and $15.4 million, $3.0 million, $2.7 million and
$2.5 million for the fiscal years ended March 31, 2007, March 31, 2008, March 28, 2009, and April 3, 2010 respectively. For more information on the impact of
purchase accounting adjustments, please see "Management's Discussion and Analysis of Financial Condition and Results of Operations—Company Overview."
- (4)
- For
the fiscal year ended April 3, 2010, the interest component of forward foreign exchange contracts has been classified separately from interest
income and interest expense. All prior periods presented have been reclassified to conform to the current presentation.
- (5)
- For
the period from April 1, 2005 to December 31, 2005, other expense includes $3.4 million in costs associated with the Acquisition.
For the fiscal year ended March 31, 2007, other expense includes $5.8 million of costs related to a proposed equity offering that was abandoned in November 2006 and our initial public
offering. For the fiscal year ended March 31, 2008, other expense includes $1.6 million of costs related to our initial public offering. For the fiscal year ended March 28, 2009,
other expense includes $2.6 million of costs related to our initial public offering and $3.0 million attributed to the ineffective portion of certain forward foreign exchange contracts.
For the fiscal year ended April 3, 2010, other expense includes $2.1 million attributed to the ineffective portion of certain forward foreign exchange contracts and $0.8 million
of costs related to a secondary public offering of our common stock.
- (6)
- On
June 30, 2008, we declared a dividend in the aggregate amount of $90.0 million to our then existing stockholders, including GT Solar
Holdings, LLC, which was paid on August 1, 2008.
- (7)
- Balance
sheet data as of December 31, 2005 reflects adjustments recorded immediately after the Acquisition on January 1, 2006 as discussed
further in Note 1 to the consolidated financial statements.
- (8)
- Restricted
cash includes cash held in escrow as collateral in respect of outstanding standby letters of credit related to customer deposits and as security
for bank fees.
- (9)
- Working capital represents current assets minus current liabilities.
Item 7. Management's Discussion and Analysis of Financial Condition and Results of Operations
The following discussion and analysis of our financial condition and results of operations should be read in conjunction with our consolidated financial statements and the related notes included elsewhere in this Annual Report on Form 10-K. In addition to historical consolidated financial information, the following discussion and analysis contains forward-looking statements that involve risks, uncertainties and assumptions as described under the "Cautionary Statement Concerning Forward-Looking Statements," that appears earlier in this Annual Report on Form 10-K. Our actual results could differ materially from those anticipated by these forward-looking statements as a result of many factors, including those discussed under "Item 1A. Risk Factors" and elsewhere in this Annual Report on Form 10-K.
Our Company
GT Solar International, Inc., through its subsidiaries (referred to collectively herein as "we," "us" and "our") is a leading global provider of polysilicon production technology, crystalline ingot growth systems and related photovoltaic manufacturing services for the solar industry. Our customers include several of the world's largest solar companies as well as companies in the chemical industry.
43
Our principal products are:
- •
- Chemical vapor deposition (CVD) reactors and related equipment used to produce polysilicon, the key raw material used in
silicon-based solar wafers and cells; and
- •
- Directional solidification systems (DSS) furnaces and related equipment used to cast multicrystalline ingots by melting and cooling polysilicon in a precisely controlled process. These ingots are used to make photovoltaic (PV) wafers which are, in turn, used to make solar cells.
We operate through two segments: our PV business and our polysilicon business.
Our PV business manufactures and sells DSS units, ancillary equipment required in the operation of the DSS unit as well as other related parts and consumables. We sell our products separately and as part of "turnkey solutions," where we bundle equipment, including third party equipment, with design and integration expertise.
Our polysilicon business offers CVD reactors and related equipment specifically designed for the production of polysilicon. In addition to CVD reactors we provide technology and engineering services for the commissioning, startup and optimization of our equipment and technology. We also provide the basic engineering packages and process licenses for the production and purification of trichlorosilane and silane.
Our business was founded in 1994. Effective January 1, 2006, our business was acquired for approximately $83 million by GT Solar Holdings, LLC, a newly formed company controlled by investment funds affiliated with G3W Ventures LLC, or "G3W" a private equity investment firm focused on the energy sector, and Oaktree Capital Management, L.P., or "OCM" a global alternative and non-traditional investment manager. We refer to this transaction as the "Acquisition." The Acquisition was accounted for using the purchase method of accounting. In accordance with the requirements of purchase accounting, our assets and liabilities were adjusted to their estimated fair values and the resulting goodwill of $43.2 million was recorded as of the transaction date.
In July 2008, we completed an initial public offering of 30,300,000 shares of common stock held by GT Solar Holdings, LLC. In March 2010, we completed a secondary public offering of 28,750,000 shares of common stock held by GT Solar Holdings, LLC. As of April 3, 2010, GT Solar Holdings, LLC owned or controlled approximately 53% of our common stock.
Factors Affecting Our Results of Operations
Demand for our products and services are driven by end-user demand for solar power. Key drivers of the growing demand for solar power include volatile prices of conventional energy sources, the desire for energy security/energy independence to counter perceived geopolitical supply risks surrounding fossil fuels, environmental pollution from fossil fuels and the resulting tightening of emission controls, the increasingly competitive cost of energy from renewable energy sources, government incentive programs for the development of solar energy making solar energy more cost competitive and changing consumer preferences towards renewable energy sources.
In addition, our results of operations are affected by a number of external factors including the availability and price of polysilicon in the market, availability of raw materials, foreign exchange rates, interest rates, commodity prices (particularly steel and graphite prices) and macroeconomic factors, including the availability of capital that may be needed by our customers, and political, regulatory and legal conditions in the international markets in which we conduct business (including China).
Our results of operations are affected by a number of other factors including, among other things, when we are able to recognize revenue under our contracts. Our revenue recognition policies often require us to defer revenue from shipped products and recognize revenue at a later date as more fully described under the caption Note 2—Significant Accounting Policies—Revenue Recognition in the
44
Notes to Consolidated Financial Statements included elsewhere in this Annual Report on Form 10-K. Other factors affecting operations include delays in customer acceptances of our products, delays of deliveries of ordered products and our rate of progress in the fulfillment of our obligations under our contracts. A delay in deliveries or cancellations of orders would cause us to have inventories in excess of our short-term needs, and may delay our ability to recognize, or prevent us from recognizing revenue on contracts in our order backlog.
Disruptions in the global capital markets have resulted in reduced availability of capital worldwide and have contributed to a slower rate of spending by our customers. Although we continue to believe that the effect of these uncertainties is somewhat mitigated by our requirement of substantial non-refundable deposits on most orders, we have negotiated extensions of the delivery schedules and other modifications under some of our existing contracts. In addition, some of our customers failed to make deposits when due under their contracts and we terminated those contracts. We continue to negotiate with certain of our customers and are unable to estimate the additional impact, if any, on our financial statements until such negotiations conclude and the timing of deliveries and other terms are finalized as more fully described under the heading—"Order Backlog".
Worldwide manufacturing capacity of polysilicon has grown due to recent entrants and expansion by existing manufacturers that occurred during 2008 and 2009. These factors, among others, have resulted in excess polysilicon manufacturing capacity which in turn has caused significant declines in the price of polysilicon. Although we believe declining polysilicon costs will benefit the PV industry and will lead to increased demand for solar energy over the long term, lower polysilicon prices have negatively impacted the profitability of many existing polysilicon manufacturers and caused some companies to reduce or delay their expansion plans. We believe that the demand for CVD reactors will increase in anticipation of a tightening supply/demand balance driven by the need to increase the amount of economically viable capacity. However, because of the long lead-times required to install capacity, it is difficult to predict when this will occur.
Demand for PV equipment, including on-grid applications, has historically been dependent in part on the availability and size of government subsidies and economic incentives. The ability of a government to provide economic incentives may be adversely impacted by the recent economic downturn. For example, Germany, which has the world's largest PV installed base, has announced a 16% reduction in their solar feed-in tariff rate for roof-top solar systems and the elimination of ground-based solar systems on agricultural land both of which become effective in July 2010. Spain, which has also been a major market for PV products, reduced subsidies in 2009 from 2,400 MW per year to 500 MW per year for solar projects. It is difficult to determine the impact that a changing incentive program has on solar module demand and our customer's ability to sell solar modules in a particular geographic market. We believe decreasing module costs will reduce the effect of tariffs on the investment returns for solar projects. In contrast to decreasing incentives in Europe, China has recently announced policies to stimulate the renewable energy sector in China, including solar power. The changing environment for such government incentive programs creates uncertainty for the solar industry.
Although we believe our long-term prospects are in line with solar industry forecasts which generally predict increasing PV demand through 2014, those forecasts vary widely due to the current uncertainties in the capital markets and end-user solar markets, as well as industry-wide underutilization of solar manufacturing capacity. The current excess capacity in solar manufacturing is expected to result in lower prices for our PV products which could result in reduced margins if we are unable to reduce our costs. We are taking several steps to mitigate the effect of these factors including adjusting our pricing policies as necessary, continuously seeking cost reduction opportunities including diversification into lower cost manufacturing regions and focusing our research and development efforts on improvements that reduce the total production costs to our customers.
45
Our quarterly results have fluctuated significantly in the past and we expect that our quarterly results will continue to fluctuate significantly in the future.
Order Backlog
Our order backlog consists of signed purchase orders or other written contractual commitments. The table below sets forth our order backlog as of April 3, 2010 and March 28, 2009 by product category:
| |
April 3, 2010 | March 28, 2009 | |||||||||||
|---|---|---|---|---|---|---|---|---|---|---|---|---|---|
Product Category
|
Amount | % of Backlog |
Amount | % of Backlog |
|||||||||
| |
(dollars in millions) |
||||||||||||
Photovoltaic business |
$ | 441 | 49 | % | $ | 341 | 29 | % | |||||
Polysilicon business |
465 | 51 | % | 836 | 71 | % | |||||||
Total |
$ | 906 | 100 | % | $ | 1,177 | 100 | % | |||||
Our order backlog as of April 3, 2010, included deferred revenue of $82.1 million related to our photovoltaic business and $252.2 million related to our polysilicon business. Deferred revenue represents equipment that had been shipped to customers but not yet recognized as revenue. Cash received in deposits related to our order backlog were $119.6 million as of April 3, 2010, and substantially all of the contracts in our order backlog require the customer to either post a standby letter of credit in our favor or make advance payment prior to shipment of equipment. From the date of a written commitment, we generally would expect to deliver PV products over a period ranging from three to nine months and polysilicon products over a period ranging from twelve to eighteen months, although portions of the related revenue are expected to be recognized over longer periods in many cases. Disregarding the effect of any contract terminations or modifications, we would expect to convert approximately 50% of our April 3, 2010 order backlog into revenue during fiscal year 2011, and approximately 50% during fiscal 2012 and 2013. Although, most of our orders require substantial non-refundable deposits, our order backlog as of any particular date should not be relied upon as indicative of our revenues for any future period. We began tracking our backlog as a performance measure on a consistent basis during 2007.
If a customer fails to perform on a timely basis, and such failure continues after notice of breach and a cure period, we may terminate the contract. Our contracts do not contain cancellation provisions and in the event of a customer breach, the customer may be liable for contractual damages. During the fiscal year ended April 3, 2010, we terminated or modified contracts resulting in a $105 million reduction in our order backlog (95% of the reduction was from 9 contracts) as compared to the fiscal year ended March 28, 2009, where we terminated or modified contracts resulting in a $39 million reduction in our order backlog (95% of the reduction was from 7 contracts). During the fiscal year ended April 3, 2010 and March 28, 2009 we recorded revenues of $21.1 million and $4.0 million, respectively, from terminated contracts.
Although we have a reasonable expectation that most of our customers will substantially perform on their contractual obligations, we monitor those contracts that we believe to be at risk which include contracts with customers to whom we have sent notices of breach for failure to provide letters of credit or to make payments when due. We conduct negotiations with certain customers who have requested that we extend their delivery schedules or make other contract modifications or who have not provided letters of credit or made payments in accordance with the terms of their contracts. We engage in a certain level of these negotiations in the ordinary course. We monitor the effect, if any, that these negotiations may have on our future revenue recognition. If we cannot come to an agreement with these customers, our order backlog could be reduced.
46
As a result of the economic downturn that began during the fiscal year ended March 28, 2009, we experienced an increase in the amount of backlog that we considered to be at risk which was substantially higher than in prior periods. As a result of contract terminations which occurred during the fiscal year ended April 3, 2010 and the satisfactory resolution of other contracts that were considered at risk to varying degrees, our assessment of the risk in our order backlog as of April 3, 2010 is substantially lower than our estimates in prior interim periods. However, other customers with contracts in our order backlog that are not currently under negotiation may approach us with similar requests in the future, or may fail to provide letters of credit or to make payments when due, which could further reduce our order backlog. If we cannot come to an agreement with these customers, our order backlog could be further reduced.
As of April 3, 2010, our order backlog consisted of contracts with 26 PV customers, 14 of which have orders of $3 million or greater and contracts with 7 polysilicon customers, 6 of which have orders of $3 million or greater. Our order backlog as of April 3, 2010, included $619 million attributed to three customers each representing 10% or more our order backlog.
Critical Accounting Policies and Estimates
In preparing our financial statements in conformity with generally accepted accounting principles in the United States (GAAP), we make estimates and assumptions about future events that affect the amounts of reported assets, liabilities, revenues and expenses, as well as the disclosure of contingent liabilities in our financial statements and the related notes thereto. On a continual basis, we evaluate our estimates, including those related to revenue, deferred revenue, inventory, goodwill, warranty, shared-based compensation, income taxes and derivative financial instruments and hedging agreements. We operate in a competitive industry that is influenced by a variety of diverse factors including, but not limited to, technological advances, product life cycles, long customer and supplier lead times, and geographic and macroeconomic trends. Estimating product demand beyond a relatively short forecasting horizon is difficult and prone to forecasting error due to the inherent lack of visibility in the industry. Some of our accounting policies require the application of significant judgment by management in the selection of appropriate assumptions for determining these estimates. By their nature, these judgments are subject to an inherent degree of uncertainty. As a result, we cannot assure you that actual results will not differ significantly from estimated results. We base our judgments and estimates on our historical experience, on our forecasts and on other available information, as appropriate. Our significant accounting policies are further described in Note 2 to our consolidated financial statements for the fiscal year ended April 3, 2010 included elsewhere in this Annual Report on Form 10-K.
We believe that the following are the critical accounting policies which are the most important to the portrayal of our financial condition and that require the most subjective judgment used by us in the preparation of our consolidated financial statements.
Revenue Recognition
We recognize revenue when title and risk of loss have passed to the customer, evidence of an arrangement exists, fees are contractually fixed or determinable, collectability is reasonably assured through historical collection results and regular credit evaluations, and there are no uncertainties regarding customer acceptance. Our revenue recognition policies for established products differ from our newer products. Our revenue recognition policies are described in further detail below.
Multiple contracts with a single customer or amendments to existing contracts with the same customer are evaluated as to whether they should be recognized as separate accounting arrangements from other contracts with the customer based on an evaluation of several factors including but not limited to the timing of when contracts were negotiated and executed, whether the equipment is
47
interdependent in terms of design, technology or function and whether payment terms coincide. If contracts are considered linked for accounting purposes they are accounted for as one arrangement.
For most products, a portion of the total sales price (typically 10%) is not due until installation and customer acceptance occurs. For products we consider to be "established," we recognize, upon delivery, revenue equal to the lesser of the amount allocated to the equipment or the contractual amount due (typically 90%) with the remainder recognized upon customer acceptance. For products we consider to be "new," revenue is recorded upon customer acceptance or at the time the product is determined to be established.
Products are classified as "established" products if post-delivery acceptance provisions and the installation process have been determined to be routine, due to the fact that the acceptance provisions are generally a replication of pre-shipment procedures. The majority of our products are manufactured to a standard specification. To ensure contractual performance levels are satisfied, the products often are tested at our manufacturing facility prior to shipment. To the extent that customers' conditions cannot be replicated in our facilities, or if there is not a demonstrated history of meeting newer customer specifications, then the product is treated as "new" for revenue recognition purposes.
In determining when a "new" product is considered "established," we consider several factors, including the stability of the product's technology, the ability to test the product prior to shipment, successful installations at customers' sites and the performance results once installed. We generally believe that satisfaction of these factors, coupled with a minimum of three to five successful customer installations and acceptances, is necessary to support the conclusion that there are no uncertainties regarding customer acceptances and that the installation process can be considered perfunctory. These factors, as well as the consideration of the ease of installation in different customer environments, are all taken into consideration in determining whether a product should be classified as "established."
The majority of our contracts involve the sale of equipment and services under multiple element arrangements. Revenue under multiple element arrangements is allocated to all elements based upon their relative fair values. To be considered a separate element, the product or service in question must represent a separate unit of accounting, and fulfill the following criteria: "(a) the delivered item(s) has value to the customer on a standalone basis; (b) there is objective and reliable evidence of the fair value of the undelivered item(s); and (c) if the arrangement includes a general right of return relative to the delivered item, delivery or performance of the undelivered item(s) is considered probable and substantially in the control of the Company." Our sales arrangements do not include a general right of return.
As a part of our revenue arrangements, we sell certain equipment for which we have not been able to obtain objective evidence of fair value. If objective evidence does not exist for the undelivered elements of an arrangement, all revenue is deferred until such evidence does exist, or until all elements for which we do not have objective evidence of fair value are delivered, whichever is earlier assuming all other revenue recognition criteria are met. Once there is objective evidence of the fair value of undelivered elements, the amount allocated to equipment and parts is based on a residual method. Under this method, the total arrangement value is allocated first to undelivered elements, based on their fair values, with the remainder being allocated to equipment revenue.
We have determined that installation and training services are not integral to the stand-alone value of certain products. We typically perform training at the same time as the installation process. The value of the undelivered installation and training services is deferred at an amount that is equal to the estimated fair value of the installation and any portion of the sales price that will not be received until the installation is completed. The amount allocated to installation and training is based upon the estimated time to complete the installation and training at the established fair value hourly rates. Objective evidence of fair value for these services is based on what we charge for similar professional
48
services on our stand-alone basis and what third-party contractors would charge when performing similar services.
We periodically enter into turnkey contracts where we provide all of the equipment necessary for a complete production line, whether we manufacture all of the equipment or not. For turnkey contracts, revenue recognition occurs on a completed contract basis, which requires an acceptance test period after all individual items are installed and accepted. Revenue is deferred until the specified output has been achieved which is determined through specific contractual testing measures and overall customer acceptance.
Spare parts revenue is generally recognized upon shipment and services revenue is generally recognized as the services are provided.
We record reimbursable out-of-pocket expenses and shipping as both revenue and as a direct cost of revenue, as applicable. We record revenue net of applicable sales and value added taxes collected. Taxes collected from our customers are recorded as part of accrued expenses on the balance sheet and are remitted to state and local taxing jurisdictions based on the filing requirements of each jurisdiction.
When a customer fails to perform its contractual obligations and such failure continues after notice of breach and a cure period, we may terminate the contract. Our contracts do not contain cancellation provisions and in the event of a customer breach, the customer may be liable for contractual damages. At the time of termination, we record as revenues any non-refundable deposits or deferred revenue amounts and record as cost of revenue any previously deferred cost as well as any related costs to terminate the contract including excess or obsolete inventory or unrecoverable vendor advances or other purchase commitment costs as a result of the termination.
Deferred Revenue and Deferred Costs
Deferred revenue includes amounts that have been billed per the contractual terms but have not been recognized as revenue. Deferred costs represent costs related to deferred revenues and include the cost of acquired and manufactured inventory items, capitalized labor and related overhead for our turnkey contracts, and in certain cases shipping costs. We classify as long-term the portion of deferred revenue and deferred costs that are expected to be recognized beyond the next fiscal year.
Inventories
We value our inventory at the lower of cost or market. The determination of the lower of cost or market requires that we make significant assumptions about future demand for products and the transition to new product offerings from legacy products. These assumptions include, but are not limited to, future manufacturing schedules, customer demand, supplier lead time and technological and market obsolescence. Estimating product demand beyond a relatively short forecasting horizon is difficult and prone to forecasting error due to the inherent lack of visibility in the industry. We also provide for losses on those open purchase order commitments in which our estimated obligation to receive inventory under the commitments exceeds expected production demand. Once our inventory is written down and a new cost basis has been established, it is not written back up if demand increases. If market conditions are less favorable than those projected by management, additional inventory write-downs may be required. If market conditions are more favorable than those projected by management, and specific inventory previously written down is subsequently sold, gross profit would improve by the amount of the specific write-down reversed in the period the inventory is sold.
49
Purchase Commitments
We enter into commitments to purchase material from various suppliers in the ordinary course of business. These commitments are entered into to satisfy the material requirements of a specific contract or the overall production plan and often require us to make payments in advance. We evaluate these advances for recoverability on a periodic basis and more frequently if indicators of asset impairment arise. In the event we reschedule and/or cancel a portion of these commitments due to customer delivery delays, customer contract terminations or changes to our production plans, we may be liable for cancellation penalties or be required to purchase material in excess of our current expected demand. In such instances, we review the contractual terms of the purchase commitment and seek to negotiate with the vendor to minimize any potential loss. In cases where the cancellation is the result of a customer contract termination or delay in customer delivery, we may seek to recover the costs incurred. We accrue as cost of revenue losses estimated on advances which are not considered recoverable because of a deterioration in the financial condition of the vendor or because the advances are expected to be forfeited as part of a planned order termination and any termination fees which may be paid to vendors when we terminate the contract in accordance with the contract terms.
Goodwill
Goodwill is recorded in connection with a business acquisition and represents the excess purchase price over the fair value of identifiable net assets at the acquisition date. We perform impairment tests of goodwill assigned to our reporting units on an annual basis or whenever events or circumstances indicate impairment may exist. Each impairment test is based upon a comparison of the fair value of the reporting unit by using traditional valuation methodologies, including market multiples, comparable transactions and a discounted cash flow model. If impairment is indicated due to the book value being in excess of the fair value, the goodwill is written down to its implied fair value.
Based upon our annual impairment testing analysis for our fiscal year ended April 3, 2010, which included our consideration of reasonably likely adverse changes in assumptions, management believes it is not reasonably likely that impairment will occur in any of the reporting units over the next twelve months.
Income Taxes
We record a valuation allowance against the deferred tax assets if it is more likely than not that a portion of the deferred tax asset will not be realized. On a quarterly basis, we evaluate both the positive and negative evidence bearing upon the reliability of our deferred tax assets. We consider future taxable income, ongoing prudent and feasible tax planning strategies, and the ability to utilize tax losses and credits in assessing the need for a valuation allowance. Should we determine that we are not able to realize all or part of our other deferred tax assets in the future, a valuation allowance would be required resulting in an expense recorded within the provision for income taxes in the statement of income in the period in which such determination was made. It is possible that the amount of the deferred tax asset considered realizable could be reduced in the near term if future taxable income is reduced. Should our future profitability provide sufficient evidence, to support the ultimate realization of income tax benefits attributable to deferred profits and other deductible temporary differences, a reduction in the valuation allowance may be recorded and the carrying value of deferred tax assets may be restored, resulting in a non-cash credit to earnings.
Our tax income varies from our book income substantially due to the timing of the recognition of revenue and costs related to our customer contracts. Our effective tax rate is affected by levels of taxable income in federal and state tax jurisdictions and China, U.S. tax credits generated and utilized for research and development expenditures, investment tax credits and other tax incentives specific to domestic U.S. operations and changes in valuation allowances.
50
Warranty
We provide for the estimated cost of product warranties, the amount of which is based primarily upon historical information, at the time product revenue is recognized. While we engage in extensive product quality programs and processes, including actively monitoring and evaluating the quality of our component suppliers, our warranty obligation is affected by product failure rates, utilization levels, material usage, service delivery costs incurred in correcting a product failure and supplier warranties on parts delivered to us. Should actual product failure rates, utilization levels, material usage, service delivery costs incurred in correcting a product failure or supplier warranties on parts differ from our estimates, revisions to the estimated warranty liability would be required.
Share-Based Compensation
We record compensation expense for all share-based payment awards made to employees and directors based on the estimated fair market values of the underlying instruments. Accordingly, share-based compensation cost is measured at the grant date, based upon the fair value of the award, and is recognized as expense on a straight line basis over the requisite employee service period.
The weighted average estimated fair value per share of employee stock options granted during the fiscal year ended April 3, 2010 and March 31, 2008 was determined using the Black Scholes option pricing model with the following underlying assumptions (there were no options granted during the fiscal year ended March 28, 2009):
| |
Fiscal Year Ended | ||||||
|---|---|---|---|---|---|---|---|
| |
April 3, 2010 | March 31, 2008 | |||||
Weighted average expected volatility |
51 | % | 48 | % | |||
Weighted average risk-free interest rate |
2.8 | % | 3.7 | % | |||
Expected dividend yield |
0.0 | % | 0.0 | % | |||
Weighted average expected life (in years) |
6.1 | 6.1 | |||||
Weighted average estimated per share fair value of employee stock options at grant date of the award |
$ | 2.61 | $ | 2.86 | |||
We have estimated our expected stock price volatility based on historical volatility calculations for a group of peer comparable companies. The weighted average risk free interest rate reflects the rates of U.S. government securities appropriate for the term of our stock options at the time of grant.
For employee stock options, we use the simplified calculation of expected life, described in the SAB 107, as we do not currently have sufficient historical exercise data on which to base an estimate of expected term. Under this method the Company estimates the expected life using the average of the vesting period and the contractual life of the stock options granted. For options granted to non-employees the remaining contractual term is used for measurement purposes.
We periodically grant restricted stock and restricted stock units (collectively, "restricted shares") to certain key employees and certain members of the Board of Directors. Unvested restricted shares are forfeited in the event of termination of employment or engagement with the Company. A holder of restricted stock generally has all of the rights of a stockholder. Restricted stock is common stock that is considered issued and outstanding but is not fully transferable until certain conditions have been met, primarily the passage of time and continued employment or engagement with the Company during a predetermined vesting period set by the compensation committee (the "restricted period"). A restricted stock unit is a grant representing the right to receive a share of common stock upon vesting of the restricted stock unit and satisfaction of other conditions but for which no share of common stock is issued until the restricted stock unit vests and any other applicable conditions are satisfied. A holder of a restricted stock unit does not have any rights of a stockholder until the restricted stock unit vests and is converted to common stock. The fair value of restricted shares are based on the market price of the
51
Company's stock on the date of grant and are recorded as compensation expense ratably over the requisite service period, which is generally two to four years.
Share-based compensation expense recognized in our consolidated statement of operations is based on awards ultimately expected to vest; therefore, it has been reduced for estimated forfeitures. Forfeitures are estimated at the time of initial grant and revised, if necessary, in subsequent periods if actual forfeitures differ from those estimates. We estimated forfeitures based on our historical activity, as we believe that these forfeiture rates are indicative of our expected forfeiture rate.
We account for equity instruments issued to non-employees as variable awards, as these equity instruments vest, we remeasure the fair value of the equity instrument at each reporting period prior to vesting and finally at the vesting date of the equity instruments.
Derivative Financial Instruments and Hedging Agreements
We enter into forward foreign exchange contracts to offset certain known and quantifiable operational exposures from the impact of changes in foreign currency exchange rates. Such exposures result from the portion of our operations that are denominated in currencies other than the U.S. dollar, primarily the Euro. These forward foreign exchange contracts are entered into to support inventory purchases made in the normal course of business, and accordingly, are not speculative in nature. Hedges related to anticipated transactions are designated and documented at the inception of the respective hedges as cash flow hedges and are evaluated for effectiveness quarterly.
We record all derivative financial instruments in our consolidated financial statements in other current assets or accrued liabilities, depending on their net position, at fair value regardless of the purpose or intent for holding the instrument. Changes in the fair value of the derivative financial instruments are either recognized periodically in earnings or in stockholders' equity as a component of accumulated other comprehensive income or loss depending on whether the derivative financial instrument qualifies for hedge accounting. Changes in fair values of derivatives not qualifying for hedge accounting are reported in earnings as they occur.
Hedge accounting is discontinued when it is determined that a derivative instrument is no longer effective. Any gains or losses that were accumulated in other comprehensive income from hedging a forecasted transaction will be recognized immediately in current period earnings if there are changes in expectations on the original forecasted transaction.
Derivative financial instruments involve, to varying degrees, elements of market and credit risk not recognized in consolidated financial statements. The market risk associated with these instruments resulting from currency exchange rate movements is expected to offset the market risk of the underlying transactions, assets and liabilities being hedged. The counterparties to the agreements relating to our foreign exchange instruments are major international financial institutions with high credit ratings. We do not believe that there is significant risk of nonperformance by the counterparties because we monitor their credit ratings. While the contract or notional amounts of derivative financial instruments provide one measure of the volume of these transactions, they do not represent the amount of our exposure to credit risk. The amounts potentially subject to credit risk (arising from the possible inability of the counterparty to meet the terms of the contracts) are generally limited to the amounts, if any, by which the counterparty's obligations under the contracts exceed our obligations to the counterparty. As of April 3, 2010 and March 28, 2009, the combined fair value and carrying amount of our forward foreign exchange contracts was a liability of $0.2 million and $3.8 million respectfully.
52
Results of Operations
The following tables set forth the results of our operations as a percentage of revenue for the fiscal years ended April 3, 2010, March 28, 2009, and March 31, 2008.
| |
Fiscal Year Ended | |||||||||
|---|---|---|---|---|---|---|---|---|---|---|
| |
April 3, 2010 | March 28, 2009 | March 31, 2008 | |||||||
Statement of Operations Data:* |
||||||||||
Revenue |
100 | % | 100 | % | 100 | % | ||||
Cost of revenue |
60 | 60 | 62 | |||||||
Gross profit |
40 | 40 | 38 | |||||||
Research and development |
4 | 3 | 4 | |||||||
Selling and marketing |
2 | 3 | 4 | |||||||
General and administrative |
7 | 6 | 9 | |||||||
Amortization of intangible assets |
1 | 1 | 1 | |||||||
Income from operations |
26 | 27 | 20 | |||||||
Interest income |
— | — | 3 | |||||||
Interest expense |
— | — | — | |||||||
Interest component of forward foreign exchange contracts |
— | — | (1 | ) | ||||||
Other income (expense) |
— | (1 | ) | (1 | ) | |||||
Income before income taxes |
26 | 26 | 21 | |||||||
Provision for income taxes |
10 | 10 | 6 | |||||||
Net income |
16 | % | 16 | % | 15 | % | ||||
- *
- percentages subject to rounding
Fiscal Year Ended April 3, 2010 Compared to Fiscal Year Ended March 28, 2009
Revenue. The following table sets forth revenue for the fiscal years ended April 3, 2010 and March 28, 2009.
| |
|
|
2010 versus 2009 | ||||||||||||
|---|---|---|---|---|---|---|---|---|---|---|---|---|---|---|---|
| |
Fiscal Year Ended April 3, 2010 |
Fiscal Year Ended March 28, 2009 |
|||||||||||||
Business Category
|
Change | Percentage | |||||||||||||
| |
(dollars in thousands) |
||||||||||||||
Photovoltaic Business |
|||||||||||||||
Photovoltaic equipment |
$ | 180,692 | $ | 424,404 | $ | (243,712 | ) | ||||||||
Photovoltaic services, parts and other |
6,034 | 19,543 | (13,509 | ) | |||||||||||
Total photovoltaic business |
186,726 | 443,947 | (257,221 | ) | (58 | )% | |||||||||
Polysilicon Business |
|||||||||||||||
Polysilicon equipment |
353,368 | 93,264 | 260,104 | ||||||||||||
Polysilicon services, parts and other |
4,151 | 3,816 | 335 | ||||||||||||
Total polysilicon business |
357,519 | 97,080 | 260,439 | 268 | % | ||||||||||
Total revenue |
$ | 544,245 | $ | 541,027 | $ | 3,218 | * | % | |||||||
- *
- not meaningful
Revenue from our PV business decreased 58% for the fiscal year ended April 3, 2010 as compared to the fiscal year ended March 28, 2009. This decrease is substantially related to delays in deliveries
53
requested by our customers on existing contracts as a result of the economic downturn. Revenue from our polysilicon business increased 268% for the fiscal year ended April 3, 2010 as compared to the fiscal year ended March 28, 2009. We typically experience a longer period of time between delivery and revenue recognition with our polysilicon contracts than with our PV contracts. Polysilicon revenue for the year ended April 3, 2010 substantially relates to contracts that were in our order backlog as of March 28, 2009.
Our PV equipment revenue includes sales of DSS units as well as other PV equipment. During the fiscal year ended April 3, 2010, DSS sales decreased 64% to $139.6 million (which included $2.6 million of a non-refundable deposit from a contract termination) from $386.9 million for the fiscal year ended March 28, 2009. Sales of other PV equipment increased 10% to $41.1 million (which included $7.4 million from a terminated turnkey contract) for the fiscal year ended April 3, 2010 from $37.5 million for the fiscal year ended March 28, 2009. Revenue from other PV equipment can fluctuate based upon specific customer requirements.
Sales of other PV equipment accounted for $41.1 million of our revenue for the fiscal year ended April 3, 2010 and $37.5 million of our revenue for the fiscal year ended March 28, 2009, representing an increase of 10%. Other PV equipment revenue is primarily attributed to turnkey contracts and ancillary equipment under our DSS contracts, which can vary based upon specific customer requirements. Ancillary equipment is primarily purchased from third parties.
Revenue from turnkey solutions for the fiscal year ended April 3, 2010 was $33.4 million, consisting of $5.8 million from sales of DSS units and $27.6 million from sales of other PV equipment. Revenue from turnkey contracts for the fiscal year ended March 28, 2009, amounted to $19.1 million consisting of $4.0 million of DSS units and $15.1 million of other PV equipment. Turnkey revenue is recorded only after final production line acceptance and therefore is periodic in nature. Our market for turnkey services has substantially decreased in recent years due to the maturity of the industry. As our activity in this area has correspondingly decreased, we have limited our marketing and sales efforts to identifying only highly qualified prospects that are well capitalized. We are reviewing our turnkey integration services and our plans with regards to this business will depend on the success of our current marketing efforts.
Revenue from PV services, parts and other was $6.0 million for the fiscal year ended April 3, 2010 and $19.5 million for the fiscal year ended March 28, 2009. This decrease is consistent with the overall decrease in our PV business.
During the fiscal year ended April 3, 2010, we recognized polysilicon revenue of $357.5 million (which included $11.1 million of a non-refundable deposit from a contract termination). During the fiscal year ended March 28, 2009, we recognized polysilicon revenue of $97.1 million (which included $4.0 million of a non-refundable deposit from a contract termination). Revenue related to our CVD reactors is typically deferred until pre-established reactor output performance criteria and final acceptance is achieved.
Included in our backlog are polysilicon contracts that grant contractual rights which are considered a separate element under the contract and requires revenue to be recognized ratably over the period commencing when all other elements have been delivered and other contract criteria have been met and through the period such rights exist. During the fiscal year ended April 3, 2010, we recognized revenue of $48.3 million on a ratable basis from one of these customers with a remaining deferred revenue balance for this customer of $155.7 million at April 3, 2010, which is expected to be recognized as revenue ratably through fiscal year 2012.
In both the fiscal years ended April 3, 2010, and March 28, 2009, a substantial percentage of our revenue resulted from sales to a small number of customers. One of our customers accounted for 34% of our revenue for the fiscal year ended April 3, 2010 and four customers accounted for 62% of our
54
revenue for the fiscal year ended March 28, 2009. No other customer accounted for more than 10% of our revenue during the respective periods.
Based upon order backlog as of April 3, 2010, we believe our PV business will represent a majority of our revenue for fiscal year 2011. For the fiscal year ended April 2, 2011, we believe that no one customer will account for more than 35% of our total annual revenue.
Cost of Revenue, Gross Profit and Gross Margin. The following table sets forth total cost of revenue, gross profit and gross margin for the fiscal years ended April 3, 2010 and March 28, 2009.
| |
|
|
2010 versus 2009 | ||||||||||||
|---|---|---|---|---|---|---|---|---|---|---|---|---|---|---|---|
| |
Fiscal Year Ended April 3, 2010 |
Fiscal Year Ended March 28, 2009 |
|||||||||||||
| |
Change | Percentage | |||||||||||||
| |
(dollars in thousands) |
|
|||||||||||||
Cost of revenue |
|||||||||||||||
Photovoltaic business |
$ | 123,955 | $ | 265,813 | $ | (141,858 | ) | (53 | )% | ||||||
Polysilicon business |
201,308 | 60,545 | 140,763 | 232 | % | ||||||||||
Total |
$ | 325,263 | $ | 326,358 | $ | (1,095 | ) | * | % | ||||||
Gross profit |
|||||||||||||||
Photovoltaic business |
$ | 62,771 | $ | 178,134 | $ | (115,363 | ) | (65 | )% | ||||||
Polysilicon business |
156,211 | 36,535 | 119,676 | 328 | % | ||||||||||
Total |
$ | 218,982 | $ | 214,669 | $ | 4,313 | 2 | % | |||||||
Gross margins |
|||||||||||||||
Photovoltaic business |
34 | % | 40 | % | |||||||||||
Polysilicon business |
44 | % | 38 | % | |||||||||||
Total |
40 | % | 40 | % | |||||||||||
- *
- not meaningful
Our PV cost of revenue decreased $141.9 million, or 53%, and our PV gross profit decreased $115.4 million, or 65% for the fiscal year ended April 3, 2010 compared to the fiscal year ended March 28, 2009. During the fiscal year ended April 3, 2010 and March 28, 2009, our PV cost of revenue included costs of $12.8 million and $8.7 million, respectively, related to excess overhead and increases in our inventory reserves reflecting the overall decrease in manufacturing activities as a result of delays in deliveries requested by our customers. Our gross margins tend to vary depending on our manufacturing volume, as well as the mix and pricing of our contracts.
Gross margins for the PV business during the fiscal year ended April 3, 2010, were adversely impacted by the overall reduction in our sales volumes that resulted in excess manufacturing costs and increased inventory reserves and by turnkey projects which generated revenue of $33.4 million with gross margins of 21%.
Gross margins for the PV business during the fiscal year ended March 28, 2009, were 40% which were favorably impacted by the higher gross margins on our newly introduced DSS units which represented a significant portion of the total PV revenue during the period and were negatively impacted by a fourth quarter charge of $11.3 million resulting from reserves against advances with vendors that had become financially distressed as well as expected forfeitures of vendor advances as a result of commitment terminations due to our reduced production plan for fiscal year ended April 3, 2010 as compared to fiscal year ended March 31, 2008.
Our polysilicon cost of revenue increased by $140.8 million, or 232%, and our polysilicon gross profit increased by $119.7 million, or 328%, for the fiscal year ended April 3, 2010 compared to the fiscal year ended March 28, 2009. This increase relates to increases in polysilicon revenue that was recognized during the fiscal year ended April 3, 2010.
55
Gross margins within our polysilicon business during the fiscal year ended April 3, 2010 were 44% and were impacted by the favorable pricing in the contracts that were recognized in the period as compared to gross margins of 38% realized during the fiscal year ended March 28, 2009, which were adversely impacted as a result of higher initial costs related to the first installation of our SDR 200 CVD reactors. During the year ended April 3, 2010, we agreed to a customer requested delay under an ongoing polysilicon contract. The customer reimbursed us $20.5 million for the costs incurred to terminate certain impacted vendor commitments. These costs did not impact gross margins as they were reimbursed by the customer and have been recorded as both deferred revenue and deferred cost of goods sold under the arrangement.
Research and Development. The following table sets forth total research and development expenses for the fiscal years ended April 3, 2010 and March 28, 2009.
| |
|
|
2010 versus 2009 | ||||||||||||
|---|---|---|---|---|---|---|---|---|---|---|---|---|---|---|---|
| |
Fiscal Year Ended April 3, 2010 |
Fiscal Year Ended March 28, 2009 |
|||||||||||||
| |
Change | Percentage | |||||||||||||
| |
(dollars in thousands) |
|
|||||||||||||
Research and development |
|||||||||||||||
Photovoltaic business |
$ | 14,419 | $ | 9,420 | $ | 4,999 | 53 | % | |||||||
Polysilicon business |
6,991 | 8,903 | (1,912 | ) | (21 | )% | |||||||||
Total |
$ | 21,410 | $ | 18,323 | $ | 3,087 | 17 | % | |||||||
During the fiscal year ended April 3, 2010 compared to the fiscal year ended March 28, 2009, research and development expense increased by 17%, or $3.1 million. Research and development expense consists primarily of labor and material spending associated with our next-generation DSS products and CVD reactors, as well as other technologies currently in development. Our spending on research and development activities is directly related to projects under development and the timing of the spending associated with each of the projects, therefore, the spending in each business segment may vary from year to year. We expect our research and development spending to increase as we continue to invest in new product development and expand our product base in both our polysilicon and PV businesses.
Selling and Marketing. The following table sets forth total selling and marketing expenses for the fiscal years ended April 3, 2010 and March 28, 2009.
| |
|
|
2010 versus 2009 | ||||||||||||
|---|---|---|---|---|---|---|---|---|---|---|---|---|---|---|---|
| |
Fiscal Year Ended April 3, 2010 |
Fiscal Year Ended March 28, 2009 |
|||||||||||||
| |
Change | Percentage | |||||||||||||
| |
(dollars in thousands) |
|
|||||||||||||
Selling and marketing |
|||||||||||||||
Photovoltaic business |
$ | 6,327 | $ | 9,578 | $ | (3,251 | ) | (34 | )% | ||||||
Polysilicon business |
5,496 | 7,891 | (2,395 | ) | (30 | )% | |||||||||
Total |
$ | 11,823 | $ | 17,469 | $ | (5,646 | ) | (32 | )% | ||||||
During the fiscal year ended April 3, 2010 compared to the fiscal year ended March 28, 2009, selling and marketing expenses decreased 32%, or $ 5.6 million primarily related to lower commission costs. During fiscal year 2010, we reduced the number of employee and non-employee sales representatives eligible to receive commissions. Sales commissions are accrued based on operational factors such as deposits, shipments and final acceptances received from customers rather than when revenue is recognized.
General and Administrative. During fiscal year ended April 3, 2010 as compared to the fiscal year ended March 28, 2009, general and administrative expenses increased by 20%, or $6.4 million. The increase was primarily related to increased payroll and related costs of $7.1 million which includes
56
$2.3 million increased incentive compensation for fiscal year ended April 3, 2010 as a result of exceeding incentive targets. This increase is offset in part by lower legal and other professional service costs of $0.7 million.
Amortization of Intangible Assets. Amortization expense attributed to intangible assets has remained essentially unchanged for the fiscal year ended April 3, 2010 as compared to March 28, 2009.
Interest Income. During the fiscal year ended April 3, 2010, we earned $0.4 million in interest income, and during the fiscal year ended March 28, 2009, we earned $3.0 million in interest income. We invested our excess cash in exchange traded money market mutual funds and short term commercial paper. Interest income decreased due to lower interest rates earned on the balances in cash and cash equivalents in the fiscal year ended April 3, 2010 as compared to fiscal year ended March 28, 2009.
Interest Expense. During the fiscal year ended April 3, 2010, we recorded interest expense of $0.8 million, and during the fiscal year ended March 28, 2009, we recorded interest expense of $0.5 million. Interest expense is substantially attributed to the expensing of deferred debt costs in connection with our credit facility and other related credit facility fees.
Interest Component of Forward Foreign Exchange Contracts. During the fiscal year ended April 3, 2010 the recorded interest component of our forward foreign exchange contracts was an expense of $0.6 million. During the fiscal year ended March 28, 2009 we recorded interest income of $2.1 million on our forward foreign exchange contracts. These amounts represent the difference between interest rates in the two countries involved in our forward foreign exchange contracts for the specified period of time and can be either a premium or discount at the beginning of the contract and are adjusted to reflect interest rate market condition changes. Such changes can result in interest income or interest expense over the life of the contract.
Other Income (Expense). During the fiscal year ended April 3, 2010, other expense, net was $3.1 million, which included costs associated with a secondary public offering of our common stock of $0.8 million, losses on foreign exchange of $0.4 million, and losses of $2.1 million recognized due to fair value adjustments on certain forward foreign exchange contracts that no longer qualified as a cash flow hedge because the hedging relationship was no longer deemed to be highly effective due to changes in the forecasted deliveries for certain Euro denominated purchase commitments. During the fiscal year ended March 28, 2009, other expense, net was $6.0 million, which included costs of $2.6 million associated with our initial public offering and a loss of $3.0 million recognized due to fair value adjustments on certain forward foreign exchange contracts that no longer qualified as cash flow hedges.
Provision for Income Taxes. Our effective tax rate was approximately 38% for the both the fiscal year ended April 3, 2010 and March 28, 2009. The effective rate for both years differed from the statutory rate due primarily to a federal tax deduction based on manufacturing activities undertaken in the United States.
Net Income. As a result of the foregoing factors, for the fiscal year ended April 3, 2010, we recorded net income of $87.3 million, compared to a net income of $88.0 million for the fiscal year ended March 28, 2009.
57
Fiscal Year Ended March 28, 2009 Compared to Fiscal Year Ended March 31, 2008
Revenue. The following table sets forth revenue for the fiscal years ended March 28, 2009 and March 31, 2008.
| |
|
|
2009 versus 2008 | ||||||||||||
|---|---|---|---|---|---|---|---|---|---|---|---|---|---|---|---|
| |
Fiscal Year Ended March 28, 2009 |
Fiscal Year Ended March 31, 2008 |
|||||||||||||
Business Category
|
Change | Percentage | |||||||||||||
| |
(dollars in thousands) |
|
|||||||||||||
Photovoltaic Business |
|||||||||||||||
Photovoltaic equipment |
$ | 424,404 | $ | 229,506 | $ | 194,898 | |||||||||
Photovoltaic services, parts and other |
19,543 | 14,546 | 4,997 | ||||||||||||
Total photovoltaic business |
443,947 | 244,052 | 199,895 | 82 | % | ||||||||||
Polysilicon Business |
|||||||||||||||
Polysilicon equipment |
93,264 | — | 93,264 | ||||||||||||
Polysilicon services, parts and other |
3,816 | — | 3,816 | ||||||||||||
Total polysilicon business |
97,080 | — | 97,080 | * | % | ||||||||||
Total revenue |
$ | 541,027 | $ | 244,052 | $ | 296,975 | 122 | % | |||||||
- *
- not meaningful
Our PV equipment revenue includes sales of DSS units as well as other PV equipment. Our revenue from sales of DSS units increased by 100% to $386.9 million for the fiscal year ended March 28, 2009 from $193.4 million for the fiscal year ended March 31, 2008. This increase can be attributed to general growth in the solar industry as well as a successful introduction of our DSS 450 unit. During the fiscal year ended March 31, 2008, we began to deliver and install our recently introduced DSS 450 unit. We began to recognize revenue on these units when we were able to obtain sufficient evidence of customer acceptance in accordance with our revenue recognition policy which occurred in the fourth quarter of our fiscal year ended March 31, 2008.
Many of our DSS contracts include both the delivery of DSS units as well as ancillary equipment. We do not often sell ancillary equipment separately from our DSS units and therefore we have not been able to establish stand-alone objective evidence of their fair value in all cases. For revenue recognition purposes, we defer the revenue for shipped and accepted equipment until all equipment and services for which we have been unable to establish objective evidence of fair value have been shipped and accepted. When negotiating contracts with our customers, we attempt to establish delivery schedules so that we deliver ancillary equipment in the earlier stages of the contract to facilitate revenue recognition.
During the quarter ended March 28, 2009, a PV customer with contracts totaling approximately $172.9 million requested delays in the deliveries of their DSS units and ancillary equipment. Prior agreements to delay delivery of the ancillary equipment had resulted in our inability to recognize revenue for products that had been previously shipped. We agreed to an arrangement with this customer that included a revised schedule for the delivery of the remaining DSS units and the cancellation of $1.4 million of undelivered ancillary equipment. As a result of this upon execution of the amendments to these agreements, the only remaining undelivered elements were DSS units and installation services and there were no further undelivered elements for which we did not have objective and reliable evidence of fair value. Therefore, we recognized, in accordance with our revenue recognition policy, $56.7 million of revenue that had been previously deferred related to amounts billed and collected for delivered DSS units and ancillary equipment.
Sales of other PV equipment accounted for $37.5 million of our revenue for the fiscal year ended March 28, 2009 and $36.1 million of our revenue for the fiscal year ended March 31, 2008, representing
58
an increase of 4%. Other PV revenue is primarily attributed to ancillary equipment under our DSS contracts, which can vary based upon specific customer requirements and is both manufactured by us and purchased from third parties.
Revenue from turnkey solutions for the fiscal year ended March 28, 2009 amounted to $19.1 million of which $4.0 million relates to DSS units with the remainder recorded as other PV equipment. Revenue from turnkey solutions for the fiscal year ended March 31, 2008, amounted to $27.2 million, of which $9.9 million relates to DSS units with the remainder recorded as other PV equipment. Turnkey revenue is recorded only after final production line acceptance and therefore is periodic in nature.
During the fiscal year ended March 28, 2009, revenue from PV services, parts and other equipment sales, compared to the fiscal year ended March 31, 2008, increased by $5.0 million, or 34%. These increases were primarily driven by our expanded installed base of our PV equipment.
During the fiscal year ended March 28, 2009, we recognized $97.1 million of polysilicon revenue related primarily to our first installation of our CVD reactor that was shipped during last fiscal year and for which recognition of revenue was deferred until we received customer acceptance. In accordance with our revenue recognition policy, revenue was recognized when pre-established reactor output performance criteria had been met and acceptance by the customer was received. Included in our polysilicon revenue for the year ended March 28, 2009 is a fee of $4.0 million for engineering services on a non-refundable deposit we retained due to a customer's inability to obtain financing for the potential start up of a polysilicon plant. We did not recognize any revenue from our CVD reactors or converters in the fiscal year ended March 31, 2008.
In both the fiscal years ended March 28, 2009, and March 31, 2008, a substantial percentage of our revenue resulted from sales to a small number of customers. Four of our customers accounted for 62% of our revenue for the fiscal year ended March 28, 2009 and one customer accounted for 62% of our revenue for the fiscal year ended March 31, 2008. No other customer accounted for more than 10% of our revenue during the respective periods.
Cost of Revenue, Gross Profit (Loss) and Gross Margin. The following table sets forth total cost of revenue, gross profit (loss) and gross margin for the fiscal years ended March 28, 2009 and March 31, 2008.
| |
|
|
2009 versus 2008 | ||||||||||||
|---|---|---|---|---|---|---|---|---|---|---|---|---|---|---|---|
| |
Fiscal Year Ended March 28, 2009 |
Fiscal Year Ended March 31, 2008 |
|||||||||||||
| |
Change | Percentage | |||||||||||||
| |
(dollars in thousands) |
|
|||||||||||||
Cost of revenue |
|||||||||||||||
Photovoltaic business |
$ | 265,813 | $ | 150,031 | $ | 115,782 | |||||||||
Polysilicon business |
60,545 | 1,678 | 58,867 | ||||||||||||
Total |
$ | 326,358 | $ | 151,709 | $ | 174,649 | 115 | % | |||||||
Gross profit (loss) |
|||||||||||||||
Photovoltaic business |
$ | 178,134 | $ | 94,021 | $ | 84,113 | |||||||||
Polysilicon business |
36,535 | (1,678 | ) | 38,213 | |||||||||||
Total |
$ | 214,669 | $ | 92,343 | $ | 122,326 | 132 | % | |||||||
Gross margins |
|||||||||||||||
Photovoltaic business |
40 | % | 39 | % | |||||||||||
Polysilicon business |
38 | % | * | % | |||||||||||
Overall |
40 | % | 38 | % | |||||||||||
- *
- not meaningful
59
Cost of revenue increased 115% to $326.4 million for the fiscal year ended March 28, 2009 from $151.7 million for the fiscal year ended March 31, 2008. Gross profit increased 132% to $214.7 million for the fiscal year ended March 28, 2009 from $92.3 million for the fiscal year ended March 31, 2008. These increases were the result of increased sales in both our PV and polysilicon businesses in the fiscal year ended March 28, 2009 compared to the fiscal year ended March 31, 2008. Our gross margins tend to vary depending on the size of the contracts and the negotiated terms of the contract.
For the fiscal year ended March 28, 2009, gross margins for our PV business increased to 40% from 39% for the fiscal year ended March 31, 2008. Gross margins for the fiscal year ended March 28, 2009 were positively impacted by higher gross margins on our DSS 450 units and negatively impacted by a fourth quarter charge of $11.3 million resulting from expected forfeitures of vendor advances as a result of commitment terminations and reserves against advances with vendors that have become financially distressed. This charge was a result of the cancellation of over half of our commitments to our vendors to procure materials in the PV business due to a reduced production plan for fiscal year ended April 3, 2010 as compared to fiscal year ended March 31, 2008. Gross margins for the fiscal year ended March 31, 2008 were negatively impacted by (i) a fourth quarter provision of $6.7 million relating to hardware and software improvements to our DSS furnace designed to improve operating safety that we offered free of charge to all customers worldwide, and (ii) lower than expected gross profit with respect to a completed turnkey contract in the fiscal year ended March 31, 2008 of approximately $3.6 million.
For the fiscal year ended March 28, 2009, gross margin for our polysilicon business was 38%. During the fiscal year ended March 31, 2008, we did not recognize any revenue on products shipped in our polysilicon business but we did record cost of revenue of $1.7 million for excess inventory due to engineering changes.
Research and Development. The following table sets forth total research and development expenses for the fiscal years ended March 28, 2009 and March 31, 2008.
| |
|
|
2009 versus 2008 | ||||||||||||
|---|---|---|---|---|---|---|---|---|---|---|---|---|---|---|---|
| |
Fiscal Year Ended March 28, 2009 |
Fiscal Year Ended March 31, 2008 |
|||||||||||||
| |
Change | Percentage | |||||||||||||
| |
(dollars in thousands) |
|
|||||||||||||
Research and development |
|||||||||||||||
Photovoltaic business |
$ | 9,420 | $ | 3,977 | $ | 5,443 | |||||||||
Polysilicon business |
8,903 | 6,540 | 2,363 | ||||||||||||
Total |
$ | 18,323 | $ | 10,517 | $ | 7,806 | 74 | % | |||||||
During the fiscal year ended March 28, 2009 compared to the fiscal year ended March 31, 2008, research and development expenses increase by 74%, or $7.8 million. The increase was a result of increased labor and material spending associated with the continued development of our next-generation DSS products and the development of new polysilicon business products, particularly our CVD reactor and trichlorosilane technologies.
60
Selling and Marketing. The following table sets forth total selling and marketing expenses for the fiscal years ended March 28, 2009 and March 31, 2008.
| |
|
|
2009 versus 2008 | ||||||||||||
|---|---|---|---|---|---|---|---|---|---|---|---|---|---|---|---|
| |
Fiscal Year Ended March 28, 2009 |
Fiscal Year Ended March 31, 2008 |
|||||||||||||
| |
Change | Percentage | |||||||||||||
| |
(dollars in thousands) |
|
|||||||||||||
Selling and marketing |
|||||||||||||||
Photovoltaic business |
$ | 9,578 | $ | 6,872 | $ | 2,706 | |||||||||
Polysilicon business |
7,891 | 3,580 | 4,311 | ||||||||||||
Total |
$ | 17,469 | $ | 10,452 | $ | 7,017 | 67 | % | |||||||
During the fiscal year ended March 28, 2009 compared to the fiscal year ended March 31, 2008, selling and marketing expenses increased 67%, or $7.0 million of which approximately $3.4 million was attributed to increased sales commissions payable to sales representatives as a result of the increased sales and bookings in the fiscal year ended March 28, 2009 related to both PV products and CVD reactors. Additionally, during the fiscal year ended March 28, 2009, we also incurred increased costs of approximately $2.0 million related to internal sales commissions and other expenses related to continued growth in our polysilicon business. Sales commissions are accrued based on operational factors such as deposits, shipments and final acceptances received from customers rather than when revenue is recognized. Additionally, year-to-date selling and marketing expenses increased as a result of increasing headcount to support our revenue growth.
General and Administrative. During fiscal year ended March 28, 2009 compared to the fiscal year ended March 31, 2008, general and administrative expenses increased by 50%, or $10.8 million. We incurred increased expenses of approximately $3.7 million related to legal and tax consulting services as well as increased software consulting costs of $3.9 million related to the implementation of a new ERP system. Additionally, for the fiscal year ended March 28, 2009 as compared to the fiscal year ended March 31, 2008, stock compensation expense increased $1.7 million to $3.5 million from $1.8 million, primarily due to restricted shares and restricted stock units granted to employees.
Amortization of Intangible Assets. Amortization expense attributed to intangible assets has remained essentially unchanged for the fiscal years ended March 28, 2009 as compared to March 31, 2008.
Interest Income. During the fiscal year ended March 28, 2009, we earned $3.0 million in interest income, and during the fiscal year ended March 31, 2008, we earned $6.5 million in interest income. We invested our excess cash in exchange traded money market mutual funds. Interest income decreased due to lower balances in cash and cash equivalents and restricted cash in the fiscal year ended March 28, 2009 as compared to fiscal year ended March 31, 2008.
Interest Expense. During the fiscal year ended March 28, 2009, we recorded interest expense of $0.5 million, and during the fiscal year ended March 31, 2008, we recorded interest expense of $0.8 million. Interest expense is substantially attributed to the expensing of deferred debt costs in connection with our credit facility and other related credit facility fees.
Interest Component of Forward Foreign Exchange Contracts. During the fiscal year ended March 28, 2009 and March 31, 2008, we recorded interest income of $2.1 million and interest expense of $0.8 million, respectively on forward foreign exchange contracts. These amounts represent the difference between the interest rates in the two countries involved in our forward foreign exchange contracts for the specified period of time and can be either a premium or discount at the beginning of the contract and are adjusted to reflect interest rate market condition changes. Such changes can result in interest income or interest expense over the life of the contract.
61
Other Income (Expense). During the fiscal year ended March 28, 2009, other expense, net was $6.0 million, which included costs of $2.6 million associated with our initial public offering and a loss of $3.0 million recognized due to fair value adjustments on certain forward foreign exchange contracts that no longer qualified as a cash flow hedge because the hedging relationship was no longer deemed to be highly effective. During the fiscal year ended March 31, 2008, we recorded other expense, net of $1.2 million, of which $1.6 million related to costs associated with our initial public offering, which was partially offset by gains on foreign exchange of $0.5 million.
Provision for Income Taxes. For the fiscal year ended March 28, 2009, our effective tax rate was 38%, compared to 29% for the same period ended March 31, 2008. The increase in the tax rate year over year is primarily due to the benefit recorded upon the reversal of a valuation allowance in the fiscal year ended March 31, 2008.
The effective rate for the fiscal year ended March 28, 2009 differed from the statutory rate due primarily to the impact of discrete items attributed to tax benefits based upon recently completed tax studies related to research credits and IRC Section 199 deductions. The impact of these discrete items reduced the effective rate for the fiscal year ended March 28, 2009 by a net of 1.9%.
The effective rate for the fiscal year ended March 31, 2008 was lower than the statutory rate principally due to non-taxable interest income, our ability to recognize previously reserved federal and state deferred tax assets and a federal tax deduction based on manufacturing activities undertaken in the United States.
Net Income. As a result of the foregoing factors, for the fiscal year ended March 28, 2009, we recorded net income of $88.0 million, compared to a net income of $36.1 million for the fiscal year ended March 31, 2008.
Liquidity and Capital Resources
Overview
Our combined cash and cash equivalents and restricted cash balances increased by $123.6 million during the fiscal year ended April 3, 2010, from $107.1 million as of March 28, 2009 to $230.7 million as of April 3, 2010. Our liquidity is affected by many factors, some based on the normal operations of the business and others related to the uncertainties of the industry and global economies.
We generally collect upfront deposits when a customer places an order. In connection with deposits we receive from our customers, we may be required to provide a standby letter of credit ("LOC") as security for their deposit. During the period from April 2006 to September 2007 we used a senior secured revolving credit facility that provided for up to $70.0 million in borrowings and standby letters of credit. Although we had not borrowed any amounts under the senior credit facility, we used the senior credit facility to issue standby letters of credit against customer deposits. On September 24, 2007, we elected to terminate this credit facility. From September 24, 2007 to July 29, 2008, we collateralized our standby letters of credit with restricted cash. The practice of using cash to collateralize our standby LOCs had a negative impact on the working capital available to us and, therefore, on July 29, 2008, we entered into a senior credit facility with a syndicate of financial institutions, which permits revolving credit borrowings as well as the issuance of standby letters of credit without providing cash collateral. (See "—Senior Credit Facility" below). The restrictions on our cash balances decreased during fiscal 2009 as we began utilizing this new facility. As of March 28, 2009, and throughout the year ended April 3, 2010, our standby LOCs had been issued under our credit facility and, as a result, we no longer had the restrictions on our cash. Generally, a standby LOC expires upon shipment to the customer.
On July 29, 2008, we also entered into a cash-collateralized letter of credit facility which we intend to use to issue additional standby letters of credit collateralized with restricted cash only if we do not
62
have availability under the senior credit facility to issue letters of credit. For a summary of the terms of these credit facilities, see "—Senior Credit Facility" and "—Cash-Collateralized Letter of Credit Facility" below.
Net cash provided by operating activities in each of the fiscal years ended April 3, 2010, March 28, 2009 and March 31, 2008 has allowed us to fund working capital requirements without significant net borrowings. We manage our cash inflows through the use of customer deposits and milestone billings that allow us in turn to meet our cash outflow requirements, which consist primarily of vendor payments and prepayments for contract related costs (raw material and components costs) and payroll and overhead costs. Customer deposits are initially classified as deposits, and then reclassified to revenue or to deferred revenue when equipment has been shipped or services have been provided, but revenue has not yet been recognized. We generally make advances to suppliers after the corresponding deposit is received from our customers.
Our principal uses of cash are for raw materials and components, wages, salaries and investment activities, such as the purchase of property, plant and equipment. We outsource a significant portion of our manufacturing and therefore we require minimal capital expenditures to meet our production demands. Capital expenditures have represented less than 2% of revenue in each of the fiscal years ended April 3, 2010, March 28, 2009, and March 31, 2008. Our capital expenditures for our fiscal year ended April 3, 2010, March 28, 2009 and March 31, 2008, were $4.6 million, $10.5 million, and $4.5 million respectively, which were used primarily for improving our business systems and our facilities. Our total capital expenditures in our fiscal year ending March 31, 2011 are expected to be approximately $7 million, consisting primarily of improvements to our business information systems, manufacturing equipment and expansion of our facilities in Asia.
We believe that cash generated from operations together with our existing cash and customer deposits and any borrowings under our senior credit facilities will be sufficient to satisfy working capital requirements, commitments for capital expenditures and other cash requirements for the foreseeable future, including at least the next twelve months.
Cash Flows
The following discussion of the changes in our cash balance refers to the various sections of our Consolidated Statements of Cash Flows, which appears in Item 8 of this Annual Report on Form 10-K. The following table summarizes our primary sources of cash in the periods presented:
| |
Fiscal Year Ended April 3, 2010 |
Fiscal Year Ended March 28, 2009 |
Fiscal Year Ended March 31, 2008 |
||||||||
|---|---|---|---|---|---|---|---|---|---|---|---|
| |
(dollars in thousands) |
||||||||||
Cash provided by (used in): |
|||||||||||
Operating activities |
$ | 147,276 | $ | 152,872 | $ | 1,532 | |||||
Investing activities |
(24,540 | ) | (10,959 | ) | (4,841 | ) | |||||
Financing activities |
863 | (89,614 | ) | (15,934 | ) | ||||||
Effect of foreign exchange rates on cash |
1 | 10 | 23 | ||||||||
Net increase (decrease) in cash and cash equivalents |
$ | 123,600 | $ | 52,309 | $ | (19,220 | ) | ||||
Cash Flows From Operating Activities
For the fiscal year ended April 3, 2010, our cash provided by operations was $147.3 million which included the receipt of approximately $35.3 million for refundable income taxes due to an election of a change in accounting method for tax purposes. This change in methodology resulted in a one year deferral of customer deposits and additional receipts that under the prior tax method had been
63
included in taxable income in the year of receipt. As a result of this change in methodology, we were in an overpayment position regarding our estimated income taxes for the year ended March 28, 2009. We filed for a refund of Federal income taxes in May 2009 in the amount of $35.3 million which was received in June 2009. Our cash flows were impacted by an increase in shipments during the latter half of the year resulting in a favorable impact to cash flow as a result of decreases in inventory and advance payments on inventory purchases of $130.8 million and an unfavorable impact to cash flows as a result of a decrease in our customer deposits of $103.0 million.
For the fiscal year ended March 28, 2009 our cash provided by operations was $152.9 million which was favorably impacted by the release of restrictions on our cash of $164.0 million. Other significant sources of cash included $88.0 million of net income, $77.5 million of a net increase in deferred revenue less deferred costs primarily related to the shipment of our polysilicon reactors and depreciation and amortization of $5.1 million. The significant uses of cash were an increase in inventory and advance payments on inventory purchases of $108.5 million as we continued to ramp up production to fulfill our backlog, an increase in accounts receivable of $4.4 million, a decrease in customer deposits of $41.0 million and an increase in deferred taxes of $25.0 million. In addition, we used cash for income taxes of $90.9 million of which $35.3 million was refunded in fiscal year ending April 3, 2010 due to an election of a change in accounting method for tax purposes as discussed above.
For the fiscal year ended March 28, 2009, our operations generated $1.5 million in cash. Our restricted cash balances increased by $154.7 million representing a significant use of cash during this period as we were required to collateralize our standby LOCs with available cash. The significant sources of cash included $36.1 million of net income, $35.6 million of an increase in deferred revenue less deferred costs primarily related to the shipment of our recently introduced DSS 450 furnace, an increase in customer deposits of $171.6 million, an increase in accounts payable and accrued expenses of $41.1 million and depreciation and amortization of $4.1 million. Other significant uses of cash were an increase in inventory and advance payments on inventory purchases of $87.3 million as we continued to ramp up production to fulfill our backlog and an increase in accounts receivable of $46.9 million.
Cash Flows From Investing Activities
During the fiscal year ended April 3, 2010, cash used in investing activities was $24.5 million, consisting of $4.6 million for the purchase of property, plant and equipment, and $20.0 million for the purchase of short-term investments. Short-term investments consist of commercial paper that matures within one year from the date of purchase.
During the fiscal year ended March 28, 2009 cash used in investing activities was $11.0 million, consisting primarily of capital expenditures of $10.5 million as we completed the expansion of our New Hampshire headquarters and manufacturing facility as well as installation of our ERP system.
During the fiscal year ended March 31, 2008, cash used in investing activities was $4.8 million consisting primarily of capital expenditures of $4.5 million for equipment and plant improvements as well as intangible assets of $0.4 million related to our CVD reactor technology.
Cash Flows From Financing Activities
During the fiscal year ended April 3, 2010, cash generated from financing activities was $0.9 million representing the net cash from the exercise of stock options.
During the fiscal year ended March 28, 2009 cash used in financing activities was $89.6 million of which $90.0 million was for the payment of a dividend to stockholders of record at June 30, 2008.
During the fiscal year ended March 31, 2008, cash used in financing activities was $15.9 and primarily consisted of the repayment of a $15.0 million senior secured exchangeable promissory note.
64
Derivatives and Hedging Activities
We enter into forward foreign exchange contracts to hedge operational exposures from the impact of changes on foreign currency exchange rates. These forward foreign exchange contracts are entered into to support purchases made in the normal course of business and accordingly are not speculative in nature.
The notional amount of our Euro-denominated cash flow hedges was €19.9 million at April 3, 2010. These contracts had a combined net fair value liability of $0.2 million at April 3, 2010 due primarily to changes in the Euro to U.S. dollar exchange rates. Changes in the fair value of our cash flow hedges are recognized in stockholders' equity as a component of accumulated other comprehensive income as these financial instruments qualify for hedge accounting. Changes in the fair value of our fair value hedges are recognized in earnings as they occur.
Senior Credit Facility
On July 29, 2008, we entered into a senior credit agreement with Bank of America, N.A., as sole administrative and collateral agent, and a syndicate of financial institutions. The senior credit agreement provides for a three-year revolving senior credit facility in an aggregate principal amount of up to $90.0 million, which is available for the borrowing of revolving loans and the issuance of standby LOCs (the "senior credit facility"); provided that the aggregate principal amount of revolving loans may not exceed $50.0 million at any time. The senior credit facility includes a sub-limit of $25.0 million for swingline loans. As of April 3, 2010, we had $33.1 million of outstanding LOCs and no borrowings under the senior credit facility and $56.9 million of availability under the senior credit facility. The senior credit facility will mature on July 29, 2011.
The aggregate amount of borrowings and outstanding standby LOCs under the senior credit facility may not exceed a borrowing base equal to Adjusted EBITDA multiplied by 3.0 plus unrestricted cash on hand. The senior credit facility is guaranteed by all of our existing and future direct and indirect domestic subsidiaries. Obligations under the senior credit facility are secured by a first-priority lien on substantially all of the tangible and intangible assets and by a pledge of the capital stock of all of our domestic subsidiaries and 65% of the capital stock of our foreign subsidiaries owned directly by us or one of our domestic subsidiaries.
The senior credit facility may be increased by an aggregate amount of up to $100.0 million, with additional commitments from the lenders under the senior credit facility or from new financial institutions, if no default or event of default exists. We may exercise our option to increase the commitments not more than three times, and each increase will be in a minimum aggregate principal amount of $10.0 million and integral multiples of $5.0 million in excess thereof.
Borrowings under the senior credit facility bear interest at a floating rate equal to, at our option, LIBOR plus 2.25% per annum or a base rate plus 1.25% per annum. The base rate is defined as the higher of the Bank of America prime rate and the federal funds rate plus 0.50%. We pay a commitment fee to the lenders equal to 0.50% per annum on the actual daily unused portions of the senior credit facility and letter of credit fees equal to 2.25% per annum on the maximum amount available to be drawn under each standby letter of credit. As of April 3, 2010, the LIBOR rate, base rate and federal funds rate were 0.29%, 3.25% and 0.25%, respectively.
The senior credit agreement that governs the senior credit facility contains financial covenants that require us to meet certain financial tests, including a maximum consolidated net leverage ratio and a minimum consolidated fixed charge coverage ratio, calculated on a consolidated basis for each consecutive four fiscal quarter period. The senior credit agreement also contains covenants, which, among other things, limit our ability to: incur indebtedness; make investments; engage in mergers and other fundamental changes; sell or otherwise dispose of property or assets; pay dividends and other
65
restricted payments or enter into transactions with affiliates; enter into burdensome agreements; use proceeds to purchase or carry margin stock or extend credit to others; make subordinated debt payments; make certain changes to the terms of material indebtedness; and other covenants customary for such a facility. We were in compliance with all of these covenants as of April 3, 2010.
Recent volatility in the financial markets has severely diminished liquidity and capital availability worldwide. We believe that the risk that we will not be able to use the facility in the future due to these recent events is mitigated to some degree by the fact that there are several banks participating in the facility. However, we cannot fully predict the long-term impact on the facility of a continued credit crisis.
Off-Balance Sheet Arrangements
We do not have any relationships with unconsolidated entities or financial partnerships, such as entities often referred to as structured finance or special purpose entities, which would have been established for the purpose of facilitating off-balance sheet arrangements or other contractually narrow or limited purposes. As such, we are not exposed to any financing, liquidity, market or credit risk that could arise if we had engaged in such relationships.
As of April 3, 2010, we had $33.1 million of standby letters of credit outstanding issued under our senior credit facility representing performance guarantees issued against customer deposits. These standby letters of credit are scheduled to expire within the next twelve months and have not been included in the consolidated financial statements included herein.
Contractual Obligations and Commercial Commitments
Under generally accepted accounting principles as used in the United States, some obligations and commitments are not required to be included in the consolidated balance sheets and statements of income. These obligations and commitments, while entered into in the normal course of business, may have a material impact on liquidity.
The following table reflects our contractual obligations and commercial commitments as of April 3, 2010:
| |
Payments due by period | |||||||||||||||
|---|---|---|---|---|---|---|---|---|---|---|---|---|---|---|---|---|
| |
Total | Less than 1 year |
1 - 3 years | 3 - 5 years | More than 5 years |
|||||||||||
| |
(dollars in thousands) |
|||||||||||||||
Operating lease obligations(a) |
$ | 2,344 | $ | 945 | $ | 1,279 | $ | 120 | — | |||||||
Purchase commitments under agreements(b) |
219,139 | 219,139 | — | — | — | |||||||||||
Other long-term liabilities reflected on our balance sheet(c)(d) |
175 | — | 175 | — | — | |||||||||||
Total |
$ | 221,658 | $ | 220,084 | $ | 1,454 | $ | 120 | — | |||||||
- (a)
- These
amounts represent our minimum operating lease payments due under noncancelable operating leases with initial or remaining lease terms in excess of one
year as of April 3, 2010. For additional information about our operating leases, refer to Note 12 of the Notes to Consolidated Financial Statements.
- (b)
- Purchase commitments under agreements relate to arrangements entered into with suppliers of polysilicon and PV raw materials and ancillary equipment. These agreements specify future quantities and pricing of products to be supplied by the vendors and there are often consequences in the event that we terminate the arrangements. In line with industry practice, certain portions of the purchase commitments are satisfied in advance of the delivery of goods in the form of
66
prepayments, which are then offset against future orders upon delivery. As of April 3, 2010, our outstanding prepayments under certain of these purchase commitments amounted to $17.1 million.
- (c)
- Other
long-term liabilities reflected on our balance sheet relate to a liability related to commissions payable.
- (d)
- Obligations for income tax uncertainties of $0.6 million as of April 3, 2010 are not included in the table above as we are uncertain as to if or when such amounts may be settled.
Recent Accounting Pronouncements
Recently Adopted Accounting Pronouncements
In June 2009, the Financial Accounting Standards Board ("FASB") issued Accounting Standards Codification and the Hierarchy of Generally Accepted Accounting Principles. This standard replaces the former The Hierarchy of Generally Accepted Accounting Principles, and establishes only two levels of U.S. generally accepted accounting principles ("GAAP"), authoritative and non-authoritative. The FASB Accounting Standards Codification (the "Codification") will become the source of authoritative, nongovernmental GAAP, except for rules and interpretive releases of the Securities and Exchange Commission ("SEC"), which are sources of authoritative GAAP for SEC registrants. All other non-grandfathered, non-SEC accounting literature not included in the Codification will become non-authoritative. This standard is effective for financial statements for interim or annual reporting periods ending after September 15, 2009. We began to use the new guidelines and numbering system prescribed by the Codification when referring to GAAP in the quarter ending September 26, 2009. The new numbering system uses the prefix "ASC" (an abbreviation of Accounting Standards Codification). As the Codification was not intended to change or alter existing GAAP, the adoption did not have any impact on our consolidated financial statements.
In September 2006, the FASB issued authoritative guidance which defines fair value, establishes a framework in generally accepted accounting principles for measuring fair value and expands disclosures about fair value measurements. This standard only applies when other standards require or permit the fair value measurement of assets and liabilities. It does not increase the use of fair value measurement. This guidance became effective for fiscal years beginning after November 15, 2007, except as it relates to nonrecurring fair value measurements of nonfinancial assets and liabilities for which the standard is effective for fiscal years beginning after November 15, 2008. The adoption of this guidance with respect to financial assets and liabilities effective April 1, 2008 did not have a significant effect on our consolidated financial statements. In addition, we were required to apply the provisions of this guidance to nonfinancial assets and nonfinancial liabilities effective for the interim periods in fiscal years beginning after November 15, 2008. The adoption of this guidance for measuring nonfinancial assets and liabilities, essentially goodwill and identifiable intangible assets, did not have a material effect on our consolidated financial statements.
In December 2007, the FASB issued authoritative guidance regarding business combinations and establishes principles and requirements for how the acquirer recognizes and measures in its financial statements the identifiable assets acquired, the liabilities assumed, any non-controlling interest in the acquiree and the goodwill acquired in the business combination or a gain from a bargain purchase, and also establishes disclosure requirements to enable users of the financial statements to evaluate the nature and financial effects of the business combination. This guidance became effective for business combinations entered into during fiscal years beginning on or after December 15, 2008 and thereafter with the exception of the accounting for valuation allowances on deferred taxes and acquired tax contingencies. This guidance states that adjustments made to valuation allowances on deferred income taxes and acquired income tax contingencies associated with acquisitions that closed prior to the effective date of this guidance would apply the provisions of this guidance. The adoption of this guidance did not have a material impact on our consolidated financial statements.
67
In April 2009, the FASB issued authoritative guidance which provides additional guidelines for estimating fair value of financial instruments and additional guidance related to the disclosure of impairment losses on securities and the accounting for impairment losses on debt securities and increases the frequency of fair value disclosures. This guidance does not amend existing guidance related to other-than-temporary impairments of equity securities. This guidance is effective for fiscal years and interim periods ended after June 15, 2009. The adoption of this guidance did not have a material impact on our consolidated financial statements.
In May 2009, the FASB issued authoritative guidance to establish general standards of accounting for, and disclosures of events that occur after the balance sheet date but before financial statements are issued or are available to be issued. This guidance is effective for interim or fiscal periods ending after June 15, 2009. See Footnote No. 1 "Basis of Presentation" for the related disclosures. The adoption of this guidance did not have a material impact on our consolidated financial statements.
Accounting Pronouncements Not Yet Adopted
In June 2009, the FASB issued an amendment to the accounting principles relating to the transfer of financial assets that eliminates the concept of a qualifying special purpose entity, creates more stringent conditions for reporting a transfer of a portion of a financial asset as a sale, clarifies other sale-accounting criteria, and changes the initial measurement of a transferor's interest in transferred financial assets. This guidance will be effective for transfers of financial assets in fiscal years beginning after November 15, 2009 and in interim periods within those fiscal years with earlier adoption prohibited. We are currently assessing the potential impacts, if any, the adoption of this guidance will have on our consolidated financial statements.
In June 2009, the FASB issued authoritative guidance that eliminates certain exceptions to the consolidation of qualifying special purpose entities, contains new criteria for determining the primary beneficiary of a variable interest entity, and increases the frequency of required reassessments to determine whether a company is the primary beneficiary of a variable interest entity. The amendment also contains a new requirement that any term, transaction, or arrangement that does not have a substantive effect on an entity's status as a variable interest entity, a company's power over a variable interest entity, or a company's obligation to absorb losses or its right to receive benefits of an entity must be disregarded in applying consolidation provisions. The elimination of the qualifying special purpose entity concept and its consolidation exceptions will be effective for the fiscal year beginning after November 15, 2009, and for interim periods within that period, with earlier adoption prohibited. We are currently assessing the potential impacts, if any, the adoption of this amendment will have on our consolidated financial statements.
In October 2009, the FASB issued authoritative guidance that provides amendments to the revenue recognition criteria for separating consideration in multiple-deliverable revenue arrangements. It establishes a hierarchy of selling prices to determine the selling price of each specific deliverable which includes vendor-specific objective evidence (if available), third-party evidence (if vendor-specific evidence is not available), or estimated selling price if neither of the first two are available. This guidance also eliminates the residual method for allocating revenue between the elements of an arrangement and requires that arrangement consideration be allocated at the inception of the arrangement and expands the disclosure requirements regarding a vendor's multiple-deliverable revenue arrangements. This guidance is effective for fiscal years beginning on or after June 15, 2010 and early adoption is permitted. We elected not to adopt this authoritative guidance early and are currently assessing the potential impact, if any, the adoption of this guidance will have on our consolidated financial statements.
In January 2010, the FASB issued an update that improves the requirements related to fair value measurements and disclosures about transfers between Level 1, Level 2 and Level 3 assets and the
68
disaggregated activity in the roll forward for Level 3 fair value measurements. These new disclosures are effective for fiscal years beginning after December 15, 2010 and for interim periods within those fiscal years. We do not expect the adoption of these expanded disclosures to have a material impact on our consolidated financial statements.
Other recent accounting pronouncements issued by the FASB and the SEC did not have or are not expected to have a material impact on our present or future financial statements.
Item 7A. Quantitative and Qualitative Disclosures about Market Risk
We are exposed to a variety of market risks, including changes in interest rates affecting the return on our investments and foreign currency fluctuations.
Investment Risks
We maintain an investment portfolio which at April 3, 2010 consisted of $226.0 million of exchange traded money market funds and $20.0 million in short-term commercial paper. At any time a sharp rise in market interest rates could have an adverse impact on the fair value of our investment portfolio. Conversely, declines in market interest rates could have a material impact on the interest earnings of our investment portfolio. We do not currently hedge these interest rate exposures. We place our investments with high quality issuers and have policies limiting, among other things, the amount of credit exposure to any one issuer. We seek to limit default risk by purchasing only investment grade securities. A hypothetical movement of plus or minus 50 basis points in market interest rates would not have a material impact to the value of our investment portfolio. We also have the ability to hold our investments until maturity, and therefore do not expect our operating results or cash flows to be affected to any significant degree by the effect of a sudden change in market interest rates on our investment portfolio.
Foreign Currency Risk
Although, our reporting currency is the U.S. dollar and substantially all of our sales contracts are currently denominated in U.S. dollars, we may incur costs denominated in other currencies. In addition, we maintain our cash balances primarily in the U.S. dollar. However, from time to time, we may maintain cash balances in currencies other than the U.S. dollar. As a result, we will be subject to currency translation risk. Exchange rates between a number of currencies and U.S. dollars have fluctuated significantly over the last few years and future exchange rate fluctuations may occur.
Our primary foreign currency exposure relates to fluctuations in foreign currency exchange rates, primarily the euro for inventory purchases from vendors located in Europe. Fluctuations in exchange rates could affect our gross and net profit margins and could result in foreign exchange and operating losses. Changes in the customer's delivery schedules can affect related payments to our vendors which will cause fluctuations in the cash flows and when we expect to make payments when these cash flows are realized or settled.
We enter into forward foreign exchange contracts that qualify as cash flow hedges to hedge portions of our anticipated foreign currency denominated inventory purchases. These contracts typically expire within 12 months. Consistent with the nature of the economic hedges provided by these forward foreign exchange contracts, increases or decreases in their fair values would be effectively offset by corresponding decreases or increases in the U.S. dollar value of our future foreign currency denominated inventory purchases (i.e., "hedged items"). The information provided below relates only to the hedging instruments and does not represent the corresponding changes in the underlying hedged items.
69
During the three months ended June 27, 2009, we requested certain vendors to delay deliveries to us due to delays in deliveries requested by certain of our polysilicon customers. As a result, certain of our forward foreign exchange contracts to purchase Euros no longer qualified as cash flow hedges because the hedging relationship was no longer deemed to be highly effective. At that time we entered into offsetting forward foreign exchange contracts to sell Euros with notional amounts of €26.6 million to eliminate any further foreign exchange risk related to those foreign exchange contracts.
During the three months ended September 26, 2009 and December 26, 2009 we had unhedged euro denominated purchase commitments of approximately €31.7 million, (net of advances on inventory purchases and available Euros in our ending cash balances) as were unable to initiate new foreign forward exchange contracts since negotiations with such vendors were not yet finalized. During the three months entered April 3, 2010, we finalized negotiations with these vendors and we were then able to enter into new foreign forward exchange contracts to hedge these commitments.
As of April 3, 2010 we had Euro forward foreign exchange contracts with notional amounts of €19.9 million all of which expire within twelve months. As of April 3, 2010, the fair value and carrying amount of our forward foreign exchange contracts was a net liability of $0.2 million. Relative to our foreign currency exposures existing at April 3, 2010, a 10% appreciation (depreciation) of the Euro against the U. S. dollar would result in an increase (decrease) in the fair value of these derivative instruments of approximately $2.7 million.
70
Item 8. Financial Statements and Supplementary Data
71
GT Solar International, Inc. and Subsidiaries
Consolidated Balance Sheets
(In thousands, except share data)
| |
April 3, 2010 |
March 28, 2009 |
|||||||
|---|---|---|---|---|---|---|---|---|---|
Assets |
|||||||||
Current assets: |
|||||||||
Cash and cash equivalents |
$ | 230,748 | $ | 107,148 | |||||
Short-term investments |
19,967 | — | |||||||
Accounts receivable, net of allowance for doubtful accounts of $2,620 and $401, respectively |
52,620 | 57,552 | |||||||
Inventories |
68,858 | 103,476 | |||||||
Deferred costs |
131,986 | 174,961 | |||||||
Advances on inventory purchases |
17,110 | 120,227 | |||||||
Deferred income taxes |
72,868 | 25,498 | |||||||
Refundable income taxes |
1,516 | 40,329 | |||||||
Prepaid expenses and other current assets |
4,340 | 2,825 | |||||||
Total current assets |
600,013 | 632,016 | |||||||
Property, plant and equipment, net |
19,359 |
18,856 |
|||||||
Other assets |
639 | 940 | |||||||
Intangible assets, net |
3,205 | 6,368 | |||||||
Deferred cost |
66,265 | 36,643 | |||||||
Goodwill |
42,600 | 42,600 | |||||||
Total assets |
$ | 732,081 | $ | 737,423 | |||||
Liabilities and stockholders' equity |
|||||||||
Current liabilities: |
|||||||||
Accounts payable |
$ | 22,132 | $ | 50,832 | |||||
Accrued expenses |
17,543 | 15,695 | |||||||
Customer deposits |
119,616 | 222,654 | |||||||
Deferred revenue |
229,951 | 285,005 | |||||||
Accrued income taxes |
33,621 | 158 | |||||||
Total current liabilities |
422,863 | 574,344 | |||||||
Deferred income taxes |
25,661 |
15,647 |
|||||||
Deferred revenue |
104,396 | 63,122 | |||||||
Other non-current liabilities |
175 | 2,405 | |||||||
Total liabilities |
553,095 | 655,518 | |||||||
Commitments and contingencies (Note 12) |
— | — | |||||||
Stockholders' equity: |
|||||||||
Preferred stock, 10,000 shares authorized, none issued and outstanding |
— | — | |||||||
Common stock, $0.01 par value; 500,000 shares authorized, 143,815 and 143,048 shares issued and outstanding as of April 3, 2010 and March 28, 2009 respectively |
1,438 | 1,431 | |||||||
Additional paid-in capital |
86,644 | 80,070 | |||||||
Accumulated other comprehensive (loss) income |
(5,145 | ) | (8,389 | ) | |||||
Retained earnings |
96,049 | 8,793 | |||||||
Total stockholders' equity |
178,986 | 81,905 | |||||||
Total liabilities and stockholders' equity |
$ | 732,081 | $ | 737,423 | |||||
The accompanying notes are an integral part of these consolidated financial statements.
72
GT Solar International, Inc. and Subsidiaries
Consolidated Statements of Operations
(In thousands, except per share data)
| |
Fiscal Year Ended April 3, 2010 |
Fiscal Year Ended March 28, 2009 |
Fiscal Year Ended March 31, 2008 |
||||||||
|---|---|---|---|---|---|---|---|---|---|---|---|
Revenue |
$ | 544,245 | $ | 541,027 | $ | 244,052 | |||||
Cost of revenue |
325,263 | 326,358 | 151,709 | ||||||||
Gross profit |
218,982 | 214,669 | 92,343 | ||||||||
Operating expenses: |
|||||||||||
Research and development |
21,410 | 18,323 | 10,517 | ||||||||
Selling and marketing |
11,823 | 17,469 | 10,452 | ||||||||
General and administrative |
38,623 | 32,228 | 21,435 | ||||||||
Amortization of intangible assets |
3,164 | 3,105 | 3,018 | ||||||||
Total operating expenses |
75,020 | 71,125 | 45,422 | ||||||||
Income from operations |
143,962 | 143,544 | 46,921 | ||||||||
Other income (expense): |
|||||||||||
Interest income |
420 | 2,996 | 6,543 | ||||||||
Interest expense |
(758 | ) | (483 | ) | (816 | ) | |||||
Interest component of forward foreign exchange contracts |
(625 | ) | 2,135 | (835 | ) | ||||||
Other expense, net |
(3,125 | ) | (6,012 | ) | (1,244 | ) | |||||
Income before income taxes |
139,874 | 142,180 | 50,569 | ||||||||
Provision for income taxes |
52,618 | 54,212 | 14,464 | ||||||||
Net income |
$ | 87,256 | $ | 87,968 | $ | 36,105 | |||||
Income per share |
|||||||||||
Basic |
$ | 0.61 | $ | 0.62 | $ | 0.25 | |||||
Diluted |
$ | 0.60 | $ | 0.61 | $ | 0.25 | |||||
Dividends paid per common share |
— |
$ |
0.632 |
— |
|||||||
Shares used to compute income per share: |
|||||||||||
Basic |
143,409 | 142,582 | 142,290 | ||||||||
Diluted |
145,390 | 144,471 | 144,059 | ||||||||
The accompanying notes are an integral part of these consolidated financial statements.
73
GT Solar International, Inc. and Subsidiaries
Consolidated Statements of Changes in Stockholders' Equity
(In thousands)
| |
Common Stock | |
Retained Earnings (Accumulated Deficit) |
Accumulated Other Comprehensive Income (Loss) |
|
|
||||||||||||||||||
|---|---|---|---|---|---|---|---|---|---|---|---|---|---|---|---|---|---|---|---|---|---|---|---|---|
| |
Additional Paid-in Capital |
Total Stockholders' Equity |
Total Comprehensive Income |
|||||||||||||||||||||
| |
Shares | Par Value | ||||||||||||||||||||||
Balance at March 31, 2007 |
142,290 | $ | 1,423 | $ | 70,979 | $ | (25,289 | ) | $ | (15 | ) | $ | 47,098 | |||||||||||
Stock compensation |
2,839 | 2,839 | ||||||||||||||||||||||
Issuance of restricted stock |
85 | 1 | (1 | ) | — | |||||||||||||||||||
Net income |
36,105 | 36,105 | $ | 36,105 | ||||||||||||||||||||
Other comprehensive income (loss) |
||||||||||||||||||||||||
Cash flow hedge of foreign exchange (net of taxes of $3,798) |
5,575 | 5,575 | 5,575 | |||||||||||||||||||||
Foreign currency translation adjustment |
24 | 24 | 24 | |||||||||||||||||||||
Balance at March 31, 2008 |
142,375 | 1,424 | 73,817 | 10,816 | 5,584 | 91,641 | $ | 41,704 | ||||||||||||||||
Stock compensation |
4,806 | 4,806 | ||||||||||||||||||||||
Option exercises |
673 | 7 | 1,170 | 1,177 | ||||||||||||||||||||
Common stock dividend |
(89,991 | ) | (89,991 | ) | ||||||||||||||||||||
Excess tax benefits from stock activity |
277 | 277 | ||||||||||||||||||||||
Net income |
87,968 | 87,968 | $ | 87,968 | ||||||||||||||||||||
Other comprehensive income (loss) |
||||||||||||||||||||||||
Cash flow hedge of foreign exchange (net of taxes of $8,517) |
(14,060 | ) | (14,060 | ) | (14,060 | ) | ||||||||||||||||||
Foreign currency translation adjustment |
87 | 87 | 87 | |||||||||||||||||||||
Balance at March 28, 2009 |
143,048 | 1,431 | 80,070 | 8,793 | (8,389 | ) | 81,905 | $ | 73,995 | |||||||||||||||
Stock compensation |
5,682 | 5,682 | ||||||||||||||||||||||
Option exercises and vesting of restricted stock units |
941 | 9 | 1,057 | 1,066 | ||||||||||||||||||||
Forfeiture of unvested restricted stock and dividend |
(56 | ) | (1 | ) | 36 | 35 | ||||||||||||||||||
Excess tax benefits from share-based award activity |
485 | 485 | ||||||||||||||||||||||
Minimum tax withholdings payments for employee share-based awards |
(118 | ) | (1 | ) | (686 | ) | (687 | ) | ||||||||||||||||
Net income |
87,256 | 87,256 | $ | 87,256 | ||||||||||||||||||||
Other comprehensive income (loss) |
||||||||||||||||||||||||
Cash flow hedge of foreign exchange (net of taxes of $1,189) |
3,239 | 3,239 | 3,239 | |||||||||||||||||||||
Foreign currency translation and other adjustments (net of taxes of $2) |
5 | 5 | 5 | |||||||||||||||||||||
Balance at April 3, 2010 |
143,815 | $ | 1,438 | $ | 86,644 | $ | 96,049 | $ | (5,145 | ) | $ | 178,986 | $ | 90,500 | ||||||||||
The accompanying notes are an integral part of these consolidated financial statements.
74
GT Solar International, Inc. and Subsidiaries
Consolidated Statements of Cash Flows
(In thousands)
| |
Fiscal Year Ended April 3, 2010 |
Fiscal Year Ended March 28, 2009 |
Fiscal Year Ended March 31, 2008 |
||||||||
|---|---|---|---|---|---|---|---|---|---|---|---|
Cash flow from operating activities |
|||||||||||
Net income |
$ | 87,256 | $ | 87,968 | $ | 36,105 | |||||
Adjustments to reconcile net income to net cash provided by operating activities: |
|||||||||||
Amortization expense |
3,164 | 3,105 | 3,018 | ||||||||
Depreciation expense |
3,706 | 2,006 | 1,034 | ||||||||
Deferred income tax expense (benefit) |
(39,192 | ) | 24,971 | (24,643 | ) | ||||||
Provision for excess and obsolete inventory |
6,899 | 2,585 | 380 | ||||||||
Stock based compensation expense |
5,682 | 4,806 | 2,839 | ||||||||
Other adjustments, net |
817 | 777 | 712 | ||||||||
Changes in operating assets and liabilities: |
|||||||||||
Restricted cash |
— | 164,028 | (154,706 | ) | |||||||
Accounts receivable |
4,838 | 4,416 | (46,930 | ) | |||||||
Inventories |
27,722 | (68,470 | ) | (29,279 | ) | ||||||
Deferred costs |
13,353 | (106,450 | ) | (63,910 | ) | ||||||
Advances on inventory purchases |
103,119 | (42,592 | ) | (58,394 | ) | ||||||
Prepaid expenses and other current assets |
(2,429 | ) | (961 | ) | 1,414 | ||||||
Accounts payable and accrued expenses |
(22,406 | ) | 7,130 | 41,097 | |||||||
Customer deposits |
(103,038 | ) | (40,979 | ) | 171,629 | ||||||
Deferred revenue |
(13,780 | ) | 183,937 | 99,523 | |||||||
Accrued income taxes |
36,968 | (22,168 | ) | 18,819 | |||||||
Refundable income taxes |
35,307 | (40,329 | ) | — | |||||||
Other assets (liabilities), net |
(710 | ) | (10,908 | ) | 2,824 | ||||||
Net cash provided by operating activities |
147,276 | 152,872 | 1,532 | ||||||||
Cash flows from investing activities |
|||||||||||
Purchases of short-term investments |
(19,967 | ) | — | — | |||||||
Purchases of property, plant and equipment |
(4,573 | ) | (10,509 | ) | (4,483 | ) | |||||
Other investing activities, net |
— | (450 | ) | (358 | ) | ||||||
Net cash used in investing activities |
(24,540 | ) | (10,959 | ) | (4,841 | ) | |||||
Cash flows from financing activities |
|||||||||||
Payments of notes payable |
— | — | (15,934 | ) | |||||||
Payment of dividends to stockholders |
— | (89,991 | ) | — | |||||||
Credit facility issuance costs |
— | (1,077 | ) | — | |||||||
Proceeds and excess tax benefit from exercise of stock options |
1,550 | 1,454 | — | ||||||||
Payments related to share repurchases to satisfy statutory minimum tax withholdings |
(687 | ) | — | — | |||||||
Net cash provided by (used in) financing activities |
863 | (89,614 | ) | (15,934 | ) | ||||||
Effect of foreign exchange rates on cash |
1 | 10 | 23 | ||||||||
Increase (decrease) in cash and cash equivalents |
123,600 | 52,309 | (19,220 | ) | |||||||
Cash and cash equivalents at beginning of period |
107,148 | 54,839 | 74,059 | ||||||||
Cash and cash equivalents at end of period |
$ | 230,748 | $ | 107,148 | $ | 54,839 | |||||
Non-cash transactions: |
|||||||||||
Change in goodwill relating to adjustments to acquired net assets |
— | $ | 590 | — | |||||||
Supplemental disclosures of cash flow information: |
|||||||||||
Cash paid for interest |
$ | 407 | $ | 597 | $ | 1,076 | |||||
Cash paid for income taxes, net of refunds |
$ | 18,196 | $ | 90,866 | $ | 21,258 | |||||
The accompanying notes are an integral part of these consolidated financial statements.
75
GT Solar International, Inc. and Subsidiaries
Notes to Consolidated Financial Statements
April 3, 2010
(In thousands, except
per share data)
1. Organization
GT Solar International, Inc. and Subsidiaries (the "Company" or "Successor"), designs and manufactures specialized manufacturing equipment and provides services for the production of photovoltaic ("PV"), wafers, cells and modules and polysilicon. The Company's principal products are directional solidification systems, or DSS units, and chemical vapor deposition reactors, or CVD reactors. On September 27, 2006, the Company became the parent company of its principal operating subsidiary, GT Solar Incorporated (the "Reorganization Merger"), through a transaction that is more fully described below. Effective August 9, 2006, GT Solar Incorporated changed its name from GT Equipment Technologies, Inc. to GT Solar Incorporated.
Effective January 1, 2006, all of the outstanding capital stock of the Company's accounting predecessor (the "Predecessor") was acquired by GT Solar Holdings, LLC for $82,859 (the "Acquisition"). The Acquisition was financed by the issuance of debt (see Note 8) and the sale of shares. The accompanying financial information reflects the consolidated financial position, results of operations and cash flows of the Company subsequent to the date of the Acquisition and includes adjustments required under the purchase method of accounting. In accordance with the requirements of purchase accounting, the assets and liabilities of the Company were adjusted to their estimated fair values and the resulting goodwill of $43,190 was recorded as of the transaction date.
On September 27, 2006, the Company entered into the Agreement and Plan of Merger with GT Solar Incorporated and GT Solar Merger Corp., a newly formed wholly owned subsidiary of the Company, pursuant to which GT Solar Merger Corp. was merged with and into GT Solar Incorporated, with GT Solar Incorporated as the surviving corporation in the merger. In the Reorganization Merger, each outstanding share of common stock of GT Solar Incorporated was converted into one share of common stock of the Company, and each option to acquire a share of common stock of GT Solar Incorporated was converted into an option to acquire one share of common stock of the Company. Each outstanding share of common stock of GT Solar Merger Corp. was converted in the Reorganization Merger into one share of common stock of GT Solar Incorporated.
Immediately following, and as a result of, the Reorganization Merger, GT Solar Incorporated was a wholly owned direct subsidiary of the Company, and the Company was a wholly-owned direct subsidiary of GT Solar Holdings, LLC. Prior to the Reorganization Merger, GT Solar International, Inc. did not conduct any operations or own any material assets.
In July 2008 the Company completed an initial public offering of 30,300 shares of common stock by certain of its stockholders. In March 2010, the Company completed a secondary public offering of 28,750 shares of common stock by certain of its stockholders.
The Company is headquartered in Merrimack, NH and sells its products worldwide. The Company also has locations in Missoula, Montana; Shanghai and Beijing, China; and Chupei City, Taiwan.
76
GT Solar International, Inc. and Subsidiaries
Notes to Consolidated Financial Statements (Continued)
April 3, 2010
(In thousands, except per share data)
2. Significant Accounting Policies
The accompanying consolidated financial statements reflect the application of certain significant accounting policies, as described in this note and elsewhere in these notes.
Principles of Consolidation. The accompanying consolidated financial statements include the accounts of the Company and all of its wholly-owned subsidiaries. All material intercompany accounts and transactions have been eliminated. The functional currency for the Company's Asia operations is the applicable local currency. Gains and losses resulting from translation of this foreign currency into U.S. dollars in consolidation are recorded in accumulated other comprehensive loss.
Use of Estimates. The preparation of financial statements in conformity with accounting principles generally accepted in the United States requires management to make estimates and assumptions that affect the reported amounts of assets, liabilities, revenues and expenses and the related disclosure of contingent assets and liabilities. Management evaluates estimates on an ongoing basis, including those related to revenue recognition, allowance for doubtful accounts, inventory valuation, deferred tax assets, property and equipment, goodwill and other intangible assets, warranty obligations, contingencies and share-based compensation. Management bases its estimates on historical experience and on various other assumptions that are believed to be reasonable under the current circumstances, the results of which form the basis for making judgments about the carrying values of assets and liabilities that are not readily apparent from other sources. The intent is to accurately state assets and liabilities given facts known at the time of valuation. These assumptions may prove incorrect as facts change in the future. Actual results may differ materially from these estimates under different assumptions or conditions.
Fiscal Year End. The Company's reporting period is based on a 52-week year that ends on the Saturday closest to March 31, which in certain years results in a 53-week fiscal year. The Company's quarterly reporting includes 13 week periods, unless otherwise noted. The fiscal year ending April 3, 2010 has 53 weeks, with the extra week occurring in the fourth quarter. The Company uses the terms quarterly, monthly, and annual in describing its financial results.
Cash Equivalents. The Company considers all highly liquid investments with an original maturity of three months or less when purchased to be cash equivalents.
Short Term Investments. Marketable securities with maturities greater than 90 days, but less than one year at purchase, are recorded as short-term investments. The Company has classified its marketable securities as "available-for-sale." These marketable securities are recorded at fair value and unrealized gains and losses are recorded to accumulated other comprehensive income (loss) until realized. Realized gains and losses on sales of all these securities are reported in earnings, computed using the specific identification cost method. Declines in value determined to be other-than-temporary on available-for-sale securities are recorded within other income. At April 3, 2010 the Company's short term investments were not impaired.
Accounts Receivable and Allowance for Doubtful Accounts. The Company carries its accounts receivable at their face amounts less an allowance for doubtful accounts. On a periodic basis, the Company evaluates its accounts receivable and establishes the allowance for doubtful accounts based on a combination of specific customer circumstances and credit conditions and based on a history of
77
GT Solar International, Inc. and Subsidiaries
Notes to Consolidated Financial Statements (Continued)
April 3, 2010
(In thousands, except per share data)
2. Significant Accounting Policies (Continued)
write-offs and collections. Where the Company is aware of a customer's inability to meet its financial obligations, it specifically reserves for the potential bad debt to reduce the net recognized receivable to the amount it reasonably believes will be collected. The Company's policy is generally not to charge interest on trade receivables after the invoice becomes past due. A receivable is considered past due if payments have not been received within agreed-upon invoice terms. Accounts are reviewed regularly for collectability and those deemed uncollectible are written off.
Fair Value of Financial Instruments. The fair value of a financial instrument is the price that would be received to sell an asset or paid to transfer a liability in the principal or most advantageous market for the asset or liability in an orderly transaction between market participants at the measurement date. The carrying values of cash and cash equivalents, accounts receivable, accounts payable and accrued liabilities approximate their respective fair values due to their short-term maturities. Marketable securities and foreign currency derivatives are carried at fair value based on quoted market prices for financial instruments with similar characteristics.
Concentration of Credit Risk. Financial instruments that potentially subject the Company to significant concentration of credit risk include its money market fund investments (categorized as cash and cash equivalents) and its investment in commercial paper (categorized as short-term investments). The Company's policy is to invest only with high quality issuers and has policies limiting, among other things, the amount of credit exposure to any one issuer. The Company also is currently invested in relatively short-term investments, thereby allowing these investments to be held to maturity.
In addition, the Company has credit risk from derivative financial instruments used in hedging activities and accounts receivable. The Company invests in a variety of financial instruments and limits the amount of financial exposure to any one financial institution. The Company has a comprehensive credit policy in place and exposure to credit risk is monitored on an ongoing basis. Credit evaluations are performed on all customers requiring credit over a certain amount. Credit risk is mitigated through collateral such as letter of credit, bank guarantees or payment terms like cash in advance. The credit risk from derivative financial instrument is described further under the following caption—Derivative Financial Instruments and Hedging Instruments.
Inventories. Inventories are stated at the lower of cost or market. The cost of inventory is determined using the first-in, first-out (FIFO) method. The Company records excess and obsolete inventory charges for both inventories on site as well as inventory at contract manufacturers and suppliers.
Purchase Commitments. The Company enters into commitments to purchase material from various suppliers in the ordinary course of business. These commitments are entered into to satisfy the material requirements of a specific contract or the overall production plan and often require the Company to make payments in advance. The Company evaluates these advances for recoverability on a periodic basis and more frequently if indicators of asset impairment arise.
In the event the Company reschedules and/or cancels a portion of these commitments due to customer delivery delays, customer contract terminations or changes to its production plans, the Company may be liable for cancellation penalties or be required to purchase material in excess of its
78
GT Solar International, Inc. and Subsidiaries
Notes to Consolidated Financial Statements (Continued)
April 3, 2010
(In thousands, except per share data)
2. Significant Accounting Policies (Continued)
current expected demand. In such instances, the Company reviews the contractual terms of its purchase commitments and seeks to negotiate with the vendor to minimize any potential loss. In cases where the cancellation is the result of a customer contract termination or delay in customer delivery, the Company may seek to recover the costs incurred.
The Company accrues as cost of revenue losses estimated on advances which are not considered recoverable because of a deterioration in the financial condition of the vendor or because the advances are expected to be forfeited as part of a planned order termination and any termination fees which may be paid to vendors when the Company terminates the contract in accordance with the contract terms.
Property, Plant and Equipment. Land, land improvements, buildings and manufacturing and equipment are stated at cost. Depreciation is provided, primarily using the straight-line method, over estimated useful lives, ranging from 3 to 15 years for manufacturing equipment and furniture and fixtures, and up to 40 years for buildings. Leasehold improvements are capitalized and depreciated over the lesser of the useful life or the initial lease term.
Intangibles and other Long-Lived Assets. The Company recognizes an impairment loss for intangibles and other long-lived assets if the carrying amount of a long-lived asset is not recoverable based on its undiscounted future cash flows. Any such impairment loss is measured as the difference between the carrying amount and the fair value of the asset. The Company does not believe that its long-lived assets or its intangible assets are impaired as of April 3, 2010.
Goodwill. Goodwill represents the excess of the cost of acquired businesses over the fair value of identifiable net assets acquired. The Company performs an annual assessment of its goodwill as of the beginning of the fourth fiscal quarter for impairment or whenever events or changes in circumstances indicate there might be impairment.
Goodwill is evaluated at the reporting unit level and is entirely attributable to the Company's PV business. The evaluation for impairment is performed by comparing the carrying amount of these assets to their estimated fair value. If the carrying amounts exceed the reporting unit fair value, then the second step of the goodwill impairment test is performed to determine the amount of the impairment loss. At April 3, 2010, the Company has determined that there is no impairment of goodwill. Should impairment occur in the future, goodwill would be adjusted to its fair value.
Warranty. The Company's polysilicon products are sold with a standard warranty typically for a period not exceeding twenty-four months from delivery. The Company's PV products are generally sold with a standard warranty for a period equal to the shorter of: (i) twelve months from the date of acceptance by the customer; or (ii) fifteen months from the date of shipment. The warranty is typically provided on a repair or replacement basis and is not limited to products or parts manufactured by the Company. The Company accrues an estimate of the future costs of meeting warranty obligations when products are shipped. The Company makes and revises this estimate based on the number of units under warranty and our historical experience with warranty claims.
Derivative Financial Instruments and Hedging Agreements. The Company enters into forward foreign exchange contracts to hedge operational exposures from the impact of changes in foreign
79
GT Solar International, Inc. and Subsidiaries
Notes to Consolidated Financial Statements (Continued)
April 3, 2010
(In thousands, except per share data)
2. Significant Accounting Policies (Continued)
exchange rates. Such exposures result primarily from purchase orders for inventory and equipment that are denominated in currencies other than the U.S. dollar, primarily the Euro. These foreign exchange forward contracts are entered into to support purchases made in the normal course of business, and accordingly, are not speculative in nature. The Company's hedges relate to anticipated transactions, are designated and documented at the inception of the respective hedges as cash flow hedges and are evaluated for effectiveness quarterly.
The Company records all derivative financial instruments in the consolidated financial statements in other current assets or accrued liabilities, depending on their net position, at fair value. Changes in the fair value of the derivative financial instruments are either recognized periodically in earnings or in stockholders' equity as a component of accumulated other comprehensive income ("AOCI") or loss depending on whether the derivative financial instrument qualifies for hedge accounting. The effective portion of any changes in the fair value of forward contracts that have been designated and qualifies as cash flow hedges is recorded in AOCI until the hedged transaction occurs or the recognized currency transaction affects earnings. Once the hedged transaction occurs or the recognized currency transaction affects earnings, the effective portion of any related gains or losses on the cash flow hedge is reclassified from AOCI to the Company's Consolidated Statements of Operations. Changes in fair values of derivatives not qualifying for hedge accounting are reported in earnings as they occur. The Company classifies the cash flows from hedging transactions in the same categories as the cash flows from the respective hedged items.
Hedge accounting is discontinued when it is determined that a derivative instrument is no longer effective. Any gains or losses that were accumulated in other comprehensive income from hedging a forecasted transaction will be recognized immediately in current period earnings due to changes in expectations on the original forecasted transaction.
Derivative financial instruments involve, to a varying degree, elements of market and credit risk not recognized in consolidated financial statements. The market risk associated with these instruments resulting from currency exchange rate or interest rate movements is expected to offset the market risk of the underlying transactions, assets and liabilities being hedged. The counterparties to the agreements relating to the Company's foreign exchange instruments are major international financial institutions with high credit ratings. The Company does not believe that there is significant risk of nonperformance by the counterparties because the Company monitors the credit rating of such counterparties. While the contract or notional amounts of derivative financial instruments provide one measure of the volume of these transactions, they do not represent the amount of the Company's exposure to credit risk. The amounts potentially subject to credit risk (arising from the possible inability of the counterparty to meet the terms of the contracts) are generally limited to the amounts, if any, by which the counterparty's obligations under the contracts exceed the obligations of the Company to the counterparty.
Income Taxes. The Company provides for income taxes under the liability method. Under this method, deferred tax assets and liabilities are determined based on differences between financial reporting and tax bases of assets and liabilities, and are measured using the enacted tax rates and laws that will be in effect when the differences are expected to reverse. A valuation allowance is recorded on deferred tax assets unless realization is considered more likely than not.
80
GT Solar International, Inc. and Subsidiaries
Notes to Consolidated Financial Statements (Continued)
April 3, 2010
(In thousands, except per share data)
2. Significant Accounting Policies (Continued)
Effective April 1, 2008, the Company adopted authoritative guidance which clarifies the accounting for uncertainty in income taxes recognized in an enterprise's financial statements. This guidance prescribes a comprehensive model for how a company should recognize, measure, present and disclose in its financial statements uncertain tax positions that the company has taken or expects to take on a tax return. The impact of adoption of this guidance is more fully described in Note 10. The Company recognizes interest expense and penalties related to unrecognized tax benefits within income tax expense.
The Company reclassifies tax benefits realized upon the exercise of stock options in excess of that which is associated with the expense recognized for financial reporting purposes. These amounts are presented as a financing cash inflow rather than as a reduction of income taxes paid in the consolidated statement of cash flows.
Share-Based Compensation. The Company grants stock options, restricted stock and restricted stock units at the discretion of the Board of Directors, to certain key employees and certain members of the Board of Directors.
The Company recognizes compensation expense for all share-based payment awards made to employees and directors based on the estimated fair market values of the underlying instruments. Accordingly, share-based compensation cost is measured for employees at the grant date, based upon the fair value of the award, and is recognized as expense on a straight line basis over the requisite service period. The Company performed contemporaneous valuations in connection with share-based awards granted prior to the July 2008 initial public offering.
The Company accounts for equity instruments issued to non-employees as variable awards. Accordingly, the Company will be required to remeasure the fair value of the equity instrument at each reporting period prior to vesting and finally at the vesting date of the equity instruments.
The Company uses the Black-Scholes option pricing model (Black-Scholes) to value its stock options. Option valuation models require the input of highly subjective assumptions. Because the Company's employee stock options have characteristics significantly different from those of traded options, and because changes in the subjective input assumptions can materially affect the fair value estimate, in management's opinion, the existing models do not necessarily provide a reliable single measure of the fair value of its employee stock options.
The Company refers to restricted stock and restricted stock units as "restricted shares." A holder of restricted stock generally has all of the rights of a stockholder. Restricted stock is common stock that is considered issued and outstanding but is not fully transferable until certain conditions have been met, primarily the passage of time and continued employment or engagement with the Company during a predetermined vesting period set by the compensation committee (the "restricted period"). A restricted stock unit is a grant representing the right to receive a share of common stock upon vesting of the restricted stock unit and satisfaction of other conditions but for which no share of common stock is issued until the restricted stock unit vests and any other applicable conditions are satisfied. A holder of a restricted stock unit does not have any rights of a stockholder until the restricted stock unit vests and is converted to common stock. The fair value of restricted shares are based on the market price of the
81
GT Solar International, Inc. and Subsidiaries
Notes to Consolidated Financial Statements (Continued)
April 3, 2010
(In thousands, except per share data)
2. Significant Accounting Policies (Continued)
Company's stock on the date of grant and are recorded as compensation expense ratably over the applicable service period, which is generally two to four years. Unvested restricted shares and restricted stock units are forfeited in the event of termination of employment or engagement with the Company.
Share-based compensation expense recognized in the consolidated statement of operations is based on awards ultimately expected to vest; therefore, it has been reduced for estimated forfeitures (estimated at 9% as of April 3, 2010). Forfeitures are estimated at the time of initial grant and revised, if necessary, in subsequent periods if actual forfeitures differ from those estimates. The Company estimates forfeitures based on its historical activity, as it believes that these forfeiture rates are indicative of its expected forfeiture rate.
Customer Deposits and Payment Terms. The Company's payment terms with customers typically include a deposit which is recorded as customer deposits until such time as the products are shipped. The Company sometimes is requested by its customers to issue letters of credit in order to secure customer deposits. Generally, such a letter of credit expires upon shipment to the customer. In addition to cash deposits, customers are also generally required to either post a letter of credit or make advance payments at least equal to 90% of the value of the equipment prior to shipment. Upon shipment, the Company will invoice all but a final portion (typically 10%) for each product shipped with the remainder due upon customer acceptance. The Company's contracts with customers do not provide for any refunds for services or products and therefore no specific reserve for such is maintained. In instances where customers raise concerns over delivered products or services, the Company has endeavored to remedy the concern and all costs related to such matters have been insignificant in all periods presented.
At April 3, 2010 and March 28, 2009, the Company had $33,094 and $13,132, respectively, of standby letters of credit outstanding representing primarily performance guarantees issued against customer deposits. These standby letters of credit have not been included in the consolidated financial statements and have been issued under the senior credit facility.
Revenue Recognition. In addition to the matters discussed in the following paragraphs, the Company recognizes revenue provided title and risk of loss have passed to the customer, evidence of an arrangement exists, fees are contractually fixed or determinable, collectability is reasonably assured through historical collection results and regular credit evaluations, and there are no uncertainties regarding customer acceptance. The Company's revenue recognition policies for established products differ from its newer products.
Multiple contracts with a single customer or amendments to existing contracts with the same customer are evaluated as to whether they should be recognized as separate accounting arrangements from other contracts with the customer based on an evaluation of several factors including but not limited to the timing of when contracts were negotiated and executed, whether the software is interdependent in terms of design, technology or function and whether payment terms coincide. If contracts are considered linked for accounting purposes they are accounted for as one arrangement.
For most products, a portion of the total sales price (typically 10%) is not due until installation and customer acceptance occurs. For products the Company considers to be "established," the
82
GT Solar International, Inc. and Subsidiaries
Notes to Consolidated Financial Statements (Continued)
April 3, 2010
(In thousands, except per share data)
2. Significant Accounting Policies (Continued)
Company recognizes upon delivery revenue equal to the lesser of the amount allocated to the equipment or the contractual amount due (typically 90%) with the remainder recognized upon customer acceptance. For products considered to be "new," revenue is recorded upon customer acceptance or at the time the product is determined to be established.
Products are classified as "established" products if post-delivery acceptance provisions and the installation process have been determined to be routine, due to the fact that the acceptance provisions are generally a replication of pre-shipment procedures. The majority of products are manufactured to a standard specification. To ensure contractual performance levels are satisfied, the products often are tested at the Company's manufacturing facility prior to shipment. To the extent that customers' conditions cannot be replicated in the Company's facilities or if there is not a demonstrated history of meeting newer customer specifications, then the product is treated as "new" for revenue recognition purposes.
In determining when a "new" product is considered "established", the Company considers several factors including: the stability of the product's technology, the ability to test the product prior to shipment, successful installations at customers' sites, and the performance results once installed. The Company generally believes that the above coupled with a minimum of 3-5 successful customer installations and acceptances is necessary to support the conclusion that there are no uncertainties regarding customer acceptances and that the installation process can be considered perfunctory. These factors as well as the consideration of the ease of installation in different customer environments are all taken into consideration in determining whether a product should be classified as "established".
The majority of the Company's contracts involve the sale of equipment and services under multiple element arrangements. Revenue under multiple element arrangements is allocated to all elements based upon their relative fair values. To be considered a separate element, the product or service in question must represent a separate unit of accounting, and fulfill the following criteria: "(a) the delivered item(s) has value to the customer on a standalone basis; (b) there is objective and reliable evidence of the fair value of the undelivered item(s); and (c) if the arrangement includes a general right of return relative to the delivered item, delivery or performance of the undelivered item(s) is considered probable and substantially in the control of the Company." The Company's sales arrangements do not include a general right of return.
In certain circumstances the Company enters into contracts that grant contractual rights which are considered a separate element and require revenue to be recognized ratably over the period commencing when all other elements have been delivered and other contract criteria have been met and through the period when such rights expire.
As a part of its revenue arrangements, the Company sells certain equipment for which the Company has not been able to obtain objective evidence of fair value. If objective evidence does not exist for the undelivered elements of the arrangement, all revenue is deferred until such evidence does exist, or until all elements for which the Company does not have objective evidence of fair value are delivered, whichever is earlier assuming all other revenue recognition criteria are met. Once there is objective evidence of the fair value of undelivered elements, the amount allocated to equipment and parts is based on a residual method. Under this method, the total arrangement value is allocated first
83
GT Solar International, Inc. and Subsidiaries
Notes to Consolidated Financial Statements (Continued)
April 3, 2010
(In thousands, except per share data)
2. Significant Accounting Policies (Continued)
to undelivered elements, based on their fair values, with the remainder being allocated to equipment revenue.
The Company has determined that installation and training services are not integral to the stand-alone value of certain products. Typically the Company performs training at the same time as the installation process. The value of the undelivered installation and training services is deferred at an amount equal to the estimated fair value of the installation and any portion of the sales price that will not be received until the installation is completed. The amount allocated to installation and training is based upon the estimated time to complete the installation and training at the established fair value hourly rates. Objective evidence of fair value for these services is based on what the Company charges for similar professional services on a stand-alone basis and what third-party contractors would charge when performing similar services.
The Company periodically enters into turnkey contracts where it provides all of the equipment necessary for a complete production line, whether equipment is manufactured by the Company or not. For turnkey contracts, revenue recognition occur on a completed contract basis upon production line acceptance, which requires an acceptance test period after all individual items are installed and accepted. Revenue is deferred until the specified output has been achieved which is determined through specific contractual testing measures and overall customer acceptance. Revenue is not recognized upon the delivery and acceptance of any individual element.
Spare parts revenue is generally recognized upon shipment and services revenue is generally recognized as the services are provided.
The Company records reimbursable out-of-pocket expenses and shipping as both revenue and as a direct cost of revenue, as applicable. The Company records revenue net of applicable sales and value added taxes collected. Taxes collected from customers are recorded as part of accrued expenses on the balance sheet and are remitted to state and local taxing jurisdictions based on the filing requirements of each jurisdiction.
When a customer fails to perform its contractual obligations and such failure continues after notice of breach and a cure period, the Company may terminate the contract. The Company's contracts do not contain cancellation provisions and in the event of a customer breach, the customer may be liable for contractual damages. At the time of termination, the Company records as revenues any non-refundable deposits or deferred revenue amounts and records as cost of revenue any previously deferred cost as well as any related costs to terminate the contract including excess or obsolete inventory or unrecoverable vendor advances or other purchase commitment costs as a result of the termination.
Deferred Revenue and Deferred Costs. Deferred revenue includes amounts that have been billed per the contractual terms but have not been recognized as revenue. Deferred costs represent costs related to deferred revenues and include the cost of manufactured or acquired inventory items, capitalized labor and related overhead for our engineering services and turnkey contracts, and in certain cases shipping costs. The Company classifies as long-term the portion of deferred revenue and deferred costs that are expected to be recognized beyond the next fiscal year.
84
GT Solar International, Inc. and Subsidiaries
Notes to Consolidated Financial Statements (Continued)
April 3, 2010
(In thousands, except per share data)
2. Significant Accounting Policies (Continued)
Research and Development Costs. Research and development costs are expensed as incurred.
Recently Adopted Accounting Pronouncements. In June 2009, the Financial Accounting Standards Board ("FASB") issued Accounting Standards Codification and the Hierarchy of Generally Accepted Accounting Principles. This standard replaces the former The Hierarchy of Generally Accepted Accounting Principles, and establishes only two levels of U.S. generally accepted accounting principles ("GAAP"), authoritative and non-authoritative. The FASB Accounting Standards Codification (the "Codification") will become the source of authoritative, nongovernmental GAAP, except for rules and interpretive releases of the Securities and Exchange Commission ("SEC"), which are sources of authoritative GAAP for SEC registrants. All other non-grandfathered, non-SEC accounting literature not included in the Codification will become non-authoritative. This standard is effective for financial statements for interim or annual reporting periods ending after September 15, 2009. The Company began to use the new guidelines and numbering system prescribed by the Codification when referring to GAAP in the quarter ending September 26, 2009. The new numbering system uses the prefix "ASC" (an abbreviation of Accounting Standards Codification). As the Codification was not intended to change or alter existing GAAP, the adoption did not have any impact on the Company's consolidated financial statements.
In September 2006, the FASB issued authoritative guidance which defines fair value, establishes a framework in generally accepted accounting principles for measuring fair value and expands disclosures about fair value measurements. This standard only applies when other standards require or permit the fair value measurement of assets and liabilities. It does not increase the use of fair value measurement. This guidance became effective for fiscal years beginning after November 15, 2007, except as it relates to nonrecurring fair value measurements of nonfinancial assets and liabilities for which the standard is effective for fiscal years beginning after November 15, 2008. The adoption of this guidance with respect to financial assets and liabilities effective April 1, 2008 did not have a significant effect on the Company's consolidated financial statements. In addition, the Company was required to apply the provisions of this guidance to nonfinancial assets and nonfinancial liabilities effective for the interim periods in fiscal years beginning after November 15, 2008. The adoption of this guidance for measuring nonfinancial assets and liabilities, essentially goodwill and identifiable intangible assets, did not have a material effect on the Company's consolidated financial statements.
In December 2007, the FASB issued authoritative guidance regarding business combinations and establishes principles and requirements for how the acquirer recognizes and measures in its financial statements the identifiable assets acquired, the liabilities assumed, any non-controlling interest in the acquiree and the goodwill acquired in the business combination or a gain from a bargain purchase, and also establishes disclosure requirements to enable users of the financial statements to evaluate the nature and financial effects of the business combination. This guidance became effective for business combinations entered into during fiscal years beginning on or after December 15, 2008 and thereafter with the exception of the accounting for valuation allowances on deferred taxes and acquired tax contingencies. This guidance states that adjustments made to valuation allowances on deferred income taxes and acquired income tax contingencies associated with acquisitions that closed prior to the effective date of this guidance would apply the provisions of this guidance. The adoption of this guidance did not have a material impact on the Company's consolidated financial statements.
85
GT Solar International, Inc. and Subsidiaries
Notes to Consolidated Financial Statements (Continued)
April 3, 2010
(In thousands, except per share data)
2. Significant Accounting Policies (Continued)
In April 2009, the FASB issued authoritative guidance which provides additional guidelines for estimating fair value of financial instruments and additional guidance related to the disclosure of impairment losses on securities and the accounting for impairment losses on debt securities and increases the frequency of fair value disclosures. This guidance does not amend existing guidance related to other-than-temporary impairments of equity securities. This guidance is effective for fiscal years and interim periods ended after June 15, 2009. The adoption of this guidance did not have a material impact on the Company's consolidated financial statements.
In May 2009, the FASB issued authoritative guidance to establish general standards of accounting for, and disclosures of events that occur after the balance sheet date but before financial statements are issued or are available to be issued. This guidance is effective for interim or fiscal periods ending after June 15, 2009. The adoption of this guidance did not have a material impact on the Company's consolidated financial statements.
Accounting Pronouncements Not Yet Adopted. In June 2009, the FASB issued an amendment to the accounting principles relating to the transfer of financial assets that eliminates the concept of a qualifying special purpose entity, creates more stringent conditions for reporting a transfer of a portion of a financial asset as a sale, clarifies other sale-accounting criteria, and changes the initial measurement of a transferor's interest in transferred financial assets. This guidance will be effective for transfers of financial assets in fiscal years beginning after November 15, 2009 and in interim periods within those fiscal years with earlier adoption prohibited. The Company is currently assessing the potential impacts, if any, the adoption of this guidance will have on its consolidated financial statements.
In June 2009, the FASB issued authoritative guidance that eliminates certain exceptions to the consolidation of qualifying special purpose entities, contains new criteria for determining the primary beneficiary of a variable interest entity, and increases the frequency of required reassessments to determine whether a company is the primary beneficiary of a variable interest entity. The amendment also contains a new requirement that any term, transaction, or arrangement that does not have a substantive effect on an entity's status as a variable interest entity, a company's power over a variable interest entity, or a company's obligation to absorb losses or its right to receive benefits of an entity must be disregarded in applying consolidation provisions. The elimination of the qualifying special purpose entity concept and its consolidation exceptions will be effective for the fiscal year beginning after November 15, 2009, and for interim periods within that period, with earlier adoption prohibited. The Company is currently assessing the potential impacts, if any, the adoption of this amendment will have on its consolidated financial statements.
In October 2009, the FASB issued authoritative guidance that provides amendments to the revenue recognition criteria for separating consideration in multiple-deliverable revenue arrangements. It establishes a hierarchy of selling prices to determine the selling price of each specific deliverable which includes vendor-specific objective evidence (if available), third-party evidence (if vendor-specific evidence is not available), or estimated selling price if neither of the first two are available. This guidance also eliminates the residual method for allocating revenue between the elements of an arrangement and requires that arrangement consideration be allocated at the inception of the
86
GT Solar International, Inc. and Subsidiaries
Notes to Consolidated Financial Statements (Continued)
April 3, 2010
(In thousands, except per share data)
2. Significant Accounting Policies (Continued)
arrangement and expands the disclosure requirements regarding a vendor's multiple-deliverable revenue arrangements. This guidance is effective for fiscal years beginning on or after June 15, 2010 and early adoption is permitted. The Company has elected not to adopt this authoritative guidance early and is currently assessing the potential impact, if any, the adoption of this guidance will have on its consolidated financial statements.
In January 2010, the FASB issued an update that improves the requirements related to fair value measurements and disclosures about transfers between Level 1, Level 2 and Level 3 assets and the disaggregated activity in the roll forward for Level 3 fair value measurements. These new disclosures are effective for fiscal years beginning after December 15, 2010 and for interim periods within those fiscal years. The Company does not expect the adoption of these expanded disclosures to have a material impact on its consolidated financial statements.
Other recent accounting pronouncements issued by the FASB and the SEC did not have or are not expected to have a material impact on the Company's present or future financial statements.
Reclassification. Prior year amounts have been reclassified to conform to the current year presentation the most significant of which relates to the classification of the interest component of forward foreign exchange contracts separately from interest income and interest expense in the Consolidated Statements of Operations.
3. Goodwill and Other Intangible Assets
Acquired intangible assets subject to amortization consisted of the following:
| |
|
April 3, 2010 | March 28, 2009 | ||||||||||||||||||
|---|---|---|---|---|---|---|---|---|---|---|---|---|---|---|---|---|---|---|---|---|---|
| |
Amortization Period |
Gross Amount |
Accumulated Amortization |
Net | Gross Amount |
Accumulated Amortization |
Net | ||||||||||||||
Customer relationships |
6 years | 4,200 | 2,975 | $ | 1,225 | $ | 4,200 | $ | 2,275 | $ | 1,925 | ||||||||||
Technology |
3 - 5 years | 8,000 | 6,885 | 1,115 | 8,000 | 5,042 | 2,958 | ||||||||||||||
Order backlog |
1.25 years | — | — | — | 15,800 | 15,800 | — | ||||||||||||||
Trade names |
6 years | 2,400 | 1,700 | 700 | 2,400 | 1,300 | 1,100 | ||||||||||||||
Supplier relationships |
5 years | 1,100 | 935 | 165 | 1,100 | 715 | 385 | ||||||||||||||
Non-compete agreements |
2.5 years | — | — | — | 300 | 300 | — | ||||||||||||||
|
$ | 15,700 | $ | 12,495 | $ | 3,205 | $ | 31,800 | $ | 25,432 | $ | 6,368 | |||||||||
Amortization expense for intangible assets was $3,164, $3,105, and $3,018 for the fiscal years ended April 3, 2010, March 28, 2009, and March 31, 2008 respectively. Estimated future amortization expense by fiscal year is as follows: $2,380 in 2011 and $825 in 2012. As of April 3, 2010, the weighted average remaining life of intangible assets was approximately 1.3 years. During the fiscal year ended April 3, 2010, the Company removed from its financial statements $16,100 of fully amortized intangible assets.
During the fiscal year ended March 28, 2009 the Company completed tax studies that resulted in the recognition of additional tax benefits, of which $590 related to periods prior to January 1, 2006, the
87
GT Solar International, Inc. and Subsidiaries
Notes to Consolidated Financial Statements (Continued)
April 3, 2010
(In thousands, except per share data)
3. Goodwill and Other Intangible Assets (Continued)
date of the Acquisition, Therefore, such amount was allocated as a reduction to goodwill. There were no changes in the carrying value of goodwill during fiscal 2010.
4. Customer Concentrations
The following customers comprised 10% or more of the Company's total net revenues or total accounts receivable:
| |
Fiscal Year Ended April 3, 2010 |
Fiscal Year Ended March 28, 2009 |
Fiscal Year Ended March 31, 2008 |
April 3, 2010 Accounts Receivable |
March 28, 2009 Accounts Receivable |
|||||||||||||||||||||||||
|---|---|---|---|---|---|---|---|---|---|---|---|---|---|---|---|---|---|---|---|---|---|---|---|---|---|---|---|---|---|---|
| |
Revenue | % of Total |
Revenue | % of Total |
Revenue | % of Total |
Amount | % of Total |
Amount | % of Total |
||||||||||||||||||||
Polysilicon Customers |
||||||||||||||||||||||||||||||
Customer #1 |
$185,249 | 34 | % | $ | 108,781 | 20 | % | $152,271 | 62 | % | $ | 12,127 | 23 | % | $ | 17,885 | 31 | % | ||||||||||||
Customer #2 |
* | * | % | 92,544 | 17 | % | * | * | % | * | * | % | $ | 10,802 | 19 | % | ||||||||||||||
Photovoltaic Customers |
||||||||||||||||||||||||||||||
Customer #3 |
* | * | % | 74,533 | 14 | % | * | * | % | * | * | % | $ | 5,852 | 10 | % | ||||||||||||||
Customer #4 |
* | * | % | 57,896 | 11 | % | * | * | % | * | * | % | $ | 5,876 | 10 | % | ||||||||||||||
Customer #5 |
* | * | % | * | * | % | * | * | % | $ | 8,391 | 16 | % | * | * | % | ||||||||||||||
Customer #6 |
* | * | % | * | * | % | * | * | % | $ | 7,570 | 14 | % | * | * | % | ||||||||||||||
- *
- amounts from these customers were either zero or less than 10% of the total during this period.
To reduce risk, the Company requires that certain customers either post letters of credit or make advance payments prior to delivery. Approximately $41,583 (or 79%) and $24,669 (or 43%) of total accounts receivable as of April 3, 2010 and March 28, 2009 respectively was secured by letters of credit.
5. Inventories
Inventories consist of the following:
| |
April 3, 2010 | March 28, 2009 | |||||
|---|---|---|---|---|---|---|---|
Raw materials |
$ | 42,846 | $ | 73,347 | |||
Work-in-process |
12,260 | 2,978 | |||||
Finished goods |
13,752 | 27,151 | |||||
|
$ | 68,858 | $ | 103,476 | |||
Inventory related excess and obsolescence charges of $6,899, $2,585 and $380 were recorded in cost of revenue in fiscal years ended April 3, 2010, March 28, 2009, and March 31, 2008 respectively.
88
GT Solar International, Inc. and Subsidiaries
Notes to Consolidated Financial Statements (Continued)
April 3, 2010
(In thousands, except per share data)
6. Property, Plant and Equipment
Property, plant and equipment consist of the following:
| |
Estimated Useful Life | April 3, 2010 | March 28, 2009 | ||||||
|---|---|---|---|---|---|---|---|---|---|
Leasehold improvements |
Lesser of useful life or initial lease term | $ | 2,922 | $ | 1,677 | ||||
Land |
— | 1,074 | 1,074 | ||||||
Land improvements |
15 years | 326 | 326 | ||||||
Building |
40 years | 9,470 | 9,388 | ||||||
Manufacturing equipment |
5 to 7 years | 4,119 | 2,937 | ||||||
Computer equipment and software |
3 to 5 years | 7,191 | 6,114 | ||||||
Furniture and fixtures |
5 to 7 years | 1,427 | 975 | ||||||
|
26,529 | 22,491 | |||||||
Less accumulated depreciation |
(7,170 | ) | (3,635 | ) | |||||
|
$ | 19,359 | $ | 18,856 | |||||
Software costs incurred as part of an enterprise resource systems project of $747 and $2,001 were capitalized during the fiscal years ended April 3, 2010 and March 28, 2009, respectively. Depreciation expense for the fiscal years ended April 3, 2010, March 28, 2009 and March 31, 2008, was approximately $3,706, $2,006, and $1,034 respectively.
7. Valuation and Qualifying Accounts
Warranty
The following table presents warranty activities:
| |
Fiscal Year Ended April 3, 2010 |
Fiscal Year Ended March 28, 2009 |
Fiscal Year Ended March 31, 2008 |
|||||||
|---|---|---|---|---|---|---|---|---|---|---|
Product warranty liability, beginning of year |
$ | 2,231 | $ | 1,957 | $ | 977 | ||||
Accruals for new warranties issued |
1,067 | 2,270 | 1,876 | |||||||
Payments under warranty |
(2,018 | ) | (1,996 | ) | (896 | ) | ||||
Product warranty liability, end of year |
$ | 1,280 | $ | 2,231 | $ | 1,957 | ||||
89
GT Solar International, Inc. and Subsidiaries
Notes to Consolidated Financial Statements (Continued)
April 3, 2010
(In thousands, except per share data)
7. Valuation and Qualifying Accounts (Continued)
Allowance for Doubtful Accounts
The following table presents allowance for doubtful account activities:
| |
Fiscal Year Ended April 3, 2010 |
Fiscal Year Ended March 28, 2009 |
Fiscal Year Ended March 31, 2008 |
|||||||
|---|---|---|---|---|---|---|---|---|---|---|
Allowance for doubtful accounts, beginning of year |
$ | 401 | $ | 31 | $ | 30 | ||||
Charges to expense |
93 | 457 | 66 | |||||||
Reclassification from deferred revenue |
2,554 | — | — | |||||||
Write offs |
(428 | ) | (87 | ) | (65 | ) | ||||
Allowance for doubtful accounts, end of year |
$ | 2,620 | $ | 401 | $ | 31 | ||||
8. Debt
Senior Credit Facility
On July 29, 2008, the Company entered into a senior credit agreement with Bank of America, N.A., as sole administrative and collateral agent, and a syndicate of financial institutions. The senior credit agreement provides for a three-year revolving senior credit facility in an aggregate principal amount of up to $90,000, which is available for the borrowing of revolving loans and the issuance of standby letters of credit (the "senior credit facility"); provided that the aggregate principal amount of revolving loans shall not exceed $50,000 at any time. The senior credit facility includes a sub-limit of $25,000 for swingline loans. The senior credit facility will mature on July 29, 2011.
The aggregate amount of borrowings and outstanding standby letters of credit under the senior credit facility may not exceed a borrowing base equal to Adjusted EBITDA multiplied by 3.0 plus unrestricted cash on hand. The senior credit facility is guaranteed by all of the Company's existing and future direct and indirect domestic subsidiaries. Obligations under the senior credit facility are secured by a first-priority lien on substantially all of the Company's tangible and intangible assets and by a pledge of the capital stock of all domestic subsidiaries and 65% of the capital stock of foreign subsidiaries owned directly by the Company or one of its domestic subsidiaries.
The senior credit facility may be increased by an aggregate amount of up to $100,000, with additional commitments from the lenders under the senior credit facility or from new financial institutions, if no default or event of default exists. The Company may exercise its option to increase the commitments not more than three times, and each increase will be in a minimum aggregate principal amount of $10,000 and integral multiples of $5,000 in excess thereof. As of April 3, 2010 and March 28, 2009, the Company had $33,094 and $13,132, respectively of outstanding standby letters of credit and no borrowings against this facility, resulting in $56,906 of available credit under the senior credit agreement as of April 3, 2010.
Borrowings under the senior credit facility bear interest at a floating rate equal to, at the Company's option, LIBOR plus 2.25% per annum or a base rate plus 1.25% per annum. The base rate is defined as the higher of the Bank of America prime rate and the federal funds rate plus 0.50%. The Company pays a commitment fee to the lenders equal to 0.50% per annum on the actual daily unused
90
GT Solar International, Inc. and Subsidiaries
Notes to Consolidated Financial Statements (Continued)
April 3, 2010
(In thousands, except per share data)
8. Debt (Continued)
portions of the senior credit facility and letter of credit fees equal to 2.25% per annum on the maximum amount available to be drawn under each standby letter of credit. As of April 3, 2010, the LIBOR rate, base rate and federal funds rate were 0.29%, 3.25% and 0.25%, respectively.
The senior credit agreement that governs the senior credit facility contains financial covenants that require the Company to meet certain financial tests, including a maximum consolidated net leverage ratio and a minimum consolidated fixed charge coverage ratio, calculated on a consolidated basis for each consecutive four fiscal quarter period. The senior credit agreement also contains covenants, which, among other things, limit the Company's ability to: incur indebtedness; make investments; engage in mergers and other fundamental changes; sell or otherwise dispose of property or assets; pay dividends and other restricted payments or enter into transactions with affiliates; enter into burdensome agreements; use proceeds to purchase or carry margin stock or extend credit to others; make subordinated debt payments; make certain changes to the terms of material indebtedness; and other covenants customary for such a facility. The Company was in compliance with all of these covenants as of April 3, 2010.
Cash-Collateralized Letter of Credit Facility
On July 29, 2008, the Company entered into a letter of credit agreement with Bank of America, N.A., as sole administrative and collateral agent, and a syndicate of financial institutions. The letter of credit agreement provides for a three-year cash-collateralized letter of credit facility in an aggregate principal amount of up to $150,000, which is available for the issuance of cash-collateralized standby letters of credit (the "letter of credit facility"). The letter of credit facility may be increased by an aggregate amount of up to $50,000, with additional commitments from the lenders under the letter of credit facility or from new financial institutions, if no default or event of default exists under the letter of credit facility. The Company may exercise its option to increase the commitments not more than three times, and each increase will be in a minimum aggregate principal amount of $10,000 and integral multiples of $5,000 in excess thereof. The Company pays letter of credit fees equal to 0.25% per annum on the maximum amount available to be drawn under each standby letter of credit.
The letter of credit facility is secured by an amount of cash equal to the amount drawn under the outstanding standby letters of credit, which amount is pledged and delivered by the Company to the administrative agent for the benefit of all lenders. The letter of credit agreement that governs the facility contains customary covenants, which among other things limit the Company's ability to incur liens on the cash collateral; engage in mergers or other fundamental changes; sell or otherwise dispose of the registrant's or its subsidiaries' assets; use proceeds to purchase or carry margin stock or extend credit to others; and other covenants customary for such a facility. The Company was in compliance with all of these covenants as of April 3, 2010. As of April 3, 2010, the Company has no outstanding letters of credit under the cash collateralized letter of credit facility.
91
GT Solar International, Inc. and Subsidiaries
Notes to Consolidated Financial Statements (Continued)
April 3, 2010
(In thousands, except per share data)
8. Debt (Continued)
Senior Secured Note Payable Agreements
As part of the acquisition of GT Solar Incorporated and Subsidiary (formerly GT Equipment Technologies, Inc.) (see Note 1), the Company entered into a Senior Secured promissory note payable with certain shareholders of GT Solar Holdings, LLC in the amount of $15,000. The terms of this note provided for monthly payments of interest at the LIBOR rate plus 3.25%, and for full payment of the principal amount upon the maturity date of April 30, 2006. On April 1, 2006, this note was repaid and replaced with a new $15,000 Senior Secured Exchangeable Note Payable, which was to mature on September 15, 2008, with certain shareholders of GT Solar Holdings, LLC. This note bore interest at 14%, with quarterly cash interest payments at 8%, and the remainder added to the outstanding principal balance. Additionally the outstanding principal was exchangeable for certain shares of GT Solar Holdings, LLC. On April 23, 2007, the Company repaid the Senior Secured Exchangeable Note using available operating cash.
Lines of Credit
On April 23, 2007, the Company entered into a revolving credit facility that provided for aggregate borrowing of up to $40,000 subject to covenant compliance, sublimits and allowances and, as of that date, the Company had approximately $38,300 of outstanding letters of credit and no outstanding borrowings. The Company increased this credit facility by $20,000 and $10,000 in June and August 2007, respectively. Subsequent to March 31, 2007, the Company had received a waiver for violation of its covenant related to timely delivery of audited financial statements, and had violated certain other technical defaults which were cured by the termination of the facility on September 24, 2007. The Company elected to terminate this credit facility and from September 24, 2007 to July 29, 2008, the Company collateralized its letters of credit outstanding with restricted cash. At March 31, 2008, $164,028 of cash was held in escrow, $162,587 as collateral on outstanding standby letters of credit related to customer deposits, and $1,437 as security for interest and other bank fees. On September 24, 2007, all cash held in escrow was released in connection with the termination of this credit facility.
9. Employee Benefit Plan
The Company has a 401(k) employee savings plan for its eligible employees. Eligible employees may elect to contribute a percentage of their salaries up to the annual Internal Revenue Code maximum limitations. The Plan allows the Company to make discretionary matching contributions for its participating employees. For the fiscal years ended April 3, 2010, March 28, 2009 and March 31, 2008 the Company made discretionary contributions of $711, $588, and $186 respectively.
92
GT Solar International, Inc. and Subsidiaries
Notes to Consolidated Financial Statements (Continued)
April 3, 2010
(In thousands, except per share data)
10. Income Taxes
Significant components of the provision for (benefit from) income taxes are as follows:
| |
Fiscal Year Ended April 3, 2010 |
Fiscal Year Ended March 28, 2009 |
Fiscal Year Ended March 31, 2008 |
|||||||||
|---|---|---|---|---|---|---|---|---|---|---|---|---|
Current: |
||||||||||||
Federal |
$ | 74,571 | $ | 21,914 | $ | 30,426 | ||||||
State |
17,038 | 6,485 | 8,455 | |||||||||
Foreign |
201 | 842 | 226 | |||||||||
Total current |
91,810 | 29,241 | 39,107 | |||||||||
Deferred: |
||||||||||||
Federal |
(31,066 | ) | 20,222 | (18,527 | ) | |||||||
State |
(7,683 | ) | 4,744 | (6,089 | ) | |||||||
Foreign |
(443 | ) | 5 | (27 | ) | |||||||
Total deferred |
(39,192 | ) | 24,971 | (24,643 | ) | |||||||
Total provision |
$ | 52,618 | $ | 54,212 | $ | 14,464 | ||||||
Income before provision for income taxes is as follows:
| |
Fiscal Year Ended April 3, 2010 |
Fiscal Year Ended March 28, 2009 |
Fiscal Year Ended March 31, 2008 |
||||||||
|---|---|---|---|---|---|---|---|---|---|---|---|
Domestic |
$ | 139,553 | $ | 137,764 | $ | 49,330 | |||||
Foreign |
321 | 4,416 | 1,239 | ||||||||
Total |
$ | 139,874 | $ | 142,180 | $ | 50,569 | |||||
The U.S. federal income tax rate is reconciled to the Company's effective tax rate as follows:
| |
Fiscal Year Ended April 3, 2010 |
Fiscal Year Ended March 28, 2009 |
Fiscal Year Ended March 31, 2008 |
|||||||
|---|---|---|---|---|---|---|---|---|---|---|
Tax at federal statutory rate |
$ | 48,956 | $ | 49,763 | $ | 17,699 | ||||
State income tax, net of U.S. federal benefit |
6,081 | 7,299 | 1,538 | |||||||
Valuation allowances |
— | — | (2,863 | ) | ||||||
Tax exempt municipal interest |
— | (678 | ) | (665 | ) | |||||
IRC Section 199 deduction |
(1,345 | ) | (1,191 | ) | (1,940 | ) | ||||
Foreign income taxes at rates different than domestic rates |
(318 | ) | (683 | ) | (248 | ) | ||||
Non-deductible stock offering costs |
209 | 936 | 576 | |||||||
Non-deductible stock compensation |
32 | 210 | 520 | |||||||
Research credits |
(805 | ) | (1,562 | ) | — | |||||
Other |
(192 | ) | 118 | (153 | ) | |||||
|
$ | 52,618 | $ | 54,212 | $ | 14,464 | ||||
93
GT Solar International, Inc. and Subsidiaries
Notes to Consolidated Financial Statements (Continued)
April 3, 2010
(In thousands, except per share data)
10. Income Taxes (Continued)
Significant components of the Company's deferred tax assets and liabilities are as follows:
| |
April 3, 2010 | March 28, 2009 | ||||||
|---|---|---|---|---|---|---|---|---|
Deferred tax assets: |
||||||||
Deferred profit |
$ | 38,980 | $ | 7,327 | ||||
Reserves not currently deductible |
6,064 | 4,166 | ||||||
Equity compensation |
3,437 | 2,364 | ||||||
Allowance for doubtful accounts |
1,054 | 162 | ||||||
Total deferred tax assets |
49,535 | 14,019 | ||||||
Deferred tax liabilities: |
||||||||
Fixed assets |
1,890 | 2,394 | ||||||
Intangibles |
366 | 1,753 | ||||||
Other |
72 | 21 | ||||||
|
2,328 | 4,168 | ||||||
Net deferred tax assets |
$ | 47,207 | $ | 9,851 | ||||
Reported as: |
||||||||
Deferred income taxes—current |
$ | 72,868 | $ | 25,498 | ||||
Deferred income taxes—long-term |
(25,661 | ) | (15,647 | ) | ||||
|
$ | 47,207 | $ | 9,851 | ||||
Changes in deferred tax valuation allowances are as follows:
| |
Fiscal Year Ended April 3, 2010 |
Fiscal Year Ended March 28, 2009 |
Fiscal Year Ended March 31, 2008 |
|||||||
|---|---|---|---|---|---|---|---|---|---|---|
Balance at beginning of period |
$ | — | $ | — | $ | 4,042 | ||||
Decrease in valuation allowance |
— | — | (4,042 | ) | ||||||
Balance at end of period |
$ | — | $ | — | $ | — | ||||
The Company does not provide for U.S. income taxes applicable to undistributed earnings of its foreign subsidiaries since these earnings are indefinitely reinvested.
As of April 3, 2010 and March 28, 2009, the Company had $49,535 and $14,019 respectively, of total deferred tax assets relating to deferred profits and other temporary differences that are available to reduce income taxes in future years. The company records a valuation allowance when it believes that it is "more likely than not" that all or a portion of deferred tax assets will not be realized. Management has reviewed all available positive and negative evidence bearing upon the realization of its deferred tax assets and has concluded that a valuation allowance was not needed as of April 3, 2010 and March 28, 2009.
As of April 3, 2010, the Company had $579 of unrecognized tax benefits, all of which, if recognized, would affect the effective tax. The Company recognizes interest and penalties, if any,
94
GT Solar International, Inc. and Subsidiaries
Notes to Consolidated Financial Statements (Continued)
April 3, 2010
(In thousands, except per share data)
10. Income Taxes (Continued)
related to unrecognized tax benefits as a component of tax expense. A reconciliation of the beginning and ending amount of the consolidated liability for unrecognized income tax benefits during the fiscal years ended April 3, 2010 and March 28, 2009 are as follows:
| |
Fiscal Year Ended | ||||||
|---|---|---|---|---|---|---|---|
| |
April 3, 2010 | March 28, 2009 | |||||
Balance at beginning of period |
$ | 442 | $ | — | |||
Additions for tax positions of prior years |
— | 300 | |||||
Additions for tax positions related to current year |
137 | 142 | |||||
Balance at end of period |
$ | 579 | $ | 442 | |||
The Company files income tax returns in the US federal jurisdiction and various state jurisdictions. With few exceptions, the Company is no longer subject to US federal income tax examinations by the Internal Revenue Service or state and local income tax examinations for years before the fiscal year ended March 31, 2007.
11. Comprehensive (Loss) Income
Comprehensive income is defined as the change in equity during a period from non-owner sources. The Company's comprehensive income for each period presented is comprised of (i) the Company's net income; (ii) foreign currency translation adjustment of the Company's wholly-owned foreign subsidiaries whose assets and liabilities are translated from their respective functional currencies at exchange rates in effect at the balance sheet date, and revenues and expenses are translated at average exchange rates prevailing during the applicable period (iii) changes in unrealized gains or losses, net of tax, on available for sale securities and (iv) changes in unrealized gains or losses, net of tax, for derivatives designated as cash flow hedges. Comprehensive income is presented in the Consolidated Statements of Changes in Stockholders' Equity.
The components of the Company's accumulated other comprehensive income as of April 3, 2010 and March 28, 2009, net of taxes were as follows:
| |
April 3, 2010 | March 28, 2009 | |||||
|---|---|---|---|---|---|---|---|
Cash flow hedges of foreign exchange, net of tax |
$ | (5,264 | ) | $ | (8,503 | ) | |
Unrealized gain on available for sale securities, net of tax |
3 | — | |||||
Foreign currency translation adjustment |
116 | 114 | |||||
Total accumulated other comprehensive (loss) income |
$ | (5,145 | ) | $ | (8,389 | ) | |
95
GT Solar International, Inc. and Subsidiaries
Notes to Consolidated Financial Statements (Continued)
April 3, 2010
(In thousands, except per share data)
12. Commitments and Contingencies
Lease commitments
The Company has entered into operating leases for office and warehouse facilities in the United States, China and Taiwan. The terms of these leases range from 12 months to 5 years. Rent expense for the fiscal years ended April 3, 2010, March 28, 2009 and March 31, 2008, was $2,075, $1,500, and $671 respectively. Minimum annual payments under these agreements are as follows:
Fiscal Year
|
Minimum Annual Payments |
|||
|---|---|---|---|---|
2011 |
$ | 945 | ||
2012 |
800 | |||
2013 |
479 | |||
2014 |
120 | |||
Purchase Commitments
The Company's commitments to purchase raw materials from various suppliers are estimated to be $219,139 as of April 3, 2010. Some of these purchase commitments are due within a few months and others continue throughout the remainder of the fiscal year ended April 2, 2011.
During the year ended April 3, 2010, the Company agreed to a customer requested delay under an ongoing polysilicon contract. The customer reimbursed the Company $20.5 million for the costs incurred to terminate certain impacted vendor commitments. The reimbursement and related costs have been recorded as both deferred revenue and deferred cost of goods sold under the arrangement.
During the fiscal year ended March 28, 2009, the Company rescheduled and/or cancelled a portion of its commitments to its vendors to procure materials to reflect a reduced rate of production and requests by some of its customers to delay shipment. In the year ended March 28, 2009 the Company recognized losses of $11,250 resulting from expected forfeitures of vendor advances and reserves against advances on inventory purchases for vendors that have become financially distressed. These charges have been included in cost of revenue.
Contingencies
Beginning on August 1, 2008, seven putative securities class action lawsuits were commenced in the United States District Court for the District of New Hampshire (the "Court"), against the Company, certain of its officers and directors, certain underwriters of its July 24, 2008 initial public offering and others, including certain investors. On October 3, 2008, the Court entered an order consolidating these actions under the caption Braun et al. v. GT Solar International, Inc., et al (the "federal class action"). The Court selected the lead plaintiff and lead plaintiff's counsel in the federal class action on October 29, 2008. The lead plaintiff filed an amended consolidated complaint on December 22, 2008. The lead plaintiff asserts claims under various sections of the Securities Act. The amended consolidated complaint alleges, among other things, that the defendants made false and materially misleading statements and failed to disclose material information in certain SEC filings, including the registration
96
GT Solar International, Inc. and Subsidiaries
Notes to Consolidated Financial Statements (Continued)
April 3, 2010
(In thousands, except per share data)
12. Commitments and Contingencies (Continued)
statement and Prospectus for the Company's July 24, 2008 initial public offering, and other public statements, regarding the status of the Company's business relationship with LDK Solar, Ltd. Among other relief, the amended consolidated complaint seeks class certification, unspecified compensatory damages, rescission, interest, attorneys' fees, costs and such other relief as the Court should deem just and proper.
The defendants moved to dismiss the amended consolidated complaint on February 5, 2009. On September 22, 2009, the Court denied the defendants' motion. Following the Court's denial of the motion, the parties submitted a proposed joint case management order, which the Court approved on November 16, 2009. The case management order provides for discovery to close on May 25, 2011.
In addition, on September 18, 2008 a putative securities class action was filed in New Hampshire state court in the Superior Court for Hillsborough County, Southern District (the "State Court"), under the caption Hamel v. GT Solar International, Inc., et al., against the Company, certain of the Company's officers and directors and certain underwriters of its July 24, 2008 initial public offering (the "state class action"). The state class action plaintiff asserts claims under various sections of the Securities Act of 1933, as amended. The state class action complaint alleges, among other things, that the defendants made false and materially misleading statements and failed to disclose material information in certain SEC filings, including the registration statement for the Company's July 24, 2008 initial public offering, and other public statements, regarding the status of the Company's business relationship with LDK Solar. Among other relief, the state class action complaint seeks class certification, unspecified compensatory damages, rescission, interest, attorneys' fees, costs and such other relief as the State Court should deem just and proper.
The Company removed the state class action to the United States District Court for the District of New Hampshire on October 22, 2008. The state class action was consolidated with the federal class action on November 25, 2008. On February 2, 2009, the federal Court granted the plaintiff's motion to remand the state class action to New Hampshire State Court. On May 4, 2009, the parties agreed to a stay of the state class action, pending resolution of the motion to dismiss in the consolidated federal case. At a case structuring conference on June 3, 2009, the state court endorsed the proposed joint case management order filed by the parties which requires coordination of any discovery to be taken in the state class action with that taken in the federal class action. With the denial of the motion to dismiss the federal action, the parties submitted a proposed joint case management order to the State Court on November 6, 2009. On January 12, 2010, the State Court granted a joint motion of the parties to transfer the state class action to the State Court's Business and Commercial Dispute Docket.
A derivative suit, captioned Fan v. GT Solar Int'l, Inc., et al., was filed in New Hampshire State Court on January 14, 2009 (the "derivative action"). The derivative complaint is asserted nominally on behalf of the Company against certain of its directors and officers and alleges various claims for breach of fiduciary duty, unjust enrichment, abuse of control, and gross mismanagement. The derivative complaint is premised on the same allegations asserted in the federal class action. On April 10, 2009, the State Court granted the Company's motion to stay the derivative action, pending resolution of the motion to dismiss in the federal action. In accordance with the terms of the stay the parties have conferred regarding a case management schedule for the derivative action. The derivative action remains stayed.
97
GT Solar International, Inc. and Subsidiaries
Notes to Consolidated Financial Statements (Continued)
April 3, 2010
(In thousands, except per share data)
12. Commitments and Contingencies (Continued)
The Company intends to defend these actions vigorously. There can be no assurance, however, that the Company will be successful, and an adverse resolution of any of the lawsuits could have a material adverse effect on the Company's consolidated financial position and results of operations. The Company is not presently able to reasonably estimate potential losses, if any, related to the lawsuits.
The Company is subject to various other routine legal proceedings and claims incidental to its business, which management believes will not have a material adverse effect on the Company's financial position, results of operations or cash flows.
Customer Indemnifications
In the normal course of business, the Company indemnifies, under pre-determined conditions and limitations, its customers for infringement of third-party intellectual property rights by the Company's products or services. The Company seeks to limit its liability for such indemnity to an amount not to exceed the sales price of the products or services subject to its indemnification obligations. The Company does not believe, based on information available, that it is probable that any material amounts will be paid under these guarantees.
13. Stockholders' Equity
Common Stock
We have authorized 500,000 shares of common stock, $0.01 par value, of which 143,815 shares were issued and outstanding at April 3, 2010. Each share of common stock has the right to one vote. The financial statements give retroactive effect to a July 23, 2008 increase in the number of authorized shares of common stock from 10,000 to 500,000 and a 17-for-one stock split of the Company's common stock in connection with the Company's initial public offering. On June 30, 2008, the Company declared a cash dividend of $90,000 to the stockholders of record as of June 30, 2008 that was subsequently paid on August 1, 2008.
Preferred Stock
The Company has authorized 10,000 shares of undesignated preferred stock, $0.01 par value, none of which was issued and outstanding at April 3, 2010. The Company's board of directors is authorized to determine the rights, preferences and restrictions on any series of preferred stock to be issued.
14. Share-Based Compensation
The Company has established equity compensation plans that provide share-based compensation to eligible employees, directors, officers, as well as independent contractors performing services for the Company. The terms of awards made under the Company's equity compensation plans are generally determined by the Compensation Committee. On January 1, 2006, the Company adopted the 2006 Stock Option Plan (the "2006 Plan"). Under the 2006 Plan, options were granted to persons who were, at the time of grant, employees, officers or directors of, or consultants or advisors to, the Company. All of the options granted under the 2006 Plan were awarded prior to the Company's IPO and therefore
98
GT Solar International, Inc. and Subsidiaries
Notes to Consolidated Financial Statements (Continued)
April 3, 2010
(In thousands, except per share data)
14. Share-Based Compensation (Continued)
the option price at the date of grant was determined based upon contemporaneous valuations. The Company does not intend to issue any further stock options under the 2006 Stock Option Plan. On June 30, 2008, in connection with the Company's initial public offering, the Company adopted the 2008 Equity Incentive Plan (the "2008 Plan"). The 2008 Plan reserves up to 15,000 shares of common stock for grants of stock options restricted stock, restricted stock units and other share-based awards. The principal awards outstanding under these equity plans consist of grants of restricted stock units and stock options. As of April 3, 2010, an aggregate of 10,021 shares were authorized for future grant under our 2008 Plan.
The stock options issued under the plans were issued with an exercise price equal to 100% of the market price of the Company's common stock on the date of grant and typically vest 25% on the first anniversary of the award of the remaining vesting 1/48th per month during the subsequent three years and expire ten years after grant. None of our stock options were granted outside of either the 2006 Plan or the 2008 Plan.
The Company began issuing restricted stock units in the fiscal year ended March 28, 2009 and all have been granted under the 2008 Plan except for 29 units (of which 20 units are outstanding as of April 3, 2010) which were issued to certain directors outside of the 2008 Plan. Shares of common stock are issued to the holders of restricted units on the date the restricted stock units vest. The value of restricted stock awards at the date of grant is an intrinsic value derived by calculating the difference between the share price and the purchase price at the date of grant. The majority of shares issued are net of the statutory withholding requirements, which the Company pays on behalf of our participants. As a result, the actual number of shares issued will be less than the number of restricted stock units granted. Prior to vesting, restricted stock units do not have dividend equivalents rights and do not have voting rights, and the shares underlying the restricted stock units are not considered issued and outstanding. Restricted stock units awarded typically vest 25% on each anniversary of the award over a 4 year period and expire ten years after grant.
The following table presents stock-based compensation expenses and related income tax benefits included in the Company's consolidated statement of operations:
| |
April 3, 2010 | March 29, 2009 | March 31, 2008 | |||||||
|---|---|---|---|---|---|---|---|---|---|---|
General administrative expenses |
$ | 3,637 | $ | 3,455 | $ | 1,856 | ||||
Selling and administrative expenses |
412 | 154 | 417 | |||||||
Research and development expenses |
722 | 633 | 335 | |||||||
Cost of sales |
911 | 564 | 231 | |||||||
Stock-based compensation expense |
$ | 5,682 | $ | 4,806 | $ | 2,839 | ||||
Income tax benefit of stock-based compensation expense |
$ | 1,972 | $ | 1,513 | $ | 564 | ||||
As of April 3, 2010, the Company had unamortized share-based compensation expense related to stock options and restricted stock awards of $6,957 and $8,232, respectively, after estimated forfeitures, which will be recognized over an estimated weighted-average remaining requisite service period of
99
GT Solar International, Inc. and Subsidiaries
Notes to Consolidated Financial Statements (Continued)
April 3, 2010
(In thousands, except per share data)
14. Share-Based Compensation (Continued)
2.8 years and 3.0 years, respectively. Share-based compensation cost capitalized as part of inventory was not significant and therefore, not separately disclosed for all periods presented.
Equity Incentive Plan Activity
The following table summarizes stock options and the restricted stock units for the fiscal year ended April 3, 2010:
| |
Stock Options | Restricted Stock Units | ||||||||||||
|---|---|---|---|---|---|---|---|---|---|---|---|---|---|---|
| |
Options | Weighted Average Exercise Price |
Restricted Stock Units |
Weighted Average Grant Date Fair Value |
||||||||||
| |
(Shares in thousands) |
|||||||||||||
Outstanding at March 28, 2009 |
5,196 | $ | 3.98 | 1,934 | $ | 4.10 | ||||||||
Granted |
2,571 | $ | 5.06 | 1,576 | $ | 5.19 | ||||||||
Exercised/Vested |
(511 | ) | $ | 2.09 | (430 | ) | $ | 5.67 | ||||||
Cancelled/Forfeited |
(877 | ) | $ | 5.27 | (700 | ) | $ | 5.47 | ||||||
Outstanding at April 3, 2010 |
6,379 | $ | 4.39 | 2,380 | $ | 4.15 | ||||||||
| |
April 3, 2010 | March 28, 2009 | March 31, 2008 | |||||||
|---|---|---|---|---|---|---|---|---|---|---|
Total intrinsic value of stock options exercised |
$ | 2,014 | $ | 4,306 | $ | — | ||||
Total fair value of restricted stock units vested |
2,466 | 89 | — | |||||||
The estimated weighted-average grant date fair values of restricted stock awards granted during fiscal years ended April 3, 2010, March 28, 2009 and March 31, 2008 were $5.19, $4.08 and $5.64, respectively. Cash received and income tax benefits from stock option exercises were $1,066 and $218, respectively, for fiscal years ended April 3, 2010, and $1,177 and $658 for fiscal year ended March 28, 2009.
Stock Options
The following table summarizes information related to stock options as of April 3, 2010:
| |
Stock Options Outstanding | Stock Options Exercisable |
||||||||||||||
|---|---|---|---|---|---|---|---|---|---|---|---|---|---|---|---|---|
Exercise Price
|
Number | Weighted-Average Remaining Life (in years) |
Intrinsic Value |
Number | Intrinsic Value |
|||||||||||
$1.66 |
1,688 | 6.2 | $ | 5,994 | 1,520 | $ | 5,396 | |||||||||
$4.81 |
1,214 | 9.3 | 486 | — | — | |||||||||||
$5.25 - $5.64 |
3,477 | 8.3 | — | 1,333 | — | |||||||||||
|
6,379 | 7.9 | $ | 6,480 | 2,853 | $ | 5,396 | |||||||||
100
GT Solar International, Inc. and Subsidiaries
Notes to Consolidated Financial Statements (Continued)
April 3, 2010
(In thousands, except per share data)
14. Share-Based Compensation (Continued)
The aggregate intrinsic value in the table above represents the total pre-tax intrinsic value, based on the Company's closing common stock price of $5.21 on April 3, 2010, which would have been received by the option holders had all option holders exercised their options and immediately sold their shares on that date.
No stock options were granted during the fiscal year ended March 28, 2009.The weighted-average estimated fair value per share of stock options granted during the fiscal years ended April 3, 2010 and March 31, 2008, was determined to be $2.61 and $2.86, respectively, using the Black-Scholes option-pricing model with the following underlying assumptions:
| |
Fiscal Year Ended | ||||||
|---|---|---|---|---|---|---|---|
| |
April 3, 2010 | March 31, 2008 | |||||
Weighted average expected volatility |
51 | % | 48 | % | |||
Weighted average risk-free interest rate |
2.8 | % | 3.7 | % | |||
Expected dividend yield |
0.0 | % | 0.0 | % | |||
Weighted average expected life (in years) |
6.1 | 6.1 | |||||
The Company estimates the expected volatility of its future stock price on that of similar publicly-traded companies, and expects to continue to estimate its expected stock price volatility in this manner until such time as there is adequate historical data to refer to from its own traded share prices. The weighted-average risk free interest rate reflects the rates of U.S. government securities appropriate for the term of the Company's stock options at the time of grant.
The Company estimated the expected life, which represents the best estimate of the period of time from the grant date that the stock option will remain outstanding, using the simplified method (the mid-point between the time to vest and the contractual terms). The Company applies the simplified method because of insufficient historical exercise data to provide a reasonable basis upon which to estimate expected life due to the limited period of time the equity shares have been publicly traded. For options granted to non-employees the remaining contractual term is used for measurement purposes.
Restricted Stock
On January 2, 2008, the Company granted 85 shares of restricted stock that at the time of the award had an estimated value of $479 (grant date fair value of $5.64 per share). The restricted stock vested as follows: fiscal year ended March 28, 2009—25 shares (vest date fair value of $89); fiscal year ended April 3, 2010—4 shares (vest date fair value of $28). The remaining 56 unvested shares were forfeited during the fiscal year ended April 3, 2010.
15. Earnings Per Share
Basic earnings per share is computed based on only the weighted average number of common shares outstanding during the period. Diluted earnings per share is computed using the weighted average number of common shares and, when dilutive, the weighted average number of potential common shares outstanding during the period, as determined using the treasury stock method.
101
GT Solar International, Inc. and Subsidiaries
Notes to Consolidated Financial Statements (Continued)
April 3, 2010
(In thousands, except per share data)
15. Earnings Per Share (Continued)
Potential common shares consist of non-vested restricted common stock and common stock issuable upon the exercise of outstanding stock options and the vesting of restricted stock units.
The following table sets forth the computation of the weighted average shares used in computing basic and diluted earnings per share:
| |
Fiscal Year Ended April 3, 2010 |
Fiscal Year Ended March 28, 2009 |
Fiscal Year Ended March 31, 2008 |
|||||||
|---|---|---|---|---|---|---|---|---|---|---|
Weighted average common shares—basic |
143,409 | 142,582 | 142,290 | |||||||
Dilutive common stock options and awards |
1,981 | 1,889 | 1,769 | |||||||
Weighted average common and common equivalent shares—diluted |
145,390 | 144,471 | 144,059 | |||||||
Potential common stock equivalents excluded from the calculation of dilutive earnings per share because the effect would have been anti-dilutive are as follows:
| |
April 3, 2010 | March 28, 2009 | March 31, 2008 | |||||||
|---|---|---|---|---|---|---|---|---|---|---|
Outstanding stock options |
3,182 | 3,832 | — | |||||||
Restricted stock units |
80 | 191 | — | |||||||
16. Segment and Geographical Information
Segment Information
The Company reports its results in two segments: PV business and polysilicon business.
The PV business manufactures and sells DSS units, ancillary equipment required in the operation of the DSS unit as well as related services all essential to the production of PV wafers, cells and modules.
The polysilicon business manufactures and sells CVD reactors and related equipment used to react gases at high temperatures to produce polysilicon, the key raw material used in solar cells.
The Company evaluates performance and allocates resources based on revenues and operating income (loss). Operating income (loss) for each segment includes selling, general and administrative expenses directly attributable to the segment including the amortization of acquired intangible assets. Corporate Services include non-allocable overhead costs, including human resources, legal, finance, general and administrative and corporate marketing expenses. Corporate Services assets include deferred tax assets, cash and cash equivalents and other non-allocated assets.
102
GT Solar International, Inc. and Subsidiaries
Notes to Consolidated Financial Statements (Continued)
April 3, 2010
(In thousands, except per share data)
16. Segment and Geographical Information (Continued)
Financial information for the Company's business segments is as follows (in thousands):
| |
Photovoltaic Business |
Polysilicon Business |
Corporate Services |
Total | ||||||||||
|---|---|---|---|---|---|---|---|---|---|---|---|---|---|---|
Fiscal year ended April 3, 2010 |
||||||||||||||
Revenue |
$ | 186,726 | $ | 357,519 | $ | — | $ | 544,245 | ||||||
Gross profit |
62,771 | 156,211 | — | 218,982 | ||||||||||
Depreciation and amortization |
3,091 | 1,629 | 2,150 | 6,870 | ||||||||||
Income (loss) from operations |
36,569 | 141,046 | (33,653 | ) | 143,962 | |||||||||
Fiscal year ended March 28, 2009 |
||||||||||||||
Revenue |
$ | 443,947 | $ | 97,080 | $ | — | $ | 541,027 | ||||||
Gross profit |
178,134 | 36,535 | — | 214,669 | ||||||||||
Depreciation and amortization |
3,068 | 564 | 1,479 | 5,111 | ||||||||||
Income (loss) from operations |
155,085 | 16,418 | (27,959 | ) | 143,544 | |||||||||
Fiscal year ended March 31, 2008 |
||||||||||||||
Revenue |
$ | 244,052 | $ | — | $ | — | $ | 244,052 | ||||||
Gross profit |
94,021 | (1,678 | ) | — | 92,343 | |||||||||
Depreciation and amortization |
3,272 | 236 | 544 | 4,052 | ||||||||||
Income (loss) from operations |
79,900 | (12,034 | ) | (20,945 | ) | 46,921 | ||||||||
Assets |
||||||||||||||
April 3, 2010 |
$ | 198,451 | $ | 195,134 | $ | 338,496 | $ | 732,081 | ||||||
March 28, 2009 |
$ | 240,904 | $ | 310,768 | $ | 185,751 | $ | 737,423 | ||||||
Geographic Information
The following table presents net revenue by geographic region, which is based on the destination of the shipments:
| |
Fiscal Year Ended | ||||||||||
|---|---|---|---|---|---|---|---|---|---|---|---|
| |
April 3, 2010 | March 28, 2009 | March 31, 2008 | ||||||||
Geographic Region |
|||||||||||
China |
$ | 340,478 | $ | 333,688 | $ | 211,230 | |||||
Korea |
68,961 | 109,498 | — | ||||||||
Other Asia |
30,008 | 28,340 | 24,975 | ||||||||
Europe |
95,855 | 53,881 | 3,606 | ||||||||
United States |
8,926 | 8,156 | 3,480 | ||||||||
Other |
17 | 7,464 | 761 | ||||||||
Total |
$ | 544,245 | $ | 541,027 | $ | 244,052 | |||||
103
GT Solar International, Inc. and Subsidiaries
Notes to Consolidated Financial Statements (Continued)
April 3, 2010
(In thousands, except per share data)
16. Segment and Geographical Information (Continued)
A summary of long-lived assets, consisting of net property and equipment, intangible assets and goodwill, by geographical region is as follows:
| |
April 3, 2010 | March 28, 2009 | March 31, 2008 | ||||||||
|---|---|---|---|---|---|---|---|---|---|---|---|
United States |
$ | 64,020 | $ | 67,752 | $ | 62,561 | |||||
China |
1,019 | 72 | 86 | ||||||||
Taiwan |
125 | — | — | ||||||||
Total |
$ | 65,164 | $ | 67,824 | $ | 62,647 | |||||
17. Other Expense
The components of other income (expense), net are as follows:
| |
Fiscal Year Ended April 3, 2010 |
Fiscal Year Ended March 28, 2009 |
Fiscal Year Ended March 31, 2008 |
|||||||
|---|---|---|---|---|---|---|---|---|---|---|
Offering costs |
$ | (790 | ) | $ | (2,648 | ) | $ | (1,647 | ) | |
Foreign currency gain (loss) |
(357 | ) | (251 | ) | 476 | |||||
Loss on derivatives-ineffective portion (see Note 19) |
(2,054 | ) | (3,039 | ) | — | |||||
Other |
76 | (74 | ) | (73 | ) | |||||
Total other expense, net |
$ | (3,125 | ) | $ | (6,012 | ) | $ | (1,244 | ) | |
Shares of the Company's common stock held by GT Solar Holdings, LLC, are subject to certain registration rights. In July 2008, the Company completed an initial public offering of 30,300,000 shares of common stock held by GT Solar Holdings, LLC. In March 2010, the Company completed a secondary public offering of 28,750,000 shares of common stock held by GT Solar Holdings, LLC. As of April 3, 2010, GT Solar Holdings, LLC owned or controlled approximately 53% of the Company's common stock.
During the fiscal years ended April 3, 2010, March 28, 2009 and March 31, 2008, the Company incurred costs related to public offerings of its common stock. As the Company did not receive proceeds from these offerings, these costs are expensed in the periods incurred.
18. Fair Value of Financial Investment
The Company's financial instruments are recorded at amounts that reflect the Company's estimate of their fair values. The Company discloses the level of subjectivity used in measuring assets and liabilities at fair value under a hierarchal framework as follows:
- •
- Level 1—Inputs are unadjusted, quoted prices in active markets for identical assets or liabilities at
the measurement date.
- •
- Level 2—Inputs are other than quoted prices included within Level 1 that are observable for the asset or liability, either directly or indirectly.
104
GT Solar International, Inc. and Subsidiaries
Notes to Consolidated Financial Statements (Continued)
April 3, 2010
(In thousands, except per share data)
18. Fair Value of Financial Investment (Continued)
- •
- Level 3—Inputs are unobservable for the asset or liability and are developed based on the best information available in the circumstances, which might include the Company's own data.
The following table provides the assets and liabilities carried at fair value measured on a recurring basis at April 3, 2010.
| |
|
Fair Value Measurements Using | |||||||||||
|---|---|---|---|---|---|---|---|---|---|---|---|---|---|
| |
Total Carrying Value |
||||||||||||
| |
(Level 1) | (Level 2) | (Level 3) | ||||||||||
Money market mutual funds |
$ | 226,052 | $ | 226,052 | — | — | |||||||
Short-term investments (commercial paper) |
19,967 | — | $ | 19,967 | — | ||||||||
Forward foreign exchange contracts—liabilities |
(229 | ) | — | (229 | ) | — | |||||||
The Company's money market mutual funds are valued using readily available market prices.
The Company's short-term investments consist of commercial paper, and are valued using quoted prices for securities with similar characteristics and other observable inputs (such as interest rates that are observable at commonly quoted intervals).
The Company's counterparties to foreign exchange forward contracts are major international financial institutions. These foreign exchange forward contracts are measured at fair value using a valuation which represents a good faith estimate of the mid-market value of the position, based on estimated or actual bids and offers for the positions. The company considers the effect of the counterparties' credit standings in these fair value measurements.
The Company has elected not to apply the guidance related to fair value measurement to non-financial assets and liabilities. Short-term investments as of April 3, 2010 were as follows:
Description
|
Maturity | Cost | Gross Unrealized Gains |
Gross Unrealized Losses |
Fair Value | |||||||||||
|---|---|---|---|---|---|---|---|---|---|---|---|---|---|---|---|---|
Short-term investments: |
||||||||||||||||
Commercial paper |
6 - 9 months | $ | 19,962 | $ | 6 | $ | (1 | ) | $ | 19,967 | ||||||
19. Derivative and Hedging Activities
The Company enters into forward foreign exchange contracts that qualify as cash flow hedges to hedge portions of anticipated foreign currency denominated inventory purchases. These contracts typically expire within 12 months. As of April 3, 2010 the Company had Euro denominated forward foreign exchange contracts with notional amounts of €19,862 that all expire within the next twelve months.
105
GT Solar International, Inc. and Subsidiaries
Notes to Consolidated Financial Statements (Continued)
April 3, 2010
(In thousands, except per share data)
19. Derivative and Hedging Activities (Continued)
The following table summarizes activity in accumulated other comprehensive income (loss) related to derivatives classified as cash flow hedges held by the Company during the fiscal years ended April 3, 2010, March 28, 2009 and March 31, 2008:
| |
Fiscal Year Ended April 3, 2010 |
Fiscal Year Ended March 28, 2009 |
Fiscal Year Ended March 31, 2008 |
|||||||
|---|---|---|---|---|---|---|---|---|---|---|
Balance at beginning of period |
$ | (8,503 | ) | $ | 5,557 | $ | (18 | ) | ||
Net gain (loss) on changes in fair value of derivatives, net of tax effect of ($1,189), $8,517, and ($3,798), respectively |
3,239 | (14,060 | ) | 5,575 | ||||||
Balance at end of period |
$ | (5,264 | ) | $ | (8,503 | ) | $ | 5,557 | ||
During the fiscal years ended April 3, 2010 and March 28, 2009, the Company recognized gains of $236 and $1,112 respectively, against cost of revenue with respect to cash flow hedges where the underlying hedged transaction had affected earnings. During the fiscal year ended March 31, 2008 the Company did not recognize any gains or losses to earnings with respect to its derivative cash flow hedges as the underlying hedged transactions had not yet affected earnings. Approximately $1,966 of accumulated loss is expected to be reclassified into earnings over the next twelve months.
During the fiscal years ended April 3, 2010 and March 28, 2009, a loss of $2,054 and $3,039 respectively was recognized on certain forward foreign exchange contracts that no longer qualified as a cash flow hedge.
During the year ended April 3, 2010, the Company determined that certain forward foreign exchange contracts to purchase 26 million Euro that were scheduled to mature by the end of the fiscal year no longer qualified as an effective hedge due to changes in delivery schedules requested by a customer. At the time the determination was made, the Company entered into forward foreign exchange contracts to sell 26 million Euro scheduled to mature at the same time as the original purchase contracts to offset any further financial exposure for these contracts.
The following table sets forth the balance sheet location and fair value of the Company's forward foreign exchange contracts at April 3, 2010 and March 28, 2009:
| |
Balance Sheet Location | April 3, 2010 Fair Value |
March 28, 2009 Fair Value |
|||||||
|---|---|---|---|---|---|---|---|---|---|---|
Effective Cash Flow Hedges |
||||||||||
Forward foreign exchange contracts—assets |
Prepaid expenses and other current assets | — | $ | 853 | ||||||
Forward foreign exchange contracts—liabilities |
Accrued expenses | $ | (229 | ) | $ | (4,447 | ) | |||
Other Derivatives |
||||||||||
Forward foreign exchange contracts—liabilities |
Accrued expenses | $ | — | $ | (227 | ) | ||||
106
GT Solar International, Inc. and Subsidiaries
Notes to Consolidated Financial Statements (Continued)
April 3, 2010
(In thousands, except per share data)
19. Derivative and Hedging Activities (Continued)
The following table sets forth the effect of the Company's foreign exchange forward contact designated as hedging instruments on the Statement of Operations for the fiscal years ended April 3, 2010 and March 28, 2009.
Fiscal Year Ended
|
Amount of (Gain) or Loss Recognized in OCI on Derivative (Effective Portion) |
Location of Gain or (Loss) Reclassified from AOCI into Income (Effective Portion) |
Amount of Gain or (Loss) Reclassified from AOCI into Income (Effective Portion) |
Location of Gain or (Loss) Recognized in Income on Derivative (Ineffective Portion) |
Amount of Gain or (Loss) Recognized in Income on Derivative (Ineffective Portion) |
|||||||||
|---|---|---|---|---|---|---|---|---|---|---|---|---|---|---|
April 3, 2010 |
$ | (2,610 | ) | Cost of revenue | $ | 236 | Other net | $ | (2,054 | ) | ||||
March 28, 2009 |
$ | 24,504 | Cost of revenue | $ | 1,112 | Other, net | $ | (3,039 | ) | |||||
March 31, 2008 |
$ | (9,373 | ) | Cost of revenue | — | Other, net | — | |||||||
The interest component of forward foreign exchange contracts that no longer qualify as effective hedges has been expensed and is not significant.
20. Quarterly Financial Information (unaudited)
Unaudited financial results by quarter for the fiscal years ended April 3, 2010 and March 28, 2009 are summarized below. The Company's quarterly reporting includes 13 week periods, unless otherwise noted. The fiscal year ending April 3, 2010 has 53 weeks, with the extra week occurring in the fourth quarter.
| |
First Quarter |
Second Quarter |
Third Quarter |
Fourth Quarter |
Total | ||||||||||||
|---|---|---|---|---|---|---|---|---|---|---|---|---|---|---|---|---|---|
Year ended April 3, 2010 |
|||||||||||||||||
Net sales |
$ | 71,819 | $ | 104,193 | (1) | $ | 173,557 | (1) | $ | 194,676 | $ | 544,245 | |||||
Gross profit |
34,965 | 34,259 | 76,687 | 73,071 | 218,982 | ||||||||||||
Net income |
7,779 | 9,435 | 36,771 | 33,271 | 87,256 | ||||||||||||
Income per common share (basic) |
0.05 | 0.07 | 0.26 | 0.23 | 0.61 | ||||||||||||
Income per common share (diluted) |
0.05 | 0.06 | 0.25 | 0.23 | 0.60 | ||||||||||||
Year ended March 28, 2009 |
|||||||||||||||||
Net sales |
$ | 57,082 | $ | 140,192 | $ | 205,209 | (2) | $ | 138,544 | $ | 541,027 | ||||||
Gross profit |
24,297 | 61,371 | 89,541 | 39,460 | (3) | 214,669 | |||||||||||
Net income |
5,142 | 27,942 | 43,125 | 11,759 | 87,968 | ||||||||||||
Income per common share (basic) |
0.04 | 0.20 | 0.30 | 0.08 | 0.62 | ||||||||||||
Income per common share (diluted) |
0.03 | 0.19 | 0.30 | 0.08 | 0.61 | ||||||||||||
From time to time, operating results are significantly affected by unusual or infrequent transactions or events. The following significant and unusual items have affected the comparison of operating results during the periods presented:
- (1)
- During the year ended April 3, 2010, the Company recorded revenue from terminated contracts as follows: second quarter—$1,753; third quarter—$19,358.
107
GT Solar International, Inc. and Subsidiaries
Notes to Consolidated Financial Statements (Continued)
April 3, 2010
(In thousands, except per share data)
20. Quarterly Financial Information (unaudited) (Continued)
- (2)
- During
the third quarter in the year ended March 28, 2009, the Company recorded revenue of $95,785 related to its first polysilicon contract.
- (3)
- During
the fourth quarter in the year ended March 28, 2009, the Company rescheduled and/or cancelled a significant portion of its commitments to its
vendors to procure materials in the PV business as a result of the Company's reduced production plan for the fiscal year ending April 3, 2010 and recorded charges for expected forfeitures of
deposits and reserves against vendor advances totaling $11,250.
During the fourth quarter in the year ended March 28, 2009, gross margins were negatively impacted by the recognition of a turnkey contract with revenue of $19,060 that generated less than 5% gross profit.
During the fourth quarter in the year ended March 28, 2009, a PV customer with contracts totaling approximately $172,883 requested delays in the deliveries of their DSS units and ancillary equipment. Prior agreements to delay delivery of the ancillary equipment had resulted in the Company's inability to recognize revenue for products that had been previously shipped. The Company agreed to an arrangement with this customer that included a revised schedule for the delivery of the remaining DSS units and the cancellation of $1,443 of undelivered ancillary equipment. Upon execution of the amendments to these agreements, the only remaining undelivered elements were DSS units and installation services and there were no further undelivered elements for which the Company did not have objective and reliable evidence of fair value. Therefore, the Company recognized, in accordance with its revenue recognition policy, $56,676 of revenue that had been previously deferred related to amounts billed and collected for delivered DSS units and ancillary equipment.
Fluctuations in operating results between quarters may be caused by many factors, including the timing of when the Company recognizes revenue in accordance with its revenue recognition policies, period-to-period changes in the relative contribution of revenue by each line of business and operating segment and general economic conditions. Basic and diluted earnings per common share for each of the quarters presented above is based on the respective weighted average number of common dilutive potential common shares outstanding for each quarter and the sum of the quarters may not necessarily be equal to the full year basic and diluted earnings per common share amounts.
108
Report of Independent Registered Public Accounting Firm
To the Board of Directors and Stockholders of GT Solar International, Inc. and Subsidiaries
We have audited the accompanying consolidated balance sheets of GT Solar International, Inc. and subsidiaries as of April 3, 2010 and March 28, 2009, and the related consolidated statements of operations, changes in stockholders' equity, and cash flows for each of the three fiscal years in the period ended April 3, 2010. These financial statements are the responsibility of the Company's management. Our responsibility is to express an opinion on these financial statements based on our audits.
We conducted our audits in accordance with the standards of the Public Company Accounting Oversight Board (United States). Those standards require that we plan and perform the audit to obtain reasonable assurance about whether the financial statements are free of material misstatement. An audit includes examining, on a test basis, evidence supporting the amounts and disclosures in the financial statements. An audit also includes assessing the accounting principles used and significant estimates made by management, as well as evaluating the overall financial statement presentation. We believe that our audits provide a reasonable basis for our opinion.
In our opinion, the financial statements referred to above present fairly, in all material respects, the consolidated financial position of GT Solar International, Inc. and subsidiaries at April 3, 2010 and March 28, 2009, and the consolidated results of their operations and their cash flows for each of the three fiscal years in the period ended April 3, 2010, in conformity with U.S. generally accepted accounting principles.
We also have audited, in accordance with the standards of the Public Company Accounting Oversight Board (United States), GT Solar International, Inc. and subsidiaries' internal control over financial reporting as of April 3, 2010, based on criteria established in Internal Control-Integrated Framework issued by the Committee of Sponsoring Organizations of the Treadway Commission and our report dated June 4, 2010 expressed an unqualified opinion thereon.
| /s/ Ernst & Young LLP | ||
Boston, Massachusetts June 4, 2010 |
109
Item 9. Changes in and Disagreements with Accountants on Accounting and Financial Disclosure
None.
Item 9A. Controls and Procedures
The certifications of our principal executive officer and principal financial officer required in accordance with Rule 13a-14(a) under the Exchange Act and Section 302 of the Sarbanes-Oxley Act of 2002 are attached as exhibits to this Annual Report on Form 10-K. The disclosures set forth in this Item 9A contain information concerning the evaluation of our disclosure controls and procedures, and changes in internal control over financial reporting, referred to in paragraph 4 of the certifications. Those certifications should be read in conjunction with this Item 9A for a more complete understanding of the matters covered by the certifications.
Disclosure Controls and Procedures
Evaluation of Disclosure Controls and Procedures. Our management, with the participation of our Chief Executive Officer and Chief Financial Officer, evaluated the effectiveness of our disclosure controls and procedures (as defined in Rules 13a-15(e) and 15d-15(e) under the Securities Exchange Act of 1934, as amended (the "Exchange Act")) as of April 3, 2010.
Disclosure controls and procedures are designed to ensure that information required to be disclosed by the Company in the reports it files or submits under the Exchange Act is recorded, processed, summarized and reported on a timely basis and that such information is accumulated and communicated to management, including the Chief Executive Officer and Chief Financial Officer, as appropriate, to allow timely decisions regarding required disclosure. Based on this evaluation, our Chief Executive Officer and Chief Financial Officer concluded that these disclosure controls and procedures are effective and designed to ensure that the information required to be disclosed in our reports filed or submitted under the Exchange Act is recorded, processed, summarized and reported within the requisite time periods.
Management's Report on Internal Control over Financial Reporting
Our management is responsible for establishing and maintaining adequate internal control over financial reporting as defined in Rules 13a-15(f) and 15d-15(f) under the Exchange Act. A company's internal control over financial reporting is a process designed by, or under the supervision of, the company's principal executive and principal financial officers, or persons performing similar functions, and effected by the company's board of directors, management, and other personnel to provide reasonable assurance regarding the reliability of financial reporting and the preparation of financial statements for external purposes in accordance with generally accepted accounting principles. A company's internal control over financial reporting includes those policies and procedures that:
- (1)
- pertain
to the maintenance of records that, in reasonable detail, accurately and fairly reflect the transactions and dispositions of the assets of the
company;
- (2)
- provide
reasonable assurance that transactions are recorded as necessary to permit preparation of financial statements in accordance with generally accepted
accounting principles, and that receipts and expenditures of the company are being made in accordance with authorizations of management and directors of the company; and
- (3)
- provide reasonable assurance regarding prevention or timely detection of unauthorized acquisition, use or disposition of the company's assets that could have a material effect on the financial statements.
110
Our management assessed the effectiveness of our internal control over financial reporting as of April 3, 2010. In making this assessment, our management used the criteria set forth by the Committee of Sponsoring Organizations of the Treadway Commission ("COSO") in Internal Control—Integrated Framework.
Based on this assessment, our management has concluded that, as of April 3, 2010, our internal control over financial reporting was effective at the reasonable assurance level described above.
Our registered public accounting firm has issued an attestation report on our internal control over financial reporting. This report appears below.
Changes in Internal Control over Financial Reporting
There was no change in our internal control over financial reporting (as defined in Rule 13a-15(f) identified in connection with the evaluation required by Rule 13a-15(d) of the Exchange Act that occurred during the fourth quarter of our fiscal year ended April 3, 2010 that has materially affected, or is reasonably likely to materially affect, our internal control over financial reporting.
Limitations on Effectiveness of Controls. Our management has concluded that our disclosure controls and procedures and internal controls provide reasonable assurance that the objectives of our control system are met. However, our management (including our Chief Executive Officer and Chief Financial Officer) does not expect that the disclosure controls and procedures or internal controls will prevent all error and/or fraud. A control system, no matter how well designed and operated, can provide only reasonable, not absolute, assurance that the objectives of the control system are met. Further, the design of a control system must reflect the fact that there are resource constraints, and the benefits of controls must be considered relative to their costs. Due to the inherent limitations in all control systems, no evaluation of controls can provide absolute assurance that all control issues, errors and instances of fraud, if any, within the company have been or will be detected. The inherent limitations include the realities that judgments in decision-making can be faulty and that breakdowns can occur because of simple errors or mistakes. Additionally, controls can be circumvented by the individual acts of some persons, by collusion of two or more people, or by management override of the control. The design of any system is also based in part upon certain assumptions about the likelihood of future events, and there can be no assurances that any design will succeed in achieving its stated goals under all potential future conditions. Because of its inherent limitations, internal control over financial reporting may not prevent or detect misstatements. Projections of any evaluation of effectiveness to future periods are subject to the risk that controls may become inadequate because of changes in conditions, or that the degree of compliance with the policies or procedures may deteriorate. Because of the inherent limitations in a cost-effective control system, misstatements due to error or fraud may occur and may not be detected.
111
Report of Independent Registered Public Accounting Firm
To the Board of Directors and Stockholders of GT Solar International, Inc. and Subsidiaries
We have audited GT Solar International, Inc. and subsidiaries' internal control over financial reporting as of April 3, 2010, based on criteria established in Internal Control—Integrated Framework issued by the Committee of Sponsoring Organizations of the Treadway Commission (the COSO criteria). GT Solar International, Inc. and subsidiaries' management is responsible for maintaining effective internal control over financial reporting, and for its assessment of the effectiveness of internal control over financial reporting included in the accompanying Management's Report on Internal Control over Financial Reporting. Our responsibility is to express an opinion on the Company's internal control over financial reporting based on our audit.
We conducted our audit in accordance with the standards of the Public Company Accounting Oversight Board (United States). Those standards require that we plan and perform the audit to obtain reasonable assurance about whether effective internal control over financial reporting was maintained in all material respects. Our audit included obtaining an understanding of internal control over financial reporting, assessing the risk that a material weakness exists, testing and evaluating the design and operating effectiveness of internal control based on the assessed risk, and performing such other procedures as we considered necessary in the circumstances. We believe that our audit provides a reasonable basis for our opinion.
A company's internal control over financial reporting is a process designed to provide reasonable assurance regarding the reliability of financial reporting and the preparation of financial statements for external purposes in accordance with generally accepted accounting principles. A company's internal control over financial reporting includes those policies and procedures that (1) pertain to the maintenance of records that, in reasonable detail, accurately and fairly reflect the transactions and dispositions of the assets of the company; (2) provide reasonable assurance that transactions are recorded as necessary to permit preparation of financial statements in accordance with generally accepted accounting principles, and that receipts and expenditures of the company are being made only in accordance with authorizations of management and directors of the company; and (3) provide reasonable assurance regarding prevention or timely detection of unauthorized acquisition, use, or disposition of the company's assets that could have a material effect on the financial statements.
Because of its inherent limitations, internal control over financial reporting may not prevent or detect misstatements. Also, projections of any evaluation of effectiveness to future periods are subject to the risk that controls may become inadequate because of changes in conditions or that the degree of compliance with the policies or procedures may deteriorate.
In our opinion, GT Solar International, Inc. and subsidiaries maintained, in all material respects, effective internal control over financial reporting as of April 3, 2010, based on the COSO criteria.
We have also audited, in accordance with the standards of the Public Company Accounting Oversight Board (United States), the consolidated balance sheets of GT Solar International, Inc. and subsidiaries as of April 3, 2010 and March 28, 2009, and the related consolidated statements of operations, changes in stockholders' equity, and cash flows for each of the three fiscal years in the period ended April 3, 2010 of GT Solar International, Inc. and subsidiaries and our report dated June 4, 2010 expressed an unqualified opinion thereon.
| /s/ Ernst & Young LLP |
Boston,
Massachusetts
June 4, 2010
112
None.
Item 10. Directors, Executive Officers and Corporate Governance
Information required by this item relating to our directors and nominees is contained in our definitive proxy statement for our 2010 Annual Meeting of Stockholders to be held August , 2010, which will be filed within 120 days of the end of our fiscal year ended April 3, 2010 (the "2010 Proxy Statement") under the caption "Proposal 1—Election of Directors—Certain Information Regarding Directors" and is incorporated herein by reference. Information required by this item relating to our executive officers is contained in our 2010 Proxy Statement under the caption "Executive Officers" and is incorporated herein by reference. Information required by this item relating to compliance with Section 16(a) of the Securities Exchange Act of 1934 is contained in our 2010 Proxy Statement under the caption "Other Information—Section 16(a) Beneficial Ownership Reporting Compliance" and is incorporated herein by reference. The remaining information called for by this item is contained in our 2010 Proxy Statement under the caption "Corporate Governance" and is incorporated herein by reference.
Item 11. Executive Compensation
Information required by this item is contained in our 2010 Proxy Statement under the captions "Executive Compensation," and "Corporate Governance—Committees of the Board of Directors" and "Corporate Governance"—Compensation Committee Interlocks and Inside Participation" and is incorporated herein by reference.
Item 12. Security Ownership of Certain Beneficial Owners and Management and Related Stockholder Matters
Equity Compensation Plans
The following table sets forth certain information, as of April 3, 2010, concerning securities authorized for issuance under all equity compensation plans of our Company:
Plan Category
|
Number of Securities to be Issued Upon Exercise of Outstanding Options and Rights(a) |
Weighted-Average Exercise Price of Outstanding Options and Rights(b)(3) |
Number of Securities Remaining Available for Future Issuance Under Equity Compensation Plans (Excluding Securities Reflected in Column(a))(c) |
||||||||
|---|---|---|---|---|---|---|---|---|---|---|---|
Equity compensation plans approved by our stockholders: |
|||||||||||
2008 Equity Incentive Plan(1) |
4,665,591 | $ | 5.10 | 10,021,185 | |||||||
Equity compensation plans not approved by our stockholders: |
|||||||||||
2006 Stock Option Plan(2) |
4,074,092 | $ | 3.99 | — | |||||||
Total |
8,739,683 | $ | 4.39 | 10,021,185 | |||||||
- (1)
- Includes
2,380,458 restricted stock units under our 2008 Equity Incentive Plan.
- (2)
- Includes options granted under the Second Amended and Restated GT Solar International, Inc. 2006 Stock Option Plan (the "2006 Plan"). In connection with the reorganization of our holding
113
company structure in September 2006, options to purchase GT Solar Incorporated's common stock were converted into options to purchase shares of our common stock. In July 2006, we granted options to executives, employees, directors and consultants under the 2006 Plan. Following the reorganization of our holding company structure in September 2006, these options were for an aggregate of 3,329,280 shares of our common stock. Of these option grants, options with respect to 2,913,120 shares vest as follows: one quarter of the options vested on the first anniversary of the grant date, and 1/48 of the options vest at the end of each month during the subsequent three years; and options with respect to 416,160 shares vest as follows: one third of the options vested on the first anniversary of the grant date, and 1/36 of the options vest at the end of each month during the subsequent two years. In December 2007 and January 2008, we granted options to purchase an aggregate of 3,609,627 shares of our common stock to executives, employees, directors and consultants. One quarter of the options vested on the first anniversary of the grant date, and 1/48 of the options vest at the end of each month during the subsequent three years. Any unexercised option under the 2006 Plan shall immediately expire upon the first to occur of: (i) the tenth anniversary of the grant date; or (ii) subject to the provisions of the relevant option agreement and except as otherwise determined by the compensation committee, termination of the option holder's service to us or one of our subsidiaries. See Note 14 to our consolidated financial statements in Item 8 in this Annual Report on Form 10-K for additional information on the 2006 Plan. In June 2008, our Board of Directors terminated the ability to grant future stock option awards under the 2006 Plan.
- (3)
- The weighted average exercise price does not take into account the shares issuable upon vesting of outstanding restricted stock units which have no exercise price.
Information required by this item relating to security ownership of certain beneficial owners and management is contained in our 2010 Proxy Statement under the caption "Beneficial Stock Ownership of Directors, Executive Officers and Persons Owning More Than Five Percent of Common Stock."
Item 13. Certain Relationships and Related Transactions, and Director Independence
Information required by this item relating to transactions with related persons is contained in our 2010 Proxy Statement under the caption "Related Party Transactions" and is incorporated herein by reference. Information required by this item relating to director independence is contained in our 2010 Proxy Statement under the caption "Corporate Governance—Board Composition" and is incorporated herein by reference.
Item 14. Principal Accountant Fees and Services
Information required by this item is contained in our 2010 Proxy Statement under the caption "Audit Committee Matters" and is incorporated herein by reference.
Item 15. Exhibits and Financial Statement Schedules
| (a)(1) | Financial Statements. See "Index to Financial Statements" under Item 8 on page 71 of this Form 10-K. | |
(a)(2) |
Financial Statement Schedules. Financial statement schedules have been omitted since they are either not required, not applicable or the information is otherwise included. |
|
(a)(3) |
Exhibits. The exhibit filed as part of this Annual Report on form 10-K are listed in the Exhibit Index immediately preceding such exhibits and are incorporated by reference or are filled with this report as indicated below (numbered in accordance with Item 601 of Regulation S-K). |
114
Pursuant to the requirements of Section 13 or 15(d) of the Securities Exchange Act of 1934, the Registrant has duly caused this Report to be signed on its behalf by the undersigned, thereunto duly authorized.
| GT SOLAR INTERNATIONAL, INC. | ||||
BY: |
/s/ THOMAS GUTIERREZ Thomas Gutierrez President and Chief Executive Officer |
|||
Date: June 4, 2010
Pursuant to the requirements of the Securities Exchange Act of 1934, this report has been signed below by the following persons on behalf of the Registrant and in the capacities and on the dates indicated.
Signatures
|
Title
|
Date
|
||
|---|---|---|---|---|
| /s/ THOMAS GUTIERREZ Thomas Gutierrez |
Director, President and Chief Executive Officer (Principal Executive Officer) | June 4, 2010 | ||
/s/ RICHARD J. GAYNOR Richard J. Gaynor |
Vice President and Chief Financial Officer (Principal Financial Officer) |
June 4, 2010 |
||
/s/ RICHARD E. JOHNSON Richard E. Johnson |
Vice President Finance and Chief Accounting Officer (Principal Accounting Officer) |
June 4, 2010 |
||
/s/ J. BRADFORD FORTH J. Bradford Forth |
Director |
June 4, 2010 |
||
/s/ FUSEN E. CHEN Fusen E. Chen |
Director |
June 4, 2010 |
||
/s/ J. MICHAL CONAWAY J. Michal Conaway |
Director |
June 4, 2010 |
||
/s/ ERNEST L. GODSHALK Ernest L. Godshalk |
Director |
June 4, 2010 |
115
Signatures
|
Title
|
Date
|
||
|---|---|---|---|---|
| /s/ MATTHEW E. MASSENGILL Matthew E. Massengill |
Director | June 4, 2010 | ||
/s/ R. CHAD VAN SWEDEN R. Chad Van Sweden |
Director |
June 4, 2010 |
||
/s/ NOEL G. WATSON Noel G. Watson |
Director |
June 4, 2010 |
116
| |
|
Incorporated by Reference | |
|||||||||
|---|---|---|---|---|---|---|---|---|---|---|---|---|
| Exhibit Number |
Description of Document | Form | Date Filed |
Exhibit # | Filed Herewith | |||||||
| 2.1 | Agreement and Plan of Merger, dated December 8, 2005, by and among GT Solar Incorporated (formerly known as GT Equipment Technologies, Inc.), GT Solar Holdings, LLC, Glow Merger Corporation, OCM/GFI Power Opportunities Fund II, L.P. and OCM/GFI Power Opportunities Fund II (Cayman), L.P., and the stockholders party thereto. | S-1/A | 6/6/08 | 2.1 | ||||||||
2.2 |
Agreement and Plan of Merger, dated as of September 28, 2006, by and among, GT Solar Incorporated, GT Solar International, Inc. and GT Solar Merger Corp |
S-1/A |
6/6/08 |
2.2 |
||||||||
3.1 |
Amended and Restated Certificate of Incorporation of the Registrant. |
10-Q |
8/27/08 |
3.1 |
||||||||
3.2 |
Amended and Restated By-laws of the Registrant. |
10-Q |
8/27/08 |
3.2 |
||||||||
4.1 |
Specimen Common Stock certificate. |
S-1/A |
7/18/08 |
4.1 |
||||||||
4.2 |
Amended and Restated GT Solar International, Inc. Employee Stockholders Agreement, dated as of July 1, 2008, by and among GT Solar International, Inc., GT Solar Holdings, LLC and each individual who executes a counterpart to the agreement as well as any other person who acquires shares of GT Solar International, Inc.'s common stock pursuant to the Second Amended and Restated GT Solar International, Inc. 2006 Stock Option Plan. |
S-1/A |
7/7/08 |
4.4 |
||||||||
10.1 |
* |
Employment Agreement, dated as of December 30, 2005, by and between GT Solar Incorporated and Thomas M. Zarrella. |
S-1 |
4/26/07 |
10.3 |
|||||||
10.2 |
* |
Employment Agreement, dated as of December 30, 2005, by and between GT Solar Incorporated and Howard T. Smith. |
S-1 |
4/26/07 |
10.4 |
|||||||
10.3 |
* |
Employment Agreement, dated as of April 12, 2006, and as amended on January 16, 2007, by and between GT Solar Incorporated and David W. Keck. |
S-1 |
4/26/07 |
10.6 |
|||||||
10.4 |
* |
Employment Agreement, dated as of June 1, 2006, by and between GT Solar Incorporated and Jeffrey J. Ford. |
S-1 |
4/26/07 |
10.7 |
|||||||
10.5 |
* |
Employment Agreement, dated as of December 30, 2005, by and between GT Solar Incorporated and Dr. Kedar P. Gupta. |
S-1 |
4/26/07 |
10.8 |
|||||||
117
| |
|
Incorporated by Reference | |
|||||||||
|---|---|---|---|---|---|---|---|---|---|---|---|---|
| Exhibit Number |
Description of Document | Form | Date Filed |
Exhibit # | Filed Herewith | |||||||
| 10.6 | Confidentiality and Non-Competition Agreement, dated as of December 30, 2005, by and between GT Solar Incorporated and Thomas M. Zarrella. | S-1 | 4/26/07 | 10.10 | ||||||||
10.7 |
Confidentiality and Non-Competition Agreement, dated as of December 30, 2005, by and between GT Solar Incorporated and Howard T. Smith. |
S-1 |
4/26/07 |
10.11 |
||||||||
10.8 |
Confidentiality and Non-Competition Agreement, dated as of December 30, 2005, by and between GT Solar Incorporated and Dr. Kedar P. Gupta. |
S-1 |
4/26/07 |
10.15 |
||||||||
10.9 |
* |
Retirement Agreement, dated as of November 21, 2006, by and between GT Solar Incorporated and Dr. Kedar P. Gupta. |
S-1 |
4/26/07 |
10.16 |
|||||||
10.10 |
* |
Second Amended and Restated GT Solar International, Inc. 2006 Stock Option Plan, dated December 30, 2005, and amended July 7, 2006 and January 15, 2008. |
S-1/A |
4/18/08 |
10.9 |
|||||||
10.11 |
Confidentiality and Non-Competition Agreement, dated as of April 17, 2006, by and between GT Solar Incorporated and David W. Keck. |
S-1/A |
4/18/08 |
10.13 |
||||||||
10.12 |
Confidentiality and Non-Competition Agreement, dated as of June 1, 2006, by and between GT Solar Incorporated and Jeffrey J. Ford. |
S-1/A |
4/18/08 |
10.14 |
||||||||
10.13 |
Form of Director Confidentiality Agreement. |
S-1/A |
7/18/08 |
10.17 |
||||||||
10.14 |
+ |
Engineering Agreement, dated as of March 14, 2006, by and between GT Solar Incorporated and Poly Engineering, S.r.l. |
S-1/A |
4/18/08 |
10.18 |
|||||||
10.15 |
* |
Amendment to Employment Agreement, dated January 16, 2007, by and between GT Solar Incorporated and David W. Keck. |
S-1/A |
4/18/08 |
10.19 |
|||||||
10.16 |
* |
Separation Agreement, dated as of October 5, 2007, by and between GT Solar Incorporated and Howard T. Smith. |
S-1/A |
4/18/08 |
10.20 |
|||||||
10.17 |
* |
Employment Agreement, dated as of January 2, 2008, by and between the Registrant and Robert W. Woodbury, Jr. |
S-1/A |
4/18/08 |
10.21 |
|||||||
10.18 |
* |
Employment Agreement, dated as of November 7, 2007, by and between the Registrant and Edwin L. Lewis. |
S-1/A |
4/18/08 |
10.22 |
|||||||
10.19 |
* |
Employment Agreement, dated as of August 6, 2007, by and between the Registrant and John (Rick) Tattersfield. |
S-1/A |
4/18/08 |
10.23 |
|||||||
118
| |
|
Incorporated by Reference | |
|||||||||
|---|---|---|---|---|---|---|---|---|---|---|---|---|
| Exhibit Number |
Description of Document | Form | Date Filed |
Exhibit # | Filed Herewith | |||||||
| 10.20 | * | GT Solar Incorporated Management Incentive Program for Fiscal Year 2008. | S-1/A | 4/18/08 | 10.24 | |||||||
10.21 |
* |
Form of Stock Option Agreement under the GT Solar International, Inc. 2006 Stock Option Plan, as amended. |
S-1/A |
4/18/08 |
10.25 |
|||||||
10.22 |
* |
Restricted Stock Agreement, dated as of March 17, 2008, by and between the Registrant and Robert W. Woodbury. |
S-1/A |
4/18/08 |
10.26 |
|||||||
10.23 |
* |
Letter Agreement, dated March 5, 2008 by and between the Registrant and John (Rick) Tattersfield. |
S-1/A |
4/18/08 |
10.27 |
|||||||
10.24 |
* |
Letter Agreement, dated August 8, 2006, by and between the Registrant and Ernest L. Godshalk. |
S-1/A |
6/6/08 |
10.28 |
|||||||
10.25 |
* |
Letter Agreement, dated April 4, 2007, by and between the Registrant and Ernest L. Godshalk. |
S-1/A |
6/6/08 |
10.29 |
|||||||
10.26 |
* |
Letter Agreement, dated May 9, 2008, by and between the Registrant and J. Michal Conaway. |
S-1/A |
6/6/08 |
10.30 |
|||||||
10.27 |
* |
Letter Agreement, dated May 9, 2008 by and between the Registrant and Fusen E. Chen. |
S-1/A |
6/6/08 |
10.31 |
|||||||
10.28 |
GT Solar Holdings, LLC Limited Liability Company Agreement, dated as of December 30, 2005. |
S-1/A |
6/6/08 |
10.33 |
||||||||
10.29 |
Letter Agreement, dated April 17, 2007, by and between GT Solar Incorporated and Howard T. Smith. |
S-1/A |
7/7/08 |
10.35 |
||||||||
10.30 |
* |
Form of July 2006 Stock Option Agreement under the GT Solar International, Inc. 2006 Stock Option Plan, as amended. |
S-1/A |
7/7/08 |
10.36 |
|||||||
10.31 |
Amended and Restated Registration Rights Agreement, dated as of July 1, 2008, among the Registrant and the persons on the signature page thereto. |
S-1/A |
7/7/08 |
10.40 |
||||||||
10.32 |
* |
Form of Director Restricted Stock Unit Agreement. |
S-1/A |
7/18/08 |
10.41 |
|||||||
10.33 |
* |
Form of Director Proprietary Rights and Confidentiality Agreement. |
S-1/A |
7/18/08 |
10.42 |
|||||||
10.34 |
Employee, Non-Competition, Non-Disclosure, Proprietary Information and Patent and Invention Assignment Agreement, dated as of January 7, 2008, by and between GT Solar Incorporated and Robert W. Woodbury, Jr. |
S-1/A |
7/18/08 |
10.43 |
||||||||
10.35 |
Credit Agreement, dated as of July 29, 2008, among the registrant, the subsidiary guarantors identified therein, Bank of America, N.A., and the other lenders party thereto. |
8-K |
7/31/08 |
10.1 |
||||||||
119
| |
|
Incorporated by Reference | |
|||||||||
|---|---|---|---|---|---|---|---|---|---|---|---|---|
| Exhibit Number |
Description of Document | Form | Date Filed |
Exhibit # | Filed Herewith | |||||||
| 10.36 | Letter of Credit Facility Agreement, dated as of July 29, 2008, among the registrant, Bank of America, N.A., and the other lenders party thereto. | 8-K | 7/31/08 | 10.2 | ||||||||
10.37 |
* |
Letter agreement, dated as of July 29, 2008, among the registrant, Thomas M. Zarrella, GT Solar Holdings, LLC and certain members of GT Solar Holdings, LLC. |
8-K |
7/31/08 |
10.3 |
|||||||
10.38 |
* |
Letter Agreement, dated September 11, 2008, by and between the Company and Matthew E. Massengill |
8-K |
9/18/08 |
10.1 |
|||||||
10.39 |
* |
Fiscal Year 2009 Executive Incentive Program |
8-K |
10/30/08 |
10.1 |
|||||||
10.40 |
* |
2008 Equity Incentive Plan. |
10-Q |
11/07/08 |
10.1 |
|||||||
10.41 |
* |
Fiscal Year 2009 Management Incentive Program |
10-Q |
11/07/08 |
10.6 |
|||||||
10.42 |
* |
Letter Agreement, dated November 10, 2008, by and between the Registrant and Noel G. Watson. |
8-K |
11/12/08 |
10.1 |
|||||||
10.43 |
Confidentiality Agreement, dated as of November 11, 2008, by and between the Registrant and Noel G. Watson |
8-K |
12/03/08 |
10.1 |
||||||||
10.44 |
* |
Restricted Stock Unit Agreement, dated as of September 12, 2008, by and between the Registrant and Matthew E. Massengill. |
10-Q |
2/06/09 |
10.4 |
|||||||
10.45 |
* |
Restricted Stock Unit Agreement, dated as of November 11, 2008, by and between the Registrant and Noel G. Watson. |
10-Q |
2/06/09 |
10.5 |
|||||||
10.46 |
* |
Form of Restricted Stock Unit Agreement for employees. |
10-Q |
2/06/09 |
10.6 |
|||||||
10.47 |
* |
Form of Restricted Stock Unit Agreement for executive officers. |
10-Q |
2/06/09 |
10.7 |
|||||||
10.48 |
* |
Employment Agreement, dated as of January 27, 2009, by and between the Registrant and Hoil Kim. |
10-Q |
2/06/09 |
10.8 |
|||||||
10.49 |
* |
Offer Letter, dated as of November 24, 2008, by and between the Registrant and Hoil Kim. |
10-Q |
2/06/09 |
10.9 |
|||||||
10.50 |
* |
Employment Agreement Amendment for Code Section 409A, by and between the Registrant and Robert W. Woodbury Jr. |
10-K |
6/09/09 |
10.50 |
|||||||
10.51 |
* |
Employment Agreement Amendment for Code Section 409A, by and between the Registrant and John (Rick) Tattersfield. |
10-K |
6/09/09 |
10.51 |
|||||||
10.52 |
* |
Employment Agreement Amendment for Code Section 409A, by and between the Registrant and David W. Keck. |
10-K |
6/09/09 |
10.52 |
|||||||
120
| |
|
Incorporated by Reference | |
|||||||||
|---|---|---|---|---|---|---|---|---|---|---|---|---|
| Exhibit Number |
Description of Document | Form | Date Filed |
Exhibit # | Filed Herewith | |||||||
| 10.53 | * | Employment Agreement Amendment for Code Section 409A, by and between the Registrant and Jeffrey J. Ford. | 10-K | 6/09/09 | 10.53 | |||||||
10.54 |
* |
Employment Agreement Amendment for Code Section 409A, by and between the Registrant and Thomas M. Zarrella. |
10-K |
6/09/09 |
10.54 |
|||||||
10.55 |
* |
Amendment to Employment Agreement, dated as of June 4, 2009, by and between the Registrant and David W. Keck. |
10-K |
6/09/09 |
10.55 |
|||||||
10.56 |
* |
Employment Agreement, dated as of January 19, 2009, by and between the Registrant and David Gray. |
10-K |
6/09/09 |
10.56 |
|||||||
10.57 |
* |
Fiscal Year 2010 Executive Incentive Program. |
8-K |
8/12/09 |
10.1 |
|||||||
10.58 |
* |
Section 162(m) Performance Incentive Plan. |
8-K |
8/12/09 |
10.2 |
|||||||
10.59 |
* |
Form of restricted stock unit agreement for G3W Ventures, LLC and Oaktree Capital Management, L.P. |
8-K |
8/12/09 |
10.3 |
|||||||
10.60 |
* |
Employment Agreement with Thomas Gutierrez dated October 28, 2009. |
8-K |
11/02/09 |
10.1 |
|||||||
10.61 |
* |
Restricted Stock Unit Agreement with Thomas Gutierrez dated October 29, 2009. |
8-K |
11/02/09 |
10.2 |
|||||||
10.62 |
* |
Stock Option Grant Agreement with Thomas Gutierrez dated October 29, 2009. |
8-K |
11/02/09 |
10.3 |
|||||||
10.63 |
* |
Form of restricted stock unit agreement for executive officers. |
10-Q |
11/10/09 |
10.4 |
|||||||
10.64 |
* |
Form of stock option agreement for executive officers. |
10-Q |
11/10/09 |
10.5 |
|||||||
10.65 |
* |
Form of restricted stock unit agreement for directors. |
10-Q |
11/10/09 |
10.6 |
|||||||
10.66 |
* |
Separation and General Release Agreement between the company and Thomas M. Zarrella dated November 13, 2009. |
8-K |
11/17/09 |
10.1 |
|||||||
10.67 |
* |
Employment Agreement, dated as of February 23, 2010, by and between the Company and Richard Gaynor. |
8-K |
3/01/10 |
10.1 |
|||||||
10.68 |
* |
Offer Letter, dated as of February 1, 2010, by and between the Registrant and Richard Gaynor. |
8-K |
3/01/10 |
10.2 |
|||||||
10.69 |
* |
Fiscal Year 2010 Management Incentive Program |
8-K |
12/11/09 |
10.1 |
|||||||
10.70 |
* |
Resignation letter of Richard K. Landers dated December 18, 2009 |
8-K |
12/21/09 |
10.1 |
|||||||
10.71 |
* |
Offer Letter, dated as of January 28, 2008, by and between the Registrant and Richard E. Johnson. |
X |
|||||||||
21.1 |
Subsidiaries of the Registrant. |
X |
||||||||||
121
| |
|
Incorporated by Reference | |
|||||||||
|---|---|---|---|---|---|---|---|---|---|---|---|---|
| Exhibit Number |
Description of Document | Form | Date Filed |
Exhibit # | Filed Herewith | |||||||
| 23.1 | Consent of Ernst & Young LLP. | X | ||||||||||
31.1 |
Certification pursuant to Section 302 of the Sarbanes-Oxley Act of 2002, Rule 13a-14(a)/15d- 14(a), by Chief Executive Officer. |
X |
||||||||||
31.2 |
Certification pursuant to Section 302 of the Sarbanes-Oxley Act of 2002, Rule 13a-14(a)/15d-14(a), by Chief Financial Officer. |
X |
||||||||||
32.1 |
Certification pursuant to 18 U.S.C. Section 1350, as adopted pursuant to Section 906 of the Sarbanes-Oxley Act of 2002, by Chief Executive Officer and Chief Financial Officer. |
X |
||||||||||
- +
- Certain
confidential portions have been omitted pursuant to a confidential treatment request filed separately with the Securities and Exchange Commission.
- *
- Indicates management contract or compensatory plan or arrangement.
122