Attached files
| file | filename |
|---|---|
| 8-K - ROSETTA RESOURCES INC 8-K 5-9-2012 - NBL Texas, LLC | form8k.htm |

REDEFINED
BUILDING VALUE IN UNCONVENTIONAL RESOURCES
Rosetta Resources Inc.
First Quarter 2012
Earnings Review
May 9, 2012
First Quarter 2012
Earnings Review
May 9, 2012
Exhibit 99.1

• Opening Comments Randy Limbacher
• Financial Update John Hagale
• Operations Update Jim Craddock
• Asset Development Update John Clayton
• Closing Remarks Randy Limbacher
2
Earnings Call Agenda

Continued high-grading of assets
• Pure Eagle Ford shale play with option in Southern Alberta Basin
• Inventory of 500 MMBOE with 13 years of drilling opportunities
• Less than 10% of Eagle Ford inventory drilled and producing
Successful execution of business strategy
• 31% production growth; doubled liquids volumes
• 11% sequential production growth in Eagle Ford
• Lowered overall cost structure; total unit LOE cut in half
• Developing areas outside Gates Ranch to capture higher liquids yields
• Firm transportation capacity for projected production for next two years
Continued testing of catalysts for growth
• Testing Gates Ranch reduced spacing
• Slated to evaluate majority of previously untested Eagle Ford acreage
• Completing seven-well horizontal drilling program in Southern Alberta Basin
Retain financial strength
• Sold legacy South Texas natural gas assets
• Nearly doubled borrowing base for more flexibility
3
Overview - Randy Limbacher

• Net income growth reflects increased production, higher
realized prices, more favorable commodity mix, lower unit
costs
realized prices, more favorable commodity mix, lower unit
costs
• Liquids sales generated 79 percent of revenues*
• Strong cash position; 28% debt-to-cap ratio
• Increased borrowing base from $325 to $625 million
• Well-positioned to move new production to market; access to
multiple providers
multiple providers
• New cost guidance reflects impact of divestitures and
expense fluctuations
expense fluctuations
4
Financial Update - John Hagale
*Including the effects of realized derivatives

|
|
|
2012 Full Year
|
||
|
|
|
(Guidance Range)
|
||
|
Direct Lease Operating Expense
|
|
$ 1.30
|
-
|
$ 1.45
|
|
Workover Expenses
|
|
|
-
|
|
|
Insurance
|
|
0.10
|
-
|
0.11
|
|
Ad Valorem Tax
|
|
0.75
|
-
|
0.85
|
|
Treating and Transportation
|
|
3.85
|
-
|
4.25
|
|
Production Taxes
|
|
1.50
|
-
|
1.65
|
|
DD&A
|
|
11.30
|
-
|
12.00
|
|
G&A, excluding Stock-Based Compensation
|
|
3.60
|
-
|
4.00
|
|
Interest Expense
|
|
1.55
|
-
|
1.70
|
5
Expense Guidance

• Spent $133 million in first quarter 2012 capex; drilled 15 gross
wells with 100% success rate and completed 12
wells with 100% success rate and completed 12
• Averaged quarterly production of 33,800 Boe/d; 52 percent liquids
• Operated four rigs, two in Gates Ranch and two in Karnes
Trough; added fifth at quarter-end for drilling at Briscoe Ranch
Trough; added fifth at quarter-end for drilling at Briscoe Ranch
• Ramping up activity in oil-rich Klotzman area; constructing oil
terminal to handle 10,000 - 12,000 Bbls/d with a targeted July
start-up date
terminal to handle 10,000 - 12,000 Bbls/d with a targeted July
start-up date
• Running 2 rigs in Southern Alberta Basin; three of four remaining
horizontal wells to test new completion method
horizontal wells to test new completion method
• Currently producing 34.2 Mboe/d; 55 percent liquids
• Updated 2012 production guidance: 35 - 38 Mboe/d
6
Operations Update - Jim Craddock
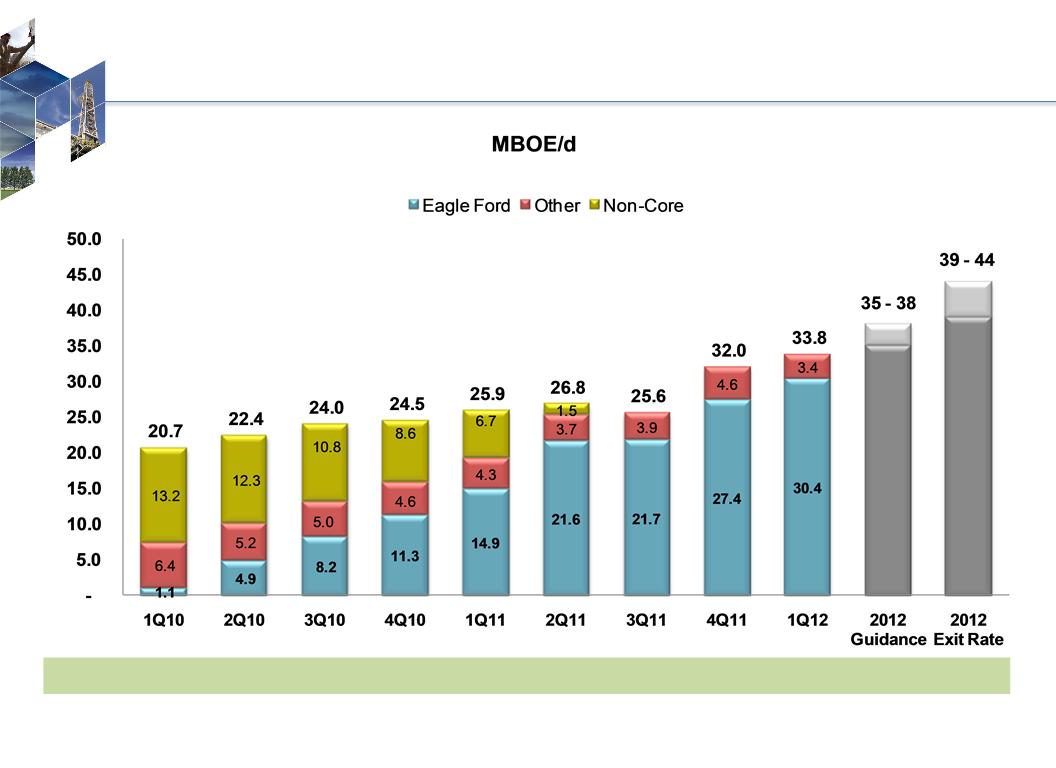
Quarterly Production Performance
% Liquids: 14 19 24 29 33 46 51 49 52 60 61
7

• Accelerating Eagle Ford shale development activity
• Operating two rigs in Gates Ranch, three others in Briscoe Ranch,
Central Dimmit County and Karnes Trough
Central Dimmit County and Karnes Trough
• Participated in 10 successful wells in non-operated Chupadera Ranch
• Scheduled to test Hanks area in LaSalle County in latter part of year
• Continue to evaluate Gates Ranch well-spacing; pilot well
spacing of 50 to 65 acres operating without interference
spacing of 50 to 65 acres operating without interference
• On track to report fourth well performance data from Southern
Alberta Basin program in second quarter
Alberta Basin program in second quarter
8
Asset Development Update - John Clayton
|
Area
|
Window
|
Net
Acreage |
|
Gates Ranch
|
Liquids
|
26,500
|
|
Non-Gates Ranch
|
Liquids
|
23,500
|
|
Encinal Area
|
Dry Gas
|
15,000
|
|
TOTAL
|
|
65,000
|
9
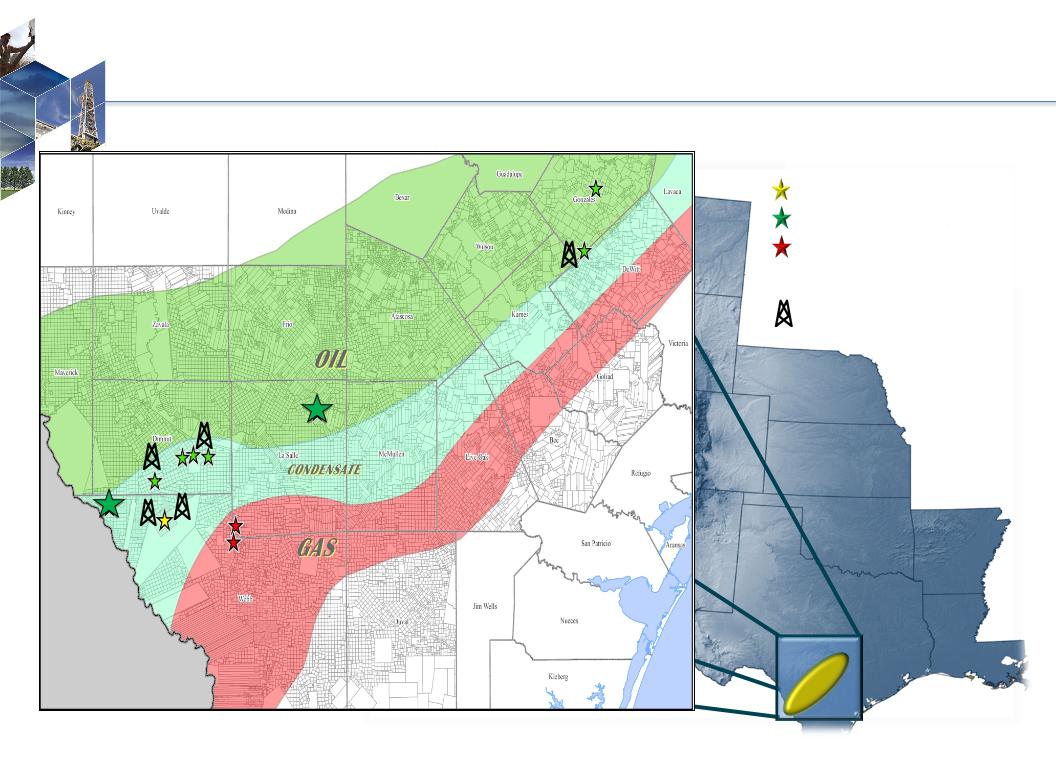
Eagle Ford Shale Activity Level
Current Drilling Activity Area
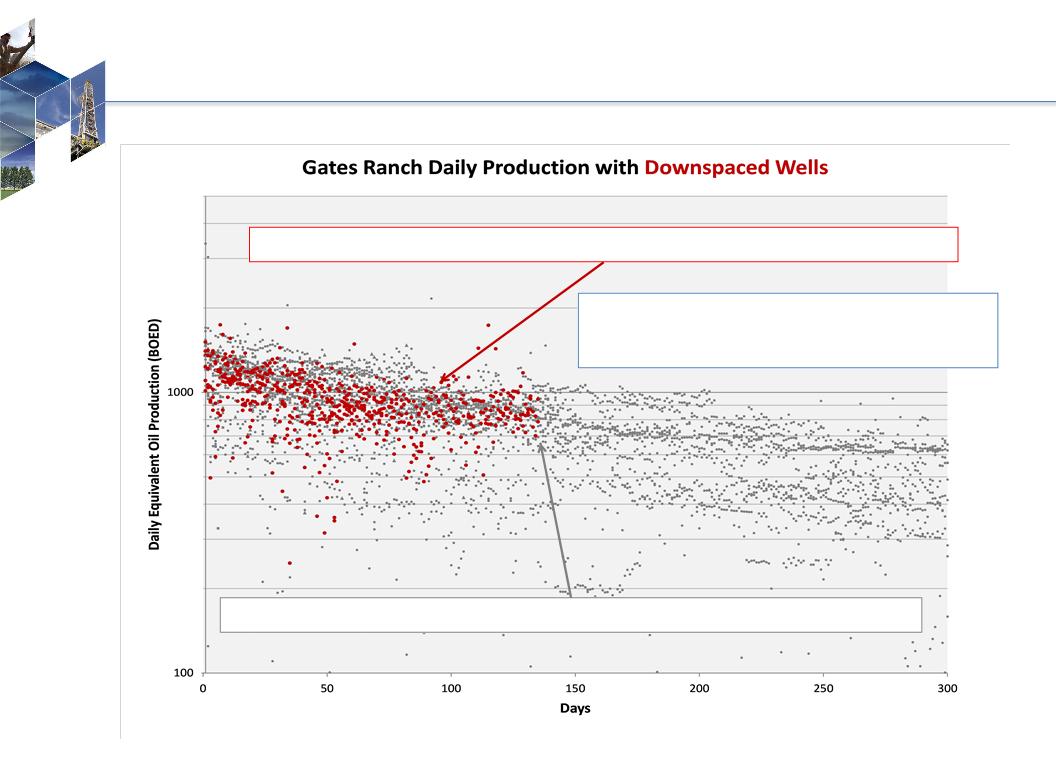
6 Gates Ranch North wells spaced 425 to 565 feet apart (50 to 65 acres per well).
21 Gates Ranch North wells spaced roughly 850 feet apart (100 acres per well).
Note: In order to compare like well performance, the well population
chosen was all of our down-spaced wells with production history and
all of the non down-spaced wells offsetting them on the same row
where similar depths and liquids ratios exist.
chosen was all of our down-spaced wells with production history and
all of the non down-spaced wells offsetting them on the same row
where similar depths and liquids ratios exist.
Gates Ranch Well-Spacing Performance
10
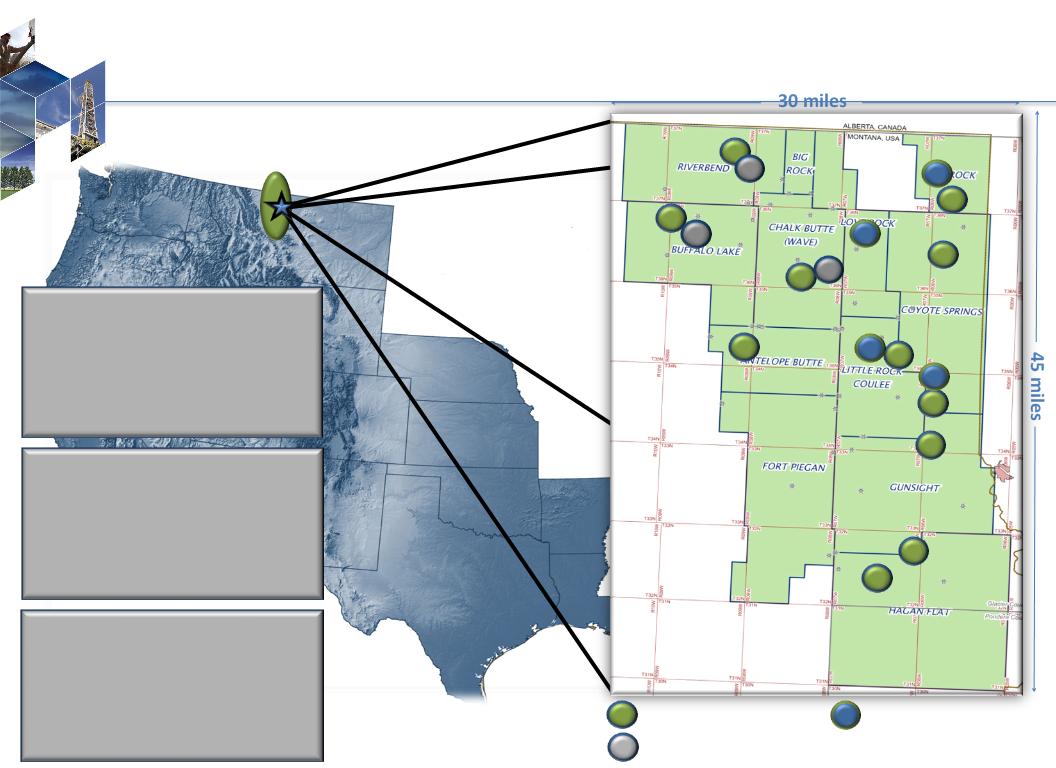
Delineation wells
Horizontal Drilled / Drilling
Tribal Riverbend 07-04H
q Drilled +/- 3,500’ lateral length
q Middle Bakken interval
q Tested 154 BOEPD
Fee Simonson 34-01H
q Drilled +/- 3,700’ lateral length
q Middle Bakken interval
q Tested 104 BOEPD
Tribal Riverbend 12-13H
q Drilled +/- 3,500’ lateral length
q Middle Bakken interval
q Tested 403 BOEPD
Horizontal Completions
Southern Alberta Basin Activity Level
11

This presentation includes forward-looking statements, which give the Company's current expectations or forecasts of future
events based on currently available information. Forward-looking statements are statements that are not historical facts,
such as expectations regarding drilling plans, including the acceleration thereof, production rates and guidance, resource
potential, incremental transportation capacity, exit rate guidance, net present value, development plans, progress on
infrastructure projects, exposures to weak natural gas prices, changes in the Company's liquidity, changes in acreage
positions, expected expenses, expected capital expenditures, and projected debt balances. The assumptions of
management and the future performance of the Company are subject to a wide range of business risks and uncertainties
and there is no assurance that these statements and projections will be met. Factors that could affect the Company's
business include, but are not limited to: the risks associated with drilling of oil and natural gas wells; the Company's ability to
find, acquire, market, develop, and produce new reserves; the risk of drilling dry holes; oil and natural gas price volatility;
derivative transactions (including the costs associated therewith and the abilities of counterparties to perform thereunder);
uncertainties in the estimation of proved, probable, and possible reserves and in the projection of future rates of production
and reserve growth; inaccuracies in the Company's assumptions regarding items of income and expense and the level of
capital expenditures; uncertainties in the timing of exploitation expenditures; operating hazards attendant to the oil and
natural gas business; drilling and completion losses that are generally not recoverable from third parties or insurance;
potential mechanical failure or underperformance of significant wells; availability and limitations of capacity in midstream
marketing facilities, including processing plant and pipeline construction difficulties and operational upsets; climatic
conditions; availability and cost of material, supplies, equipment and services; the risks associated with operating in a limited
number of geographic areas; actions or inactions of third-party operators of the Company's properties; the Company's ability
to retain skilled personnel; diversion of management's attention from existing operations while pursuing acquisitions or
dispositions; availability of capital; the strength and financial resources of the Company's competitors; regulatory
developments; environmental risks; uncertainties in the capital markets; general economic and business conditions
(including the effects of the worldwide economic recession); industry trends; and other factors detailed in the Company's
most recent Form 10-K, Form 10-Q and other filings with the Securities and Exchange Commission. If one or more of these
risks or uncertainties materialize (or the consequences of such a development changes), or should underlying assumptions
prove incorrect, actual outcomes may vary materially from those forecasted or expected. The Company undertakes no
obligation to publicly update or revise any forward-looking statements except as required by law.
12
Forward-Looking Statements and Terminology Used

For filings reporting year-end 2011 reserves, the SEC permits the optional disclosure of probable and possible
reserves. The Company has elected not to report probable and possible reserves in its filings with the SEC. We use the
term “net risked resources” to describe the Company’s internal estimates of volumes of natural gas and oil that are not
classified as proved reserves but are potentially recoverable through exploratory drilling or additional drilling or recovery
techniques. Estimates of unproved resources are by their nature more speculative than estimates of proved reserves
and accordingly are subject to substantially greater risk of actually being realized by the Company. Estimates of
unproved resources may change significantly as development provides additional data, and actual quantities that are
ultimately recovered may differ substantially from prior estimates. We use the term “BFIT NPV10” to describe the
Company’s estimate of before income tax net present value discounted at 10 percent resulting from project economic
evaluation. The net present value of a project is calculated by summing future cash flows generated by a project, both
inflows and outflows, and discounting those cash flows to arrive at a present value. Inflows primarily include revenues
generated from estimated production and commodity prices at the time of the analysis. Outflows include drilling and
completion capital and operating expenses. Net present value is used to analyze the profitability of a project. Estimates
of net present value may change significantly as additional data becomes available, and with adjustments in prior
estimates of actual quantities of production and recoverable reserves, commodity prices, capital expenditures, and/or
operating expenses.
13
Forward-Looking Statements and Terminology Used (cont.)