Attached files
| file | filename |
|---|---|
| 8-K - FORM 8-K - CHESAPEAKE UTILITIES CORP | d348687d8k.htm |
Exhibit 99.1

| 2012 AGA Financial Forum |

| Safe Harbor Statement: Some of the Statements in this document concerning future company performance will be forward-looking within the meanings of the securities laws. Actual results may materially differ from those discussed in these forward-looking statements, and you should refer to the additional information contained in Chesapeake Utilities Corporation's 2011 Annual Report on Form 10-K, as amended, filed with the SEC and our other SEC filings concerning factors that could cause those results to be different than contemplated in today's discussion. REG G Disclosure: Today's discussion includes certain non-GAAP financial measures as defined under SEC Regulation G. Although non-GAAP measures are not intended to replace the GAAP measures for evaluation of Chesapeake's performance, Chesapeake believes that the portions of the presentation, which include certain non-GAAP financial measures, provide a helpful comparison for an investor's evaluation purposes. Gross Margin: Gross Margin is determined by deducting the cost of sales from operating revenue. Cost of sales includes the purchased fuel cost for natural gas, electric and propane distribution operations and the cost of labor spent on different revenue-producing activities. Other companies may calculate gross margin in a different manner. Forward Looking Statements and Other Disclosures 2 |

| CHESAPEAKE IS UNITED. CHESAPEAKE IS HONEST. CHESAPEAKE FINDS CREATIVE SOLUTIONS. CHESAPEAKE IS INSPIRING. CHESAPEAKE DOES THE RIGHT THING. CHESAPEAKE IS RESULTS- ORIENTED. 3 |
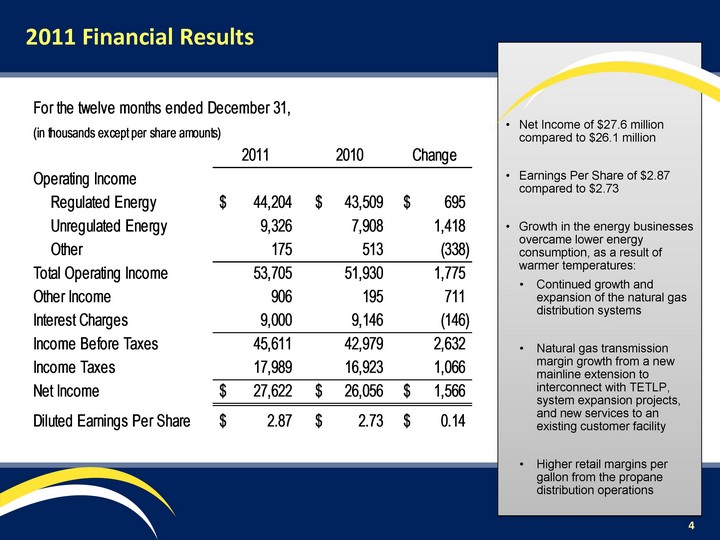
| 2011 Financial Results Net Income of $27.6 million compared to $26.1 million Earnings Per Share of $2.87 compared to $2.73 Growth in the energy businesses overcame lower energy consumption, as a result of warmer temperatures: Continued growth and expansion of the natural gas distribution systems Natural gas transmission margin growth from a new mainline extension to interconnect with TETLP, system expansion projects, and new services to an existing customer facility Higher retail margins per gallon from the propane distribution operations 4 |

| 5 Based upon adjusted EPS, year-to- date earnings growth is 5.4%. Reconciliation of 12/31/2011 Performance 5 |

| Record EPS for 5th Consecutive Year Cumulative 5-year growth in diluted EPS of 63.1% 5 year compound annual growth rate in EPS of more than 10% Long-term Sustained Performance Consistent Returns over the last five years While making investments and acquiring FPU, we have maintained ROEs between 11.2 and 11.6% 6 |
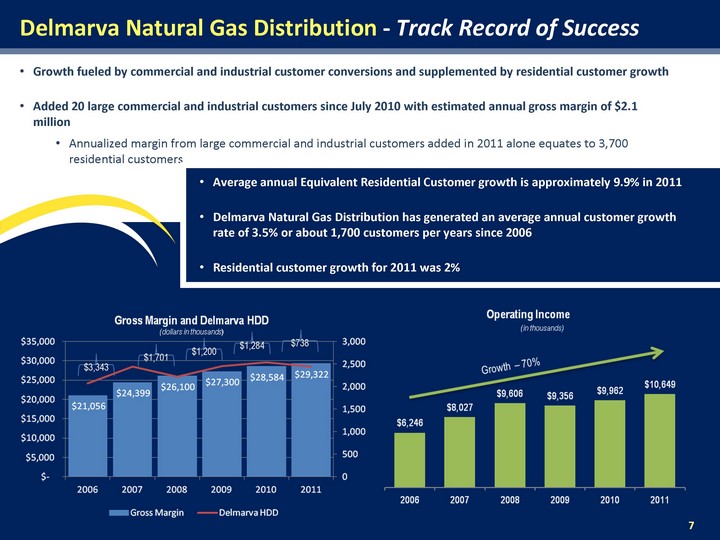
| Growth fueled by commercial and industrial customer conversions and supplemented by residential customer growth Added 20 large commercial and industrial customers since July 2010 with estimated annual gross margin of $2.1 million Annualized margin from large commercial and industrial customers added in 2011 alone equates to 3,700 residential customers Delmarva Natural Gas Distribution - Track Record of Success Average annual Equivalent Residential Customer growth is approximately 9.9% in 2011 Delmarva Natural Gas Distribution has generated an average annual customer growth rate of 3.5% or about 1,700 customers per years since 2006 Residential customer growth for 2011 was 2% $3,343 $1,701 $1,200 $1,284 $738 7 |

| Increased presence in Florida as a result of Chesapeake's Florida division, acquisition of Florida Public Utilities in 2009, and acquisition of Indiantown in 2010 Operating income increased more than 300% from 2009 to 2010 Margin growth is being driven by commercial and industrial growth $771,000 in additional gross margin as a result of 2% growth in commercial and industrial customers $377,000 additional gross margin from Indiantown acquisition 98,333 98,972 Florida Regulated Energy Distribution - Track Record of Success 8 |
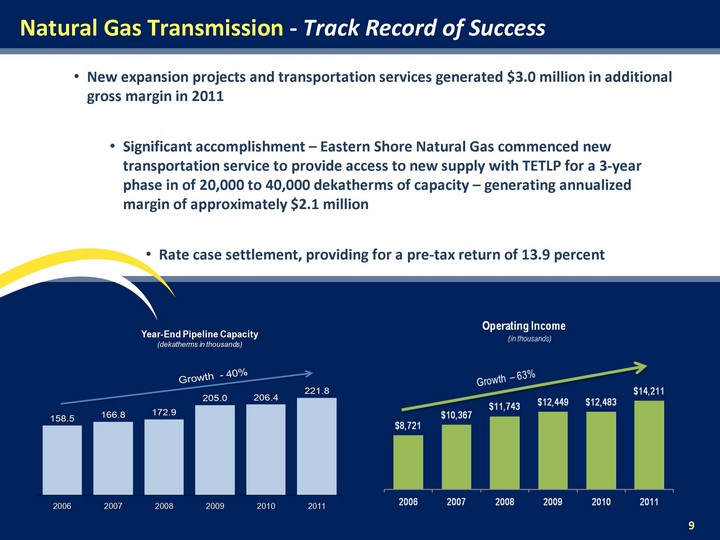
| New expansion projects and transportation services generated $3.0 million in additional gross margin in 2011 Significant accomplishment - Eastern Shore Natural Gas commenced new transportation service to provide access to new supply with TETLP for a 3-year phase in of 20,000 to 40,000 dekatherms of capacity - generating annualized margin of approximately $2.1 million Rate case settlement, providing for a pre-tax return of 13.9 percent Natural Gas Transmission - Track Record of Success 9 |
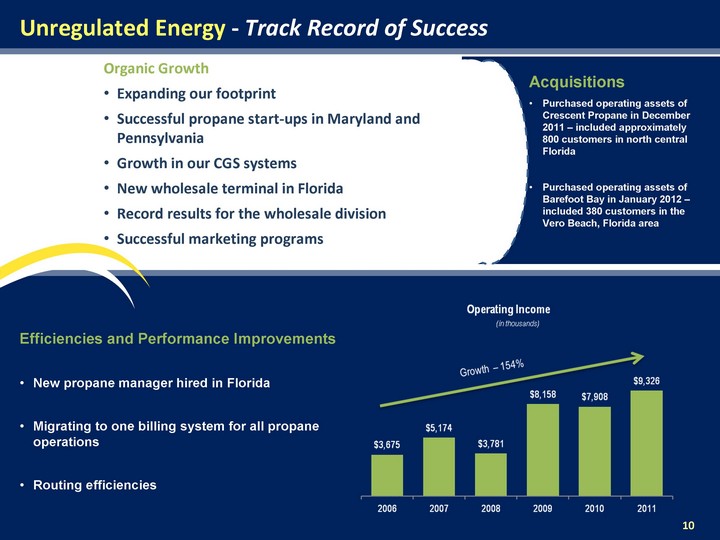
| Unregulated Energy - Track Record of Success Efficiencies and Performance Improvements New propane manager hired in Florida Migrating to one billing system for all propane operations Routing efficiencies Acquisitions Purchased operating assets of Crescent Propane in December 2011 - included approximately 800 customers in north central Florida Purchased operating assets of Barefoot Bay in January 2012 - included 380 customers in the Vero Beach, Florida area Organic Growth Expanding our footprint Successful propane start-ups in Maryland and Pennsylvania Growth in our CGS systems New wholesale terminal in Florida Record results for the wholesale division Successful marketing programs 10 |

| Advanced Information Services - Our Track Record Application Evolution (tm) is a software development platform and methodology for companies who want to modernize their Progress applications using browser-based technology. 11 |
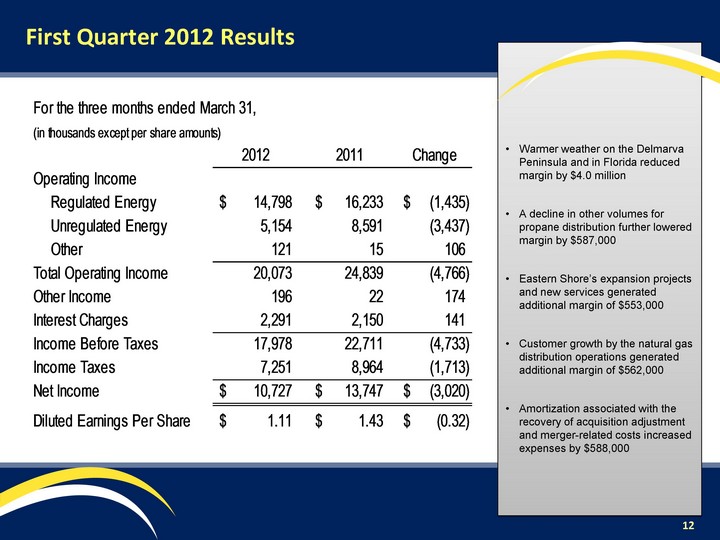
| First Quarter 2012 Results Warmer weather on the Delmarva Peninsula and in Florida reduced margin by $4.0 million A decline in other volumes for propane distribution further lowered margin by $587,000 Eastern Shore's expansion projects and new services generated additional margin of $553,000 Customer growth by the natural gas distribution operations generated additional margin of $562,000 Amortization associated with the recovery of acquisition adjustment and merger-related costs increased expenses by $588,000 12 |

| Magnitude of Warmer Weather Delmarva Warmest first quarter in last 10 years 2nd warmest first quarter in last 40 years Florida Warmest first quarter in last 20 years 3rd warmest first quarter in last 40 years * 12 months ended March 31, 2012 13 |

| Reconciliation of 3/31/12 Earnings Per Share Growth in our businesses continues to be strong 7% growth was not sufficient to overcome 25% warmer temperatures 14 |
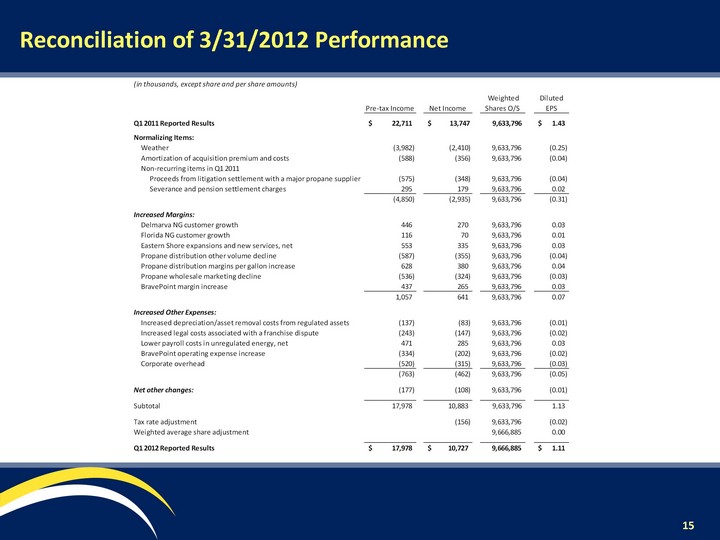
| 15 Reconciliation of 3/31/2012 Performance 15 |

| 5 year CAGR Dividend Growth = 3.5% We are committed to dividend growth that is supported by earnings growth. Continuous Dividend Growth Chesapeake has paid a dividend for 51 consecutive years Over the last five years, our annual earnings growth of 9.6% has exceeded our compound average annual dividend growth of 3.5% 2011 dividend payout ratio was approximately 47.4% The Board recently increased the dividend by $0.08 per share or 5.8% 5 year CAGR Dividend Growth 4.4% 16 |
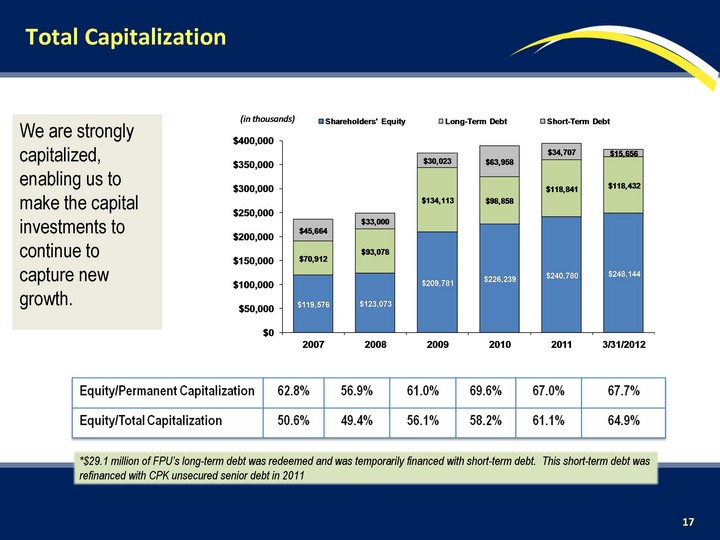
| We are strongly capitalized, enabling us to make the capital investments to continue to capture new growth. 17 Total Capitalization *$29.1 million of FPU's long-term debt was redeemed and was temporarily financed with short-term debt. This short-term debt was refinanced with CPK unsecured senior debt in 2011 17 |

| Delmarva Regulated Energy Opportunities New Service to Southern Delaware and Maryland System expansions to serve two new facilities in Eastern Sussex County (1Q2012 & 2Q2012) Annual gross margin equals 415 residential customers, or $156k annually System expansions to serve Cecil County, MD (3Q2012) Annual transportation margin - $882k Natural gas distribution service to Worcester County, MD (1Q2012 - 3Q2012) Annual transportation margin - $837k Firm natural gas transportation service to NRG Energy Center Dover, LLC (2013) Annual transportation margin - $2.4 - $2.8 million Regulatory Matters Alternative rate design application filing with the Delaware Public Service Commission (2Q2012) Reaching the Beach Natural gas system now serving Lewes, DE Serving two large customers whose fuel requirements are the equivalent to 1,000 residential customers $1.3 million in margin annually 18 |

| Florida Regulated Energy Opportunities New commercial and industrial customers Natural gas expansion to new areas of the state Nassau County represents one such opportunity Annual transportation margin of $2.1 million Additional margin from new natural gas distribution customers Small industrial based electric generation opportunities Proposed bare steel pipeline replacement program - including return on investment 0 19 |

| Unregulated Energy Opportunities Continued growth via start-ups and expansion into new areas Growth in propane distribution wholesale division Expansion of CGS into other markets Continuing to design a variety of programs based on our customers' needs and preferences Potential CNG and LNG projects, including NGVs Expansion into Cecil County Expansion into Poconos 20 |
| Advanced Information Services Opportunities Our Objectives Provide growth to the unregulated sector of business Transition from a volatile services-for-hire model to a more stable recurring revenues model Provide IT and integration support to the Company Develop more synergies with an energy focus and aligned with the Company's foundation Our information services company continued to develop new products for use by customers in various industries. We continue to look to our information services company for information technology and integration support service to our business, growth in the unregulated sector of our business and development of synergies with the energy markets. 21 |

| Capital Expenditures We have invested approximately $179 million over the last 5 years We are budged to invest $88.5 million in capital expenditures in 2012 We make investments that are projected to achieve their return on capital. Everyone matters, every day. Aspiring to new opportunities every day. 22 |

| Our Disciplined Approach, Every Day. From 2008-2011, we invested more than $118 million to grow our businesses The returns earned in our unregulated businesses coupled with our returns achieved in our regulated businesses has enabled us to achieve consolidated returns greater than regulatory commissions allow We will continue to focus on maximizing returns in our existing businesses while investing capital in new opportunities Expansion projects are driving the increase in 2012 capital expenditures in excess of 2011's level Performance Relative to Our Peers Peer ROE vs. Capital Expenditures Performance Quadrant 2009-2011 (1/1/09 - 12/31/11) 23 |

| Delivered Results to Chesapeake's Shareholders If an investor made an initial investment of $10,000 in 1992, that investment would represent a value of over $85,000 today. Over the long-term, our shareholders have earned over 11% annually on their Chesapeake investment. 24 |
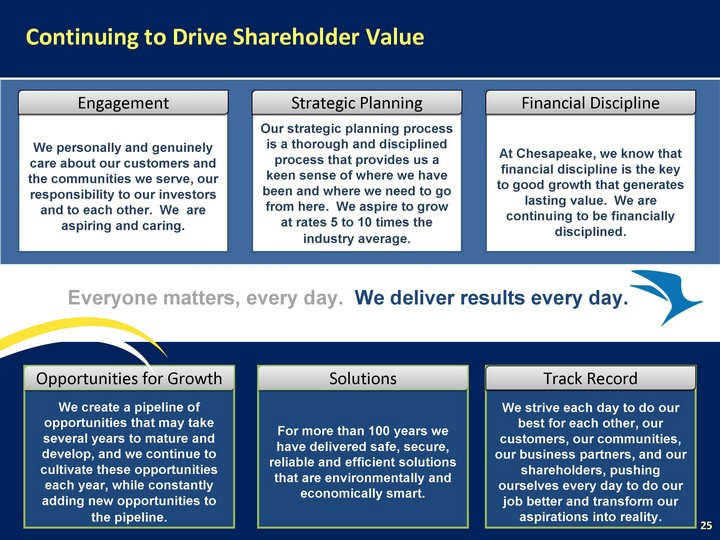
| Continuing to Drive Shareholder Value Everyone matters, every day. We deliver results every day. Track Record Opportunities for Growth Solutions Financial Discipline Strategic Planning Engagement We strive each day to do our best for each other, our customers, our communities, our business partners, and our shareholders, pushing ourselves every day to do our job better and transform our aspirations into reality. We create a pipeline of opportunities that may take several years to mature and develop, and we continue to cultivate these opportunities each year, while constantly adding new opportunities to the pipeline. For more than 100 years we have delivered safe, secure, reliable and efficient solutions that are environmentally and economically smart. We personally and genuinely care about our customers and the communities we serve, our responsibility to our investors and to each other. We are aspiring and caring. Our strategic planning process is a thorough and disciplined process that provides us a keen sense of where we have been and where we need to go from here. We aspire to grow at rates 5 to 10 times the industry average. At Chesapeake, we know that financial discipline is the key to good growth that generates lasting value. We are continuing to be financially disciplined. Track Record 25 |

| Thank you. Questions? 26 |

| Appendices |

| Business Overview A-1 |

| Business Structure Electric Distribution Florida Public Utilities Company A-2 |

| Business Diversity 30 The core of our business is regulated energy. In addition to growth in this area, we also continue to explore ways to increase our earnings through unregulated energy and other areas - the areas that provide opportunities to achieve returns greater than those of a traditional utility. Investment by Segment as of 12/31/11 2011 Margin by Segment 2011 Operating Income by Segment Business Diversity A-3 |

| Business Diversity 31 Investment by Energy Served as of 12/31/11 2011 Margin by Energy Served 2011 Operating Income by Energy Served Energy Diversity Our natural gas operations represent the largest portion of our business. Our propane and electric businesses expand our energy footprint and they provide the potential for growth for natural gas expansion and other areas in the future. A-4 |
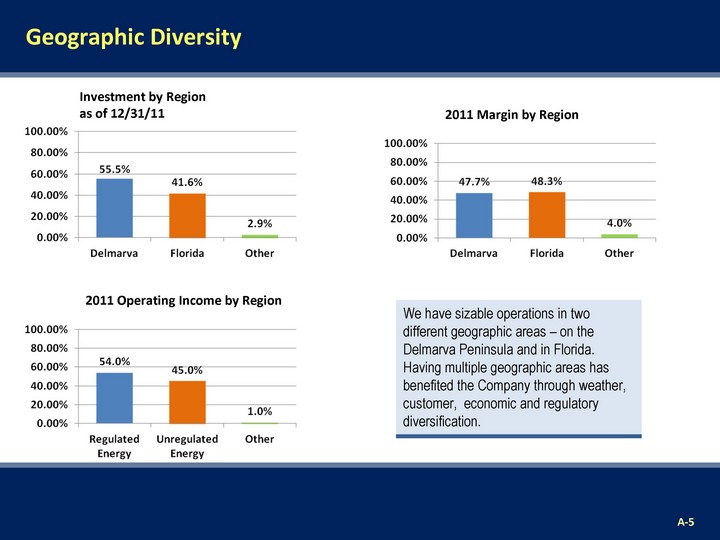
| Business Diversity 32 Investment by Region as of 12/31/11 2011 Margin by Region 2011 Operating Income by Region Geographic Diversity We have sizable operations in two different geographic areas - on the Delmarva Peninsula and in Florida. Having multiple geographic areas has benefited the Company through weather, customer, economic and regulatory diversification. A-5 |

| Regulatory Information A-6 |

| Regulatory Snapshot A-7 |

| ESNG Rate Case Settlement Key Events Eastern Shore filed a base rate case with the FERC on December 30, 2010 The parties reached an agreement in principle related to the settlement of the rate case Eastern Shore filed the settlement agreement with the FERC on November 7, 2011 FERC approved the rate case settlement on January 24, 2012 Net Impact of the Settlement Annual Revenue Impact July 2011 Rate Increase $805,000 15,000 dts of Receipt Point Service increase on 11-01-2011 $1,380,204(1) Receipt Point Rate Reduction from $7.6678 to $4.3816 ($1,380,204)(2) 5,000 dts of Receipt Point Service increase on 11-01-2012 $262,896 Chesapeake previously disclosed that the phase-in of the TETCO capacity from 20,000 to 35,000 dts on November 1, 2011 would increase annual margin from $2.4 million to $3.9 million. The proposed rate reduction offsets the gain (shown in (1)) that would have been experienced with the 15,000 dt increase in service. A-8 |

| Chesapeake requested the recovery of approximately $34.2 million in acquisition premium and $2.2 million in merger-related costs Chesapeake had to satisfy the PSC's five-factor test In January of 2012, the Public Service Commission approved recovery of the acquisition premium and merger-related costs. As a result of the approval: We will be able to include the acquisition premium and merger-related costs in our cost and investment, when determining our rates for service Amortization expense will be recorded and also included in the calculation of our rates Acquisition premium amortized over 30 years Merger-related costs amortized over 5 years Amortization expense of : $2.4 million annually ($1.4 million, net of tax in 2012 and 2013) $2.3 million ($1.4 million, net of tax in 2014) $1.8 million ($1.1 million, net of tax annually thereafter until 2039) Longer-term, the inclusion of the acquisition premium in the Company's rate base and the recovery of the acquisition premium and merger-related costs through amortization expense, will increase the Company's earnings and cash flows above the levels that would have otherwise been achieved No recovery would have meant lower earnings. Approval of Recovery of Acquisition Premium and Merger-Related Costs A-9 |
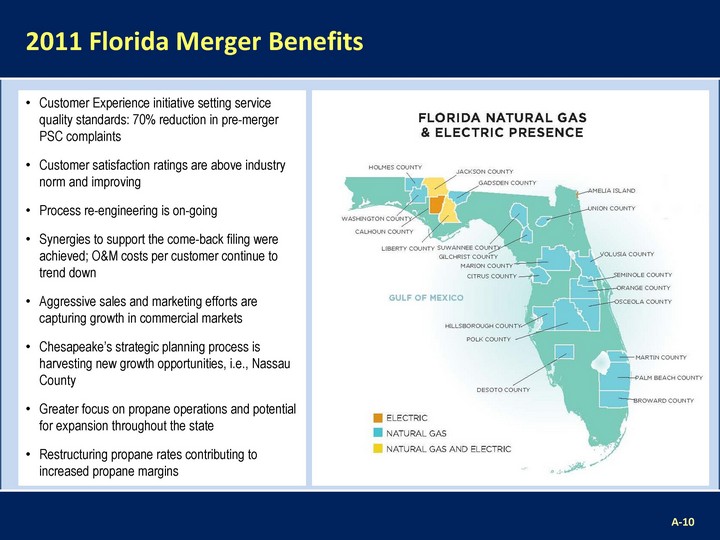
| Customer Experience initiative setting service quality standards: 70% reduction in pre-merger PSC complaints Customer satisfaction ratings are above industry norm and improving Process re-engineering is on-going Synergies to support the come-back filing were achieved; O&M costs per customer continue to trend down Aggressive sales and marketing efforts are capturing growth in commercial markets Chesapeake's strategic planning process is harvesting new growth opportunities, i.e., Nassau County Greater focus on propane operations and potential for expansion throughout the state Restructuring propane rates contributing to increased propane margins A-11 2011 Florida Merger Benefits A-10 |