Attached files
| file | filename |
|---|---|
| 8-K - FORM 8-K - PUBLIC SERVICE ELECTRIC & GAS CO | d342440d8k.htm |
| EX-99 - PRESS RELEASE DATED MAY 2, 2012 - PUBLIC SERVICE ELECTRIC & GAS CO | d342440dex99.htm |
 Public Service Enterprise Group
PSEG Earnings Conference Call
1
st
Quarter 2012
May 2, 2012
Exhibit 99.1 |
| 1
Forward-Looking Statement
Readers are cautioned that statements contained in this presentation about our
future performance, including future revenues, earnings, strategies, prospects,
consequences and all other statements that are not purely historical, are
forward-looking statements for purposes of the safe harbor provisions under The Private
Securities Litigation Reform Act of 1995. When used herein, the
words “anticipate”, “intend”, “estimate”,
“believe”, “expect”, “plan”, “should”, “hypothetical”, “potential”,
“forecast”, “project”, variations of such words and similar
expressions are intended to identify forward-looking statements. Although we believe that our expectations are
based
on
reasonable
assumptions,
they
are
subject
to
risks
and
uncertainties
and
we
can
give
no
assurance
they
will
be
achieved.
The
results
or
developments
projected
or
predicted
in
these
statements
may
differ
materially
from
what
may
actually
occur.
Factors
which
could
cause
results
or
events
to
differ
from
current
expectations include, but are not limited to:
•
adverse changes in the demand for or price of the capacity and energy that we sell
into wholesale electricity markets, •
adverse changes in energy industry law, policies and regulation, including market
structures and a potential shift away from competitive markets toward subsidized market
mechanisms, transmission planning and cost allocation rules, including rules
regarding how transmission is planned and who is permitted to build transmission in the future,
and reliability standards,
•
any inability of our transmission and distribution businesses to obtain adequate
and timely rate relief and regulatory approvals from federal and state regulators,
•
changes in federal and state environmental regulations that could increase our
costs or limit our operations, •
changes in nuclear regulation and/or general developments in the nuclear power
industry, including various impacts from any accidents or incidents experienced at our
facilities or by others in the industry, that could limit operations of our
nuclear generating units, •
actions
or
activities
at
one
of
our
nuclear
units
located
on
a
multi-unit
site
that
might
adversely
affect
our
ability
to
continue
to
operate
that
unit
or
other
units
located
at
the
same site,
•
any inability to balance our energy obligations, available supply and trading
risks, •
any deterioration in our credit quality, or the credit quality of our
counterparties, including in our leveraged leases, •
availability of capital and credit at commercially reasonable terms and conditions
and our ability to meet cash needs, •
any inability to realize anticipated tax benefits or retain tax
credits,
•
changes in the cost of, or interruption in the supply of, fuel and other
commodities necessary to the operation of our generating units, •
delays in receipt of necessary permits and approvals for our construction and
development activities, •
delays or unforeseen cost escalations in our construction and development
activities, •
any inability to achieve or continue to sustain, our expected levels of operating
performance, •
increase in competition in energy supply markets as well as competition for certain
rate-based transmission projects, •
challenges associated with recruitment and/or retention of a qualified
workforce, •
adverse performance of our decommissioning and defined benefit plan trust fund
investments and changes in discount rates and funding requirements, and
•
changes in technology and customer usage patterns.
For further information, please refer to our Annual Report on Form 10-K,
including Item 1A. Risk Factors, and subsequent reports on Form 10-Q and Form 8-K filed with
the
Securities
and
Exchange
Commission.
These
documents
address
in
further
detail
our
business,
industry
issues
and
other
factors
that
could
cause
actual
results
to
differ
materially
from
those
indicated
in
this
presentation.
In
addition,
any
forward-looking
statements
included
herein
represent
our
estimates
only
as
of
today
and
should not be relied upon as representing our estimates as of any subsequent
date. While we may elect to update forward-looking statements from time to time, we
specifically disclaim any obligation to do so, even if our internal estimates
change, unless otherwise required by applicable securities laws. |
| 2
GAAP Disclaimer
PSEG presents Operating Earnings in addition to its Net Income reported in
accordance with accounting principles generally accepted in the United
States (GAAP). Operating Earnings is a non-GAAP financial measure that
differs from Net Income because it excludes gains or losses associated with
Nuclear Decommissioning Trust (NDT), Mark-to-Market (MTM)
accounting, and other material one-time items. PSEG presents
Operating Earnings because management believes that it is appropriate for
investors to
consider results excluding these items in addition to the results reported in
accordance with GAAP. PSEG believes that the non-GAAP financial
measure of Operating Earnings provides a consistent and comparable
measure of performance of its businesses to help shareholders understand
performance trends. This information is not
intended to be viewed as an
alternative to GAAP information. The last slide in this presentation includes
a list of items excluded from Income from Continuing Operations to
reconcile to Operating Earnings, with a reference to that slide included on
each of the slides where the non-GAAP information appears.
|
| PSEG
2012 Q1 Review
Ralph Izzo
Chairman, President and Chief Executive Officer
*
*
*
*
*
*
*
* |
 4
Q1 Earnings Summary
$ millions (except EPS)
2012
2011
Operating Earnings
$ 432
$ 431
Reconciling Items, Net of Tax
61
31
Income from Continuing Operations
493
462
Discontinued Operations, Net of Tax
-
64
Net Income
493
526
EPS from Operating Earnings*
$ 0.85
$ 0.85
Quarter ended March
31 *
See Page A for Items excluded from Income from Continuing Operations to reconcile to Operating Earnings. |
 5
PSEG –
Q1 2012 Highlights
Operating Earnings of $0.85 vs. Q1 2011 of $0.85 per share
Results stronger than expected
Maintaining 2012 earnings guidance of $2.25 -
$2.50 per share
A challenging environment; strong production from Nuclear; improved
availability of CCGTs and Fossil’s control of O&M supported results
PSE&G earning its return; investments on track
Susquehanna-Roseland transmission line on track for October 2012
decision from National Park Service
Power on schedule to add 400 MW of new peaking capacity in
June at NJ and CT sites
Financial condition remains strong |
 6
2010 Operating Earnings*
2011 Operating Earnings*
2012 Guidance
$2.25 -
$2.50E
PSEG –
Maintaining 2012 Guidance
$3.12
* See Page A for Items excluded from Income from Continuing Operations to reconcile
to Operating Earnings.
$2.74 |
| PSEG
2012 Q1 Operating Company Review
Caroline Dorsa
EVP and Chief Financial Officer
*
*
*
*
*
*
*
*
* |
 8
Q1 Operating Earnings by Subsidiary
Operating Earnings
Earnings per Share
$ millions (except EPS)
2012
2011
2012
2011
PSEG Power
$ 196
$ 267
$ 0.39
$ 0.53
PSE&G
197
163
0.39
0.32
PSEG Energy
Holdings/Enterprise
39
1
0.07
0.00
Operating Earnings*
$ 432
$ 431
$ 0.85
$ 0.85
Quarter ended March 31
* See Page A for Items excluded from Income from Continuing Operations to reconcile
to Operating Earnings. |
 9
$0.85
.07
.07
(.14)
$0.85
0.00
0.25
0.50
0.75
1.00
PSEG EPS Reconciliation –
Q1 2012 versus Q1 2011
Lower Pricing and
Lower Volume (.10)
Lower Capacity (.07)
Migration (.04)
O&M .04
Financing Costs .02
Misc. and Other .01
Transmission Formula
Rates .03
Other Investments .01
Weather (.02)
D&A (.01)
O&M (.01)
Taxes .06
Other .01
Q1 2012
Operating
Earnings*
Q1 2011
Operating
Earnings*
PSEG Power
PSE&G
Energy
Holdings/
Enterprise
Taxes .08
Lower Lease
Income (.01)
* See Page A for Items excluded from Income from Continuing Operations to reconcile
to Operating Earnings. |
| PSEG
Power 2012 Q1 Review
*
*
*
*
*
*
*
*
* |
 11
PSEG Power –
Q1 2012 EPS Summary
$ millions (except EPS)
Q1 2012
Q1 2011
Variance
Operating Revenues
$ 1,561
$ 1,967
$ (406)
Operating Earnings
196
267
(71)
NDT Funds Related
Activity,
Net of Tax
5
27
(22)
Mark-to-Market, Net of Tax**
52
4
48
Income from Continuing Operations
253
298
(45)
Discontinued Operations, Net of Tax
-
64
(64)
Net Income
253
362
(109)
EPS from Operating Earnings*
$ 0.39
$ 0.53
$ (0.14)
* See Page A for Items excluded from Income from Continuing Operations to reconcile
to Operating Earnings. **Includes the financial impact from positions with
forward delivery months. |
 12
$0.39
.06
(.21)
.01
$0.53
0.00
0.10
0.20
0.30
0.40
0.50
0.60
Lower Pricing and
Lower Volume (.10)
Lower Capacity
(.07)
Migration (.04)
PSEG Power EPS Reconciliation –
Q1 2012 versus Q1 2011
Q1 2012
Operating
Earnings*
Q1 2011
Operating
Earnings*
O&M .04
Financing
Costs .02
* See Page A for Items excluded from Income from Continuing Operations to reconcile
to Operating Earnings. Taxes and
Other |
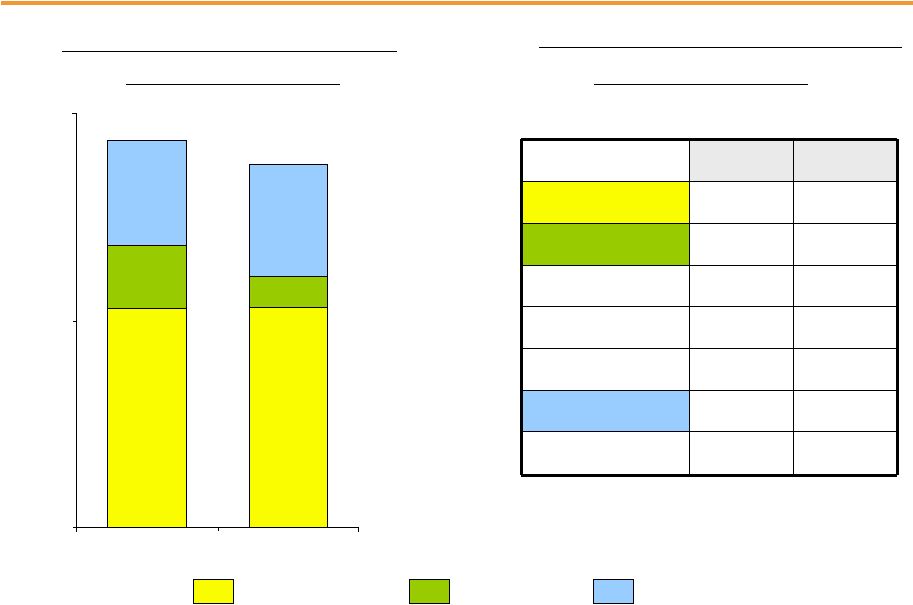 13
PSEG Power –
Generation Measures
7,928
7,970
3,790
4,043
2,312
1,130
0
7,500
15,000
2011
2012
Quarter ended March 31
Total Nuclear
Total Coal*
Oil & Natural Gas
* Includes figures for Pumped Storage
PSEG Power –
Generation (GWh)
14,030
13,143
Quarter ended March 31
PSEG Power –
Capacity Factors (%)
2011
2012
Nuclear
99%
98%
Coal
NJ (Coal/Gas)
29%
2%
PA
83%
63%
CT
24%
2%
Combined
Cycle
PJM and NY
53%
57% |
 14
PSEG Power –
Fuel Costs
Quarter ended March 31
($ millions)
2011
2012
Coal
90
39
Oil & Gas
191
128
Total Fossil
281
167
Nuclear
46
50
Total Fuel Cost
327
217
Total Generation
(GWh)
14,030
13,143
$ / MWh
23.31
16.51
PSEG Power –
Fuel Costs*
* Based on Operating Earnings. |
 15
Hedging Update…
Contracted Energy*
* Hedge
percentages
and
prices
as
of
March
31,
2012.
Revenues
of
full
requirement
load
deals
based
on
contract
price,
including
renewable
energy
credits,
ancillary,
and
transmission
components
but
excluding
capacity.
Hedges
include
positions
with
MTM
accounting
treatment
and
options.
Volume TWh
25
34
34
Base Load
% Hedged
100%
85-90%
35-40%
(Nuclear and Base Load Coal)
Price $/MWh
$59
$53
$55
Volume TWh
15-16
18-20
19-21
Intermediate Coal, Combined
% Hedged
20-25%
0
0
Cycle, Peaking
Price $/MWh
$59
Volume TWh
40-41
52-54
53-55
Total
% Hedged
70-75%
55-60%
20-25%
Price $/MWh
$59
$53
$55
Apr-Dec
2012
2013
2014 |
 16
$0
$25
$50
$75
2010
2011
2012
$55
$55
$46
PSEG Power –
Gross Margin Performance
Margins declined with reduction in energy and capacity pricing
Migration volumes in line with expectations, margins influenced by
warmer-than-normal weather
Output influenced by weather and compression in dark spreads
Regional Performance
Region
Q1 2012
Gross
Margin* ($M)
2012 Performance
PJM
$579
Reduction in energy and capacity
pricing primary influence on margin.
Pricing was often set by low cost
gas in the East, with decline in
weather related demand and
outages affecting power prices.
New
England
$11
Performance influenced by
compression in dark spreads.
New York
$10
CCGT performance benefits from
expansion in heat rates.
PSEG Power Gross Margin* ($/MWh)
Quarter ended
March 31
* Based on Operating Earnings. |
 17
PSEG Power –
Q1 2012 Operating Highlights
Q1 Output down 6.3% on lower coal dispatch
Capacity factor for PS share of nuclear fleet at 98.2%
Combined cycle output up 8.3%; improvement in equivalent availability factor
O&M reductions at fossil stations in response to market price decline
Operations
Regulatory and Market
Environment
Financial
2012 BGS auction priced at $83.88/MWh vs. $103.72/MWh for expiring contract
2012 anticipated coal and nuclear output hedged at average price
of $59/MWh
Customer migration approximately 36% for the quarter
Power interest savings from debt retirements
Power’s total debt as a percentage of capital at March 31 was 33%
|
| PSE&G
2012 Q1 Review
*
*
*
*
*
*
*
*
* |
 19
PSE&G –
Q1 Earnings Summary
$ millions (except EPS)
Q1 2012
Q1 2011
Variance
Operating Revenues
$ 1,939
$ 2,306
$ (367)
Operating Expenses
Energy Costs
1,002
1,366
(364)
Operation & Maintenance
376
368
8
Depreciation & Amortization
190
179
11
Taxes Other than Income Taxes
29
43
(14)
Total Operating Expenses
1,597
1,956
(359)
Operating Earnings / Net Income
197
163
34
EPS from Operating Earnings*
$ 0.39
$ 0.32
$ 0.07
* See Page A for Items excluded from Income from Continuing Operations to reconcile
to Operating Earnings. |
 20
$0.39
.06
(.03)
.04
$0.32
0.00
0.10
0.20
0.30
0.40
PSE&G EPS Reconciliation –
Q1 2012
versus Q1 2011
Q1 2012
Operating
Earnings*
Q1 2011
Operating
Earnings*
* See Page A for Items excluded from Income from Continuing Operations to reconcile
to Operating Earnings. Transmission
Formula Rates
.03
Other
Investments .01
Taxes
Weather (.02)
D&A (.01)
O&M (.01)
Other .01 |
 21
PSE&G –
Q1 Operating Highlights
NPS selected existing path as preferred route for S-R line; Final EIS October
2012 Awaiting BPU decision on construction of the North-Central
Reliability Project Annual transmission revenue increase of $94 million
effective on January 1, 2012
PSE&G earned its authorized return
Capital cost for S-R line raised to $790 million from up to $750 million
Operations
Regulatory and Market
Environment
Financial
Warmest Q1 on record since 1970
Heating degree days were 21% below normal and Q1 2011
O&M remains under control |
| PSEG
Energy Holdings/Enterprise 2012 Q1 Review
*
*
*
*
*
*
*
*
* |
 23
PSEG Energy Holdings/Enterprise –
Q1 2012 Earnings
Summary
$ millions (except EPS)
Q1 2012
Q1 2011
Variance
Operating Earnings
$ 39
$ 1
38
Lease Related Activity
4
-
4
Net Income
43
1
42
EPS from Operating Earnings*
$ 0.07
$ -
$ 0.07
* See Page A for Items excluded from Income from Continuing Operations to reconcile
to Operating Earnings. |
 24
PSEG Energy Holdings/Enterprise EPS Reconciliation –
Q1 2012 versus Q1 2011
0.00
0.05
0.10
Q1 2012
Operating
Earnings*
Q1 2011
Operating
Earnings*
* See Page A for Items excluded from Income from Continuing Operations to reconcile
to Operating Earnings. Taxes .08
Lower Lease
Income (.01)
$0.00
.07
$0.07 |
 25
PSEG Energy Holdings/Parent –
Q1 Operating Highlights
Financial
Definitive agreement reached with the IRS that settles the tax
treatment for challenged lease transactions (LILO/SILO) for
all tax years
Settlement
reached
with
the
IRS
for
all
federal
audit
issues
for
tax
years 1997-2006
10-year LIPA management services agreement begins January 2014
Expanded interest in solar with purchase of 25 MW facility for
$75 million |
| PSEG
*
*
*
*
*
*
*
*
*
*
* |
 27
PSEG Financial Highlights
2012
operating
earnings
guidance
of
$2.25
-
$2.50
per
share
Guidance by operating company
Financial risk associated with LILO/SILO investments eliminated
Financial position strengthened
Dividend increase continues practice of returning cash to shareholders
Debt as a percentage of Capital remains strong at 39.8% at March
31
Renewed and extended $2.1 billion of credit facilities for 5-year period;
credit capacity of $4.3 billion
Funded planned $135 million 2012 contribution to pension and other
post-retirement programs in Q1 2012 |
 28
PSEG 2012 Operating Earnings Guidance -
PSEG 2012 Operating Earnings Guidance -
By Subsidiary
By Subsidiary
$ millions (except EPS)
2012E
2011A
PSEG Power
$575 –
$665
$ 845
PSE&G
$530 –
$560
$ 521
PSEG Energy
Holdings/Enterprise
$35 –
$45
$ 23
Operating Earnings*
$1,140 –
$1,270
$ 1,389
Earnings per Share
$ 2.25 –
$ 2.50
$2.74
* See Page A for Items excluded from Income from Continuing Operations to reconcile
to Operating Earnings. |
 29
PSEG Liquidity as of March 31, 2012
Company
Facility
Date
Facility
Usage
Liquidity
($Millions)
PSE&G
5-year Credit Facility
Apr-16
$600
$29
$571
5-Year Credit Facility (Power)
Mar-17
$1,600
$78
$1,522
5-Year Credit Facility (Power)
Apr-16
$1,000
$0
$1,000
5-Year Bilateral - Credit Suisse (Power)
Sep-15
$100
$100
$0
5-year Credit Facility (PSEG)
Mar-17
$500
$12
$488
5-year Credit Facility (PSEG)
Apr-16
$500
$0
$500
Total
$4,300
$4,081
$858
PSE&G ST Investment
$0
Total Liquidity Available
$4,939
Total Parent / Power Liquidity
$4,368
PSEG /
Power
PSEG Money Pool ST Investment |
 Items
Excluded from Income from Continuing Operations to Reconcile to Operating
Earnings Please see Page 2 for an explanation of PSEG’s use of Operating
Earnings as a non-GAAP financial measure and how it differs from Net
Income. A |