Attached files
| file | filename |
|---|---|
| 8-K - FORM 8-K - PUBLIC SERVICE ELECTRIC & GAS CO | d342440d8k.htm |
| EX-99.1 - SLIDESHOW PRESENTATION - PUBLIC SERVICE ELECTRIC & GAS CO | d342440dex991.htm |
Exhibit 99

May 2, 2012
PSEG ANNOUNCES 2012 FIRST QUARTER RESULTS
$0.97 PER SHARE FROM CONTINUING OPERATIONS
$0.85 PER SHARE OF OPERATING EARNINGS
Operational Efficiency Supports Earnings
Company Maintains 2012 Operating Earnings Guidance of $2.25-$2.50 Per Share
Public Service Enterprise Group (PSEG) reported today Income from Continuing Operations and Net Income for the first quarter of 2012 of $493 million or $0.97 per share as compared to Income from Continuing Operations of $462 million or $0.91 per share in the first quarter of 2011. Including Income from Discontinued Operations, and gain on sale ($64 million or $0.13 per share), PSEG reported Net Income for the first quarter of 2011 of $526 million or $1.04 per share. Operating Earnings for the first quarter of 2012 were $432 million or $0.85 per share compared to Operating Earnings in the first quarter of 2011 of $431 million or $0.85 per share.
“PSEG delivered strong results in the face of challenging market conditions” said Ralph Izzo, chairman, president and chief executive officer. He went on to say, “our employees’ responsiveness to the market and the mild winter allowed us to better align expenses with operations.” He added, “we continue to implement a $6.7 billion capital program that will improve reliability and add jobs in New Jersey.” In discussing the outlook for 2012, Izzo said “we continue to forecast operating earnings for 2012 of $2.25 - $2.50 per share”.
PSEG believes that the non-GAAP financial measure of “Operating Earnings” provides a consistent and comparable measure of performance of its businesses to help shareholders understand performance trends. Operating Earnings exclude the impact of returns/(losses) associated with NDT and MTM accounting. The table below provides a reconciliation of PSEG’s Net Income to Operating Earnings (a non-GAAP measure) for the first quarter. See Attachment 10 for a complete list of items excluded from Income from Continuing Operations in the determination of Operating Earnings.
PSEG CONSOLIDATED EARNINGS (unaudited)
First Quarter Comparative Results
2012 and 2011
| Income ($millions) |
Diluted Earnings Per Share |
|||||||||||||||
| 2012 | 2011 | 2012 | 2011 | |||||||||||||
| Operating Earnings |
$ | 432 | $ | 431 | $ | 0.85 | $ | 0.85 | ||||||||
| Reconciling Items |
61 | 31 | 0.12 | 0.06 | ||||||||||||
| Income from Continuing Operations |
$ | 493 | $ | 462 | $ | 0.97 | $ | 0.91 | ||||||||
| Income from Discontinued Operations |
0 | 64 | 0.00 | 0.13 | ||||||||||||
| Net Income |
$ | 493 | $ | 526 | $ | 0.97 | $ | 1.04 | ||||||||
| Avg. Shares | 507M | 507M | ||||||||||||||
In discussing the quarter, Izzo went on to say “fossil operations that took cost control to a new level allowed us to meet the challenge of a complete absence of winter, lower demand and a collapse in gas prices”. He continued by saying “this focus on operational excellence is a guiding principle at PSEG that will help ensure superior results for customers, employees and shareholders.”
The following table outlines continued expectations for operating earnings in 2012 by subsidiary:
2012 Operating Earnings Guidance
($ millions, except EPS)
| 2012E | ||
| PSEG Power |
$575-$665 | |
| PSE&G |
530-560 | |
| PSEG Energy Holdings/Parent |
35-45 | |
| Operating Earnings |
$1,140-$1,270 | |
| Earnings Per Share |
$2.25 - $2.50 |
Operating Earnings Review by Subsidiary
See Attachment 5 for detail regarding the quarter-over-quarter reconciliations for each of PSEG’s businesses.
PSEG Power
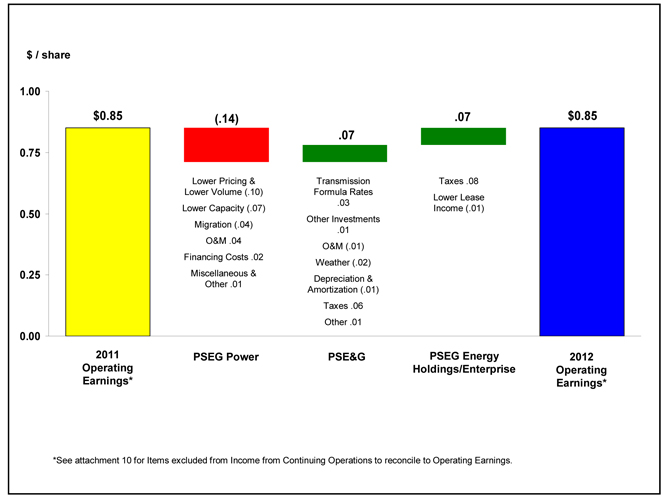
PSEG Power reported operating earnings of $196 million ($0.39 per share) for the first quarter of 2012 compared with operating earnings of $267 million ($0.53 per share) for the first quarter of 2011.
PSEG Power’s earnings were affected by warmer than normal weather conditions and a decline in the price for energy and capacity as well as lower fuel costs. These issues were offset somewhat by continued strong nuclear operations coupled with greater dispatch from the combined cycle natural gas fleet.
Output from Power’s fleet declined 6.3% in the quarter as a result of a decline in production from the coal fleet. Production from the nuclear fleet increased 0.5% from very strong levels in the year ago quarter and output from Power’s combined cycle natural gas fleet increased 8.3% in the quarter. A decline in demand given warmer than normal weather conditions compared with more normal weather in the year-ago quarter, as well as a decline in wholesale energy prices, resulted in reduced dispatch of the coal fleet. The decline in volume reduced earnings by $0.02 per share in the quarter. Lower realized pricing reduced earnings by $0.08 per share quarter-over-quarter. A decline in average capacity prices to $110-MW/Day from $174-MW/Day reduced earnings in the quarter by $0.07 per share. An increase in customer migration away from the BGS contract was in line with expectations. The increase in customer migration to approximately 36% in the quarter reduced earnings by $0.01 per share. However, an increase in headroom associated with the decline in energy prices further reduced earnings by $0.03 per share.
2
Power has reduced the operating and maintenance expenses at its fossil stations in response to the decline in the market. The reduction in operating and maintenance expense improved earnings in the quarter by $0.04 per share. A decline in debt levels at Power coupled with a reduction in interest rates resulted in lower finance costs and improved earnings comparisons quarter-over-quarter by $0.02 per share. The absence of losses on wholesale energy contracts recognized in the year-ago quarter more than offset the impact of lower volumes and prices on gas supply contracts and net added $0.01 per share to earnings.
PSEG Power’s nuclear fleet operated at an average capacity factor of 98.2% during the quarter. The Hope Creek nuclear facility, 100%-owned by PSEG Power, entered a refueling outage in April. Salem 2, 57%-owned and operated by PSEG Power, is scheduled for refueling in the Fall of 2012. The combined cycle fleet’s availability improved in the quarter, and the fleet operated at an average capacity factor of 56.6% versus 52.9% in the year-ago period.
Power continues to forecast output for 2012 of 53-54 TWh. Output for the remainder of the year is approximately 70% - 75% hedged at an average price of $59 per MWh. For 2013, forecast output of 52 - 54 TWh is approximately 55% - 60% hedged at an average price of $53 per MWh. We forecast output for 2014 of 53 - 55 TWh. Of this amount, approximately 20% - 25% is hedged at an average price of $55 per MWh.
PSE&G
PSE&G reported operating earnings of $197 million ($0.39 per share) for the first quarter of 2012 compared with operating earnings of $163 million ($0.32 per share) for the first quarter of 2011.
PSE&G’s results in the quarter were influenced by higher transmission formula rates, warmer than normal weather and an adjustment this quarter due to the settlement of tax audits. An annualized increase in transmission revenue of $94 million effective on January 1, 2012, added $0.03 per share to results. A return on investments in energy efficiency, solar and infrastructure programs added $0.01 per share. Warmer than normal weather versus colder than normal weather in the year-ago quarter reduced electric and gas sales and lowered earnings by $0.02 per share. PSE&G’s ability to accrue earnings under the gas weather normalization clause, which has a return cap, was affected by the positive impact of the settlement of tax audits which reduced the utility’s tax expense. Higher levels of capital investment led to an increase in depreciation expense which reduced quarterly earnings comparisons by $0.01 per share. Higher operating and maintenance expense reduced earnings by $0.01 per share and was offset by other miscellaneous items of $0.01 per share. PSE&G’s quarterly earnings also benefited from the settlement of tax audits for 1997 – 2006 which resulted in a one-time reduction in tax expense. The reduction in taxes improved earnings by $0.06 per share.
PSE&G experienced the warmest first quarter, in terms of heating degree days, since 1970. In addition, weak economic conditions continued to have an impact on demand. In terms of weather-normalized demand, a 1.9% decline in electric sales was led by a 2.5% decline in sales to the commercial and industrial sector. Weather-normalized sales to gas customers declined 0.7% quarter-over-quarter.
PSE&G received news in March from the National Park Service (NPS) that “identified” our route for the Susquehanna – Roseland transmission line as its preferred alternative for the portion of the existing transmission line that runs through the Delaware Water Gap National Recreation Area – the
3
route approved by state regulators including the NJ Board of Public Utilities (BPU). A final order from the NPS is expected to be issued in October 2012. The expected in-service date for the line is June 2015. The capital cost for Susquehanna – Roseland has been updated, and is now forecast at up to $790 million from $750 million.
PSE&G is awaiting a decision by the BPU on construction of the North-Central Reliability project, a $390 million upgrade of transmission lines located in the northern and central portions of New Jersey.
PSEG Energy Holdings/Enterprise
PSEG Energy Holdings/Enterprise reported operating earnings of $39 million ($0.07 per share) for the first quarter of 2012 compared with operating earnings of $1 million during the first quarter of 2011.
The improvement in operating earnings is due to the settlement with the Internal Revenue Service of the offshore lease transactions for all tax years, and a settlement of all federal audit issues for tax years 1997 – 2006. A reduction in the effective tax rate improved operating earnings by $38 million, or $0.08 per share. A small reduction in lease earnings in 2012’s first quarter was approximately equal to the absence of an asset impairment recognized in 2011’s first quarter.
######
FORWARD-LOOKING STATEMENT
Readers are cautioned that statements contained in this presentation about our future performance, including future revenues, earnings, strategies, prospects, consequences and all other statements that are not purely historical, are forward-looking statements for purposes of the safe harbor provisions under The Private Securities Litigation Reform Act of 1995. When used herein, the words “anticipate”, “intend”, “estimate”, “believe”, “expect”, “plan”, “should”, “hypothetical”, “potential”, “forecast”, “project”, variations of such words and similar expressions are intended to identify forward-looking statements. Although we believe that our expectations are based on reasonable assumptions, they are subject to risks and uncertainties and we can give no assurance they will be achieved. The results or developments projected or predicted in these statements may differ materially from what may actually occur. Factors which could cause results or events to differ from current expectations include, but are not limited to:
| • | adverse changes in the demand for or price of the capacity and energy that we sell into wholesale electricity markets, |
| • | adverse changes in energy industry law, policies and regulation, including market structures and a potential shift away from competitive markets toward subsidized market mechanisms, transmission planning and cost allocation rules, including rules regarding how transmission is planned and who is permitted to build transmission in the future, and reliability standards, |
| • | any inability of our transmission and distribution businesses to obtain adequate and timely rate relief and regulatory approvals from federal and state regulators, |
| • | changes in federal and state environmental regulations that could increase our costs or limit our operations, |
| • | changes in nuclear regulation and/or general developments in the nuclear power industry, including various impacts from any accidents or incidents experienced at our facilities or by others in the industry, that could limit operations of our nuclear generating units, |
| • | actions or activities at one of our nuclear units located on a multi-unit site that might adversely affect our ability to continue to operate that unit or other units located at the same site, |
| • | any inability to balance our energy obligations, available supply and trading risks, |
| • | any deterioration in our credit quality, or the credit quality of our counterparties, including in our leveraged leases, |
| • | availability of capital and credit at commercially reasonable terms and conditions and our ability to meet cash needs, |
| • | any inability to realize anticipated tax benefits or retain tax credits, |
4
| • | changes in the cost of, or interruption in the supply of, fuel and other commodities necessary to the operation of our generating units, |
| • | delays in receipt of necessary permits and approvals for our construction and development activities, |
| • | delays or unforeseen cost escalations in our construction and development activities, |
| • | any inability to achieve or continue to sustain, our expected levels of operating performance, |
| • | increase in competition in energy supply markets as well as competition for certain rate-based transmission projects, |
| • | challenges associated with recruitment and/or retention of a qualified workforce, |
| • | adverse performance of our decommissioning and defined benefit plan trust fund investments and changes in discount rates and funding requirements, and |
| • | changes in technology and customer usage patterns. |
For further information, please refer to our Annual Report on Form 10-K, including Item 1A. Risk Factors, and subsequent reports on Form 10-Q and Form 8-K filed with the Securities and Exchange Commission. These documents address in further detail our business, industry issues and other factors that could cause actual results to differ materially from those indicated in this presentation. In addition, any forward-looking statements included herein represent our estimates only as of today and should not be relied upon as representing our estimates as of any subsequent date. While we may elect to update forward-looking statements from time to time, we specifically disclaim any obligation to do so, even if our internal estimates change, unless otherwise required by applicable securities laws.
5
Attachment 1
PUBLIC SERVICE ENTERPRISE GROUP INCORPORATED
Operating Earnings and Per Share Results by Subsidiary
(Unaudited)
| For the Three Months Ended March 31, |
||||||||
| 2012 | 2011 | |||||||
| Earnings Results ($ Millions) | ||||||||
| PSEG Power |
$ | 196 | $ | 267 | ||||
| PSE&G |
197 | 163 | ||||||
| PSEG Energy Holdings/Enterprise |
39 | 1 | ||||||
| Operating Earnings |
$ | 432 | $ | 431 | ||||
| Reconciling Items(a) |
61 | 31 | ||||||
| Income from Continuing Operations |
$ | 493 | $ | 462 | ||||
| Discontinued Operations |
— | 64 | ||||||
|
|
|
|
|
|||||
| Net Income |
$ | 493 | $ | 526 | ||||
|
|
|
|
|
|||||
| Fully Diluted Average Shares Outstanding (in Millions) |
507 | 507 | ||||||
| Per Share Results (Diluted) | ||||||||
| PSEG Power |
$ | 0.39 | $ | 0.53 | ||||
| PSE&G |
0.39 | 0.32 | ||||||
| PSEG Energy Holdings/Enterprise |
0.07 | — | ||||||
| Operating Earnings |
$ | 0.85 | $ | 0.85 | ||||
| Reconciling Items(a) |
0.12 | 0.06 | ||||||
| Income from Continuing Operations |
$ | 0.97 | $ | 0.91 | ||||
| Discontinued Operations |
— | 0.13 | ||||||
|
|
|
|
|
|||||
| Net Income |
$ | 0.97 | $ | 1.04 | ||||
|
|
|
|
|
|||||
| (a) | See attachment 10 for details of items excluded from Income from Continuing Operations to compute Operating Earnings. |
Attachment 2
PUBLIC SERVICE ENTERPRISE GROUP INCORPORATED
Consolidating Statements of Operations
(Unaudited, $ Millions)
| For the Three Months Ended March 31, 2012 | ||||||||||||||||
| PSEG | PSEG Energy Holdings/ Enterprise (a) |
PSEG POWER |
PSE&G | |||||||||||||
| OPERATING REVENUES |
$ | 2,875 | $ | (625 | ) | $ | 1,561 | $ | 1,939 | |||||||
| OPERATING EXPENSES |
||||||||||||||||
| Energy Costs |
1,179 | (645 | ) | 822 | 1,002 | |||||||||||
| Operation and Maintenance |
628 | 11 | 241 | 376 | ||||||||||||
| Depreciation and Amortization |
256 | 9 | 57 | 190 | ||||||||||||
| Taxes Other Than Income Taxes |
29 | — | — | 29 | ||||||||||||
|
|
|
|
|
|
|
|
|
|||||||||
| Total Operating Expenses |
2,092 | (625 | ) | 1,120 | 1,597 | |||||||||||
|
|
|
|
|
|
|
|
|
|||||||||
| OPERATING INCOME |
783 | — | 441 | 342 | ||||||||||||
| Other Income and (Deductions) |
28 | 3 | 15 | 10 | ||||||||||||
| Other Than Temporary Impairments |
(5 | ) | — | (5 | ) | — | ||||||||||
| Interest Expense |
(101 | ) | 2 | (30 | ) | (73 | ) | |||||||||
|
|
|
|
|
|
|
|
|
|||||||||
| INCOME FROM CONTINUING OPERATIONS BEFORE INCOME TAXES |
705 | 5 | 421 | 279 | ||||||||||||
| Income Tax Expense |
(212 | ) | 38 | (168 | ) | (82 | ) | |||||||||
|
|
|
|
|
|
|
|
|
|||||||||
| INCOME FROM CONTINUING OPERATIONS |
493 | 43 | 253 | 197 | ||||||||||||
| Discontinued Operations, net of tax |
— | — | — | — | ||||||||||||
|
|
|
|
|
|
|
|
|
|||||||||
| NET INCOME |
$ | 493 | $ | 43 | $ | 253 | $ | 197 | ||||||||
|
|
|
|
|
|
|
|
|
|||||||||
| OPERATING EARNINGS |
432 | $ | 39 | $ | 196 | $ | 197 | |||||||||
| Reconciling Items Excluded from Continuing Operations (b) |
61 | 4 | 57 | — | ||||||||||||
|
|
|
|
|
|
|
|
|
|||||||||
| INCOME FROM CONTINUING OPERATIONS |
$ | 493 | $ | 43 | $ | 253 | $ | 197 | ||||||||
|
|
|
|
|
|
|
|
|
|||||||||
| For the Three Months Ended March 31, 2011 | ||||||||||||||||
| PSEG | PSEG Energy Holdings/ Enterprise (a) |
PSEG POWER |
PSE&G | |||||||||||||
| OPERATING REVENUES |
$ | 3,354 | $ | (919 | ) | $ | 1,967 | $ | 2,306 | |||||||
| OPERATING EXPENSES |
||||||||||||||||
| Energy Costs |
1,563 | (938 | ) | 1,135 | 1,366 | |||||||||||
| Operation and Maintenance |
651 | 6 | 277 | 368 | ||||||||||||
| Depreciation and Amortization |
241 | 8 | 54 | 179 | ||||||||||||
| Taxes Other Than Income Taxes |
43 | — | — | 43 | ||||||||||||
|
|
|
|
|
|
|
|
|
|||||||||
| Total Operating Expenses |
2,498 | (924 | ) | 1,466 | 1,956 | |||||||||||
|
|
|
|
|
|
|
|
|
|||||||||
| OPERATING INCOME |
856 | 5 | 501 | 350 | ||||||||||||
| Income from Equity Method Investments |
3 | 3 | — | — | ||||||||||||
| Other Income and (Deductions) |
63 | 1 | 58 | 4 | ||||||||||||
| Other Than Temporary Impairments |
(4 | ) | (1 | ) | (2 | ) | (1 | ) | ||||||||
| Interest Expense |
(127 | ) | 3 | (51 | ) | (79 | ) | |||||||||
|
|
|
|
|
|
|
|
|
|||||||||
| INCOME FROM CONTINUING OPERATIONS BEFORE INCOME TAXES |
791 | 11 | 506 | 274 | ||||||||||||
| Income Tax Benefit (Expense) |
(329 | ) | (10 | ) | (208 | ) | (111 | ) | ||||||||
|
|
|
|
|
|
|
|
|
|||||||||
| INCOME FROM CONTINUING OPERATIONS |
462 | 1 | 298 | 163 | ||||||||||||
| Discontinued Operations, net of tax |
64 | — | 64 | — | ||||||||||||
|
|
|
|
|
|
|
|
|
|||||||||
| NET INCOME |
$ | 526 | $ | 1 | $ | 362 | $ | 163 | ||||||||
|
|
|
|
|
|
|
|
|
|||||||||
| OPERATING EARNINGS (LOSS) |
$ | 431 | $ | 1 | $ | 267 | $ | 163 | ||||||||
| Reconciling Items Excluded from Continuing Operations (b) |
31 | — | 31 | — | ||||||||||||
|
|
|
|
|
|
|
|
|
|||||||||
| INCOME (LOSS) FROM CONTINUING OPERATIONS |
$ | 462 | $ | 1 | $ | 298 | $ | 163 | ||||||||
|
|
|
|
|
|
|
|
|
|||||||||
| (a) | Includes activities at Energy Holdings and the Parent as well as intercompany eliminations. |
| (b) | See attachment 10 for details of items excluded from Income from Continuing Operations to compute Operating Earnings. |
Attachment 3
PUBLIC SERVICE ENTERPRISE GROUP INCORPORATED
Capitalization Schedule
(Unaudited, $ Millions)
| March 31, 2012 |
December 31, 2011 |
|||||||
| DEBT |
||||||||
| Commercial Paper and Loans |
$ | 29 | $ | — | ||||
| Long-Term Debt |
6,994 | 7,060 | ||||||
| Securitization Debt |
889 | 939 | ||||||
| Project Level, Non-Recourse Debt |
95 | 95 | ||||||
|
|
|
|
|
|||||
| Total Debt |
8,007 | 8,094 | ||||||
| STOCKHOLDERS’ EQUITY |
||||||||
| Common Stock |
4,823 | 4,823 | ||||||
| Treasury Stock |
(605 | ) | (601 | ) | ||||
| Retained Earnings |
6,699 | 6,385 | ||||||
| Accumulated Other Comprehensive Loss |
(293 | ) | (337 | ) | ||||
|
|
|
|
|
|||||
| Total Common Stockholders’ Equity |
10,624 | 10,270 | ||||||
| Noncontrolling Interests - Equity Investments |
2 | 2 | ||||||
|
|
|
|
|
|||||
| Total Equity |
10,626 | 10,272 | ||||||
|
|
|
|
|
|||||
| Total Capitalization |
$ | 18,633 | $ | 18,366 | ||||
|
|
|
|
|
|||||
Attachment 4
PUBLIC SERVICE ENTERPRISE GROUP INCORPORATED
CONDENSED CONSOLIDATED STATEMENTS OF CASH FLOWS
(Unaudited, $ Millions)
| For the Three Months Ended March 31, | ||||||||
| 2012 | 2011 | |||||||
| CASH FLOWS FROM OPERATING ACTIVITIES |
||||||||
| Net Income |
$ | 493 | $ | 526 | ||||
| Adjustments to Reconcile Net Income to Net Cash Flows From Operating Activities |
595 | 516 | ||||||
|
|
|
|
|
|||||
| NET CASH PROVIDED BY OPERATING ACTIVITIES |
1,088 | 1,042 | ||||||
|
|
|
|
|
|||||
| NET CASH USED IN INVESTING ACTIVITIES |
(706 | ) | (155 | ) | ||||
|
|
|
|
|
|||||
| NET CASH USED IN FINANCING ACTIVITIES |
(285 | ) | (267 | ) | ||||
|
|
|
|
|
|||||
| Net Increase in Cash and Cash Equivalents |
97 | 620 | ||||||
| Cash and Cash Equivalents at Beginning of Period |
834 | 280 | ||||||
|
|
|
|
|
|||||
| Cash and Cash Equivalents at End of Period |
$ | 931 | $ | 900 | ||||
|
|
|
|
|
|||||
Attachment 5
PUBLIC SERVICE ENTERPRISE GROUP INCORPORATED
Quarter-over-Quarter EPS Reconciliation
March 31, 2012 vs. March 31, 2011
(Unaudited)
Attachment 6
PSEG POWER LLC
Generation Measures
(Unaudited)
| GWhr Breakdown | ||||||||
| Three Months Ended | ||||||||
| March 31, | ||||||||
| 2012 | 2011 | |||||||
| Nuclear - NJ |
5,436 | 5,465 | ||||||
| Nuclear - PA |
2,534 | 2,463 | ||||||
|
|
|
|
|
|||||
| Total Nuclear |
7,970 | 7,928 | ||||||
| Fossil - Coal/Natural Gas - NJ* |
44 | 728 | ||||||
| Fossil - Coal - PA |
1,063 | 1,377 | ||||||
| Fossil - Coal - CT |
23 | 207 | ||||||
|
|
|
|
|
|||||
| Total Coal |
1,130 | 2,312 | ||||||
| Fossil - Oil & Natural Gas - NJ |
2,840 | 2,753 | ||||||
| Fossil - Oil & Natural Gas - NY |
1,211 | 1,026 | ||||||
| Fossil - Oil & Natural Gas - CT |
(8 | ) | 11 | |||||
|
|
|
|
|
|||||
| Total Oil & Natural Gas |
4,043 | 3,790 | ||||||
|
|
|
|
|
|||||
| 13,143 | 14,030 | |||||||
| % Generation by Fuel Type | ||||||||
| Three Months Ended | ||||||||
| March 31, | ||||||||
| 2012 | 2011 | |||||||
| Nuclear - NJ |
42 | % | 39 | % | ||||
| Nuclear - PA |
19 | % | 18 | % | ||||
|
|
|
|
|
|||||
| Total Nuclear |
61 | % | 57 | % | ||||
| Fossil - Coal/Natural Gas - NJ* |
0 | % | 5 | % | ||||
| Fossil - Coal - PA |
8 | % | 10 | % | ||||
| Fossil - Coal - CT |
0 | % | 1 | % | ||||
|
|
|
|
|
|||||
| Total Coal |
8 | % | 16 | % | ||||
| Fossil - Oil & Natural Gas - NJ |
22 | % | 20 | % | ||||
| Fossil - Oil & Natural Gas - NY |
9 | % | 7 | % | ||||
| Fossil - Oil & Natural Gas - CT |
0 | % | 0 | % | ||||
|
|
|
|
|
|||||
| Total Oil & Natural Gas |
31 | % | 27 | % | ||||
|
|
|
|
|
|||||
| 100 | % | 100 | % | |||||
| * | Includes Pumped Storage. Pumped Storage accounted for <1% of total generation for the three months ended March 31, 2012 and 2011. |
Attachment 7
PUBLIC SERVICE ELECTRIC & GAS COMPANY
Retail Sales and Revenues
(Unaudited)
March 31, 2012
Electric Sales and Revenues
| Sales (millions kwh) |
Three Months Ended |
Change vs. 2011 |
||||||
| Residential |
2,990 | -7.4 | % | |||||
| Commercial & Industrial |
6,751 | -3.7 | % | |||||
| Street Lighting |
90 | -12.3 | % | |||||
| Interdepartmental |
3 | -5.4 | % | |||||
|
|
|
|
|
|||||
| Total |
9,834 | -4.9 | % | |||||
|
|
|
|
|
|||||
| Revenue (in millions) |
||||||||
| Residential |
$ | 493 | -10.5 | % | ||||
| Commercial & Industrial |
490 | -7.0 | % | |||||
| Street Lighting |
21 | 2.6 | % | |||||
| Other Operating Revenues* |
91 | 3.5 | % | |||||
|
|
|
|
|
|||||
| Total |
$ | 1,095 | -7.7 | % | ||||
|
|
|
|
|
|||||
| Weather Data |
Three Months Ended |
Change vs. 2011 |
||||||
| THI Hours - Actual |
81 | 309.0 | % | |||||
| THI Hours - Normal |
24 | |||||||
| * | Primarily sales of Non-Utility Generator energy to PJM and Transmission related revenues. |
Attachment 8
PUBLIC SERVICE ELECTRIC & GAS COMPANY
Retail Sales and Revenues
(Unaudited)
March 31, 2012
Gas Sold and Transported
| Sales (millions therms) |
Three Months Ended |
Change vs. 2011 |
||||||
| Residential Sales |
528 | -21.1 | % | |||||
| Commercial & Industrial - Firm Sales |
191 | -22.4 | % | |||||
| Commercial & Industrial - Interr. & Cogen |
24 | -31.3 | % | |||||
|
|
|
|
|
|||||
| Total |
743 | -21.8 | % | |||||
|
|
|
|
|
|||||
| Gas Transported - Firm Sales |
211 | -11.6 | % | |||||
| Gas Transported - Non-Firm |
277 | 21.1 | % | |||||
| Revenue (in millions) |
||||||||
| Residential Sales |
$ | 271 | -35.0 | % | ||||
| Commercial & Industrial - Firm Sales |
97 | -38.9 | % | |||||
| Commercial & Industrial - Interr. & Cogen |
11 | -45.9 | % | |||||
| Other Operating Revenues* |
38 | 1.9 | % | |||||
|
|
|
|
|
|||||
| Total |
$ | 417 | -34.2 | % | ||||
|
|
|
|
|
|||||
| Gas Transported |
427 | -12.2 | % | |||||
| Weather Data |
Three Months Ended |
Change vs. 2011 |
||||||
| Degree Days - Actual |
2,025 | -20.9 | % | |||||
| Degree Days - Normal |
2,558 | |||||||
| * | Primarily Appliance Service. |
Attachment 9
PUBLIC SERVICE ENTERPRISE GROUP INCORPORATED
Statistical Measures
(Unaudited)
| For the Three Months Ended | ||||||||
| March 31 | ||||||||
| 2012 | 2011 | |||||||
| Weighted Average Common Shares Outstanding (000’s) |
||||||||
| Basic |
506,010 | 505,979 | ||||||
| Diluted |
507,029 | 507,132 | ||||||
| Stock Price at End of Period |
$ | 30.61 | $ | 31.51 | ||||
| Dividends Paid per Share of Common Stock |
$ | 0.3550 | $ | 0.3425 | ||||
| Dividend Payout Ratio* |
50.5 | % | 44.2 | % | ||||
| Dividend Yield |
4.6 | % | 4.3 | % | ||||
| Price/Earnings Ratio* |
11.2 | 10.2 | ||||||
| Rate of Return on Average Common Equity* |
13.6 | % | 16.7 | % | ||||
| Book Value per Common Share |
$ | 21.00 | $ | 19.68 | ||||
| Market Price as a Percent of Book Value |
146 | % | 160 | % | ||||
| Total Shareholder Return |
-6.18 | % | 0.13 | % | ||||
| * | Calculation based on Operating Earnings for the 12 month period ended. |
Attachment 10
PUBLIC SERVICE ENTERPRISE GROUP INCORPORATED
Reconciling Items Excluded from Continuing Operations to Compute Operating Earnings
(Unaudited)
| Pro-forma Adjustments, net of tax |
For the Three Months Ended | For the Year Ended | ||||||||||||||
| March 31, | December 31, | |||||||||||||||
| 2012 | 2011 | 2011 | 2010 | |||||||||||||
| Earnings Impact ($ Millions) | ||||||||||||||||
| Gain (Loss) on Nuclear Decommissioning Trust (NDT) Fund Related Activity (PSEG Power) |
$ | 5 | $ | 27 | $ | 50 | $ | 46 | ||||||||
| Gain (Loss) on Mark-to-Market (MTM)(a) (PSEG Power) |
52 | 4 | 107 | (1 | ) | |||||||||||
| Lease Related Activity (PSEG Energy Holdings) |
4 | — | (173 | ) | — | |||||||||||
| Market Transition Charge Refund (PSE&G) |
— | — | — | (72 | ) | |||||||||||
| Gain on Sale of Qwest Building (Energy Holdings) |
— | — | 34 | — | ||||||||||||
|
|
|
|
|
|
|
|
|
|||||||||
| Total Pro-forma adjustments |
$ | 61 | $ | 31 | $ | 18 | $ | (27 | ) | |||||||
| Fully Diluted Average Shares Outstanding (in Millions) |
507 | 507 | 507 | 507 | ||||||||||||
| Per Share Impact (Diluted) | ||||||||||||||||
| Gain (Loss) on NDT Fund Related Activity (PSEG Power) |
$ | 0.01 | $ | 0.05 | $ | 0.10 | $ | 0.09 | ||||||||
| Gain (Loss) on MTM(a) (PSEG Power) |
0.10 | 0.01 | 0.21 | — | ||||||||||||
| Lease Related Activity (PSEG Energy Holdings) |
0.01 | — | (0.34 | ) | — | |||||||||||
| Market Transition Charge Refund (PSE&G) |
— | — | — | (0.14 | ) | |||||||||||
| Gain on Sale of Qwest Building (Energy Holdings) |
— | — | 0.06 | — | ||||||||||||
|
|
|
|
|
|
|
|
|
|||||||||
| Total Pro-forma adjustments |
$ | 0.12 | $ | 0.06 | $ | 0.03 | $ | (0.05 | ) | |||||||
| (a) | Includes the financial impact from positions with forward delivery months. |