Attached files
| file | filename |
|---|---|
| 8-K - 8-K - VEECO INSTRUMENTS INC | a12-10775_18k.htm |
| EX-99.1 - EX-99.1 - VEECO INSTRUMENTS INC | a12-10775_1ex99d1.htm |
Exhibit 99.2
|
|
Q1 2012 Financial Results Earnings Conference Call April 30, 2012 |
|
|
4/30/12 To the extent that this presentation discusses expectations or otherwise makes statements about the future, such statements are forward-looking and are subject to a number of risks and uncertainties that could cause actual results to differ materially from the statements made. These items include the risk factors discussed in the Business Description and Management's Discussion and Analysis sections of Veeco's Annual Report on Form 10-K for the year ended December 31, 2011 and subsequent Quarterly Reports on Form 10-Q and current reports on Form 8-K. Veeco does not undertake any obligation to update any forward-looking statements to reflect future events or circumstances after the date of such statements. In addition, this presentation includes non-GAAP financial measures. For GAAP reconciliation, please refer to the reconciliation section in this presentation as well as Veeco’s financial press releases and 10-K and 10-Q filings available on www.veeco.com. Note: All results presented herein are for Veeco’s “Continuing Operations” which excludes the Metrology business sold to Bruker Corporation on October 7, 2010 and reflects the discontinuation of Veeco’s CIGS Solar Systems Business in the third quarter of 2011. Safe Harbor Statement |
|
|
Introduction John Peeler, Chief Executive Officer |
|
|
Financial Highlights David Glass, Chief Financial Officer |
|
|
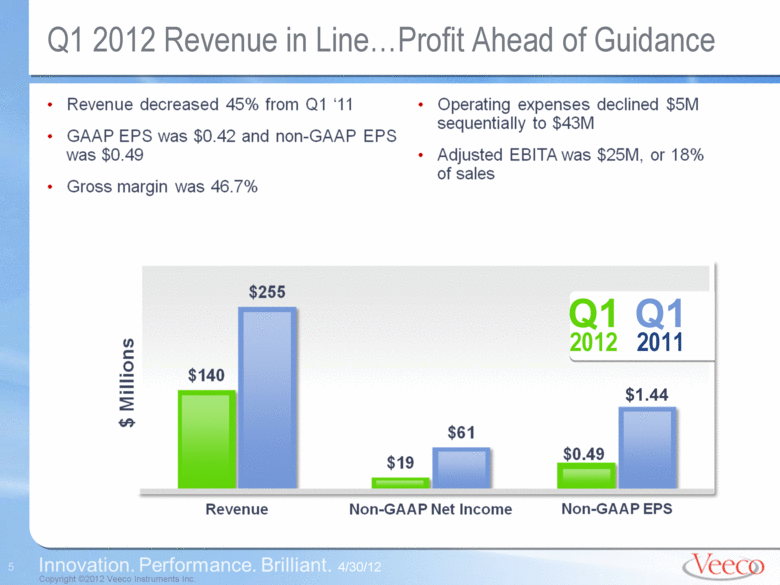
Q1 2012 Revenue in Line...Profit Ahead of Guidance z Q1 2012 Q1 2011 $1.44 4/30/12 |
|
|
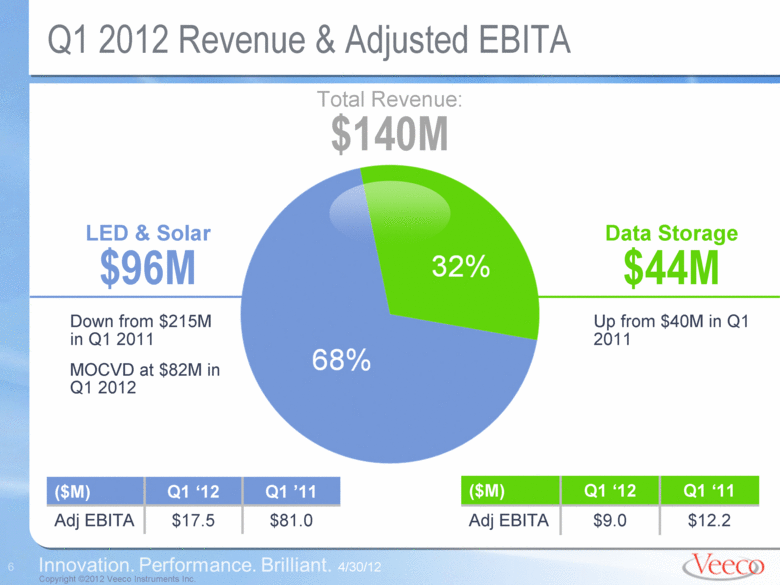
Total Revenue: $140M Q1 2012 Revenue & Adjusted EBITA LED & Solar $96M Down from $215M in Q1 2011 MOCVD at $82M in Q1 2012 ($M) Q1 ‘12 Q1 ’11 Adj EBITA $17.5 $81.0 ($M) Q1 ‘12 Q1 ‘11 Adj EBITA $9.0 $12.2 Data Storage $44M Up from $40M in Q1 2011 4/30/12 |
|
|
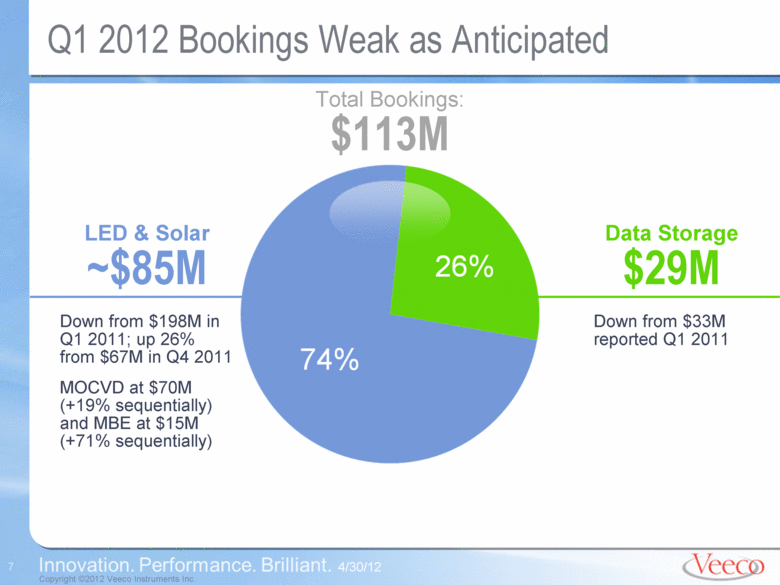
Total Bookings: $113M Q1 2012 Bookings Weak as Anticipated LED & Solar ~$85M Down from $198M in Q1 2011; up 26% from $67M in Q4 2011 MOCVD at $70M (+19% sequentially) and MBE at $15M (+71% sequentially) Data Storage $29M Down from $33M reported Q1 2011 4/30/12 |
|
|
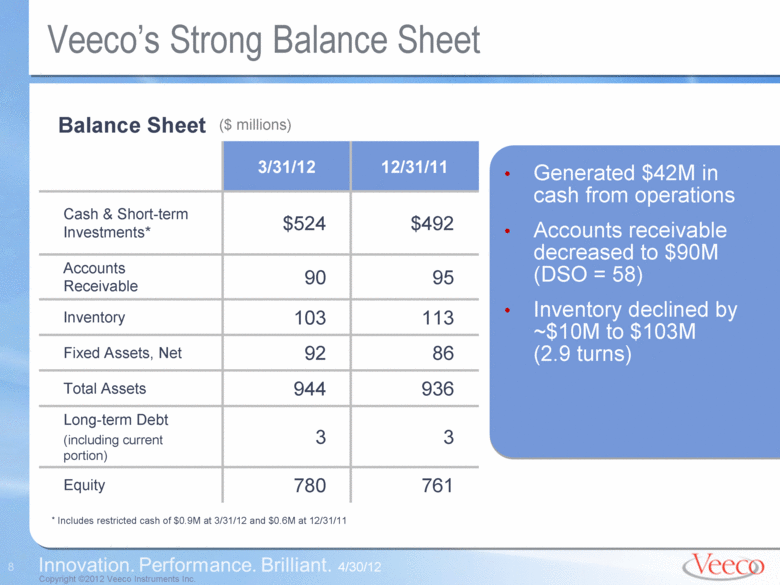
Veeco’s Strong Balance Sheet 3/31/12 12/31/11 Cash & Short-term Investments* $524 $492 Accounts Receivable 90 95 Inventory 103 113 Fixed Assets, Net 92 86 Total Assets 944 936 Long-term Debt (including current portion) 3 3 Equity 780 761 4/30/12 Generated $42M in cash from operations Accounts receivable decreased to $90M (DSO = 58) Inventory declined by ~$10M to $103M (2.9 turns) ($ millions) Balance Sheet * Includes restricted cash of $0.9M at 3/31/12 and $0.6M at 12/31/11 |
|
|
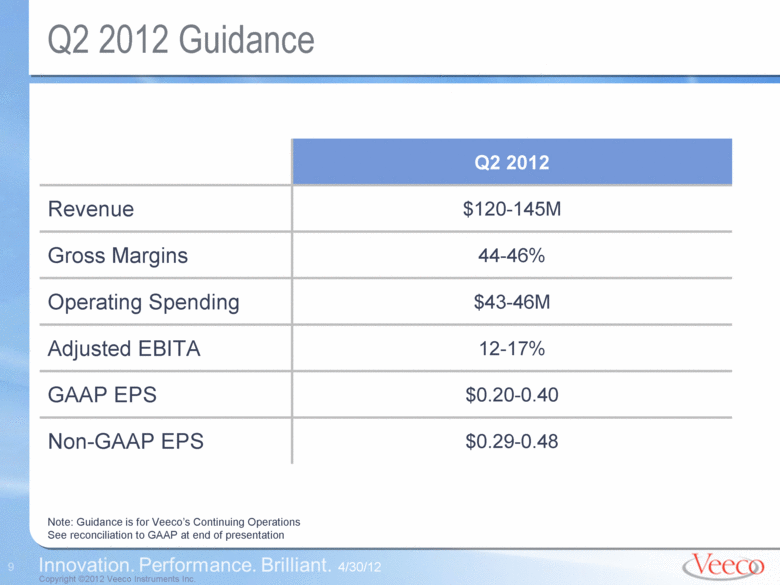
Q2 2012 Guidance 4/30/12 Note: Guidance is for Veeco’s Continuing Operations See reconciliation to GAAP at end of presentation Q2 2012 Revenue $120-145M Gross Margins 44-46% Operating Spending $43-46M Adjusted EBITA 12-17% GAAP EPS $0.20-0.40 Non-GAAP EPS $0.29-0.48 |
|
|
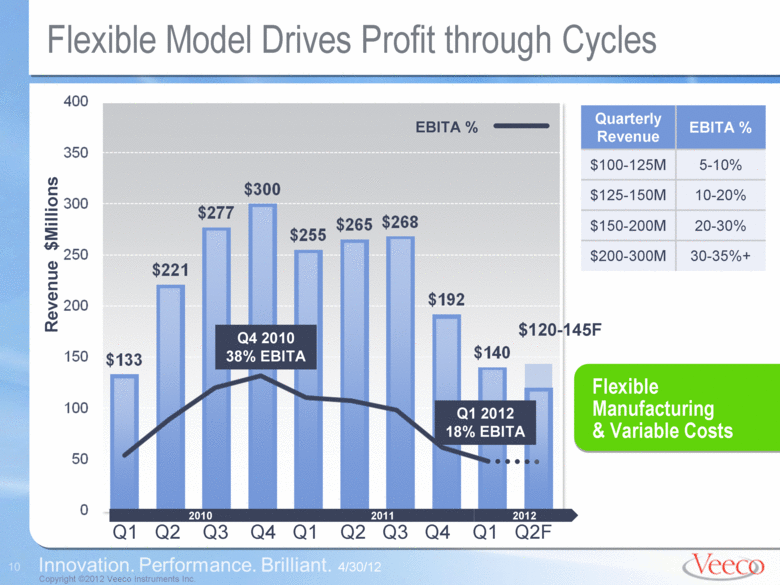
4/30/12 Flexible Model Drives Profit through Cycles Quarterly Revenue EBITA % $100-125M 5-10% $125-150M 10-20% $150-200M 20-30% $200-300M 30-35%+ Revenue $Millions 2010 2011 2012 Flexible Manufacturing & Variable Costs $120-145F EBITA % Q1 Q2 Q3 Q4 Q1 Q2 Q3 Q4 Q1 Q2F Q1 2012 18% EBITA Q4 2010 38% EBITA |
|
|
Business Outlook John Peeler, Chief Executive Officer |
|
|
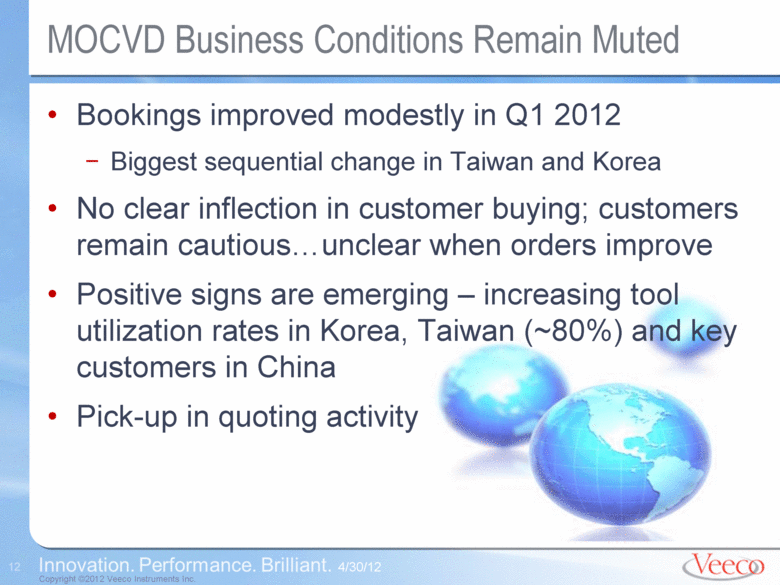
MOCVD Business Conditions Remain Muted 4/30/12 Bookings improved modestly in Q1 2012 Biggest sequential change in Taiwan and Korea No clear inflection in customer buying; customers remain cautious...unclear when orders improve Positive signs are emerging – increasing tool utilization rates in Korea, Taiwan (~80%) and key customers in China Pick-up in quoting activity |
|
|
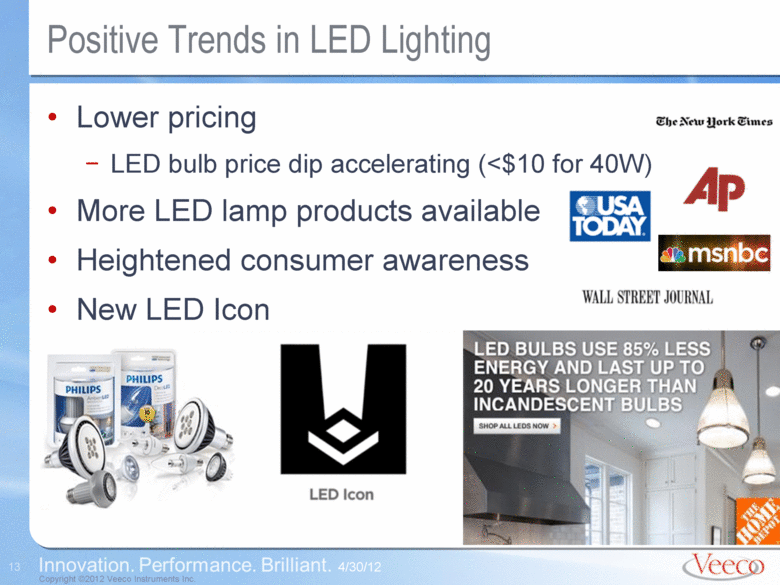
4/30/12 Lower pricing LED bulb price dip accelerating (<$10 for 40W) More LED lamp products available Heightened consumer awareness New LED Icon Positive Trends in LED Lighting |
|
|
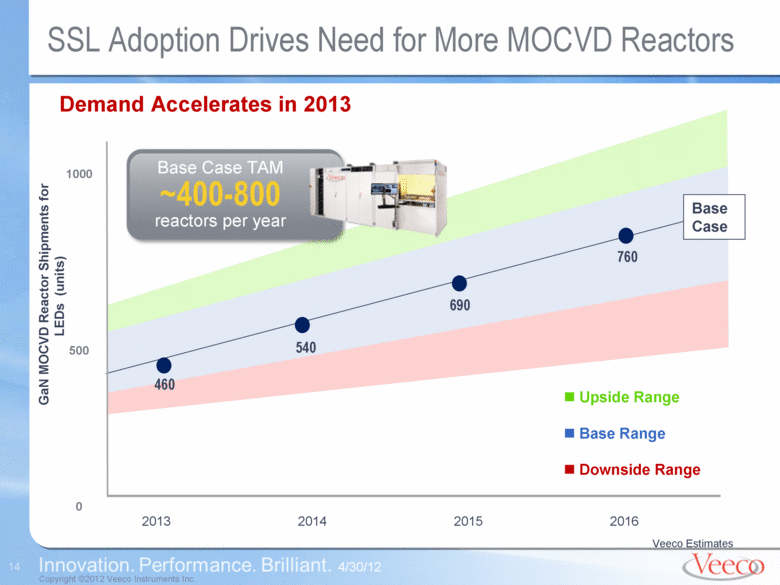
SSL Adoption Drives Need for More MOCVD Reactors 4/30/12 2013 2014 2015 2016 1000 500 0 Demand Accelerates in 2013 Base Case TAM ~400-800 reactors per year 540 690 760 Base Case GaN MOCVD Reactor Shipments for LEDs (units) Upside Range Base Range Downside Range 460 Veeco Estimates |
|
|
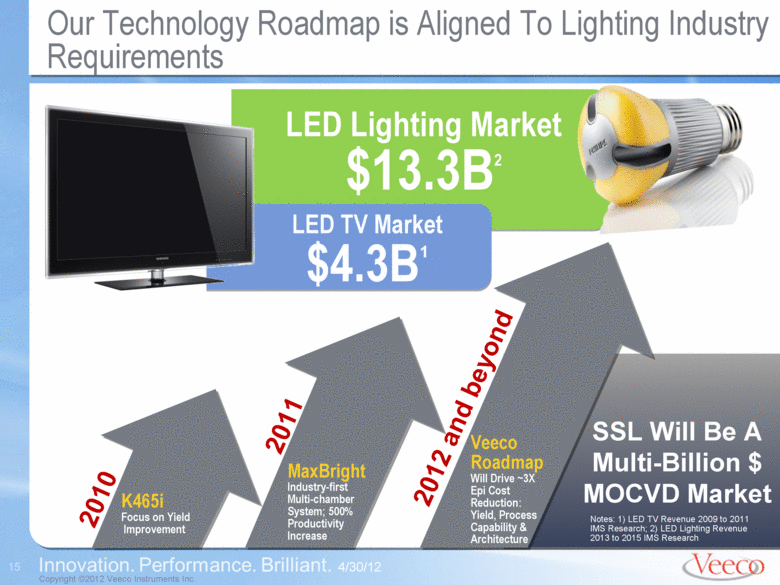
Our Technology Roadmap is Aligned To Lighting Industry Requirements 4/30/12 LED TV Market $4.3B1 LED Lighting Market $13.3B2 Veeco Roadmap Will Drive ~3X Epi Cost Reduction: Yield, Process Capability & Architecture 2010 2011 2012 and beyond SSL Will Be A Multi-Billion $ MOCVD Market MaxBright Industry-first Multi-chamber System; 500% Productivity Increase K465i Focus on Yield Improvement Notes: 1) LED TV Revenue 2009 to 2011 IMS Research; 2) LED Lighting Revenue 2013 to 2015 IMS Research |
|
|
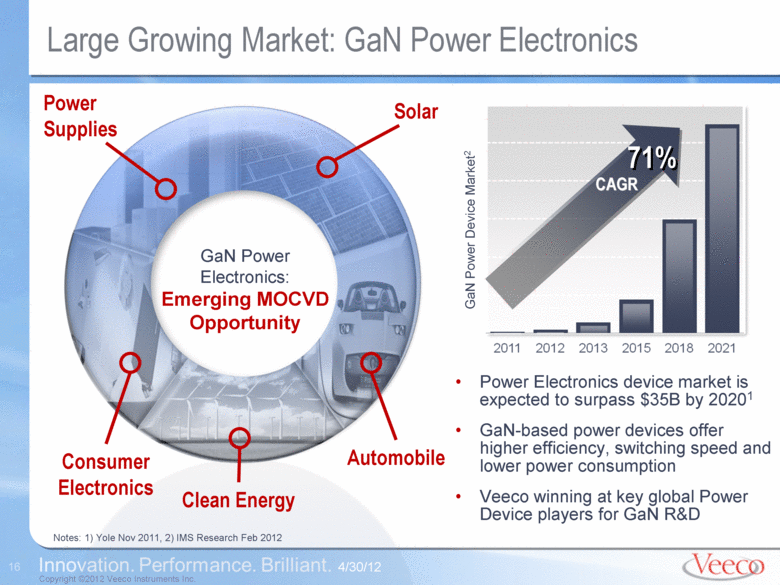
GaN Power Electronics: Emerging MOCVD Opportunity Large Growing Market: GaN Power Electronics Power Electronics device market is expected to surpass $35B by 20201 GaN-based power devices offer higher efficiency, switching speed and lower power consumption Veeco winning at key global Power Device players for GaN R&D Notes: 1) Yole Nov 2011, 2) IMS Research Feb 2012 Power Supplies Solar Consumer Electronics Clean Energy Automobile 4/30/12 GaN Power Device Market2 71% CAGR |
|
|
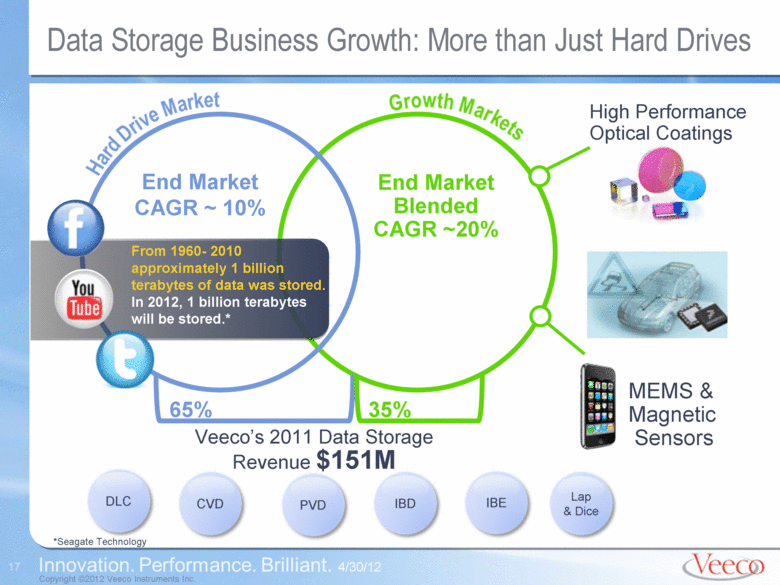
Data Storage Business Growth: More than Just Hard Drives 4/30/12 End Market Blended CAGR ~20% High Performance Optical Coatings MEMS & Magnetic Sensors Veeco’s 2011 Data Storage Revenue $151M 65% 35% *Seagate Technology End Market CAGR ~ 10% Lap & Dice From 1960- 2010 approximately 1 billion terabytes of data was stored. In 2012, 1 billion terabytes will be stored.* |
|
|
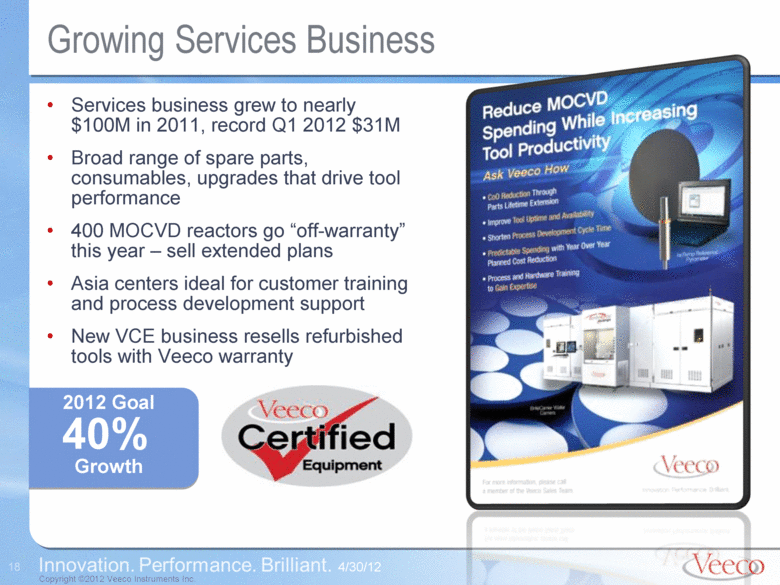
Growing Services Business Services business grew to nearly $100M in 2011, record Q1 2012 $31M Broad range of spare parts, consumables, upgrades that drive tool performance 400 MOCVD reactors go “off-warranty” this year – sell extended plans Asia centers ideal for customer training and process development support New VCE business resells refurbished tools with Veeco warranty 4/30/12 2012 Goal 40% Growth |
|
|
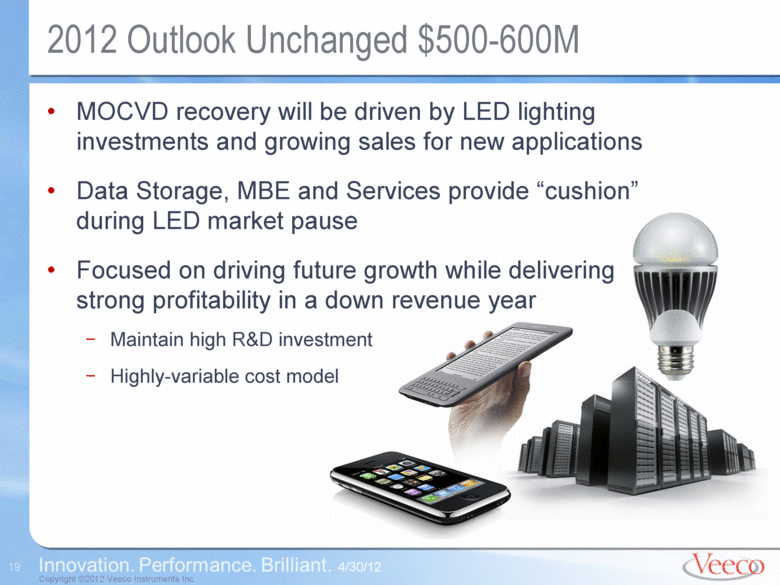
2012 Outlook Unchanged $500-600M 4/30/12 MOCVD recovery will be driven by LED lighting investments and growing sales for new applications Data Storage, MBE and Services provide “cushion” during LED market pause Focused on driving future growth while delivering strong profitability in a down revenue year Maintain high R&D investment Highly-variable cost model |
|
|
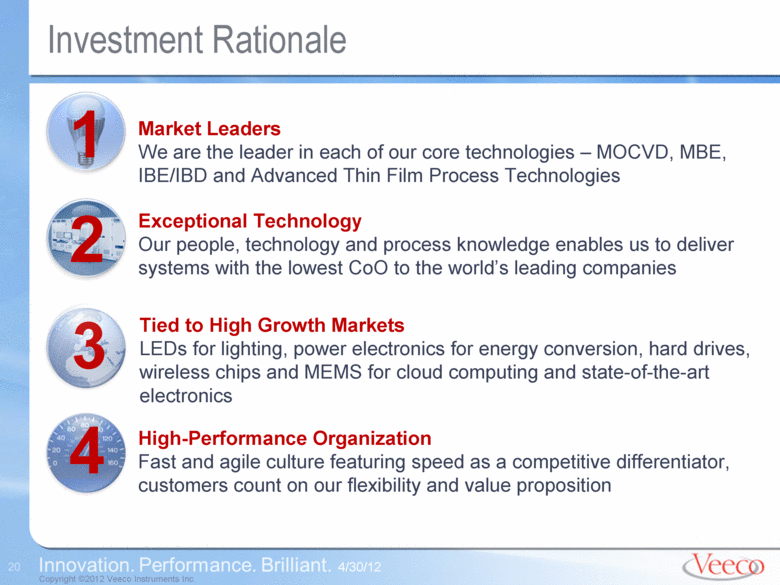
Investment Rationale 4/30/12 1 Market Leaders We are the leader in each of our core technologies – MOCVD, MBE, IBE/IBD and Advanced Thin Film Process Technologies 2 Exceptional Technology Our people, technology and process knowledge enables us to deliver systems with the lowest CoO to the world’s leading companies 3 Tied to High Growth Markets LEDs for lighting, power electronics for energy conversion, hard drives, wireless chips and MEMS for cloud computing and state-of-the-art electronics 4 High-Performance Organization Fast and agile culture featuring speed as a competitive differentiator, customers count on our flexibility and value proposition |
|
|
Additional Financial Slides |
|
|
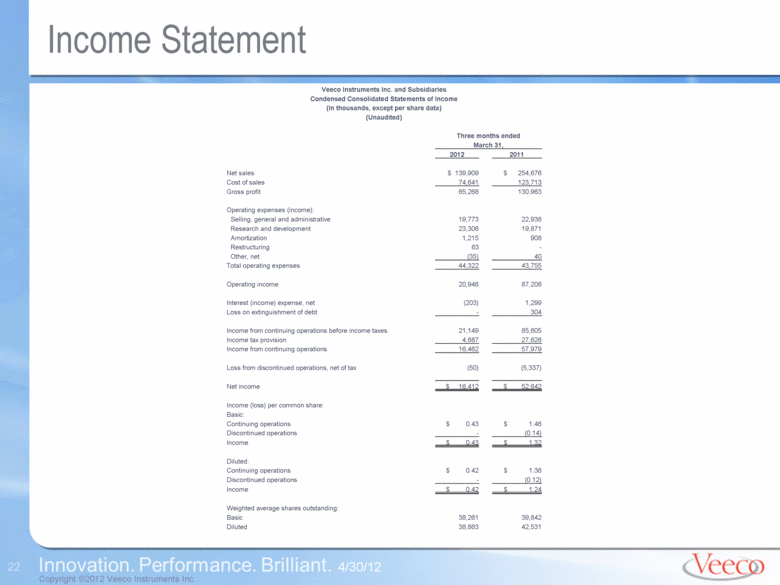
4/30/12 Income Statement Veeco Instruments Inc. and Subsidiaries Condensed Consolidated Statements of Income (In thousands, except per share data) (Unaudited) Three months ended March 31, 2012 2011 Net sales $ 139,909 $ 254,676 Cost of sales 74,641 123,713 Gross profit 65,268 130,963 Operating expenses (income): Selling, general and administrative 19,773 22,936 Research and development 23,306 19,871 Amortization 1,215 908 Restructuring 63 - Other, net (35) 40 Total operating expenses 44,322 43,755 Operating income 20,946 87,208 Interest (income) expense, net (203) 1,299 Loss on extinguishment of debt - 304 Income from continuing operations before income taxes 21,149 85,605 Income tax provision 4,687 27,626 Income from continuing operations 16,462 57,979 Loss from discontinued operations, net of tax (50) (5,337) Net income $ 16,412 $ 52,642 Income (loss) per common share: Basic: Continuing operations $ 0.43 $ 1.46 Discontinued operations - (0.14) Income $ 0.43 $ 1.32 Diluted: Continuing operations $ 0.42 $ 1.36 Discontinued operations - (0.12) Income $ 0.42 $ 1.24 Weighted average shares outstanding: Basic 38,261 39,842 Diluted 38,863 42,531 |
|
|
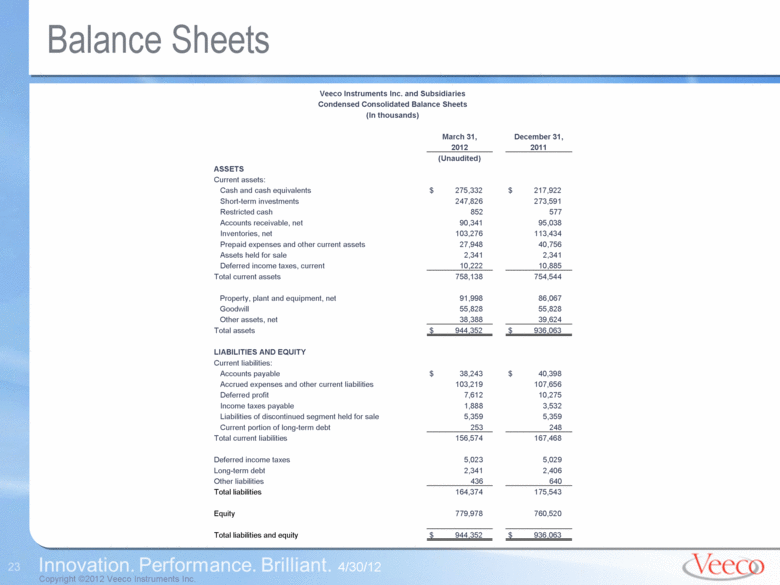
4/30/12 Balance Sheets Veeco Instruments Inc. and Subsidiaries Condensed Consolidated Balance Sheets (In thousands) March 31, December 31, 2012 2011 (Unaudited) ASSETS Current assets: Cash and cash equivalents $ 275,332 $ 217,922 Short-term investments 247,826 273,591 Restricted cash 852 577 Accounts receivable, net 90,341 95,038 Inventories, net 103,276 113,434 Prepaid expenses and other current assets 27,948 40,756 Assets held for sale 2,341 2,341 Deferred income taxes, current 10,222 10,885 Total current assets 758,138 754,544 Property, plant and equipment, net 91,998 86,067 Goodwill 55,828 55,828 Other assets, net 38,388 39,624 Total assets $ 944,352 $ 936,063 LIABILITIES AND EQUITY Current liabilities: Accounts payable $ 38,243 $ 40,398 Accrued expenses and other current liabilities 103,219 107,656 Deferred profit 7,612 10,275 Income taxes payable 1,888 3,532 Liabilities of discontinued segment held for sale 5,359 5,359 Current portion of long-term debt 253 248 Total current liabilities 156,574 167,468 Deferred income taxes 5,023 5,029 Long-term debt 2,341 2,406 Other liabilities 436 640 Total liabilities 164,374 175,543 Equity 779,978 760,520 Total liabilities and equity $ 944,352 $ 936,063 |
|
|
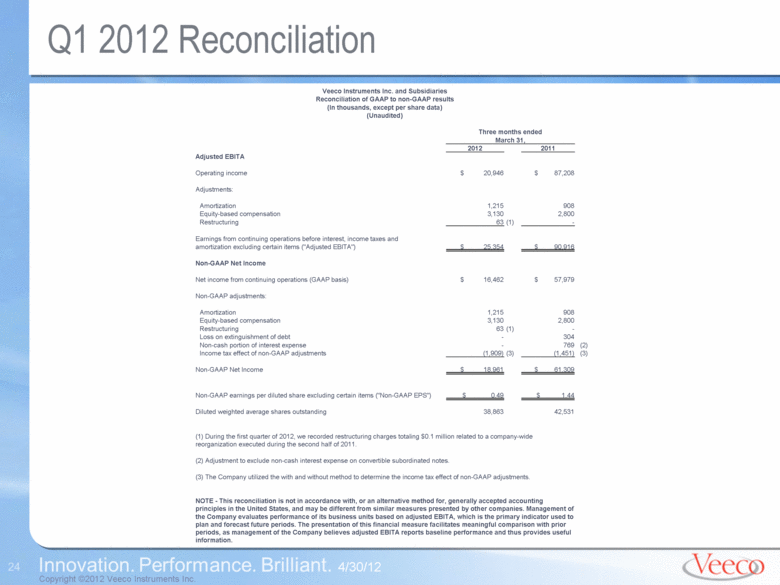
4/30/12 Q1 2012 Reconciliation Veeco Instruments Inc. and Subsidiaries Reconciliation of GAAP to non-GAAP results (In thousands, except per share data) (Unaudited) Three months ended March 31, 2012 2011 Adjusted EBITA Operating income $ 20,946 $ 87,208 Adjustments: Amortization 1,215 908 Equity-based compensation 3,130 2,800 Restructuring 63 (1) - Earnings from continuing operations before interest, income taxes and amortization excluding certain items ("Adjusted EBITA") $ 25,354 $ 90,916 Non-GAAP Net Income Net income from continuing operations (GAAP basis) $ 16,462 $ 57,979 Non-GAAP adjustments: Amortization 1,215 908 Equity-based compensation 3,130 2,800 Restructuring 63 (1) - Loss on extinguishment of debt - 304 Non-cash portion of interest expense - 769 (2) Income tax effect of non-GAAP adjustments (1,909) (3) (1,451) (3) Non-GAAP Net Income $ 18,961 $ 61,309 Non-GAAP earnings per diluted share excluding certain items ("Non-GAAP EPS") $ 0.49 $ 1.44 Diluted weighted average shares outstanding 38,863 42,531 (1) During the first quarter of 2012, we recorded restructuring charges totaling $0.1 million related to a company-wide reorganization executed during the second half of 2011. (2) Adjustment to exclude non-cash interest expense on convertible subordinated notes. (3) The Company utilized the with and without method to determine the income tax effect of non-GAAP adjustments. NOTE - This reconciliation is not in accordance with, or an alternative method for, generally accepted accounting principles in the United States, and may be different from similar measures presented by other companies. Management of the Company evaluates performance of its business units based on adjusted EBITA, which is the primary indicator used to plan and forecast future periods. The presentation of this financial measure facilitates meaningful comparison with prior periods, as management of the Company believes adjusted EBITA reports baseline performance and thus provides useful information. |
|
|
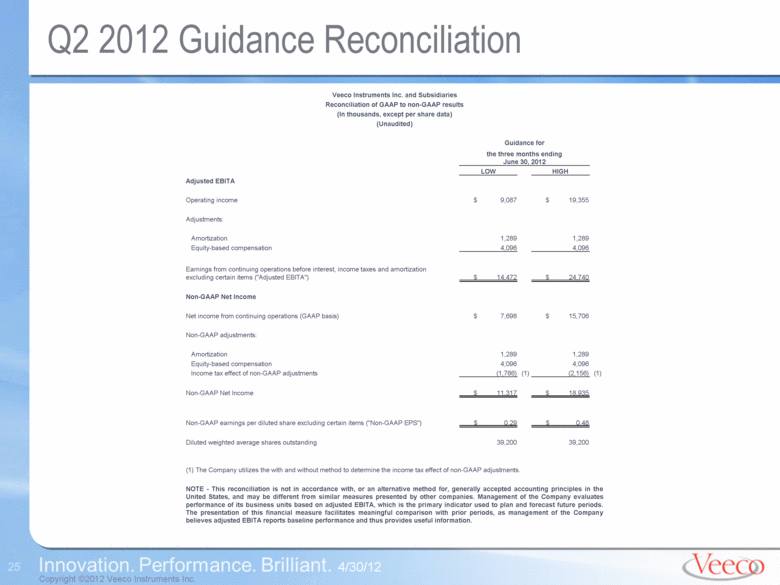
4/30/12 Q2 2012 Guidance Reconciliation Veeco Instruments Inc. and Subsidiaries Reconciliation of GAAP to non-GAAP results (In thousands, except per share data) (Unaudited) Guidance for the three months ending June 30, 2012 LOW HIGH Adjusted EBITA Operating income $ 9,087 $ 19,355 Adjustments: Amortization 1,289 1,289 Equity-based compensation 4,096 4,096 Earnings from continuing operations before interest, income taxes and amortization excluding certain items ("Adjusted EBITA") $ 14,472 $ 24,740 Non-GAAP Net Income Net income from continuing operations (GAAP basis) $ 7,698 $ 15,706 Non-GAAP adjustments: Amortization 1,289 1,289 Equity-based compensation 4,096 4,096 Income tax effect of non-GAAP adjustments (1,766) (1) (2,156) (1) Non-GAAP Net Income $ 11,317 $ 18,935 Non-GAAP earnings per diluted share excluding certain items ("Non-GAAP EPS") $ 0.29 $ 0.48 Diluted weighted average shares outstanding 39,200 39,200 (1) The Company utilizes the with and without method to determine the income tax effect of non-GAAP adjustments. NOTE - This reconciliation is not in accordance with, or an alternative method for, generally accepted accounting principles in the United States, and may be different from similar measures presented by other companies. Management of the Company evaluates performance of its business units based on adjusted EBITA, which is the primary indicator used to plan and forecast future periods. The presentation of this financial measure facilitates meaningful comparison with prior periods, as management of the Company believes adjusted EBITA reports baseline performance and thus provides useful information. |
|
|
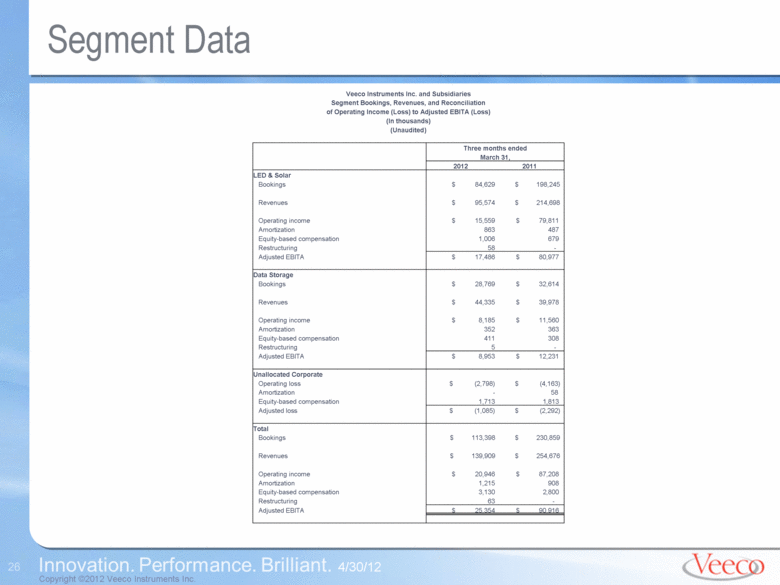
4/30/12 Segment Data Veeco Instruments Inc. and Subsidiaries Segment Bookings, Revenues, and Reconciliation of Operating Income (Loss) to Adjusted EBITA (Loss) (In thousands) (Unaudited) Three months ended March 31, 2012 2011 LED & Solar Bookings $ 84,629 $ 198,245 Revenues $ 95,574 $ 214,698 Operating income $ 15,559 $ 79,811 Amortization 863 487 Equity-based compensation 1,006 679 Restructuring 58 - Adjusted EBITA $ 17,486 $ 80,977 Data Storage Bookings $ 28,769 $ 32,614 Revenues $ 44,335 $ 39,978 Operating income $ 8,185 $ 11,560 Amortization 352 363 Equity-based compensation 411 308 Restructuring 5 - Adjusted EBITA $ 8,953 $ 12,231 Unallocated Corporate Operating loss $ (2,798) $ (4,163) Amortization - 58 Equity-based compensation 1,713 1,813 Adjusted loss $ (1,085) $ (2,292) Total Bookings $ 113,398 $ 230,859 Revenues $ 139,909 $ 254,676 Operating income $ 20,946 $ 87,208 Amortization 1,215 908 Equity-based compensation 3,130 2,800 Restructuring 63 - Adjusted EBITA $ 25,354 $ 90,916 |

