Attached files
| file | filename |
|---|---|
| 8-K - POLARIS INDUSTRIES INC. 8-K - Polaris Inc. | a50253625.htm |
Exhibit 99.1
Polaris Industries Inc. April 26, 2012 2012 Annual Meeting
2 2012 Annual Meeting Gregory R. Palen Chairman of the Board of Directors APRIL 2012
Polaris Industries Inc. April 26, 2012 2012 Annual Meeting
4 2012 Annual Meeting Scott W. Wine Chief Executive Officer APRIL 2012
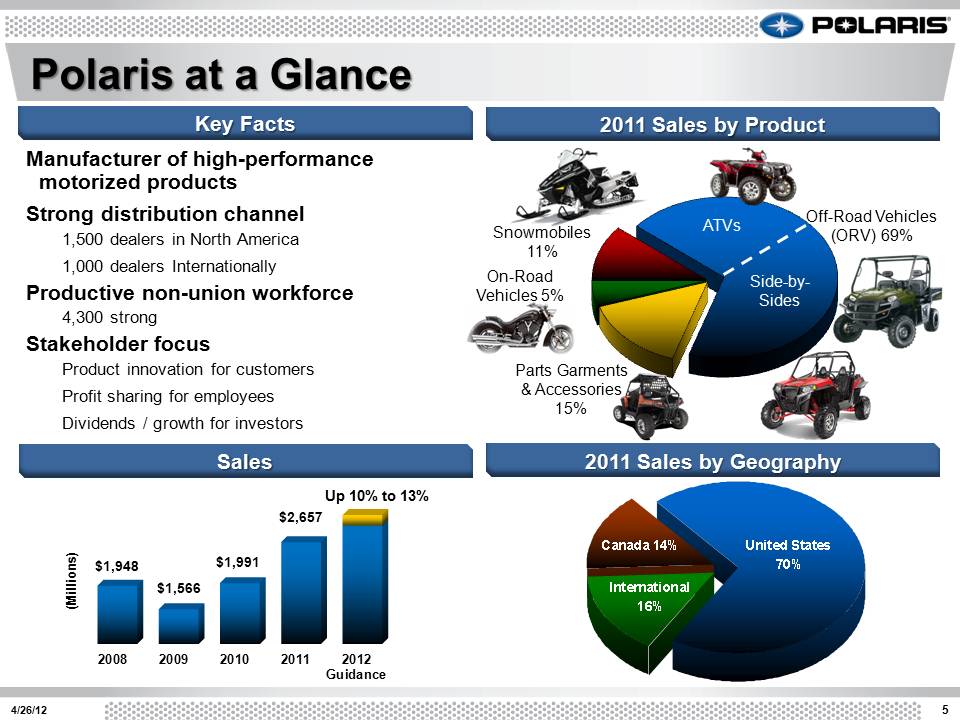
Canada 14% International 16% United States 70% 5 4/26/12 Manufacturer of high-performance motorized products Strong distribution channel 1,500 dealers in North America 1,000 dealers Internationally Productive non-union workforce 4,300 strong Stakeholder focus Product innovation for customers Profit sharing for employees Dividends / growth for investors Off-Road Vehicles (ORV) 69% On-Road Vehicles 5% Snowmobiles 11% Parts Garments & Accessories 15% ATVs Side-by-Sides 2008 2009 2010 2011 2012 Guidance $1,948 $1,566 $1,991 $2,657 (Millions) Up 10% to 13% Key Facts 2011 Sales by Product Sales 2011 Sales by Geography Polaris at a Glance
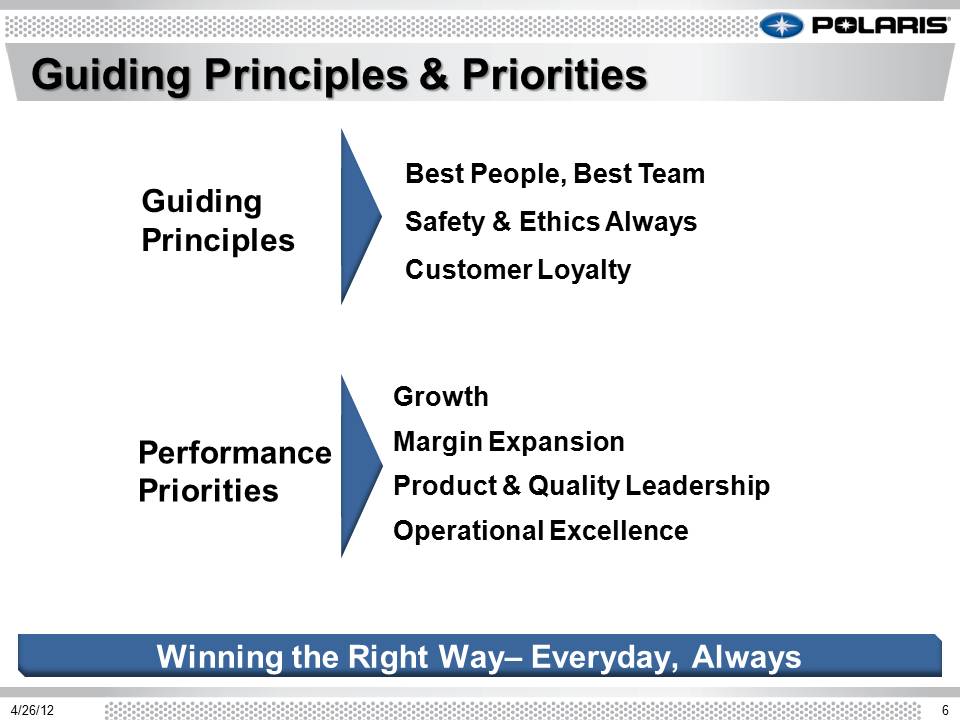
Guiding Principles Best People, Best Team Safety & Ethics Always Customer Loyalty Performance Priorities Growth Margin Expansion Product & Quality Leadership Operational Excellence Guiding Principles & Priorities 6 4/26/12 Winning the Right Way– Everyday, Always
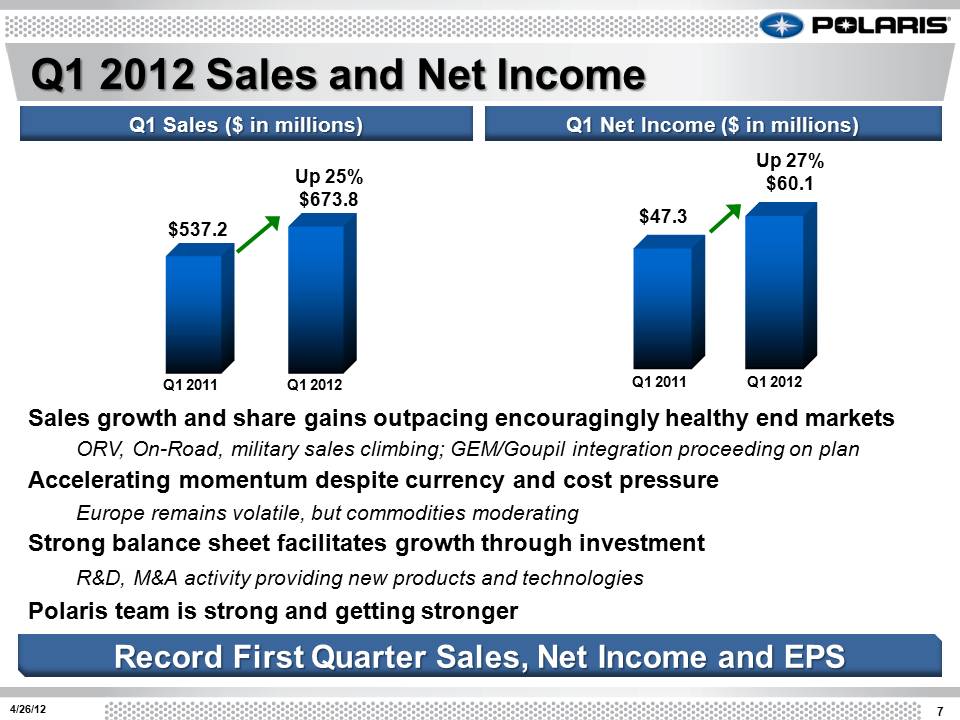
7 4/26/12 Q1 2012 Sales and Net Income Q1 Net Income ($ in millions) Q1 Sales ($ in millions) $47.3 Up 27% $60.1 Q1 2012 Q1 2011 Q1 2012 Q1 2011 Up 25% $673.8 $537.2 Record First Quarter Sales, Net Income and EPS Sales growth and share gains outpacing encouragingly healthy end markets ORV, On-Road, military sales climbing; GEM/Goupil integration proceeding on plan Accelerating momentum despite currency and cost pressure Europe remains volatile, but commodities moderating Strong balance sheet facilitates growth through investment R&D, M&A activity providing new products and technologies Polaris team is strong and getting stronger
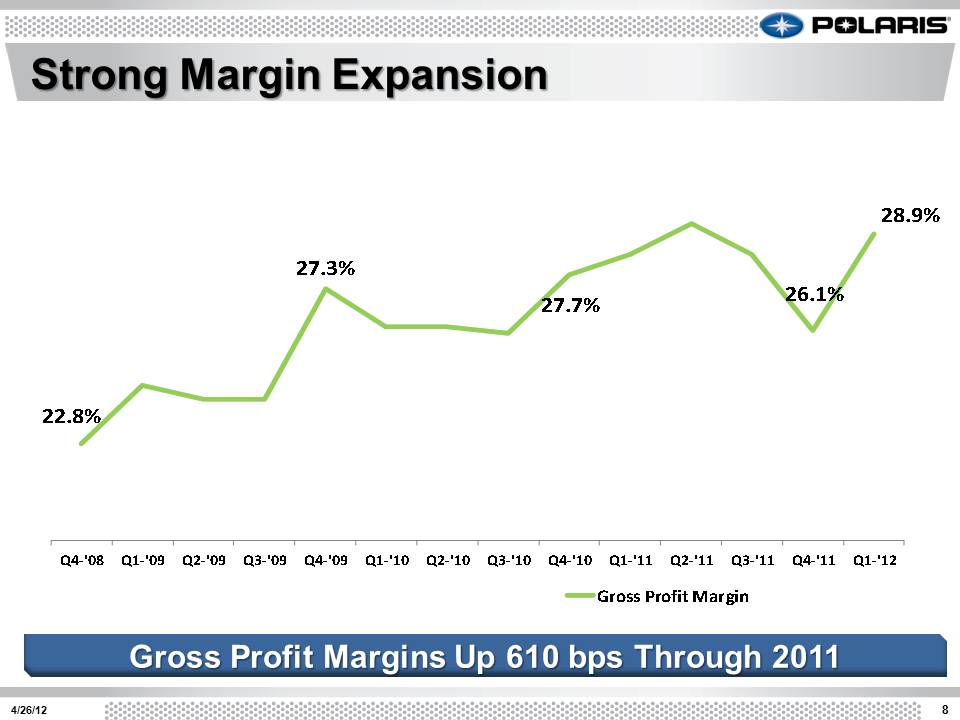
Strong Margin Expansion 22.8% 27.3% 27.7% 26.1% 28.9% Q4‐'08 Q1‐'09 Q2‐'09 Q3‐'09 Q4‐'09 Q1‐'10 Q2‐'10 Q3‐'10 Q4‐'10 Q1‐'11 Q2‐'11 Q3‐'11 Q4‐'11 Q1‐'12 Stock Price Net Income Margin Gross Profit Margin 8.6% 8.9% 4/26/12 8 Gross Profit Margins Up 610 bps Through 2011
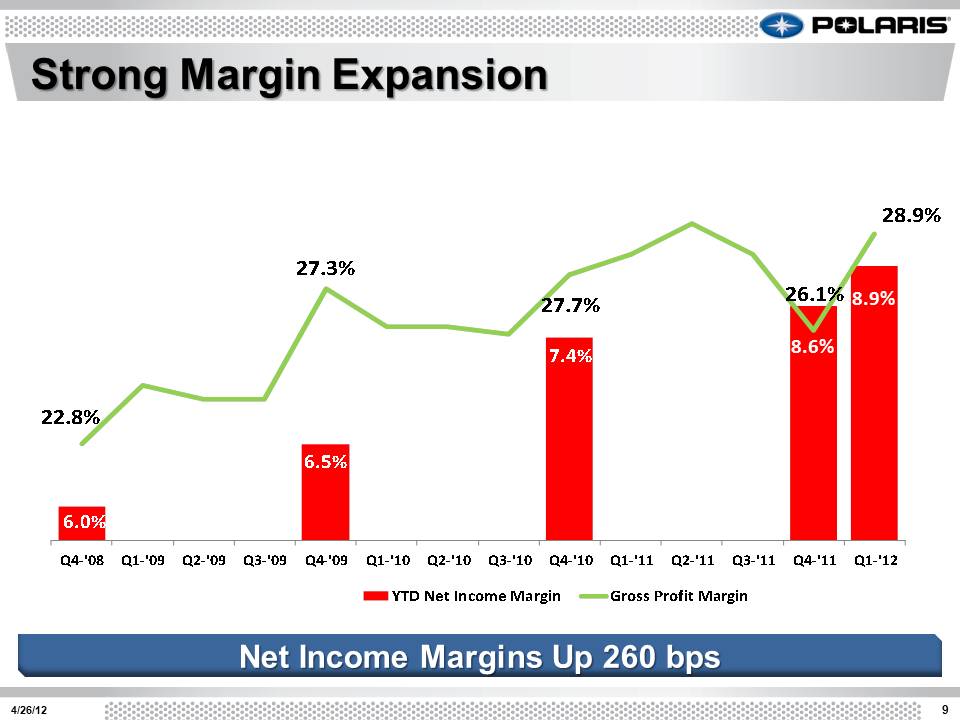
Strong Margin Expansion 6.0% 6.5% 7.4% 22.8% 27.3% 27.7% 26.1% 28.9% Q4‐'08 Q1‐'09 Q2‐'09 Q3‐'09 Q4‐'09 Q1‐'10 Q2‐'10 Q3‐'10 Q4‐'10 Q1‐'11 Q2‐'11 Q3‐'11 Q4‐'11 Q1‐'12 Stock Price YTD Net Income Margin Gross Profit Margin 8.6% 8.9% 4/26/12 9 Net Income Margins Up 260 bps
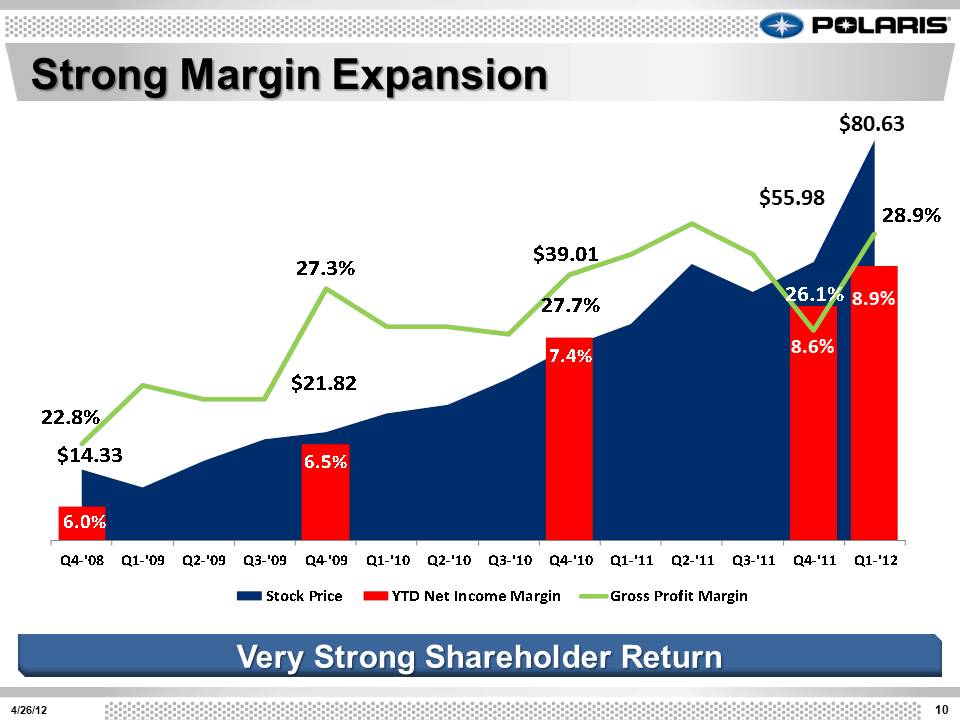
Strong Margin Expansion $14.33 $21.82 $39.01 6.0% 6.5% 7.4% 22.8% 27.3% 27.7% 26.1% 28.9% Q4‐'08 Q1‐'09 Q2‐'09 Q3‐'09 Q4‐'09 Q1‐'10 Q2‐'10 Q3‐'10 Q4‐'10 Q1‐'11 Q2‐'11 Q3‐'11 Q4‐'11 Q1‐'12 Stock Price YTD Net Income Margin Gross Profit Margin $55.98 $80.63 Very Strong Shareholder Return 4/26/12 10 8.6% 8.9%
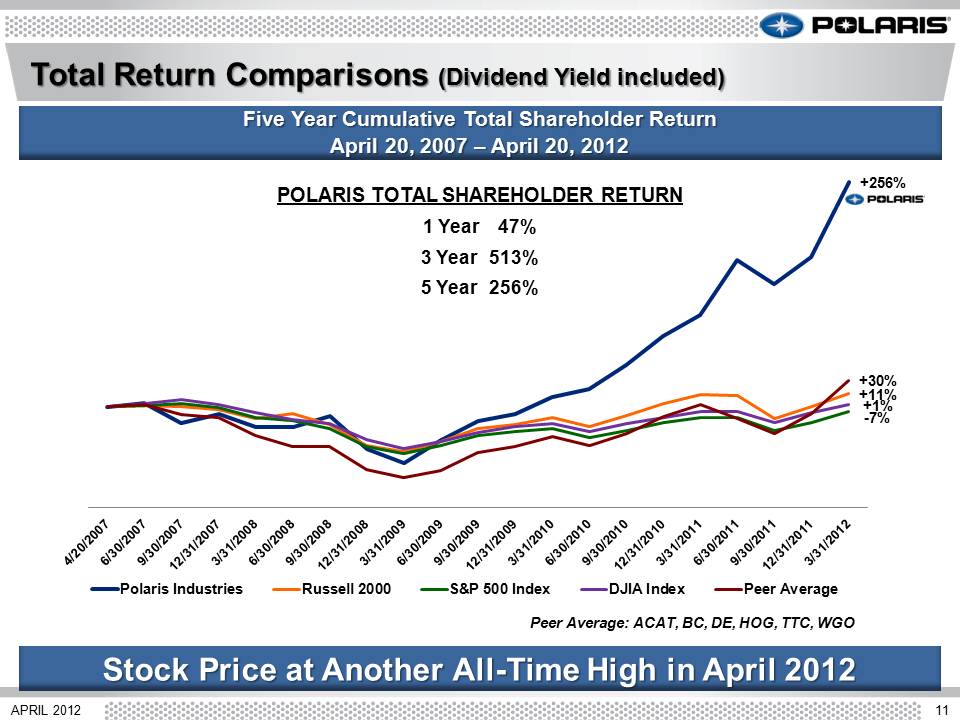
Total Return Comparisons (Dividend Yield included) 11 APRIL 2012 Five Year Cumulative Total Shareholder Return April 20, 2007 – April 20, 2012 Stock Price at Another All-Time High in April 2012 Peer Average: ACAT, BC, DE, HOG, TTC, WGO +256% +11% -7% +1% +30% Polaris Industries Russell 2000 S&P 500 Index DJIA Index Peer Average POLARIS TOTAL SHAREHOLDER RETURN 1 Year 47% 3 Year 513% 5 Year 256% 4/20/2007 6/30/2007 9/30/2007 12/31/2007 3/31/2008 6/30/2008 9/30/2008 12/31/2008 3/31/2009 6/30/2008 9/30/2009 12/31/2009 3/31/2010 6/30/2010 9/30/2010 12/31/2010 3/31/2011 6/30/2011 9/30/2011 12/31/2011 3/31/2012
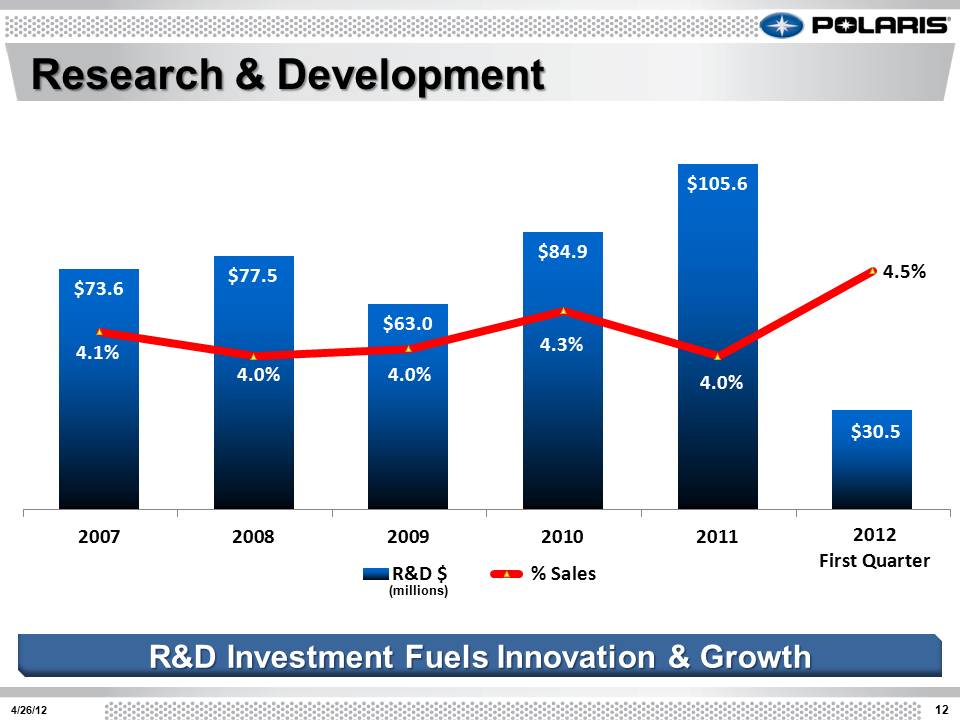
Research & Development $73.6 $77.5 $63.0 $84.9 $105.6 $30.5 4.1% 4.0% 4.0% 4.3% 4.0% 4.5% 2007 2008 2009 2010 2011 Q1'12 R&D $ % Sales R&D Investment Fuels Innovation & Growth 4/26/12 12 2012 First Quarter (millions)
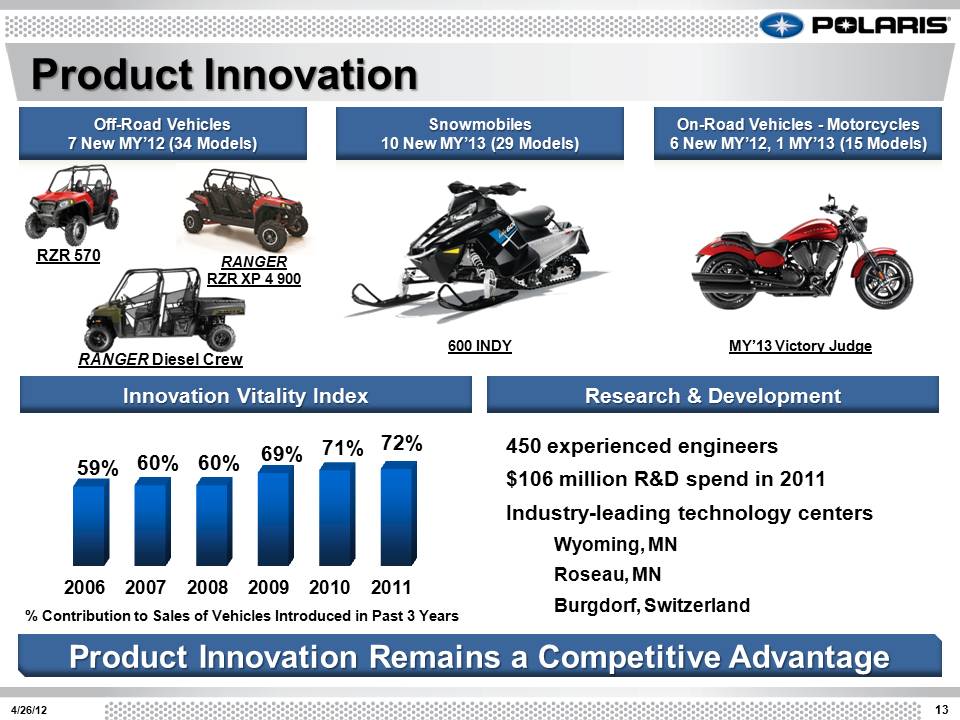
13 4/26/12 Product Innovation Off-Road Vehicles 7 New MY’12 (34 Models) Snowmobiles 10 New MY’13 (29 Models) On-Road Vehicles – Motorcycles 6 New MY’12, 1 MY’13 (15 Models) Innovation Vitality Index % Contribution to Sales of Vehicles Introduced in Past 3 Years 450 experienced engineers $106 million R&D spend in 2011 Industry-leading technology centers Wyoming, MN Roseau, MN Burgdorf, Switzerland RZR 570 Research & Development 2006 2007 2008 2009 2010 2011 59% 60% 60% 69% 71% 72% Product Innovation Remains a Competitive Advantage RANGER RZR XP 4 900 600 INDY MY’13 Victory Judge RANGER Diesel Crew
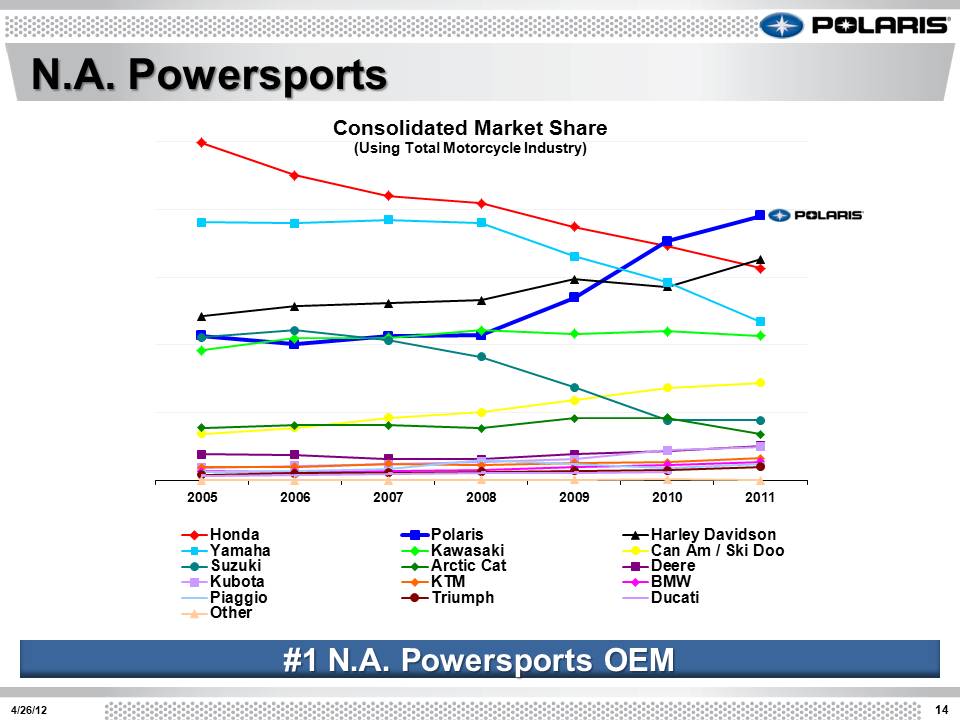
N.A. Powersports 14 4/26/12 #1 N.A. Powersports OEM 2005 2006 2007 2008 2009 2010 2011 Consolidated Market Share (Using Total Motorcycle Industry) Honda Polaris Harley Davidson Yamaha Kawasaki Can Am / Ski Doo Suzuki Arctic Cat Deere Kubota KTM BMW Piaggio Triumph Ducati Other
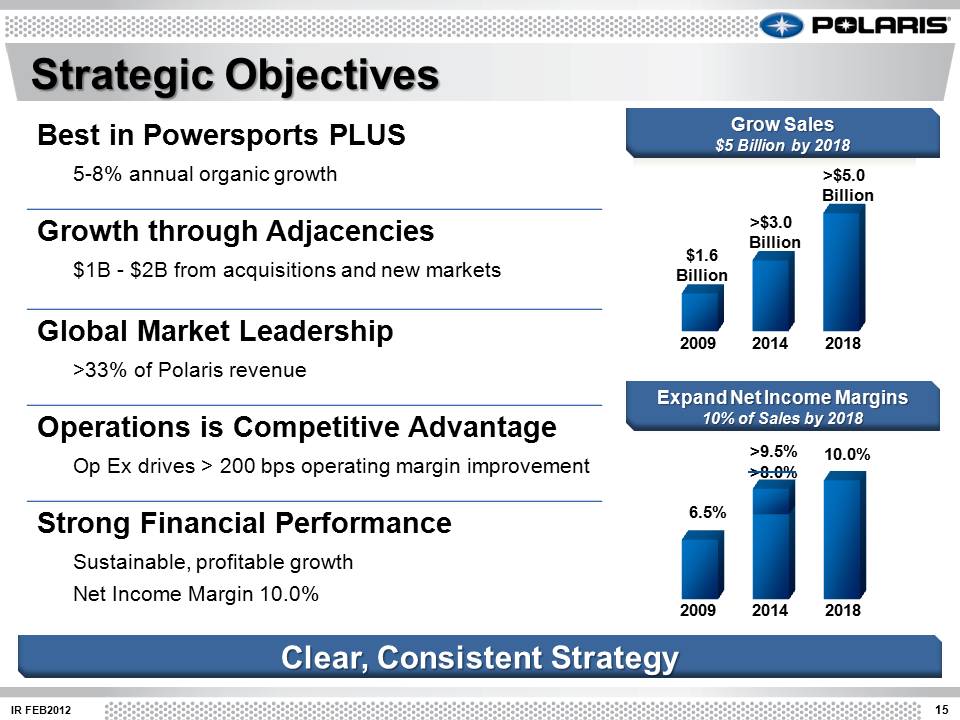
15 IR FEB2012 Strategic Objectives Best in Powersports PLUS 5-8% annual organic growth Growth through Adjacencies $1B - $2B from acquisitions and new markets Global Market Leadership >33% of Polaris revenue Operations is Competitive Advantage Op Ex drives > 200 bps operating margin improvement Strong Financial Performance Sustainable, profitable growth Net Income Margin 10.0% $1.6 Billion >$5.0 Billion >$3.0 Billion 2009 2014 2018 2009 2014 2018 6.5% 10.0% >9.5% >8.0% Grow Sales $5 Billion by 2018 Clear, Consistent Strategy Expand Net Income Margins 10% of Sales by 2018
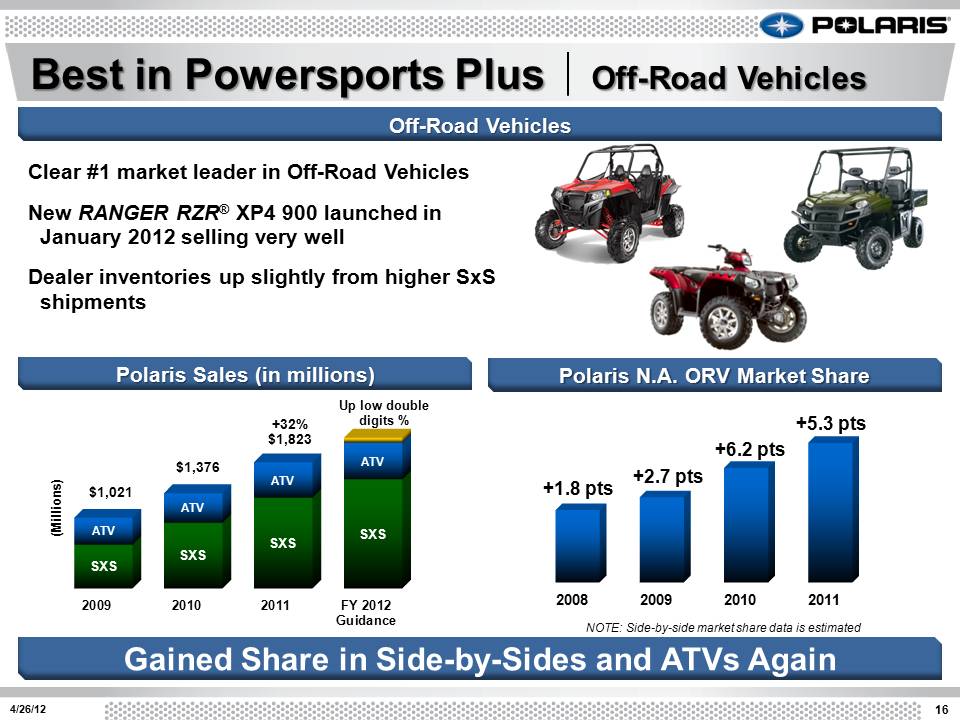
2009 2010 2011 FY 2012 Guidance SXS SXS SXS SXS ATV ATV ATV ATV (Millions) 4/26/12 16 Polaris Sales (in millions) Polaris N.A. ORV Market Share Gained Share in Side-by-Sides and ATVs Again NOTE: Side-by-side market share data is estimated +32% $1,823 Up low double digits % Clear #1 market leader in Off-Road Vehicles New RANGER RZR® XP4 900 launched in January 2012 selling very well Dealer inventories up slightly from higher SxS shipments Off-Road Vehicles Best in Powersports Plus Off-Road Vehicles $1,376 $1,021 2008 2009 2010 2011 +1.8 pts +2.7 pts +6.2 pts +5.3 pts
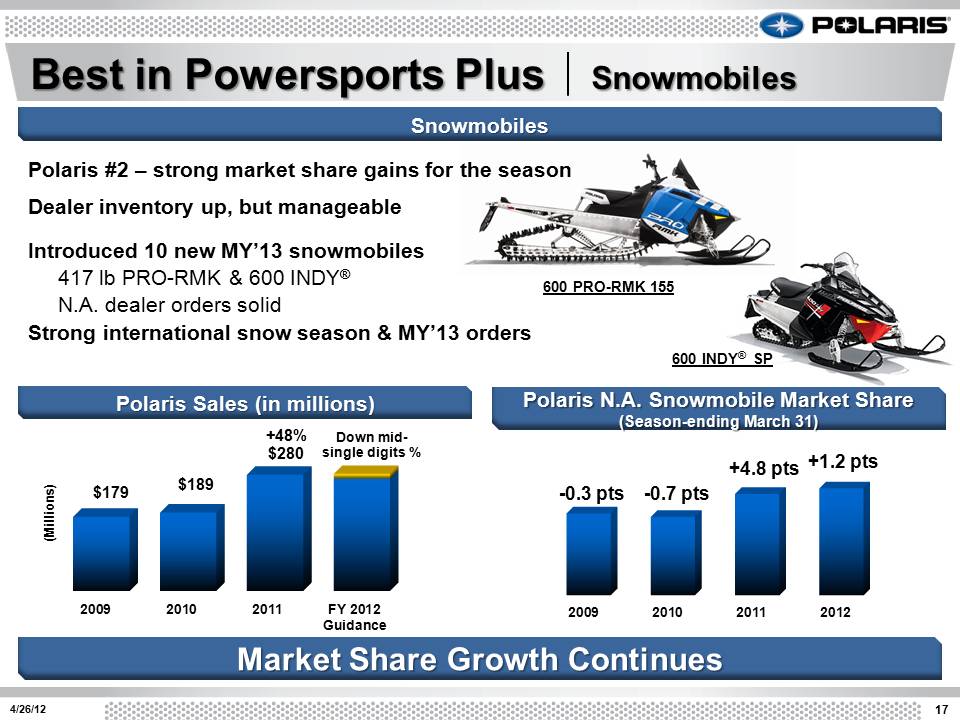
4/26/12 Best in Powersports Plus Snowmobiles Snowmobiles Polaris Sales (in millions) Market Share Growth Continues 600 PRO-RMK 155 600 INDY® SP Polaris #2 – strong market share gains for the season Dealer inventory up, but manageable Introduced 10 new MY’13 snowmobiles 417 lb PRO-RMK & 600 INDY® N.A. dealer orders solid Strong international snow season & MY’13 orders 2009 2010 2011 FY 2012 Guidance $179 $189 +48% $280 (Millions) Down midsingle digits % Polaris N.A. Snowmobile Market Share (Season-ending March 31) 17 2009 2010 2011 2012 -0.3 pts -0.7 pts +4.8 pts +1.2 pts
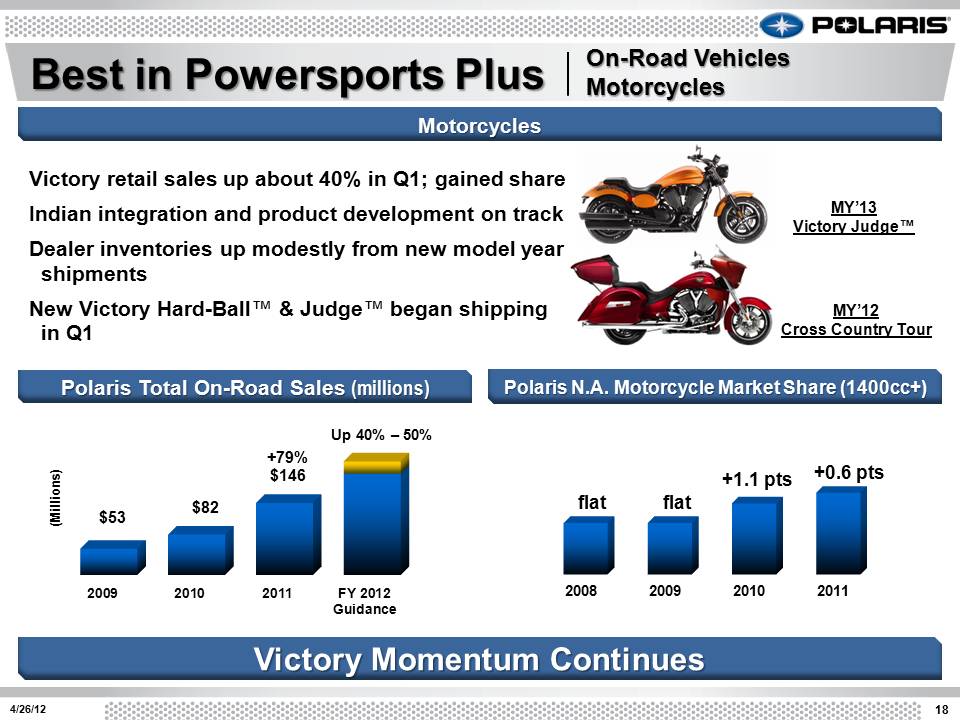
2009 2010 2011 FY 2012 Guidance $53 $82 +79% $146 (Millions) MY’13 Victory Judge™ Victory retail sales up about 40% in Q1; gained share Indian integration and product development on track Dealer inventories up modestly from new model year shipments New Victory Hard-Ball™ & Judge™ began shipping in Q1 4/26/12 18 Motorcycles Polaris Total On-Road Sales (millions) Polaris N.A. Motorcycle Market Share (1400cc+) Victory Momentum Continues Up 40% – 50% Best in Powersports Plus 2008 2009 2010 2011 flat flat +1.1 pts +0.6 pts MY’12 Cross Country Tour On-Road Vehicles Motorcycles
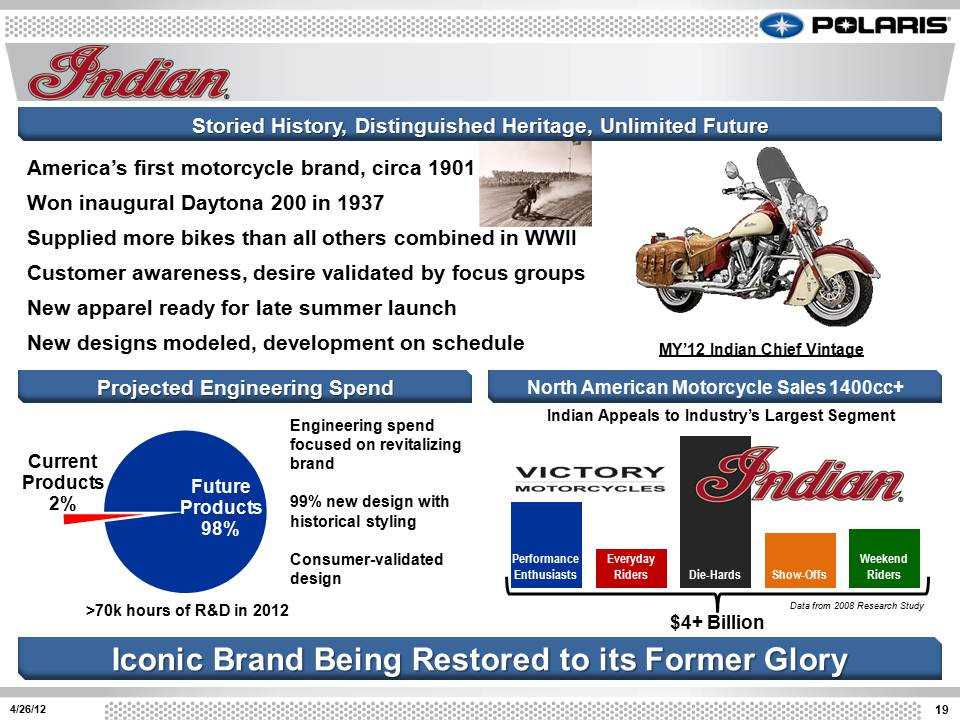
Future Products 98% Current Products 2% America’s first motorcycle brand, circa 1901 Won inaugural Daytona 200 in 1937 Supplied more bikes than all others combined in WWII Customer awareness, desire validated by focus groups New apparel ready for late summer launch New designs modeled, development on schedule 4/26/12 19 Storied History, Distinguished Heritage, Unlimited Future Projected Engineering Spend Iconic Brand Being Restored to its Former Glory MY’12 Indian Chief Vintage >70k hours of R&D in 2012 North American Motorcycle Sales 1400cc+ Engineering spend focused on revitalizing brand 99% new design with historical styling Consumer-validated design Data from 2008 Research Study Performance Enthusiasts Everyday Riders Die-Hards Show-Offs Weekend Riders Indian Appeals to Industry’s Largest Segment $4+ Billion
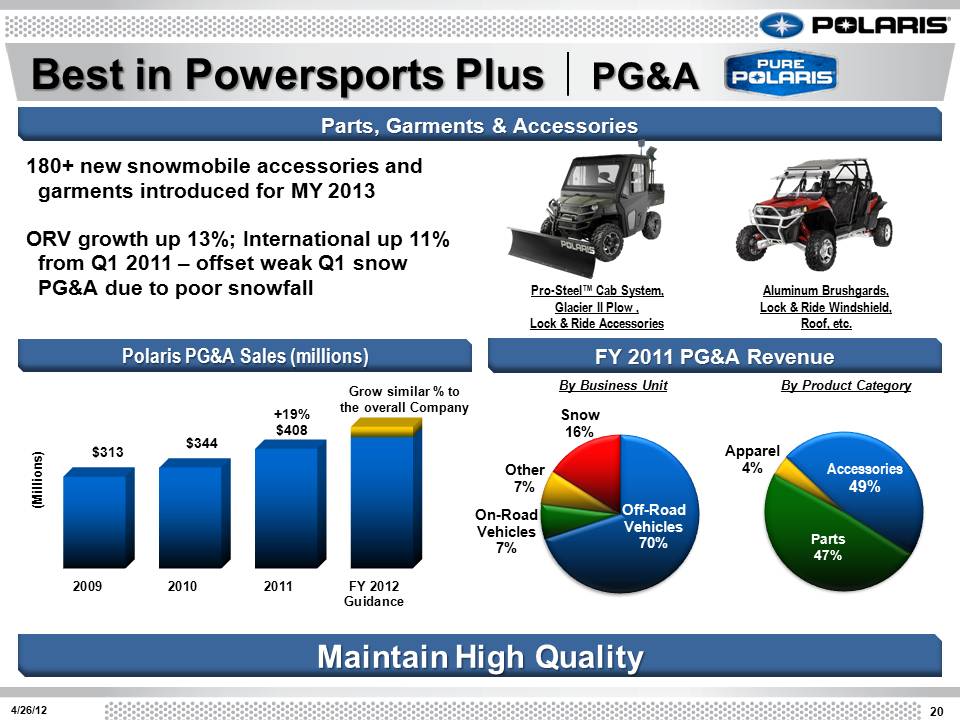
2009 2010 2011 FY 2012 Guidance $313 $344 +19% $408 (Millions) 20 Best in Powersports Plus PG&A Grow similar % to the overall Company Maintain High Quality By Business Unit By Product Category Off-Road Vehicles 70% On-Road Vehicles 7% Other 7% Snow 16% Accessories 49% Parts 47% Apparel 4% 180+ new snowmobile accessories and garments introduced for MY 2013 ORV growth up 13%; International up 11% from Q1 2011 – offset weak Q1 snow PG&A due to poor snowfall Parts, Garments & Accessories Polaris PG&A Sales (millions) FY 2011 PG&A Revenue 4/26/12 Pro-Steel™ Cab System, Glacier II Plow, Lock & Ride Accessories Aluminum Brushgards, Lock & Ride Windshield, Roof, etc.
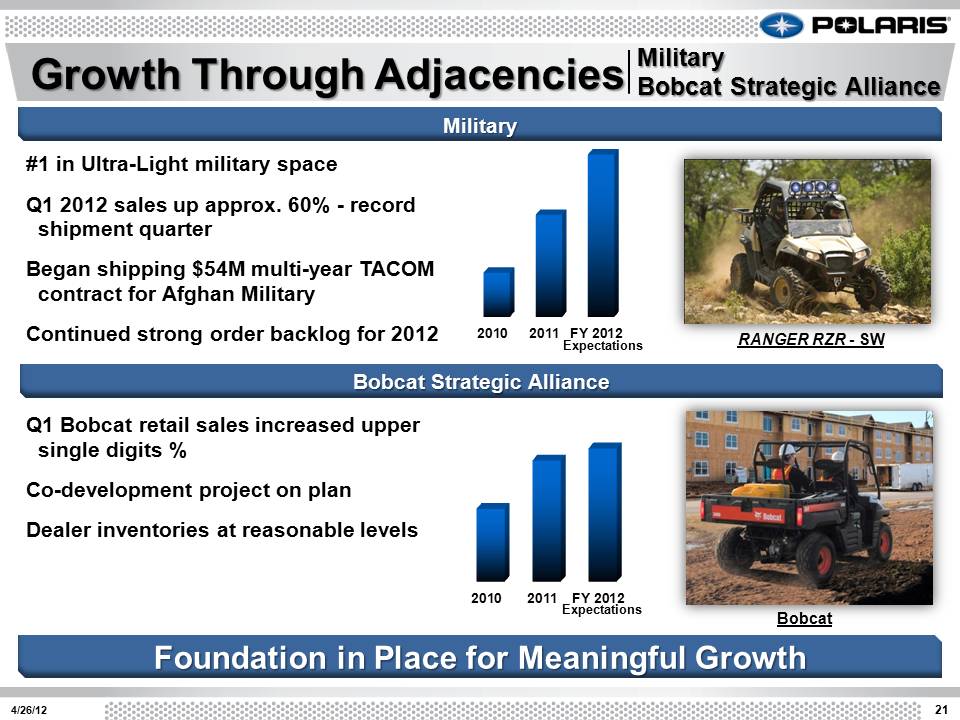
2010 2011 FY 2012 21 4/26/12 Growth Through Adjacencies RANGER RZR – SW Q1 Bobcat retail sales increased upper single digits % Co-development project on plan Dealer inventories at reasonable levels 2010 2011 FY 2012 Bobcat Military Foundation in Place for Meaningful Growth Military Bobcat Strategic Alliance Expectations #1 in Ultra-Light military space Q1 2012 sales up approx. 60% - record shipment quarter Began shipping $54M multi-year TACOM contract for Afghan Military Continued strong order backlog for 2012 Expectations Bobcat Strategic Alliance
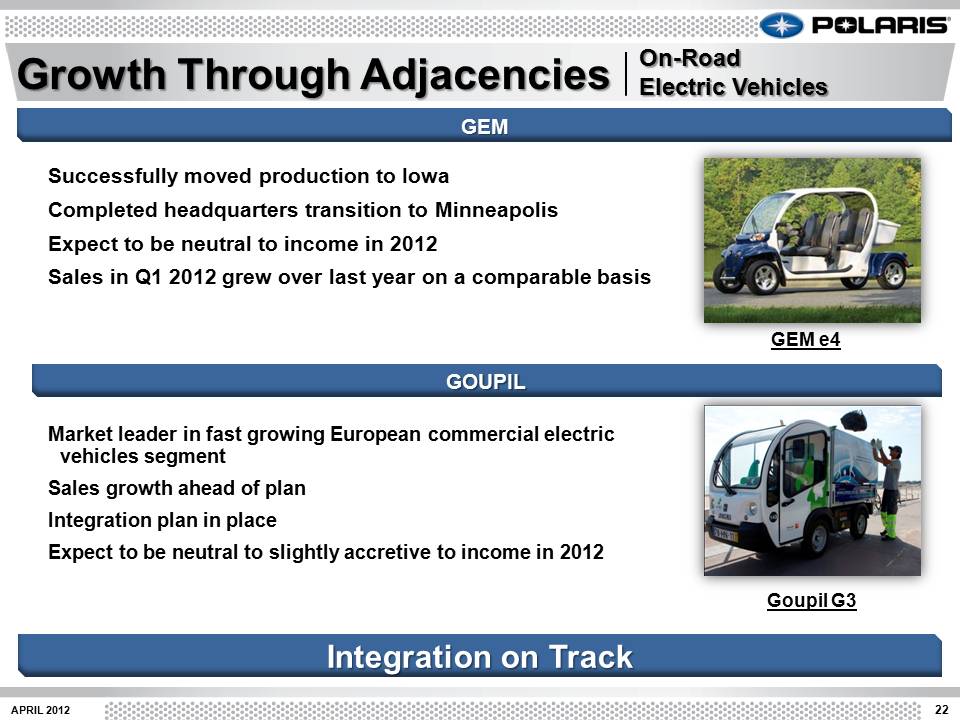
22 APRIL 2012 Successfully moved production to Iowa Completed headquarters transition to Minneapolis Expect to be neutral to income in 2012 Sales in Q1 2012 grew over last year on a comparable basis Market leader in fast growing European commercial electric vehicles segment Sales growth ahead of plan Integration plan in place Expect to be neutral to slightly accretive to income in 2012 Growth Through Adjacencies GEM e4 Goupil G3 GEM GOUPIL Integration on Track On-Road Electric Vehicles
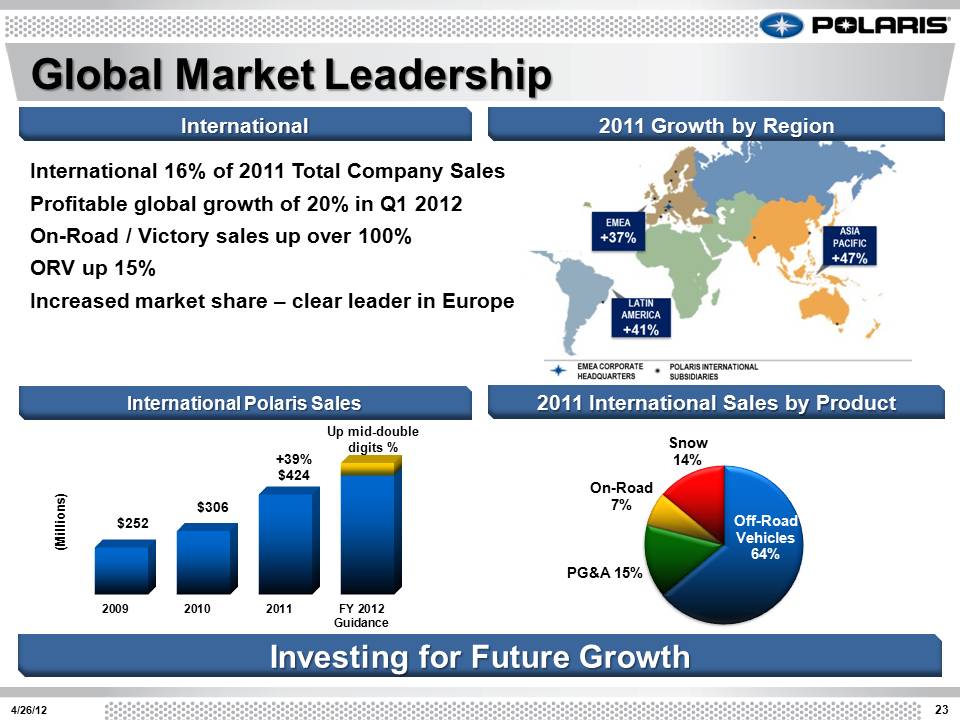
2009 2010 2011 FY 2012 Guidance $252 $306 +39% $424 (Millions) 23 4/26/12 Global Market Leadership International 16% of 2011 Total Company Sales Profitable global growth of 20% in Q1 2012 On-Road / Victory sales up over 100% ORV up 15% Increased market share – clear leader in Europe Up mid-double digits % 2011 Growth by Region International Polaris Sales International Investing for Future Growth Off-Road Vehicles 64% PG&A 15% On-Road 7% Snow 14% 2011 International Sales by Product
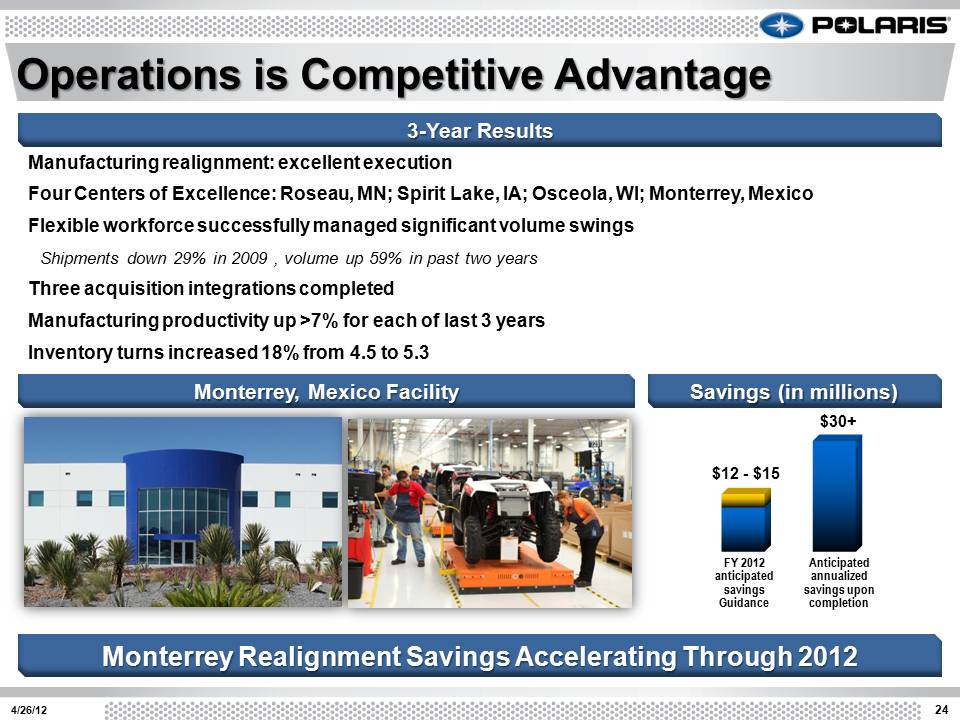
24 4/26/12 Manufacturing realignment: excellent execution Four Centers of Excellence: Roseau, MN; Spirit Lake, IA; Osceola, WI; Monterrey, Mexico Flexible workforce successfully managed significant volume swings Shipments down 29% in 2009 , volume up 59% in past two years Three acquisition integrations completed Manufacturing productivity up >7% for each of last 3 years Inventory turns increased 18% from 4.5 to 5.3 Operations is Competitive Advantage Monterrey, Mexico Facility Monterrey Realignment Savings Accelerating Through 2012 3-Year Results Anticipated annualized savings upon completion FY 2012 anticipated savings Guidance $30+ $12 - $15 Savings (in millions)
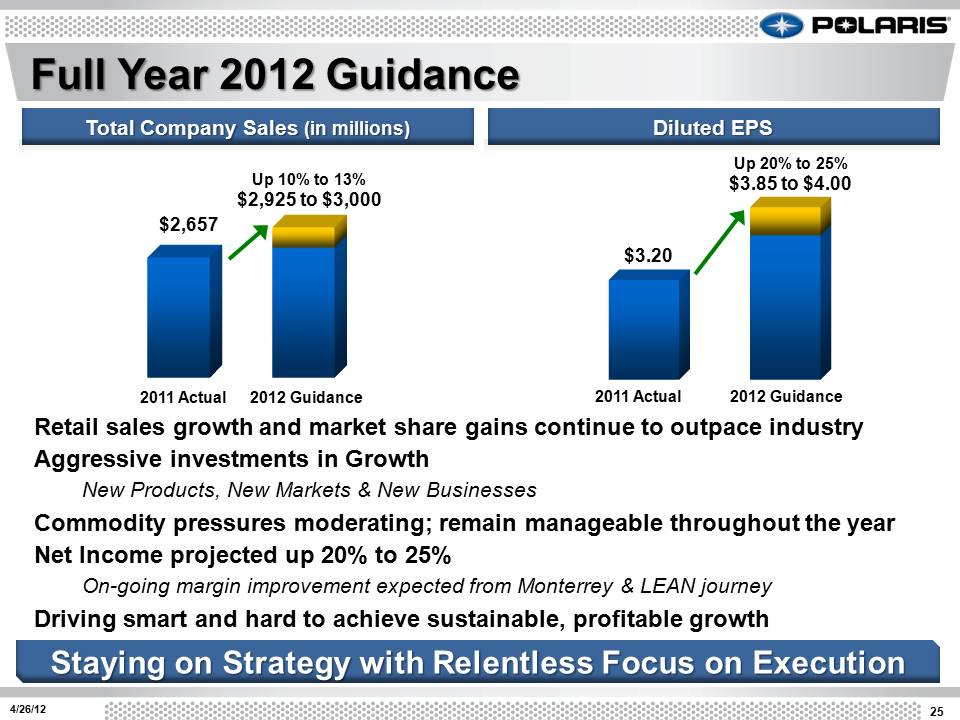
25 4/26/12 Full Year 2012 Guidance $2,657 Up 10% to 13% $2,925 to $3,000 2011 Actual 2012 Guidance $3.20 Up 20% to 25% $3.85 to $4.00 Retail sales growth and market share gains continue to outpace industry Aggressive investments in Growth New Products, New Markets & New Businesses Commodity pressures moderating; remain manageable throughout the year Net Income projected up 20% to 25% On-going margin improvement expected from Monterrey & LEAN journey Driving smart and hard to achieve sustainable, profitable growth 2011 Actual 2012 Guidance Staying on Strategy with Relentless Focus on Execution Total Company Sales (in millions) Diluted EPS
26 Safe Harbor Except for historical information contained herein, the matters set forth in this document, including but not limited to management’s expectations regarding 2012 sales, shipments, net income, cash flow, and manufacturing realignment transition costs and savings, are forward-looking statements that involve certain risks and uncertainties that could cause actual results to differ materially from those forward-looking statements. Potential risks and uncertainties include such factors as product offerings, promotional activities and pricing strategies by competitors; manufacturing realignment transition costs; acquisition integration costs; warranty expenses; impact of changes in Polaris stock prices on incentive compensation; foreign currency exchange rate fluctuations; environmental and product safety regulatory activity; effects of weather; commodity costs; uninsured product liability claims; uncertainty in the retail and wholesale credit markets; changes in tax policy and overall economic conditions, including inflation, consumer confidence and spending and relationships with dealers and suppliers. Investors are also directed to consider other risks and uncertainties discussed in our 2011 annual report and Form 10-K filed by the Company with the Securities and Exchange Commission. The Company does not undertake any duty to any person to provide updates to its forward-looking statements. The data source for retail sales figures included in this presentation is registration information provided by Polaris dealers in North America and compiled by the Company or Company estimates. The Company must rely on information that its dealers supply concerning retail sales, and other retail sales data sources and this information is subject to revision. Note: Shares and per share information have been adjusted to give effect to the two-for-one stock split declared on July 20, 2011, payable on September 12, 2011 to shareholders of record on September 2, 2011. 4/26/12

27 Thank you. Questions? 4/26/12
Polaris Industries Inc. April 26, 2012 2012 Annual Meeting