Attached files
| file | filename |
|---|---|
| EX-99.1 - EXHIBIT 99.1 - BRINKS CO | exhibit_99-1.htm |
| 8-K - FORM 8-K - BRINKS CO | form_8k.htm |

The Brink’s Company
First-Quarter 2012 Earnings
Conference Call
NYSE:BCO
April 26, 2012
Exhibit 99.2

Forward-Looking Statements
These materials contain forward-looking statements. Actual
results could differ materially from projected or estimated
results. Information regarding factors that could cause such
differences is available in today's release and in The Brink’s
Company’s most recent SEC filings.
results could differ materially from projected or estimated
results. Information regarding factors that could cause such
differences is available in today's release and in The Brink’s
Company’s most recent SEC filings.
Information discussed today is representative as of today
only and Brink's assumes no obligation to update any
forward-looking statements. These materials are
copyrighted and may not be used without written permission
from Brink's.
only and Brink's assumes no obligation to update any
forward-looking statements. These materials are
copyrighted and may not be used without written permission
from Brink's.
2

The Brink’s Company
Ed Cunningham
Director - Investor Relations

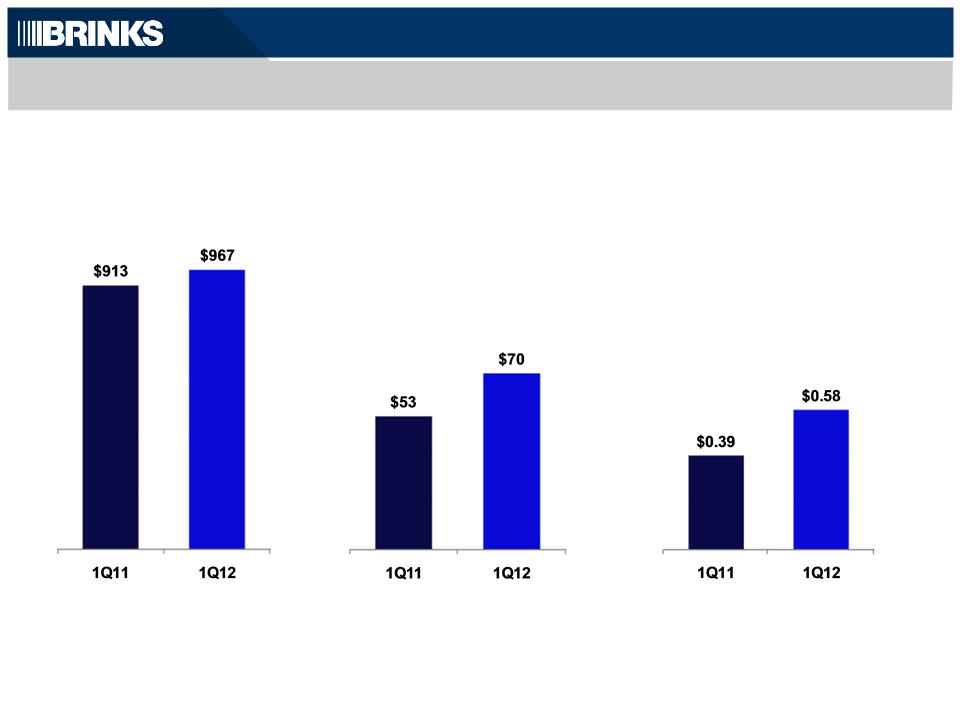
Highlights of First-Quarter Non-GAAP Results
• EPS $.58 vs $.39
• Revenue up 6%, 9% organic growth
• Segment Margin 7.2% vs. 5.8%
• Profit growth driven by Latin America
• EMEA and North America up slightly
• Improved 2012 outlook
Note: See reconciliation to GAAP results in Appendix
4

The Brink’s Company
Tom Schievelbein
Interim President and
Chief Executive Officer

CEO Overview
• Non-GAAP EPS up 49% on Latin America results
• 2012 margin guidance ~7%
• CEO Search on Schedule
• EMEA and NA: Improvement in 2012
6
Note: See reconciliation to GAAP results in Appendix

The Brink’s Company
Joe Dziedzic
Vice President and Chief
Financial Officer
Financial Officer
Review and Outlook
8
1Q12 Non-GAAP Results
($ millions, except EPS)
Segment
Operating Profit
Operating Profit
Revenue
|
|
|
|
|
|
Margin
|
5.8%
|
|
7.2%
|
EPS
Note: See reconciliation to GAAP results in Appendix

9
Non-GAAP EPS: 1Q12 Versus 1Q11
Segment
Operating Profit
Operating Profit
Non-Segment
Expense
Expense
Interest
Expense, Net
Expense, Net
Non-Controlling
Interest
Interest
Tax Rate
1Q11
1Q12
Note: See reconciliation to GAAP results in Appendix

Total Non-GAAP Segment Results and Outlook
($ millions)
1Q12 Results
2012 Outlook
— Increased margin guidance to ~7%
— 5% - 8% organic revenue growth
— U.S. actions improve profitability
— Europe operations stable to improving in a
difficult environment
difficult environment
— Continued strong Latin America growth
— Strong organic revenue growth
— Significant margin expansion, all organic
— Latin America drives performance, North
America & Europe slightly better
America & Europe slightly better
|
|
|
|
|
|
|
|
Margin
|
|
|
5.8%
|
|
7.2%
|
(a)
(a) See reconciliation to GAAP results in Appendix
(a)
10

|
Organic
|
|
|
|
|
|
|
Growth
|
|
|
(1%)
|
|
-
|
North America Non-GAAP Segment Results and Outlook
($ millions)
1Q12 Results
2012 Outlook
— Revenue flat
— Slight margin improvement
— U.S. cost actions offset price and volume
pressure
pressure
— Flat revenue in a difficult environment
— U.S. cost actions and productivity offset
price and volume pressure
price and volume pressure
— On track for margin of 4.5% to 5.5%
11
(a)
|
|
|
|
|
|
|
|
Margin
|
|
|
3.1%
|
|
3.4%
|
(a)
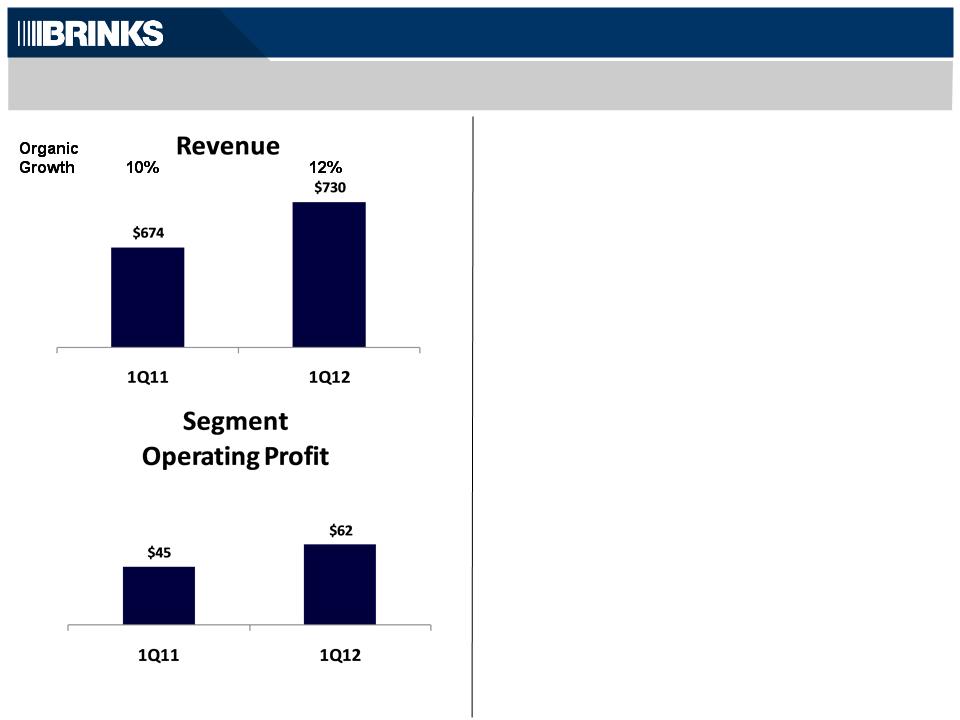
International Non-GAAP Segment Results and Outlook
1Q12 Results
2012 Outlook
($ millions)
— Revenue Growth
— Organic growth $84
— Currency down ($28)
— Profit Growth
— Organic growth $18
— Currency down ($2)
— Broad margin expansion in Latin America
— Mexico improving, expect more
restructuring in 2Q-4Q12
restructuring in 2Q-4Q12
— 7% to 8% margin rate
— Continued strong organic revenue growth
driven by Latin America
driven by Latin America
— Unfavorable currency impact
— Slight improvement in Mexico, positioned
for margin expansion 2013+
for margin expansion 2013+
(a) See reconciliation to GAAP results in Appendix
12
(a)
(a)
|
|
|
|
|
|
|
|
Margin
|
|
|
6.7%
|
|
8.4%
|

Non-GAAP Cash Flow, Capital Investment, and Net Debt
13
($ millions)
(a) See reconciliation to GAAP results in Appendix
13
Non-GAAP
CFOA
CFOA
(a)
$39
$43
North
America
America
International
Capital
Expenditures
and Capital
Leases
Expenditures
and Capital
Leases
Net Debt
(a)

2012 Outlook
($ millions)
Capital Deployment
— Pension contribution
— Capital Expenditures / Capital Leases
|
|
|
|
|
|
|
|
Margin
|
|
|
6.3%
|
|
~7%
|
(a)
(a) See reconciliation to GAAP results in Appendix
(a)
14
— Strong growth in Latin America
— Slow / No growth in North America
— Modest growth in Europe
Revenue
— Strong margin expansion in Latin America
— North America on track for 4.5% to 5.5%
— Slight margin expansion in Europe
Segment Profit

The Brink’s Company
First-Quarter 2012 Earnings
Conference Call
NYSE:BCO
April 26, 2012

Appendix - Non-GAAP Reconciliations

Non-GAAP Reconciliations - 1Q12
17
GAAP Basis
Gain on Sale of
Investments (a)
Investments (a)
Employee Benefit
Settlement Losses (b)
Settlement Losses (b)
U.S.
Retirement
Plans (c)
Retirement
Plans (c)
Adjust Income
Tax Rate (d)
Tax Rate (d)
Non-GAAP
Basis
Basis
First Quarter 2012
Operating profit:
International
$
60.9
-
0.8
-
-
61.7
North America
5.8
-
-
2.2
-
8.0
Segment operating profit
66.7
-
0.8
2.2
-
69.7
Non-segment
(24.3)
-
-
14.7
-
(9.6)
Operating profit
$
42.4
-
0.8
16.9
-
60.1
Amounts attributable to Brink’s:
Income from continuing operations
$
17.0
(1.2)
0.6
10.6
0.9
27.9
Diluted EPS - continuing operations
0.35
(0.02)
0.01
0.22
0.02
0.58
(a) To eliminate gain related to the sale of investments in mutual fund securities ($2 million). Proceeds from the sale were used to fund the settlement
of pension obligations related to the former CEO.
of pension obligations related to the former CEO.
(b) To eliminate employee benefit settlement losses related to severance payments made by Brink’s subsidiary in Mexico. Employee termination
benefits in Mexico are accounted for under FASB ASC Topic 715, Compensation - Retirement Benefits.
benefits in Mexico are accounted for under FASB ASC Topic 715, Compensation - Retirement Benefits.
(c) To eliminate expenses related to U.S. retirement plans.
(d) To adjust effective income tax rate in the interim period to be equal to the midpoint of the estimated range of the full-year non-GAAP effective
income tax rate. The midpoint of the estimated range of the full-year non-GAAP effective tax rate for 2012 is 38.5%.
income tax rate. The midpoint of the estimated range of the full-year non-GAAP effective tax rate for 2012 is 38.5%.
Amounts may not add due to rounding.

Non-GAAP Reconciliations -1Q11
18
GAAP Basis
Gains on Acquisitions and Asset
Dispositions (a)
Dispositions (a)
U.S. Retirement
Plans (b)
Plans (b)
Adjust Income
Tax Rate (c)
Tax Rate (c)
Non-GAAP
Basis
Basis
First Quarter 2011
Operating profit:
North America
6.8
-
0.7
-
7.5
Segment operating profit
52.0
-
0.7
-
52.7
Non-segment
(15.0)
(0.4)
6.2
-
(9.2)
Operating profit
$
37.0
(0.4)
6.9
-
43.5
Amounts attributable to Brink’s:
Income from continuing operations
$
18.9
(3.0)
4.4
(1.5)
18.8
Diluted EPS - continuing operations
0.39
(0.06)
0.09
(0.03)
0.39
(a) To eliminate gain related to acquisition of controlling interest in a subsidiary that was previously accounted for as an equity method investment
($0.4 million) and gains on sale of marketable securities ($4.4 million).
($0.4 million) and gains on sale of marketable securities ($4.4 million).
(b) To eliminate expenses related to U.S. retirement plans.
(c) To adjust effective income tax rate in the interim period to be equal to the full-year non-GAAP effective income tax rate. The non-GAAP effective
tax rate for 2011 was 38.6%.
tax rate for 2011 was 38.6%.
Amounts may not add due to rounding.

Non-GAAP Reconciliations - Cash Flows
19
|
|
|
First Quarter
|
||||
|
|
|
|
2012
|
|
|
2011
|
|
Cash flows from operating activities - GAAP
|
$
|
(16.4)
|
|
$
|
(5.7)
|
|
|
Decrease (increase) in certain customer obligations (a)
|
|
18.8
|
|
|
9.7
|
|
|
Cash outflows (inflows) related to discontinued operations (b)
|
|
-
|
|
|
(1.2)
|
|
|
|
|
|
|
|
|
|
|
|
Cash flows from operating activities - Non-GAAP
|
$
|
2.4
|
|
$
|
2.8
|
(a) To eliminate the change in the balance of customer obligations related to cash received and processed in certain of our secure cash logistics
operations. The title to this cash transfers to us for a short period of time. The cash is generally credited to customers’ accounts the following
day and we do not consider it as available for general corporate purposes in the management of our liquidity and capital resources.
operations. The title to this cash transfers to us for a short period of time. The cash is generally credited to customers’ accounts the following
day and we do not consider it as available for general corporate purposes in the management of our liquidity and capital resources.
(b) To eliminate cash flows related to our discontinued operations.
Non-GAAP cash flows from operating activities are supplemental financial measures that are not required by, or presented in accordance with
GAAP. The purpose of the non-GAAP cash flows from operating activities is to report financial information excluding the impact of cash
received and processed in certain of our secure cash logistics operations and without cash flows from discontinued operations. Brink’s
believes this measure is helpful in assessing cash flows from operations, enables period-to-period comparability and is useful in predicting
future operating cash flows. Non-GAAP cash flows from operating activities should not be considered as an alternative to cash flows from
operating activities determined in accordance with GAAP and should be read in conjunction with our consolidated statements of cash flows.
20
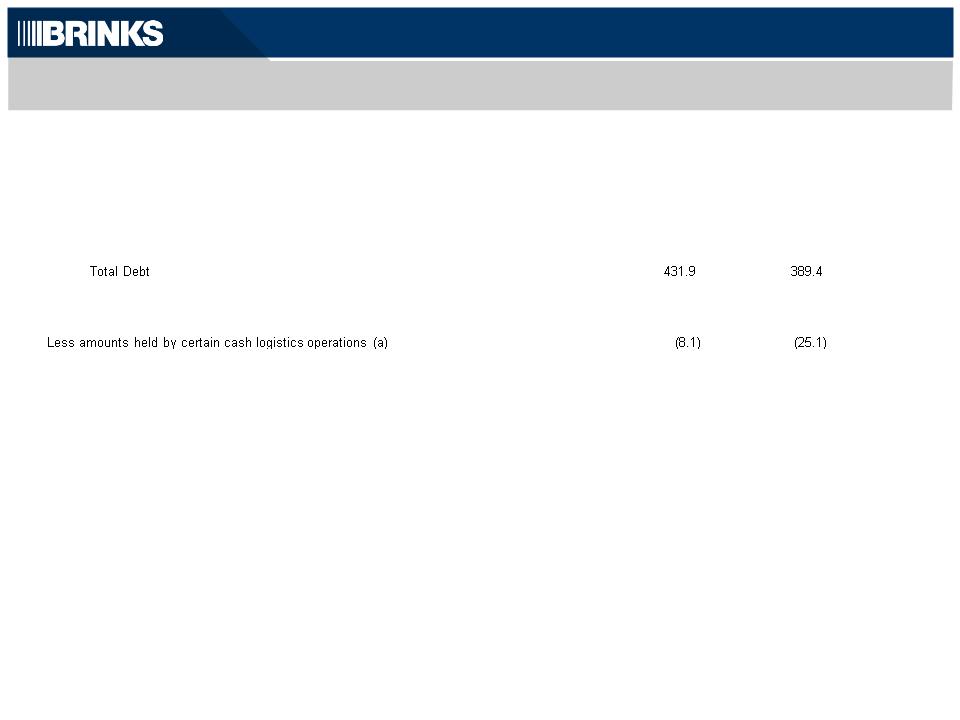
|
NET DEBT RECONCILED TO GAAP
|
|
|
March 31,
|
|
December 31,
|
|
|||
|
|
|
|
2012
|
|
2011
|
|
|||
|
Debt:
|
|
|
|
|
|
||||
|
|
Short-term debt
|
|
$
|
23.0
|
|
25.4
|
|
||
|
|
Long-term debt
|
|
|
408.9
|
|
364.0
|
|
||
|
|
|
|
|
|
|
||||
|
|
|
|
|
|
|
|
|
|
|
|
Cash and cash equivalents
|
|
|
155.5
|
|
182.9
|
|
|||
|
|
|
|
|
||||||
|
|
|
|
Amount available for general corporate purposes
|
|
|
147.4
|
|
157.8
|
|
|
|
|
|
|
|
|
|
|
|
|
|
|
|
Net Debt
|
|
$
|
284.5
|
|
231.6
|
|
|
(a) Title to cash received and processed in certain of our secure cash logistics operations transfers to us for a short period of time. The cash is
generally credited to customers’ accounts the following day and we do not consider it as available for general corporate purposes in the
management of our liquidity and capital resources and in our computation of Net Debt.
Net Debt is a supplemental financial measure that is not required by, or presented in accordance with GAAP. We use Net Debt as a measure of
our financial leverage. We believe that investors also may find Net Debt to be helpful in evaluating our financial leverage. Net Debt should
not be considered as an alternative to Debt determined in accordance with GAAP and should be reviewed in conjunction with our
consolidated balance sheets. Set forth above is a reconciliation of Net Debt, a non-GAAP financial measure, to Debt, which is the most
directly comparable financial measure calculated and reported in accordance with GAAP. Net Debt excluding cash and debt in Venezuelan
operations was $307 million at March 31, 2012, and $242 million at December 31, 2011.
Non-GAAP Reconciliations - Net Debt