Attached files
| file | filename |
|---|---|
| 8-K - FORM 8-K - ATHENAHEALTH INC | d341593d8k.htm |
| EX-99.1 - PRESS RELEASE - ATHENAHEALTH INC | d341593dex991.htm |
Exhibit 99.2
| First Quarter Fiscal Year 2012
|
| |
| Prepared Remarks | April 26, 2012 | |
| Jonathan Bush, President, Chairman & Chief Executive Officer | ||
| Tim Adams, Senior Vice President, Chief Financial Officer |

About These Remarks
The following commentary is provided by management in conjunction with the first quarter fiscal year 2012 earnings press release issued by athenahealth, Inc. (the “Company,” “we,” or “athenahealth”). These remarks represent management’s current views on the Company’s financial and operational performance and are provided to give investors and analysts more time to analyze and understand our performance in advance of the earnings conference call. These prepared remarks will not be read on the conference call. A complete reconciliation between GAAP and non-GAAP results as well as a summary of supplemental metrics and definitions is provided in the tables following these prepared remarks.
Earnings Conference Call Information
To participate in the Company’s live conference call and webcast, please dial 800-447-0521 (or 847-413-3238 for international calls) using conference code No. 32023096, or visit the Investors section of the Company’s web site at www.athenahealth.com. A replay will be available for one week following the conference call at 888-843-7419 (and 630-652-3042 for international calls) using conference code No. 32023096. A webcast replay will also be archived on the Company’s website.
Safe Harbor and Forward-Looking Statements
These remarks contain forward-looking statements, which are made pursuant to the safe harbor provisions of the Private Securities Litigation Reform Act of 1995, including statements reflecting management’s expectations for future financial and operational performance and operational expenditures, expected growth, and business outlook; statements regarding the benefits of the Company’s service offerings, the Company’s research and development efforts and product offering plans, the further integration of the Company’s services and the resulting benefits, changes in the Company’s contracting, changes in the types of providers and health care entities the Company serves and the range of tasks the Company performs for clients, the Company’s sales and marketing activities and plans, the Company’s hiring and training plans, the potential for cross-sales among service offerings and sales involving multiple services, the Company’s implementation pipeline, the impact of the transition to the ANSI 5010 standard and the ICD-10 code set and the Company’s implementation thereof, and the creation of a sustainable market for health information exchange, a social network for health care, and a national health IT network; statements made during the Company’s 4th Annual Investor Summit; and statements found under the Company’s “Reconciliation of Non-GAAP Financial Measures to Comparable GAAP Measures” section of these remarks. The forward-looking statements in these remarks do not constitute guarantees of future performance. These statements are neither promises nor guarantees, and are subject to a variety of risks and uncertainties, many of which are beyond the Company’s control, which could cause actual results to differ materially from those contemplated in these forward-looking statements. In particular, the risks and uncertainties include, among other things: the Company’s fluctuating operating results; the Company’s variable sales and implementation cycles, which may result in fluctuations in its quarterly results; risks associated with the acquisition and integration of companies and new technologies, including those related to the Company’s ability to successfully integrate the athenaCoordinatorSM service and successfully scale the Proxsys services and technologies to achieve expected synergies; risks associated with its expectations regarding its ability to maintain profitability; the impact of increased sales and marketing expenditures, including whether increased expansion in revenues is attained and whether impact on margins and profitability is longer term than expected; changes in tax rates or exposure to additional tax liabilities; the highly competitive industry in which the Company operates and the relative immaturity of the market for its service offerings; and the evolving and complex governmental and regulatory compliance environment in which the Company and its clients operate. Existing and prospective investors are cautioned not to place undue reliance on these forward-looking statements, which speak only as of the date hereof. The Company undertakes no obligation to update or revise the information contained in these remarks, whether as a result of new information, future events or circumstances, or otherwise. For additional disclosure regarding these and other risks faced by the Company, see the disclosures contained in its public filings with the Securities and Exchange Commission, available on the Investors section of the Company’s website at http://www.athenahealth.com and on the SEC’s website at http://www.sec.gov.
1
Use of Non-GAAP Financial Measures
These remarks contain non-GAAP financial measures, as defined by SEC Regulation G. The GAAP financial measure most directly comparable to each non-GAAP financial measure used or discussed, and a reconciliation of the differences between each non-GAAP financial measure and the comparable GAAP financial measure, are included following these prepared remarks or can be found within the Company’s first quarter fiscal year 2012 earnings press release on the Investors section of the Company’s web site at http://www.athenahealth.com.
Opening Remarks
athenahealth is off to a strong start in fiscal year 2012 and continues to chip away at the inefficiencies in health care. We are maniacally focused on improving health information exchange and making it easier for our clients to conduct business in the health care market place. To this end, we are constantly developing services and business models that allow medical care givers to make more money for doing the right thing. This work has taken us to Washington, D.C. to explain the importance of creating a sustainable business model for health information exchange. We have been gratified by the U.S. Department of Health and Human Services, Office of Inspector General’s (OIG) approval to roll out our new pricing model. Now with permission in hand, we are setting out to create a market where the efficient exchange of health information is reliable as well as legal. The implications for our business and for health care appear to be vast. We are already offering capabilities that allow our clients to build effective accountable care organizations and become managers of risk by gaining visibility into their referral practices and improving management of their patient populations. Today, athenahealth’s care coordination service offerings include athenaCoordinatorSM for referral coordination and athenaCommunicator® for population health management. While our full athenaCoordinator offering provides hospitals with services including order transmission, insurance pre-certification, and patient registration, all receivers of patient referrals can now be on the athenaCoordinator network for as little as $1 per order exchange. Furthermore, in order to incent senders as well as receivers, we have brought care coordination one step further by changing the pricing of athenaClinicals® to include a $1 fee per closed-loop order—meaning we only get paid when an order is tied to a result. This new pricing creates incentives for both senders and receivers by more closely aligning the economics of electronic health records (EHR) with market dynamics. Meanwhile, as this difficult but important change to our pricing hits the market, we are continuing to improve our core services. We introduced provider credentialing, enhanced the exchange of health history information between patients and their care givers, and launched an advanced training and client certification program. These expanded services are having their desired effect. The work our clients are required to perform and the frequency of our client calls for assistance are both declining. This important work does not come without cost, but our efficiency efforts are keeping up, as proven by our operational performance. All of this work is critical to achieving our vision of becoming a health information backbone that helps health care work as it should.
Results Overview
athenahealth’s top line results for the first quarter of fiscal year (FY) 2012 reflect strong revenue growth:
| • | Total revenue: |
| • | $96.6 million in Q1 2012, representing 38% growth over $69.9 million in Q1 2011 |
Our bottom line results for Q1 2012, consistent with our growth strategy, demonstrate strong sales, marketing, and research and development investments, and a focus on operating leverage:
| • | Non-GAAP Adjusted Gross Profit: |
| • | $59.4 million, or 61.5% of total revenue, in Q1 2012, an increase of 36% over $43.7 million, or 62.5% of total revenue, in Q1 2011 |
| • | GAAP selling and marketing expense: |
| • | $23.7 million, or 24.6% of total revenue, in Q1 2012, an increase of 40% over $16.9 million, or 24.2% of total revenue, in Q1 2011 |
2
| • | GAAP research and development expense: |
| • | $7.2 million, or 7.4% of total revenue, in Q1 2012, an increase of 41% over $5.1 million, or 7.3% of total revenue, in Q1 2011 |
| • | GAAP general and administrative expense: |
| • | $16.2 million, or 16.8% of total revenue, in Q1 2012, versus $11.7 million, or 16.8% of total revenue, in Q1 2011 |
| • | Non-GAAP Adjusted EBITDA: |
| • | $17.1 million, or 17.7% of total revenue, in Q1 2012, an increase of 27% from $13.4 million, or 19.1% of total revenue, in Q1 2011 |
| • | Non-GAAP Adjusted Net Income: |
| • | $6.3 million, or $0.17 per diluted share, in Q1 2012, an increase of 6% from $5.9 million, or $0.17 per diluted share, in Q1 2011 |
We measure our performance based on a balanced scorecard model as previewed at the Investor Summit on December 15, 2011. We believe that this framework is an excellent report card for our performance for the current year and that it measures the key performance indicators required for long-term success. The table below shows the scorecard results for Q1 2012 as well as the full year 2012 targets as presented at the Investor Summit. For certain scorecard metrics (i.e., Client DAR, DAR in Client Work Buckets, Provider Documentation Time, and Client Tickets per Provider), our goal is to improve or effectively reduce the scorecard metrics results throughout the year. As a result, the full year target is lower than the Q1 2012 actual result for these metrics.
| Weight | Q1 2012 Results |
Fiscal Year 2012 Targets |
||||||||||
| Stability |
||||||||||||
| Voluntary Turnover |
10 | % | 2 | % | 10 | % | ||||||
| Corporate Compliance |
5 | % | 88 | % | 95 | % | ||||||
| Employee Engagement |
0 | % | 4.1 | 4.1 | ||||||||
| Stability Results |
15 | % | 115 | % | 100 | % | ||||||
| Performance |
||||||||||||
| Client Days in Accounts Receivable (DAR) |
10 | % | 40.0 | 37.5 | ||||||||
| DAR in Client Work Buckets |
10 | % | 8.3 | 7.9 | ||||||||
| Client Collection Rate |
5 | % | 96 | % | 96 | % | ||||||
| Provider Documentation Time per Appointment |
5 | % | 5.4 | 5.0 | ||||||||
| Performance Results |
30 | % | 101 | % | 100 | % | ||||||
| Satisfaction |
||||||||||||
| Client Touches per Claim |
5 | % | (a) | 10% improvement | ||||||||
| Client Tickets per Provider (per month) |
5 | % | 0.34 | 0.35 | ||||||||
| Client Satisfaction |
10 | % | 86 | % | 85 | % | ||||||
| Satisfaction Results |
20 | % | 103 | % | 100 | % | ||||||
| Financial |
||||||||||||
| Total Revenue |
10 | % | $ | 96.6M | $ | 430M | ||||||
| Non-GAAP Adjusted Operating Income |
5 | % | $ | 11.6M | $ | 60M | ||||||
| Financial Results |
15 | % | 123 | % | 100 | % | ||||||
| Growth |
||||||||||||
| Bookings |
20 | % | (a) | 30% growth | ||||||||
| Growth Results |
20 | % | 97 | % | 100 | % | ||||||
| Total Results |
100 | % | 106 | % | 100 | % | ||||||
| (a) | Since the client touches per claim and bookings metrics contain highly sensitive data, we do not disclose all of the specific performance measures and targets, because we believe that such disclosure would result in serious competitive harm. |
3
We achieved a scorecard result of 106% of goal in Q1 2012 and believe that the Company’s underlying drivers of long-term success remain strong:
| • | Employee engagement at 4.1 out of 5.0 in Q1 2012 versus Q1 2012 goal of 4.1 and Q1 2011 actual result of 4.1 |
| • | Client satisfaction of 86% in Q1 2012 versus Q1 2012 goal of 85% and Q1 2011 actual result of 86% |
| • | Average client Days in Accounts Receivable (DAR) of 40.0 days versus Q1 2012 goal of 39 days and Q1 2011 actual result of 41.0 |
| • | 8.3 average DAR in client work buckets, favorable to our Q1 2012 goal of 9.0 days |
| • | Client collection rate of 96%, on pace with our Q1 2012 goal of 96% |
athenahealth’s client base continues to expand while client adoption of other services in the athenahealth service suite grows rapidly. During Q1 2012:
| • | 80% of all new athenaCollector® deals included athenaClinicals, up from 69% in Q1 2011 |
| • | 62% of all new athenaCollector deals included both athenaClinicals and athenaCommunicator, up from 25% in Q1 2011 |
| • | Net new physicians and providers added sequentially to the network were as follows: |
| athenaCollector | athenaClinicals | athenaCommunicator | ||||||||||||||||||||||
| Active physicians and providers: | Physicians | Providers | Physicians | Providers | Physicians | Providers | ||||||||||||||||||
| Beginning balance (Q4 2011) |
23,210 | 32,740 | 4,662 | 6,525 | 4,098 | 5,830 | ||||||||||||||||||
| Q1 2012 net new additions |
891 | 1,183 | 669 | 877 | 722 | 970 | ||||||||||||||||||
| Ending balance (Q1 2012) |
24,101 | 33,923 | 5,331 | 7,402 | 4,820 | 6,800 | ||||||||||||||||||
| Sequential growth % |
4 | % | 4 | % | 14 | % | 13 | % | 18 | % | 17 | % | ||||||||||||
| • | Net new physicians and providers added to the network since Q1 2011 were as follows: |
| athenaCollector | athenaClinicals | athenaCommunicator | ||||||||||||||||||||||
| Active physicians and providers: | Physicians | Providers | Physicians | Providers | Physicians | Providers | ||||||||||||||||||
| Beginning balance (Q1 2011) |
19,778 | 27,944 | 2,910 | 4,161 | 934 | 1,564 | ||||||||||||||||||
| TTM net new additions |
4,323 | 5,979 | 2,421 | 3,241 | 3,886 | 5,236 | ||||||||||||||||||
| Ending balance (Q1 2012) |
24,101 | 33,923 | 5,331 | 7,402 | 4,820 | 6,800 | ||||||||||||||||||
| Y/Y growth % |
22 | % | 21 | % | 83 | % | 78 | % | 416 | % | 335 | % | ||||||||||||
athenaCollector network performance metrics were as follows for Q1 2012:
| • | $2,081,686,428 posted in total client collections, up 29% from Q1 2011 |
| • | 17,839,150 total claims submitted, up 31% from Q1 2011 |
| • | 78.0% electronic remittance advice (ERA) rate, an improvement of over three points from Q1 2011 |
| • | 91.3% first pass resolution (FPR) rate, down from 94.1% at Q1 2011 due to the ANSI 5010 transition |
Product Development Discussion
Product development at athenahealth is organized around the goal of being the best in the world at getting medical care givers paid for doing the right thing. In order to fulfill this mission, we deliver services backed by cloud-based software, proprietary knowledge, and robust back-office services.
athenaCollector Service Offering
athenaCollector is our cloud-based medical billing and practice management solution. It is the foundation of our service portfolio and entered general availability in 2000.
Exiting Q1 2012, 96.8% of our electronic transactions are in compliance with the new American National Standards Institute (ANSI) 5010 standard. With ANSI 5010 mostly behind us, we have shifted our focus to the next big change in health care compliance, the International Statistical Classification of Diseases
4
and Related Health Problems, 10th Revision (ICD-10). The athenahealth team was not surprised by the Centers for Medicare and Medicaid Services (CMS) proposal to delay ICD-10 transition from October 1, 2013, to October 1, 2014. This proposed delay represents another example of the industry’s inability to cope with change. Unlike the traditional software model, our cloud-based services model adapts quickly to change as demonstrated by our success with the National Provider Identifier (NPI) adoption, ANSI 5010 transition, and Meaningful Use (MU) attestation. Mandates like NPI, MU, ANSI 5010, and ICD-10 give us the opportunity to demonstrate the power of our cloud-based services and highlight the shortcomings of the traditional software model. Despite the proposed delay in the ICD-10 mandate, we are forging ahead with our preparation for the ICD-10 conversion and will re-evaluate our program as necessary pending the official decision from CMS. You can read more about our reaction to the ICD-10 postponement in the blog post “ICD-10 Postponed, Progress-Deferred - How the Industry Buckled Under the Weight of Change”.
The athenaCollector team is driven by our mission to be medical care givers’ most trusted service. Our product development efforts are focused on expanding the value delivered by athenaCollector by taking on more administrative work and expanding our services to support a client base beyond the traditional medical practice. In keeping with this mission, we are bolstering athenaCollector’s value proposition by adding provider credentialing to the services suite. We brought multiple clients live, including a multi-state health services company, with this expanded service during Q1 2012, and we plan to add more clients to it throughout the year. Provider credentialing is a natural extension of our existing provider enrollment service. By taking on this work, athenahealth can further improve our clients’ operational and financial performance by providing additional and increased benefits. These benefits include a more streamlined enrollment process, improved contract adherence with payers, reduced denials, and improved cash flow.
Finally, one of our key measures of client performance, client days in accounts receivable (DAR), has once again trended back down. Client DAR was an average of 40.0 days in Q1 2012, compared to 38.9 days in Q4 2011 and 41.0 days in Q1 2011. The switch to ANSI 5010 negatively impacted client DAR early in the quarter due to processing delays at claims intermediaries. However, after addressing many of the ANSI 5010 obstacles, client DAR rebounded nicely and exited March at 38.6 days, which was below our Q1 goal of 39 days. Managing and reducing client DAR is critical to improving and maintaining our clients’ financial health. Our 2012 goal is to reduce client DAR even further to 37.5 days. Taking on more work on behalf of our clients with services such as provider credentialing and successfully managing industry changes will help us achieve this goal.
athenaClinicals Service Offering
athenaClinicals is our cloud-based electronic health record (EHR) management service. It entered general availability in 2006 and was made available as a stand-alone service in 2010.
Up until the last minute of the 2011 Stage 1 MU deadline, our Meaningful Use Enrollment Services team remained focused on getting our athenaClinicals clients over the finish line. We are proud to report that our final 2011 Stage 1 Medicare MU attestation rate is 85%. This compares very favorably to data released by the CMS in early March showing 49% (57,765 of 118,146) of registered providers had attested and qualified for Medicare payments. MU represents the first set of public metrics that uniformly measure performance across the various health care information technology (HCIT) vendors. athenahealth has outperformed the industry throughout the 2011 Stage 1 MU attestation process, further demonstrating the value and advantage of our cloud-based services model. The performance bar has been raised once again with the notice of proposed rule-making for Stage 2 MU, particularly around patient engagement, clinical decision-making tools, and health information exchange. athenahealth’s integrated suite of products, including our care coordination service offerings, present health care givers with the best platform to comply with and profit within health care’s complex web of rules and standards. You can read more about how athenahealth achieved success with the 2011 Stage 1 MU in the blog post “Crossing the Meaningful Use Finish Line: Stage 1 Results”.
5
The MU incentive program has driven adoption of certified EHR technology, representing an important step towards modernizing the health care industry. However, medical care givers can only fully maximize the benefits of EHR technology when combined with a free market for health information exchange. One of the major problems in health care today is the lack of financial incentives for information sharing across the health care supply chain. athenahealth is working on addressing this practical and tactical problem from many angles. We believe that our new order-based pricing for athenaClinicals helps us get there. We recently launched our new athenaClinicals pricing model, which includes a reduced fixed percentage of collections fee for our core EHR offering plus a transaction-based fee for our care coordination services. The $1-per-order transaction fee is charged to either the athenaClinicals ordering provider or the supply chain order receiver. If the order is sent to an in-network provider or facility, the receiver will pay the $1 transaction fee for receipt of the order. An “in-network” provider is defined as a receiver that is using the order transmission service of athenaCoordinator. If the order is sent to an out-of-network provider or facility, the provider will pay $1 when that order is closed with a result recorded in athenaClinicals. An “out-of-network provider” is defined as a provider that is not signed up for athenaCoordinator. We expect this new pricing model to be revenue neutral because we are simply shifting the costs from athenaClinicals clients to the receivers, who are benefitting from the value of the clean order. This new pricing model enhances our financial alignment strategy in that we are going “at-risk” for results. According to our analysis, almost 50% of physicians’ orders are not closed, resulting in loss of care or duplication of care. The new athenaClincials pricing model will drive better care coordination by incenting improved communication and collaboration between senders and receivers. As an additional benefit, the cost to our athenaClinicals clients will decrease as our receiver network grows (athenaCoordinator clients).
athenahealth strives to be the best in the world at getting medical care givers paid for doing the right thing. Using EHR technology effectively and efficiently is a complicated task, and we are focused on supporting clinical excellence throughout our client base. During 2011, we established the athenaCare division, led by our Chief Medical Information Officer, Dr. Todd Rothenhaus. The mission of athenaCare is to drive provider productivity and clinical effectiveness. Under Dr. Rothenhaus’ direction, the athenaCare team is expanding the specialties we support by building a deeper content library for medical sub-specialties such as nephrology, pulmonary medicine, and rheumatology and for surgical sub-specialties including cardiac surgery, hand surgery, and thoracic surgery. We will be bolstering our clinical knowledge further in 2012 by adding another physician to the athenaCare team. In addition to increasing our knowledge experts—or ‘Jedis’—internally, we are also imparting this expanded knowledge to our client base by launching an advanced training and client certification program. We are invested in optimizing client performance and will be monitoring key performance indicators, such as provider documentation time, in order to track our progress. As of Q1 2012, provider documentation time was 5.35 minutes, which is on track to meet our 2012 scorecard goal of 5.0 minutes. This knowledge and insight into the performance of our client base is unique to athenahealth’s cloud-based services model. athenahealth is one of the only HCIT vendors with the ability to track performance measures like provider documentation time as well as the financial incentive to monitor and improve performance across our client base.
athenaCommunicator Service Offering
athenaCommunicator is our cloud-based patient communication management service. It entered general availability in 2010 and, at this time, requires adoption of athenaCollector or athenaClinicals.
The athenaCommunicator product team is focused on improving patient interactions outside of the physician’s office. The athenaCommunicator service offering reduces the administrative work required to manage patient relationships, improves self-pay collections and increases schedule density. The demonstrated benefits of this service offering continue to drive increased adoption across the client base. As of Q1 2012, the adoption rate was 20% as compared to 18% in Q4 2011. As we increase the penetration of athenaCommunicator across our athenaCollector client base, the volume of work performed on behalf of our clients continues to grow dramatically. athenaCommunicator delivered over
6
9.5 million automated messages during Q1 2012 across our active patient base (over 3.5 million patients). Increased adoption of the patient portal will allow our clients to fully maximize the benefits of this service offering. Usage of the patient portal significantly reduces administrative tasks and improves patient experience both inside and outside the physician’s office. In order to enjoy these benefits, our clients are driving patient portal adoption as demonstrated by a 41% increase in the number of patients registered on the patient portal, from 330,000 patients as of Q4 2011 to 464,000 as of Q1 2012. Finally, managing self-pay collections is critical to our clients’ financial health and continues to grow significantly. athenaCommunicator assisted our clients by collecting over $2.3 million dollars in self-pay collections via the patient portal and our live operator service during Q1 2012. This compares to $3.0 million collected on behalf of our clients in self-pay collections during all of 2011.
In order to further enhance the value proposition of our integrated services, the athenaCommunicator team is working to deepen the level of integration of this service offering with athenaClinicals. These efforts include improving the data capture of health history information, improving clinical order compliance, and initiating population health management. Specifically, patients can access and update their health history data via the patient portal in advance of their scheduled appointments. Health history information populated from the patient portal is now automatically captured in athenaNet, enabling physicians to review and update this information directly in the athenaClinicals 5-stage workflow. This automatic data capture further improves the clinical workflow by reducing the time spent during the intake stage while improving the quality of the information captured during the intake stage of the encounter. In addition, athenaCommunicator will improve clinical compliance by adding a clinical order follow-up engine to our knowledge base. In order to encourage patient compliance with a physician order, the clinical order follow-up engine will trigger an alarm if an order is not completed by a specified time. Patients are then reminded, via automated messaging and live operator campaigns, to comply with the physician order and provide an update to the order status via the patient portal. The clinical order follow-up engine was released to a select group of clients for beta testing during Q1 2012 and will be released to the entire customer base by June 2012. Finally, the athenaCommunicator team initiated the population health management project during Q1 2012. With this initiative, we will utilize the group call platform under athenaCommunicator in conjunction with the athenaClinicals quality management engine to assist athenaClinicals providers in managing their patient populations. Once completed, this program will help our clients improve patient compliance with complex clinical quality measures. For example, athenaCommunicator will generate patient outreach campaigns by specialty type and provide automated tools to assist physicians with population management. The athenaCommunicator service offering assists our client base with appointment compliance, financial compliance, and, now, clinical compliance.
athenaCoordinator Service Offering
athenaCoordinator is our cloud-based care coordination service for order transmission, insurance pre-certification and patient registration among physicians and hospitals, surgical centers and imaging centers. We also offer a basic athenaCoordinator service offering (f/k/a OrderFlowSM) which is a cloud-based order transmission service among all receiver types and physicians using athenaClinicals. athenaCoordinator entered general availability in 2011 following the acquisition of Proxsys LLC and the basic athenaCoordinator service offering entered general availability in 2012.
Our care coordination service offering represents athenahealth’s next big step toward our vision of becoming a health information backbone that helps health care work as it should. While an enormous amount of money has been spent on individual “islands” within the health care system, the effective coordination of care among health care providers is still limited. A New England Journal of Medicine article on care coordination provided the following statistics from studies regarding the poor communication among health care providers:
| • | In 49% of referrals, the receiving physician was given no information |
| • | In 55% of referrals, the ordering physician received no information back from the receiving physician |
7
| • | 28% of ordering physicians and 43% of receiving physicians were dissatisfied with the quality of information they received from the other |
| • | 17% of patients reported that their test or medical records were not available when they had an appointment1 |
Furthermore, poor care coordination frustrates patients, impacts the quality of care delivered and results in higher costs. A separate study published in 2011 by the International Journal of Clinical Practice indicated that 27% of reported medical errors in the U.S. were the result of poorly coordinated care.2 This study also showed that poorly coordinated care resulted in a 140% increase in the likelihood of medical errors.3
In health care today, there is no broad market for effective health information exchange. The right economic incentives do not exist to encourage the sharing of health care information. In order for health care to become more efficient, more effective and less expensive, it is essential for all members of the health care supply chain to coordinate their efforts to bring about the efficient exchange of health care information. We believe that our athenaCoordinator service offering introduces the first sustainable business model for effective care coordination for the health care industry.
athenaCoordinator product development remains focused on re-writing Proxsys’ existing web-based application into athenaNet, establishing the foundation for further product automation and integration into athenaCollector and athenaClinicals. We launched a beta version of our re-written application this month and will complete the national rollout by Q3 2012. This effort has streamlined the order entry workflow for all sending providers and further enhances the integration and automation for those providers on athenaCollector and athenaClinicals. All orders are now entered directly into athenaNet with specific information, such as patient demographics and insurance information, populated automatically from athenaCollector and athenaClinicals. This seamless integration produces end-to-end visibility of the life cycle of an order within athenaNet. Furthermore, this integration into athenaNet will improve the operational efficiencies of the athenaCoordinator service offering by expanding the billing Rules Engine, building workflow distribution tools, and utilizing the automated eligibility checking engine. An immediate benefit realized from the integrated application is the utilization of athenahealth’s automated eligibility-checking engine, which reduces manual work and allows our services team to focus on more complex and value-added activities. Our services team can now directly access athenaClinicals to lookup patient demographics and insurance information, thereby reducing time-consuming outreach to the ordering physician’s office. Over time, we will expand the Rules Engine, workflow distribution tools, and other automated routines to drive further automation.
We recently launched our basic athenaCoordinator service offering. We had experimented with the name OrderFlow at our 2012 User Conference and learned that the terminology was confusing to our clients. This basic athenaCoordinator service offering streamlines the order process between referring physicians on athenaClinicals and all receiver types. This service offering can be purchased stand-alone or as part of the athenaOneSM integrated service offering. As an “athena-light” service, it enables the rapid addition of receivers onto the athenahealth network through quick, easy, and free implementation. The benefits offered to these receivers include reduced administrative tasks associated with receiving inbound orders; improved accuracy of orders generated from validated athenaClinicals data, including eligibility status; and detailed reporting on order patterns. These receiver clients are clearly visible within the athenaClinicals order workflow and are included in a separate list of athenahealth network partners. This approach simplifies the search option when athenaClinicals physicians generate orders. The charge for this service offering is $1 per order received.
| 1 | Bodenheimer T, Coordinating Care—A Perilous Journey through the Health Care System, N Engl J Med 2008;358:1064-71, 1065. |
| 2 | See Lu C Y and Roughead E, Determinants of patient-reported medication errors: a comparison among seven countries, Int J Clin Pract, July 2011; 65: 7, 733–740, 736. |
| 3 | Id. |
8
Anodyne Solutions Service Offerings
Anodyne Solutions are our cloud-based business intelligence services for health care professionals. These services have been generally available since 2004 through Anodyne Health Partners, Inc., which athenahealth acquired in October of 2009. Anodyne Solutions are fully integrated with athenaCollector and will be integrated with athenahealth’s other service offerings. They can also be adopted on a stand-alone basis.
The Anodyne solutions have been fully integrated with athenaCollector and are now generally available to all athenaCollector clients effective April 2012. The Anodyne solutions, branded athenaInsightSM, offer athenahealth clients a collection of services combining cloud-based software, unparalleled industry knowledge, and experienced support staff. athenaInsight expands the reporting tools currently available in athenaNet and provides more actionable insight for our client base. We believe that the opportunity to acquire greater visibility into the performance of medical organizations will drive adoption of athenaInsight across our existing client base. In addition, the Anodyne services will continue to be marketed on a stand-alone basis to clients across the entire spectrum of legacy software practice management systems.
Our business intelligence solutions, consisting of Anodyne Analytics and Anodyne Dashboard, transform data into information critical to run a profitable medical practice. Anodyne Analytics organizes and analyzes billing and claims data across medical practices, allowing decision-makers to quickly and easily present and analyze data through a wide array of business performance metrics. These metrics can be viewed either as broad, practice-wide summaries or as discrete, highly specific analyses based on complex user-defined requests. The Anodyne Dashboard presents business data at a higher, more summarized level and distributes results and performance trends against benchmarks and targets. This service offering is designed for use by physician management, practice administrators, and executive management. It provides the necessary insight for organizational alignment by measuring physician productivity and administrative productivity and effectiveness.
One of the key themes of the Healthcare Information and Management Systems Society (HIMSS) Annual Conference this year was the importance and value of business intelligence tools. The Anodyne solutions significantly enhance the reporting already available in athenaCollector and other practice management systems. Anodyne product development remains focused on delivering unique and powerful insights into critical information for large medical groups and health systems.
Revenue Discussion
Our total revenue of $96.6 million in Q1 2012 grew by 38% (or $26.6 million) over Q1 2011. Our revenue growth was primarily driven by athenaCollector client base expansion and growth in athenaClinicals, athenaCommunicator, and athenaCoordinator services.
In terms of trends in our recurring revenue base, same-store analysis of claims created—a proxy for physician office utilization—indicates that physician office activity in Q1 2012 increased modestly over physician office activity during Q1 2011.
Client Base Discussion
The total number of physicians who have gone live on athenaCollector, our core service offering, is the metric we use to define our client base and market share. Annual growth in total revenue continues to outpace growth in our physician base. We believe that this trend will continue as athenaClinicals and athenaCommunicator are included in a growing portion of new deals and as adoption of these services spreads across our existing client base.
Our launch of the athenaOne integrated service offering during Q1 has been highly successful as proven by the jump in combined deals sold this quarter. During Q1 2012, 80% of all new athenaCollector deals included athenaClinicals, and 62% of all new athenaCollector deals included both athenaCommunicator
9
and athenaClinicals, up from 69% and 25%, respectively, during Q1 2011. Among “live” (i.e., implemented and active) athenaCollector clients, adoption of athenaClinicals and athenaCommunicator continues to grow rapidly and resulted in continued growth to our installed base across all of our service offerings.
athenahealth Service Offering Adoption
athenaCollector Clients
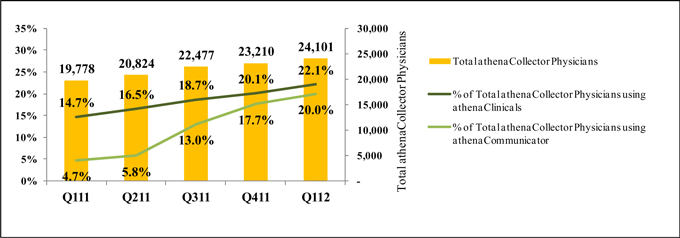
During Q1 2012, total active physicians on athenaCollector grew by 22% year-over-year to 24,101. On a sequential basis, we added 891 net new active physicians on athenaCollector versus 581 in Q1 2011. Our quarterly net new physician additions may vary widely due to the number and size of clients that go live in a particular quarter.
athenaClinicals Clients
We continue to experience rapid growth in client adoption of athenaClinicals. Total active physicians live on athenaClinicals grew by 83% year-over-year to 5,331. On a sequential basis, we added 669 net new active physicians on athenaClinicals versus 527 in Q1 2011. This equates to an overall adoption rate of 22% of total athenaCollector physicians, up from 15% in Q1 2011. We expect the athenaClinicals client base to increase significantly over time due to cross-selling within our existing base and growth in the volume of combined deals.
athenaCommunicator Clients
Our athenaCommunicator client base is also growing rapidly. Total active physicians live on athenaCommunicator grew by an impressive 416% year-over-year to 4,820, compared to 168% year-over-year in Q1 2011. On a sequential basis, we added 722 net new active physicians on athenaCommunicator versus 198 in Q1 2011. This equates to an overall adoption rate of 20% of total athenaCollector physicians, up from 5% in Q1 2011. We expect the athenaCommunicator client base to increase significantly over time due to cross-selling within our existing base and growth in the volume of combined deals.
New Deals
As mentioned last quarter, we sold three new enterprise deals in December 2011. Due to confidentiality reasons, we were not able to release any details regarding these new deals at the time of sale. However, we recently received approval from one of these new clients to announce our new partnership. ProMedica selected athenaCollector and Anodyne Solutions for its employed physician organization of 400 providers. Established in 1986, ProMedica is a mission-based, not-for-profit health care organization serving northwest Ohio and southeast Michigan. ProMedica is expected to go-live in phases during 2012.
10
Client Implementations
In terms of our publicly disclosed implementation pipeline as of March 31, 2012, the athenaCollector implementation at St. Vincent’s HealthCare (~120 physicians/providers) was largely complete, while the implementation at Detroit Medical Center (DMC) (~125 physicians; ~400 providers) is progressing well and is scheduled to go-live in Q2/Q3. The athenaClinicals implementation was completed at Capella Healthcare (~90 physicians; ~130 providers) and is largely complete at Steward Health Care System LLC (f/k/a Caritas Christi - ~170 physicians; ~250 providers). The athenaClinicals implementations are progressing well at Alexian Brothers Health System (~80 physicians; ~100 providers) and Harbin Clinic (~140 physicians; ~210 Providers) with go-lives targeted for Q2 2012. Finally, implementations for all three services at HealthStar Physicians (~40 physicians; ~60 providers) are progressing as planned. HealthStar Physicians went live on athenaCollector in Q1 2012 and is scheduled to go-live on athenaClinicals and athenaCommunicator in Q2 and Q3, respectively. University Hospitals academic medical center (~850 physicians; ~1,000 providers) is expected to go live on athenaCollector by means of a phased implementation in the second half of 2012.
Non-GAAP Adjusted Gross Margin Discussion
Our Non-GAAP Adjusted Gross Margin was 61.5% for Q1 2012, down one point from 62.5% in Q1 2011. As anticipated, this year-over-year decline in our Non-GAAP Adjusted Gross Margin was driven by our athenaCoordinator service offering. One of our goals is to improve gross margin on a service-line basis each year. As previously discussed, the expansion of our new service offerings, such as athenaCoordinator, will serve as a headwind to margin expansion until these new services become more automated and scalable. Our full year 2012 guidance for Non-GAAP Adjusted Gross Margin of 61.5% to 62.5% assumes athenaCoordinator will compress margin.
Marketing and Selling Discussion
As an innovative, high growth company with a relatively small share of a very large market opportunity, our business model is still new to health care and market awareness remains our biggest challenge. To improve awareness, we remain focused on expanding and enhancing our selling and marketing activities. These activities incur both fixed and variable costs, as they range from investment in personnel and infrastructure to spending on new advertising campaigns and paid search terms. We continue to experiment with and expand upon our awareness-building efforts as quickly as we deem them to be effective. The productivity of these investments is largely measured over the long term, particularly as it may take six to nine months of implementation before new clients fully contribute to revenue and join the ranks of our active client base.
Marketing Update
The athenahealth marketing organization encompasses our growth and sales operations, event and partner marketing, inside sales agents (ISAs), advertising, corporate communications, and product marketing teams. This organization executes in-market investments in an effort to generate new business opportunities for athenahealth.
We remain ever vigilant in assessing the effectiveness of our marketing programs and utilize an established framework to assist us in measuring the productivity of these investments. Similar to our cloud-based services model, we employ the combination of technology, knowledge, and people to measure the effectiveness and the productivity of each marketing investment. We gauge effectiveness based on the number of responses, leads, and meetings generated by each investment. Productivity is measured based on the number of proposals and deals signed. In order to continue our 30% revenue growth trajectory, we plan to increase bookings by 30% and will systematically track our progress against this goal throughout the year.
Our 2012 marketing efforts are off to a strong start. Our market attack planning and coordination efforts are well underway. We have successfully scaled our flywheel engine and have hosted 25 flywheel dinner seminars during Q1 2012. These flywheel events continue to pay off with increased awareness and strong
11
lead generation. Attendance at these events, a leading indicator of success, has increased by an average of 26% as compared to 2011. In addition, we are expanding the wildly successful athenahealth Leadership Institute program and plan to host six events during 2012. This content-rich forum provides top leaders from the health care industry an opportunity to explore strategies to succeed and lead in today’s challenging health care environment. Finally, we made our largest investment ever in the Health Information and Management Systems Society (HIMSS) tradeshow with our new 30’x40’ booth and adjoining 20’x20’ theatre. This investment has paid off with a 50% increase in prospect meetings as compared to last year. A “Cloud” celebration at HIMSS started with a “Cloud Party” we hosted to begin building an “ecosystem” of collaborative, like-minded companies to support our client base. Cloud technologies were also a prevalent theme at HIMSS this year, further validating our business model and driving increased market awareness. For more information on how athenahealth is highlighting the importance and benefits of cloud computing in health care, please read the following blog by Jonathan Bush recently featured in Wired-Cloudline: “Heady Times for Health Care in the Cloud”.
Earlier this month, our marketing organization hosted athenahealth’s 2012 User Conference in Boston, Massachusetts. Over the course of three days, over 800 clients attended over 50 informative sessions and panel discussions on topics ranging from what’s happening with EMRs, MU, and health information technology on Capitol Hill, to how to maximize schedule density at your medical practice. We were honored to have Abraham Verghese, MD, an accomplished physician and NY Times best-selling author, deliver our keynote address. The National Coordinator for Health Information Technology, Farzad Mostashari, MD, also addressed the conference attendees. Our user conference provides an essential ongoing event for educating our clients about important industry trends, eliciting their feedback, and helping them to improve their practices’ efficiency and financial health. In addition, athenahealth uses this forum to honor individuals and organizations that embody and extend our vision of making health care work as it should. This year we presented both Dr. Abraham Verghese and Rosedale Infectious Diseases with our athenahealth Vision Award. You can read more about our guest speakers and the themes of this year’s User Conference in the following blog “The Role of EHR and ‘Attentiveness’ to the Patient”.
Selling Update
The athenahealth sales organization includes all quota-carrying sales representatives, as well as our sales team leaders, channel sales team, and sales training and development organization.
Q1 2012 was the first quarter in which we employed our new sales alignment strategy throughout all sales and channel partner teams. As part of this sales re-alignment, we expanded our sales management team to augment the leadership across our newly formed sales regions and territories. This expansion included hiring additional sales directors, adding a third regional vice president (RVP), and creating a market strategist role for each region. Each RVP is responsible for and directs the strategies for care coordination across his or her region. Each market strategist supports the RVP and assists with territory analysis, strategy development, and execution. The market strategists lead cross-functional efforts to build the necessary market intelligence and develop the right coordinated attack strategy for each market. We are utilizing this market intelligence to plan and optimize our lead-generating investments. In addition, we continue to expand our quota-carrying sales representatives. As of March 31, 2012, we have a total of 105 quota-carrying sales representatives, up 35% from 78 quota-carrying sales representatives on March 31, 2011. During Q1 2012, we added a total of six quota-carrying sales representatives, mostly in the small and group practice segments, where the majority of U.S. ambulatory physicians practice medicine.
To build on the theme of improving coordination across the sales organization, we carved out community hospitals from the existing enterprise space and integrated this sub-segment under the leadership of Bill Conway, Senior Vice President Sales. The core enterprise segment, led by Dr. Stephen Kahane, President, Enterprise Services Group, has been renamed ‘national accounts’ and now includes focused sales efforts targeting multi-state hospital chains, both public and private-equity backed health care services companies, and academic medical centers. We are now better equipped to further expand our enterprise footprint and drive adoption of our service offerings within larger health care organizations. The enterprise sales teams are getting more access into the enterprise space by means of our athenaCoordinator service offering, which resonates with this segment of the provider market.
12
Finally, during Q1 2012, we launched our athenaOne service offering. This integrated solution includes athenaCollector, athenaClinicals with order-based pricing, athenaCommunicator, and our basic athenaCoordinator service (f/k/a OrderFlow). The athenaOne platform simplifies the sales process by focusing on one integrated service, one contract, and one price. This service offering aligns closely with existing market behavior, as proven by our growing percentage of double barrel and triple barrel deals. In addition, athenaOne allows our clients to maximize the value of the athenahealth network, thereby improving how they deliver and coordinate care. The simplified pricing model of athenaOne, combined with the move to transaction-based pricing models with athenaClinicals and athenaCoordinator, will further drive rapid expansion of both senders and receivers onto the athenahealth network.
Balance Sheet and Cash Flow Highlights
Our cash, cash equivalents, and available-for-sale investments totaled $133.6 million at March 31, 2012. We do not have any outstanding debt obligations. Operating cash flow decreased $4.4 million from $4.0 million in Q1 2011 to net cash used in Q1 2012 of $0.4 million. The decline in operating cash flow was primarily driven by an increase in variable compensation payments due to headcount growth. Our capital expenditures, including capitalized software development, were $13.2 million (or 13.7% of total revenue) in Q1 2012.
Fiscal Year 2012 Outlook
athenahealth is not making any changes to the outlook presented at our 4th Annual Investor Summit on December 15, 2011, at this time.
Closing Remarks
athenahealth is better-positioned than ever to compete aggressively as a disruptive innovator in health care. With approval from the OIG to monetize the exchange of health information, athenahealth has become the largest growing network for effective health information exchange. We introduced athenaOne, the most integrated cloud-based solution for health care providers of all kinds. We also expanded our care coordination services to include a basic order transmission service designed to rapidly expand our network. We increased our financial alignment with our clients by adding order-based pricing to athenaClinicals and going “at risk” for results. Finally, we enhanced our core services while remaining slightly ahead of our financial and operational performance goals. We posted a 106% balanced scorecard result for the quarter and look forward to updating the investor community on our progress throughout the year.
13
Stock-Based Compensation Expense, Summary of Cash Balance and Reconciliation of Non-GAAP Financial Measures
athenahealth, Inc.
STOCK-BASED COMPENSATION EXPENSE
(Unaudited, in thousands)
Set forth below is a breakout of stock-based compensation expense for the three months ended March 31, 2012 and 2011:
| Three months ended March 31, |
||||||||
| 2012 | 2011 | |||||||
| Stock-based compensation expense charged to: |
||||||||
| Direct operating |
$ | 908 | $ | 605 | ||||
| Selling and marketing |
1,672 | 923 | ||||||
| Research and development |
765 | 530 | ||||||
| General and administrative |
2,288 | 1,947 | ||||||
|
|
|
|
|
|||||
| Total |
$ | 5,633 | $ | 4,005 | ||||
|
|
|
|
|
|||||
athenahealth, Inc.
CASH, CASH EQUIVALENTS, AND AVAILABLE-FOR-SALE INVESTMENTS
(Unaudited, in thousands)
Set forth below is a breakout of total cash, cash equivalents, and available-for-sale investments as of March 31, 2012, and December 31, 2011:
| March 31, | December 31, | |||||||
| 2012 | 2011 | |||||||
| Cash, cash equivalents |
$ | 52,491 | $ | 57,781 | ||||
| Short-term investments |
63,550 | 62,084 | ||||||
| Long-term investments* |
17,570 | 18,619 | ||||||
|
|
|
|
|
|||||
| Total |
$ | 133,611 | $ | 138,484 | ||||
|
|
|
|
|
|||||
| * | The Company has purchased certain available-for-sale investments that had a maturity date longer than one-year, which it classifies in investments and other assets on the condensed consolidated balance sheet. |
14
athenahealth, Inc.
RECONCILIATION OF NON-GAAP FINANCIAL MEASURES
TO COMPARABLE GAAP MEASURES
(Unaudited, in thousands, except per share amounts)
The following is a reconciliation of the non-GAAP financial measures used by the Company to describe the Company’s financial results determined in accordance with accounting principles generally accepted in the United States of America (GAAP). An explanation of these measures is also included below under the heading “Explanation of Non-GAAP Financial Measures.”
While management believes that these non-GAAP financial measures provide useful supplemental information to investors regarding the underlying performance of the Company’s business operations, investors are reminded to consider these non-GAAP measures in addition to, and not as a substitute for, financial performance measures prepared in accordance with GAAP. In addition, it should be noted that these non-GAAP financial measures may be different from non-GAAP measures used by other companies, and management may utilize other measures to illustrate performance in the future. Non-GAAP measures have limitations in that they do not reflect all of the amounts associated with the Company’s results of operations as determined in accordance with GAAP.
Please note that these figures may not sum exactly due to rounding.
Non-GAAP Adjusted Gross Margin
Set forth below is a presentation of the Company’s “Non-GAAP Adjusted Gross Profit” and “Non-GAAP Adjusted Gross Margin,” which represents Non-GAAP Adjusted Gross Profit as a percentage of total revenue.
| (unaudited, in thousands) | Three Months Ended March 31, |
|||||||
| 2012 | 2011 | |||||||
| Total revenue |
$ | 96,566 | $ | 69,930 | ||||
| Direct operating expense |
38,798 | 27,270 | ||||||
|
|
|
|
|
|||||
| Total revenue less direct operating expense |
57,768 | 42,660 | ||||||
| Add: Stock-based compensation expense allocated to direct operating expense |
908 | 605 | ||||||
| Add: Amortization of purchased intangibles |
753 | 460 | ||||||
|
|
|
|
|
|||||
| Non-GAAP Adjusted Gross Profit |
$ | 59,429 | $ | 43,725 | ||||
|
|
|
|
|
|||||
| Non-GAAP Adjusted Gross Margin |
61.5 | % | 62.5 | % | ||||
15
Non-GAAP Adjusted EBITDA
Set forth below is a reconciliation of the Company’s “Non-GAAP Adjusted EBITDA” and “Non-GAAP Adjusted EBITDA Margin,” which represents Non-GAAP Adjusted EBITDA as a percentage of total revenue.
| (unaudited, in thousands) | Three Months Ended March 31, |
|||||||
| 2012 | 2011 | |||||||
| Total revenue |
$ | 96,566 | $ | 69,930 | ||||
| GAAP net income |
2,428 | 3,251 | ||||||
| Add: Provision for income taxes |
2,893 | 2,305 | ||||||
| Add: Total other (income) expense |
(134 | ) | (33 | ) | ||||
| Add: Stock-based compensation expense |
5,633 | 4,005 | ||||||
| Add: Depreciation and amortization |
5,486 | 3,398 | ||||||
| Add: Amortization of purchased intangibles |
753 | 460 | ||||||
|
|
|
|
|
|||||
| Non-GAAP Adjusted EBITDA |
$ | 17,059 | $ | 13,386 | ||||
|
|
|
|
|
|||||
| Non-GAAP Adjusted EBITDA Margin |
17.7 | % | 19.1 | % | ||||
Non-GAAP Adjusted Operating Income
Set forth below is a reconciliation of the Company’s “Non-GAAP Adjusted Operating Income” and “Non-GAAP Adjusted Operating Income Margin,” which represents Non-GAAP Adjusted Operating Income as a percentage of total revenue.
| (unaudited, in thousands) | Three Months Ended March 31, |
|||||||
| 2012 | 2011 | |||||||
| Total revenue |
$ | 96,566 | $ | 69,930 | ||||
| GAAP net income |
2,428 | 3,251 | ||||||
| Add: Provision for income taxes |
2,893 | 2,305 | ||||||
| Add: Total other (income) expense |
(134 | ) | (33 | ) | ||||
| Add: Stock-based compensation expense |
5,633 | 4,005 | ||||||
| Add: Amortization of purchased intangibles |
753 | 460 | ||||||
|
|
|
|
|
|||||
| Non-GAAP Adjusted Operating Income |
$ | 11,573 | $ | 9,988 | ||||
|
|
|
|
|
|||||
| Non-GAAP Adjusted Operating Income Margin |
12.0 | % | 14.3 | % | ||||
16
Non-GAAP Adjusted Net Income
Set forth below is a reconciliation of the Company’s “Non-GAAP Adjusted Net Income” and “Non-GAAP Adjusted Net Income per Diluted Share.”
| (unaudited, in thousands except per share amounts) | Three Months Ended March 31, |
|||||||
| 2012 | 2011 | |||||||
| GAAP net income |
$ | 2,428 | $ | 3,251 | ||||
| Add: (Gain) loss on interest rate derivative contract |
— | (65 | ) | |||||
| Add: Stock-based compensation expense |
5,633 | 4,005 | ||||||
| Add: Amortization of purchased intangibles |
753 | 460 | ||||||
|
|
|
|
|
|||||
| Sub-total of tax deductible items |
6,386 | 4,400 | ||||||
| (Less): Tax impact of tax deductible items (1) |
(2,554 | ) | (1,760 | ) | ||||
|
|
|
|
|
|||||
| Non-GAAP Adjusted Net Income |
$ | 6,260 | $ | 5,891 | ||||
|
|
|
|
|
|||||
| Weighted average shares - diluted |
36,996 | 35,657 | ||||||
| Non-GAAP Adjusted Net Income per Diluted Share |
$ | 0.17 | $ | 0.17 | ||||
| (1) | - Tax impact calculated using a statutory tax rate of 40% |
| (unaudited, in thousands except per share amounts) | Three Months Ended March 31, |
|||||||
| 2012 | 2011 | |||||||
| GAAP net income per share - diluted |
$ | 0.07 | $ | 0.09 | ||||
| Add: (Gain) loss on interest rate derivative contract |
— | — | ||||||
| Add: Stock-based compensation expense |
0.15 | 0.12 | ||||||
| Add: Amortization of purchased intangibles |
0.02 | 0.01 | ||||||
|
|
|
|
|
|||||
| Sub-total of tax deductible items |
0.17 | 0.13 | ||||||
| (Less): Tax impact of tax deductible items (1) |
(0.07 | ) | (0.05 | ) | ||||
|
|
|
|
|
|||||
| Non-GAAP Adjusted Net Income per Diluted Share |
$ | 0.17 | $ | 0.17 | ||||
|
|
|
|
|
|||||
| Weighted average shares - diluted |
36,996 | 35,657 | ||||||
| (1) | - Tax impact calculated using a statutory tax rate of 40% |
17
Explanation of Non-GAAP Financial Measures
The Company reports its financial results in accordance with accounting principles generally accepted in the United States of America, or GAAP. However, management believes that, in order to properly understand the Company’s short-term and long-term financial and operational trends, investors may wish to consider the impact of certain non-cash or non-recurring items, when used as a supplement to financial performance measures in accordance with GAAP. These items result from facts and circumstances that vary in frequency and impact on continuing operations. Management also uses results of operations before such items to evaluate the operating performance of the Company and compare it against past periods, make operating decisions, and serve as a basis for strategic planning. These non-GAAP financial measures provide management with additional means to understand and evaluate the operating results and trends in the Company’s ongoing business by eliminating certain non-cash expenses and other items that management believes might otherwise make comparisons of the Company’s ongoing business with prior periods more difficult, obscure trends in ongoing operations, or reduce management’s ability to make useful forecasts. Management believes that these non-GAAP financial measures provide additional means of evaluating period-over-period operating performance. In addition, management understands that some investors and financial analysts find this information helpful in analyzing the Company’s financial and operational performance and comparing this performance to its peers and competitors.
Management defines “Non-GAAP Adjusted Gross Profit” as total revenue, less direct operating expense, plus (1) stock-based compensation expense allocated to direct operating expense and (2) amortization of purchased intangibles, and “Non-GAAP Adjusted Gross Margin” as Non-GAAP Adjusted Gross Profit as a percentage of total revenue. Management considers these non-GAAP financial measures to be important indicators of the Company’s operational strength and performance of its business and a good measure of its historical operating trends. Moreover, management believes that these measures enable investors and financial analysts to closely monitor and understand changes in the Company’s ability to generate income from ongoing business operations.
Management defines “Non-GAAP Adjusted EBITDA” as the sum of GAAP net income before provision for income taxes, total other (income) expense, stock-based compensation expense, depreciation and amortization, and amortization of purchased intangibles and “Non-GAAP Adjusted EBITDA Margin” as Non-GAAP Adjusted EBITDA as a percentage of total revenue. Management defines “Non-GAAP Adjusted Operating Income” as the sum of GAAP net income before provision for income taxes, total other (income) expense, stock-based compensation expense, and amortization of purchased intangibles, and “Non-GAAP Adjusted Operating Income Margin” as Non-GAAP Adjusted Operating Income as a percentage of total revenue. Management defines “Non-GAAP Adjusted Net Income” as the sum of GAAP net income before (gain) loss on interest rate derivative contract, stock-based compensation expense, amortization of purchased intangibles, and any tax impact related to these items, and “Non-GAAP Adjusted Net Income per Diluted Share” as Non-GAAP Adjusted Net Income divided by weighted average diluted shares outstanding. Management considers all of these non-GAAP financial measures to be important indicators of the Company’s operational strength and performance of its business and a good measure of its historical operating trends, in particular the extent to which ongoing operations impact the Company’s overall financial performance.
Management excludes each of the items identified below from the applicable non-GAAP financial measure referenced above for the reasons set forth with respect to that excluded item:
| • | Stock-based compensation expense — excluded because these are non-cash expenses that management does not consider part of ongoing operating results when assessing the performance of the Company’s business, and also because the total amount of expense is partially outside of the Company’s control because it is based on factors such as stock price, volatility, and interest rates, which may be unrelated to the Company’s performance during the period in which the expense is incurred. |
18
| • | Amortization of purchased intangibles — purchased intangibles are amortized over their estimated useful life and generally cannot be changed or influenced by management after the acquisition. Accordingly, this item is not considered by management in making operating decisions. Thus, including such charge does not accurately reflect the performance of the Company’s ongoing operations for the period in which such charge is incurred. |
| • | Gains and losses on interest rate derivative contract — excluded because, until they are realized, to the extent these gains or losses impact a period presented, management does not believe that they reflect the underlying performance of ongoing business operations for such period. |
19
Supplemental Metrics and Definitions

Supplemental Metrics (unaudited)
Last Updated: March 31, 2012
| Fiscal Year 2011 | Fiscal Year 2012 | |||||||||||||||||||
| Q1 | Q2 | Q3 | Q4 | Q1 | ||||||||||||||||
| Client Base |
||||||||||||||||||||
| Total Physicians on athenaCollector |
19,778 | 20,824 | 22,477 | 23,210 | 24,101 | |||||||||||||||
| Total Providers on athenaCollector |
27,944 | 29,482 | 31,675 | 32,740 | 33,923 | |||||||||||||||
| Total Physicians on athenaClinicals |
2,910 | 3,444 | 4,202 | 4,662 | 5,331 | |||||||||||||||
| Total Providers on athenaClinicals |
4,161 | 4,848 | 5,849 | 6,525 | 7,402 | |||||||||||||||
| Total Physicians on athenaCommunicator |
934 | 1,198 | 2,931 | 4,098 | 4,820 | |||||||||||||||
| Total Providers on athenaCommunicator |
1,564 | 1,936 | 4,117 | 5,830 | 6,800 | |||||||||||||||
| Client Performance |
||||||||||||||||||||
| Client Satisfaction |
86.2 | % | 85.9 | % | 85.6 | % | 87.3 | % | 86.3 | % | ||||||||||
| Client Days in Accounts Receivable (DAR) |
41.0 | 39.1 | 39.7 | 38.9 | 40.0 | |||||||||||||||
| First Pass Resolution (FPR) Rate |
94.1 | % | 93.4 | % | 93.8 | % | 93.7 | % | 91.3 | % | ||||||||||
| Electronic Remittance Advice (ERA) Rate |
74.6 | % | 76.7 | % | 78.3 | % | 77.9 | % | 78.0 | % | ||||||||||
| Total Claims Submitted |
13,651,586 | 14,361,876 | 14,854,109 | 16,368,172 | 17,839,150 | |||||||||||||||
| Total Client Collections |
$ | 1,608,313,685 | $ | 1,811,067,978 | $ | 1,866,806,003 | $ | 1,990,373,883 | $ | 2,081,686,428 | ||||||||||
| Total Working Days |
62 | 64 | 64 | 61 | 62 | |||||||||||||||
| Employees |
||||||||||||||||||||
| Direct |
719 | 771 | 1036 | 1068 | 1080 | |||||||||||||||
| Sales & Marketing |
217 | 236 | 247 | 276 | 295 | |||||||||||||||
| Research & Development |
216 | 236 | 263 | 277 | 292 | |||||||||||||||
| General & Administrative |
144 | 151 | 168 | 174 | 187 | |||||||||||||||
| Total Employees |
1,296 | 1,393 | 1,713 | 1,795 | 1,853 | |||||||||||||||
| Quota Carrying Sales Force |
||||||||||||||||||||
| Total Quota Carrying Sales Representatives |
78 | 83 | 83 | 99 | 105 | |||||||||||||||
20

|
||
| Supplemental Metrics Definitions | ||
| Client Base |
||
| Total Physicians on athenaCollector |
The number of physicians that have rendered a service which generated a medical claim that was billed during the last 91 days on the athenaCollector platform. Examples of physicians include Medical Doctors (MD) and Doctor of Osteopathic Medicine (DO). | |
| Total Providers on athenaCollector |
The number of providers, including physicians, that have rendered a service which generated a medical claim that was billed during the last 91 days on the athenaCollector platform. Examples of non-physician providers are Nurse Practitioners (NP) and Registered Nurses (RN). | |
| Total Physicians on athenaClinicals |
The number of physicians that have rendered a service through the athenaClinicals platform which generated a medical claim that was billed during the last 91 days on the athenaCollector platform. Examples of physicians include Medical Doctors (MD) and Doctor of Osteopathic Medicine (DO). | |
| Total Providers on athenaClinicals |
The number of providers, including physicians, that have rendered a service through the athenaClinicals platform which generated a medical claim that was billed during the last 91 days on the athenaCollector platform. Examples of non-physicians are Nurse Practitioners (NP) and Registered Nurses (RN). | |
| Total Physicians on athenaCommunicator |
The number of physicians that have rendered a service which generated a medical claim that was billed during the last 91 days on the athenaCollector platform and whose practice is actively using athenaCommunicator. | |
| Total Providers on athenaCommunicator |
The number of providers, including physicians, that have rendered a service which generated a medical claim that was billed during the last 91 days on the athenaCollector platform and whose practice is actively using athenaCommunicator. | |
| Client Performance |
||
| Client Satisfaction |
The percentage of athenaCollector clients who chose 4 or 5 on a scale of 1 to 5 when asked if they would recommend athenahealth to a trusted friend or colleague. These responses are generated from a “client listening” survey that the company conducts for its client base twice per year. | |
| Client Days in Accounts Receivable (DAR) |
The average number of days that it takes outstanding balances on claims to be resolved, e.g. paid, for clients on athenaCollector. Clients that have been live less than 90 days are excluded, as well as clients who are terminating services. | |
| First Pass Resolution (FPR) Rate |
Approximates the percentage of primary claims that are favorably adjudicated and closed after a single submission during the period. Currently, the FPR rate is calculated on a monthly basis, and certain practices are excluded (e.g. those that have been live for less than 90 days). | |
| Electronic Remittance Advice (ERA) Rate |
Remittance refers to the information about payments (a/k/a explanations of benefits) received from insurance companies during the period. The ERA rate reflects the percentage of total charges that were posted using electronic remittance. | |
| Total Claims Submitted |
The number of claims billed through athenaNet during the period. | |
| Total Client Collections |
The dollar value of collections posted on behalf of clients during the period. | |
| Total Working Days |
The total number of days during the quarter minus weekends and U.S. Post Office holidays. | |
| Employees |
||
| Direct |
The total number of full time equivalent individuals (FTEs) employed by the Company to support its service operations as of quarter end. This team includes production systems, enrollment services, paper claim submission, claim resolution, clinical operations, professional services, account management, and client services. | |
| Sales & Marketing |
The total number of FTEs employed by the Company to support its sales and marketing efforts as of quarter end. This team includes sales representatives, business development staff and the marketing team. | |
| Research & Development |
The total number of FTEs employed by the Company to support its research and development efforts as of quarter end. This team includes product development and product management. | |
| General & Administrative |
The total number of FTEs employed by the Company to support its general and administrative functions as of quarter end. This team includes finance, human resources, compliance, learning and development, internal audit, corporate technology, recruiting, facilities, and legal. | |
| Total Employees |
The total number of FTEs employed by the Company as of quarter end. This number excludes interns and seasonal employees. | |
| Quota-Carrying Sales Force |
||
| Total Quota Carrying Sales Representatives |
The total number of sales representatives who carry quota for net new annual recurring revenue as of quarter end. | |
21
|
Corporate Scorecard Metrics Definitions |
||
| Stability |
||
| Voluntary Turnover |
The number of voluntary terminations during the period divided by starting headcount. | |
| Corporate Compliance |
Percentage of compliance tasks that are met within the deadline. | |
| Employee Engagement |
Quarterly engagement survey results for employees. | |
| Performance |
||
| Client Days in Accounts Receivable (DAR) |
The average number of days that it takes outstanding balances on claims to be resolved, e.g. paid, for clients on athenaCollector. Clients that have been live less than 90 days are excluded, as well as clients who are terminating services. | |
| DAR in Client Work Buckets |
The number of days in accounts receivable that are due to tasks assigned to clients’ work buckets. | |
| Client Collection Rate |
The percentage of charges that are not written off to bad debt. | |
| Provider Documentation Time per Appointment |
The average number of minutes athenaClinicals providers spend on the computer documenting the exam and orders for each appointment. Providers that have been live less than 90 days are excluded. | |
| Satisfaction |
||
| Client Touches per Claim |
The total number of scrub records, denials on the back-end and posting exceptions that clients must work divided by the total number of claims created. | |
| Client Tickets per Provider (per month) |
The number of Client Service Center (CSC) cases that are not resolved on the initial call by the CSC team divided by the number of athenaCollector providers. | |
| Client Satisfaction |
The percentage of clients who chose 4 or 5 on a scale of 1 to 5 when asked if they would recommend athenahealth to a trusted friend or colleague. These responses are generated from a “client listening” survey that the company conducts for its client base twice per year. | |
| Financial |
||
| Total Revenue |
Total consolidated revenue. | |
| Non-GAAP Adjusted Operating Income |
Total non-GAAP adjusted operating income. | |
| Growth |
||
| Bookings |
The annualized value of deals sold. | |

22