Attached files
| file | filename |
|---|---|
| 8-K - FORM 8-K - COVANTA HOLDING CORP | d336331d8k.htm |
| EX-99.1 - PRESS RELEASE - COVANTA HOLDING CORP | d336331dex991.htm |

| Covanta Holding Corporation First Quarter 2012 Earnings Conference Call NYSE: CVA April 19, 2012 1 Exhibit 99.2 |

| All information included in this earnings presentation is based on continuing operations. Forward-Looking Statements Certain statements in this presentation may constitute "forward-looking" statements as defined in Section 27A of the Securities Act of 1933 (the "Securities Act"), Section 21E of the Securities Exchange Act of 1934 (the "Exchange Act"), the Private Securities Litigation Reform Act of 1995 (the "PSLRA") or in releases made by the Securities and Exchange Commission ("SEC"), all as may be amended from time to time. Such forward- looking statements involve known and unknown risks, uncertainties and other important factors that could cause the actual results, performance or achievements of Covanta and its subsidiaries, or general industry or broader economic performance in global markets in which Covanta operates or competes, to differ materially from any future results, performance or achievements expressed or implied by such forward-looking statements. Statements that are not historical fact are forward-looking statements. Forward-looking statements can be identified by, among other things, the use of forward-looking language, such as the words "plan," "believe," "expect," "anticipate," "intend," "estimate," "project," "may," "will," "would," "could," "should," "seeks," or "scheduled to," or other similar words, or the negative of these terms or other variations of these terms or comparable language, or by discussion of strategy or intentions. These cautionary statements are being made pursuant to the Securities Act, the Exchange Act and the PSLRA with the intention of obtaining the benefits of the "safe harbor" provisions of such laws. Covanta cautions investors that any forward-looking statements made by Covanta are not guarantees or indicative of future performance. Important assumptions and other important factors that could cause actual results to differ materially from those forward-looking statements with respect to Covanta, include, but are not limited to, the risk that Covanta may not successfully grow its business as expected or close its announced or planned acquisitions or projects in development, and those factors, risks and uncertainties that are described in periodic securities filings by Covanta with the SEC. Although Covanta believes that its plans, intentions and expectations reflected in or suggested by such forward-looking statements are reasonable, actual results could differ materially from a projection or assumption in any forward-looking statements. Covanta's future financial condition and results of operations, as well as any forward-looking statements, are subject to change and to inherent risks and uncertainties. The forward-looking statements contained in this press release are made only as of the date hereof and Covanta does not have or undertake any obligation to update or revise any forward- looking statements whether as a result of new information, subsequent events or otherwise, unless otherwise required by law. Non-GAAP Financial Measures We use a number of different financial measures, both United States generally accepted accounting principles ("GAAP") and non-GAAP, in assessing the overall performance of our business. The non-GAAP financial measures of Adjusted EBITDA, Free Cash Flow and Adjusted EPS, as described and used in this earnings presentation, are not intended as a substitute or as an alternative to net income, cash flow provided by operating activities or diluted earnings per share as indicators of our performance or liquidity or any other measures of performance or liquidity derived in accordance with GAAP. In addition, our non-GAAP financial measures may be different from non-GAAP measures used by other companies, limiting their usefulness for comparison purposes. The presentations of Adjusted EBITDA, Free Cash Flow and Adjusted EPS are intended to enhance the usefulness of our financial information by providing measures which management internally use to assess and evaluate the overall performance of its business and those of possible acquisition candidates, and highlight trends in the overall business. In each case, a reconciliation to the nearest GAAP measure is provided. 2 Cautionary Statements |
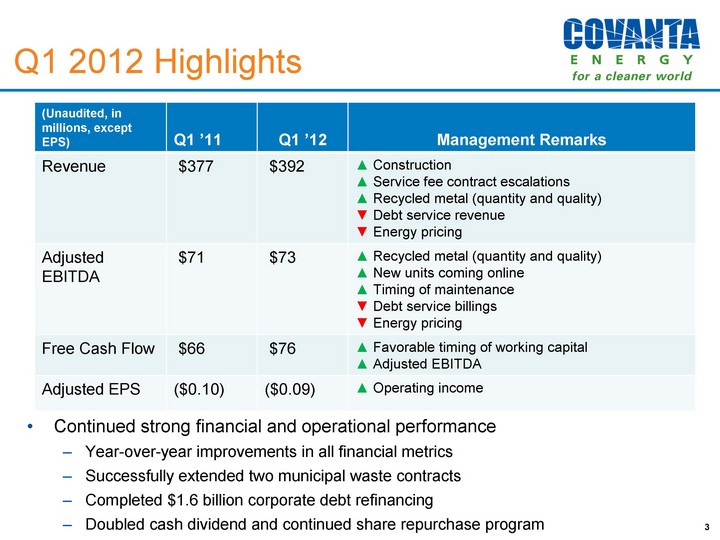
| 3 Continued strong financial and operational performance Year-over-year improvements in all financial metrics Successfully extended two municipal waste contracts Completed $1.6 billion corporate debt refinancing Doubled cash dividend and continued share repurchase program (Unaudited, $ in millions, except EPS) (Unaudited, in millions, except EPS) Q1 '11 Q1 '12 Management Remarks Revenue $377 $392 ^ Construction ^ Service fee contract escalations ^ Recycled metal (quantity and quality) ^ Debt service revenue ^ Energy pricing Adjusted EBITDA $71 $73 ^ Recycled metal (quantity and quality) ^ New units coming online ^ Timing of maintenance ^ Debt service billings ^ Energy pricing Free Cash Flow $66 $76 ^ Favorable timing of working capital ^ Adjusted EBITDA Adjusted EPS ($0.10) ($0.09) ^ Operating income Q1 2012 Highlights |

| 4 Continued executing on waste contract extensions Montgomery County: Service fee operating contract extended by 5 years to 2021 550,000 ton per year facility owned by municipal client City of Springfield: Host community & anchor tenant; contract representing over 1/3 of plant capacity extended by 10 years to 2024 Installing metal recovery system at ash monofill Current trends in waste: Approximately 75% of 2012 waste revenue contracted Service fee revenues up on inflation escalators Tip fee pricing for Q1 '12 up less than 0.5% Tip fees under continued pressure from Northeast landfill operators Offset by continued progress on special waste growth Plants continue to run at full capacity, volumes generally flat across portfolio Waste Update |

| Energy Update Electricity/steam market remains very soft due to continued natural gas decline Rough rule of thumb $1/MMBtu natural gas ? $10 - $15 million annualized impact on Adjusted EBITDA Original 2012 guidance based on $3/MMBtu full year 2012 average price; current estimate ~$2.50/MMBtu 5 2012 Outlook 2012 Contracted/Hedged - covers ~80% of anticipated 2012 revenue 3.4 million MWhs are currently contracted 0.7 million MWhs are currently hedged (recently added 2012 shoulder month hedge) ~4.1 EfW Exposed Average price to be in ~$50/MWh >$10/MWh decline vs 2011 >50% of exposed MWhs in premium markets - Long Island, Hawaii and steam ~1.3 Biomass Dispatched or Exposed 0.3 million MWhs to run only if economically beneficial 0.4 million MWhs already offline due to low price ~0.3 Total CVA MWhrs ~5.7 Extended steam sales contracts at Niagara Increase steam sales to begin mid-2013, reaching full load mid-2014 Going from 250,000 MWhs to 400,000 MWhs equivalent Contracts run to 2024 with floor and ceiling price Installing new steam line and natural gas package boiler |

| Metals Update 6 Q1 '12 metals revenue $20 million: year-over-year increase of $3 million (18%) Increased metal recovery contributed $2 million - key component of organic growth Ferrous recovery up by 9% vs Q1 '11 Non-Ferrous recovery up by 15% vs Q1' 11 Improved price contributed $1 million Improved metal quality driven by Dade shredder more than offset slight market decline Q1 2012 HMS #1 Index average of $411/gross ton (vs $422 in Q1 '11) Rough rule of thumb Full year HMS #1 Index +/- 50 ? ~$10 million annualized impact on Adjusted EBITDA 2011 HMS #1 index averaged $410 Assume pricing and demand of recycled metals remains strong for rest of 2012 Consistent with 2011 and Q1 2012 |
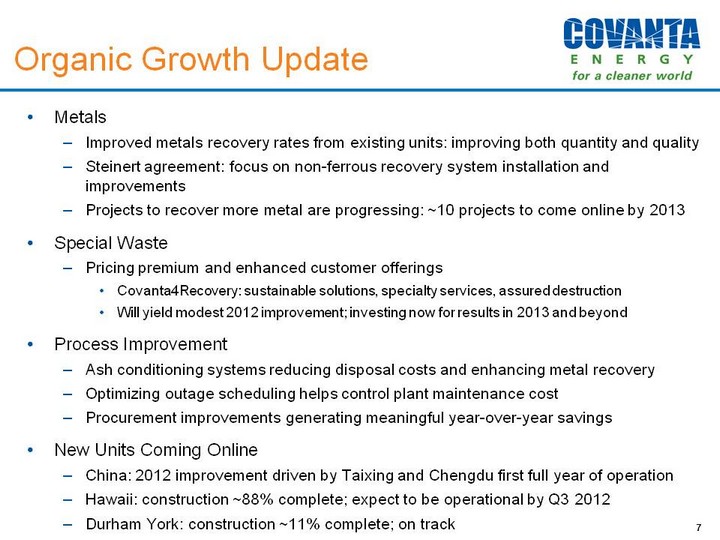
| Organic Growth Update 7 Metals Improved metals recovery rates from existing units: improving both quantity and quality Steinert agreement: focus on non-ferrous recovery system installation and improvements Projects to recover more metal progressing nicely: ~10 projects to come online by 2013 Special Waste Pricing premium and enhanced customer offerings Covanta4Recovery: sustainable solutions, specialty services, assured destruction Will yield modest 2012 improvement; investing now for results in 2013 and beyond Process Improvement Ash conditioning systems reducing disposal costs and enhancing metal recovery Optimizing outage scheduling helps control plant maintenance cost Procurement improvements generating meaningful year-over-year savings New Units Coming Online China: 2012 improvement driven by Taixing and Chengdu first full year of operation Hawaii: construction ~88% complete; expect to be operational by Q3 2012 Durham York: construction ~11% complete; on track |

| Summary Q1 2012 overview Executing on plan Operational and financial performance on track Organic growth initiatives on track Successfully completed $1.6 billion corporate debt financing transaction Several operational successes Meaningful shareholder returns 2012 outlook Re-affirming guidance Energy markets a challenge - natural gas at 10 year lows Metal markets continue to be strong Organic Growth Initiatives gaining traction Anticipate additional clarity on development projects Capital allocation and shareholder returns continue to be a focus 8 |

| Financial Overview 9 |

| 10 (Unaudited, $ in millions, except EPS) (Unaudited, in millions, except EPS) Q1 '11 Q1 '12 Management Remarks Revenue $377 $392 ^ Construction ^ Service fee contract escalations ^ Recycled metal (quantity and quality) ^ Debt service revenue ^ Energy pricing Adjusted EBITDA $71 $73 ^ Recycled metal (quantity and quality) ^ New units coming online ^ Timing of maintenance ^ Debt service billings ^ Energy pricing Free Cash Flow $66 $76 ^ Favorable timing of working capital ^ Adjusted EBITDA Adjusted EPS ($0.10) ($0.09) ^ Operating income Q1 2012 Highlights |

| $ in millions (Unaudited) 11 Organic Growth Initiatives includes metal (quality & quantity), special waste, and new units coming online Operational Improvements includes contract escalations, increased EfW energy volume, biomass and other 2 1 Revenue: Q1 11 vs. Q1 12 |

| Adj EBITDA: Q1 11 vs. Q1 12 $ in millions 12 Organic Growth Initiatives includes metal (quality & quantity), special waste, asset management, and new units coming online Operational Improvements includes contract escalations, plant maintenance timing, increased EfW energy volume, biomass, and other 2 1 (Unaudited) |
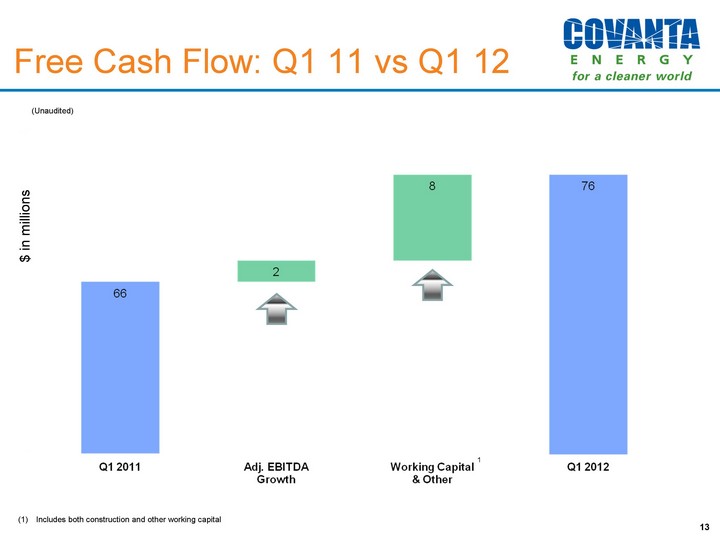
| (Unaudited) $ in millions 13 Includes both construction and other working capital 1 Free Cash Flow: Q1 11 vs Q1 12 |

| (Unaudited) 14 Adj EPS: Q1 11 vs Q1 12 |
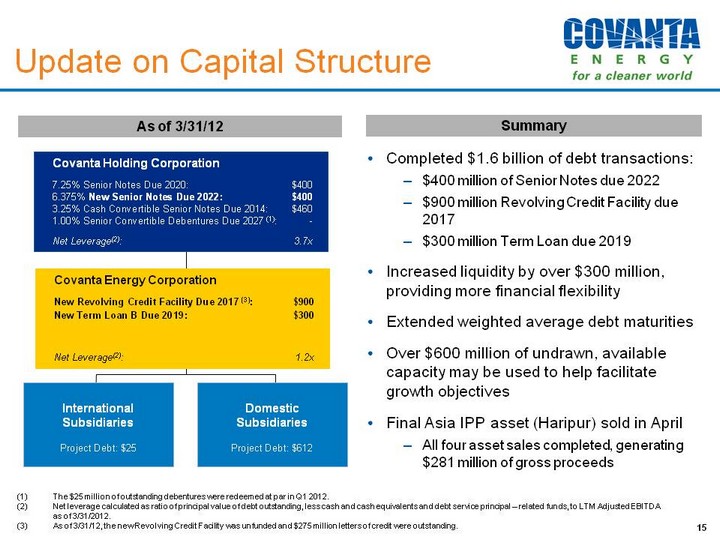
| 15 As of 3/31/12 Covanta Energy Corporation New Revolving Credit Facility Due 2017 (3): $900 New Term Loan B Due 2019: $300 Net Leverage(2): 1.2x Covanta Holding Corporation 7.25% Senior Notes Due 2020: $400 6.375% New Senior Notes Due 2022: $400 3.25% Cash Convertible Senior Notes Due 2014: $460 1.00% Senior Convertible Debentures Due 2027 (1): - Net Leverage(2): 3.7x Domestic Subsidiaries Project Debt: $612 International Subsidiaries Project Debt: $25 The $25 million of outstanding debentures were redeemed at par in Q1 2012. Net leverage calculated as ratio of principal value of debt outstanding, less cash and cash equivalents and debt service principal - related funds, to LTM Adjusted EBITDA as of 3/31/2012. As of 3/31/12, the new Revolving Credit Facility was unfunded and $275 million letters of credit were outstanding. Completed $1.6 billion of debt transactions: $400 million of Senior Notes due 2022 $900 million Revolving Credit Facility due 2017 $300 million Term Loan due 2019 Increased liquidity by over $300 million, providing more financial flexibility Extended weighted average debt maturities Over $600 million of undrawn, available capacity may be used to help facilitate growth objectives Final Asia IPP asset (Haripur) sold in April All four asset sales completed, generating $280 million of gross proceeds Summary Update on Capital Structure |

| Recent shareholder return activities Doubled the annual cash dividend to $0.60 per share ? 3.7% yield1 Equates to ~30% payout of Free Cash Flow2 Increased share repurchase authorization by another $100 million As of 3/31/2012, $145 million remaining in share repurchase authorization Repurchased 15.2% of shares outstanding since program inception Q1 2012 shareholder returns Declared quarterly cash dividend of $0.15 per share Repurchased 1.8 million shares 16 (Unaudited, in millions) FY 2010 FY 2011 Q1 2012 Share Repurchases $95 $230 $30 Dividends Declared $233 $42 $21 Total Returned $328 $272 $51 Based on share price of $16.23 as of 3/30/2012 At midpoint of guidance, reaffirmed as of 4/18/2012 Actively Returning Capital |

| 17 (Unaudited, in millions, except EPS) 2010 2011 2012 Guidance1 % Change2 2011 vs. 2012 Adjusted EBITDA $470 $492 $500 - $530 +5% Free Cash Flow $318 $280 $250 - $280 -5% Adjusted EPS $0.42 $0.52 $0.55 - $0.65 +15% Reaffirmed as of 4/18/2012 At midpoint of guidance, reaffirmed as of 4/18/2012 Reaffirming guidance for 2012 - Debt refinancing impact as expected Adjusted EBITDA growth in 2012 of 5%2 Free Cash Flow consistent with 2011, excluding impact from working capital Adjusted EBITDA growth offset by working capital timing and corporate debt refinancing Adjusted EPS showing benefit of operating income growth and share repurchases 2012 Guidance Summary |

| FY 2012 Full year on track ? despite quarterly seasonality and impact of construction working capital Meaningful pick up in all key financial metrics in second half 2012 Q2 2012 Adjusted EBITDA relatively flat ? growth offset by lower debt service billings Free Cash Flow to be down significantly due to timing Construction working capital timing 2012 maintenance capital spend Core business Free Cash Flow still strong, after excluding construction impact Adjusted EPS to be adversely impacted by higher interest expense from debt refinancing 18 FY and Q2 2012 Outlook |

| Covanta Holding Corporation First Quarter 2012 Earnings Conference Call NYSE: CVA Appendix 19 |

| Waste Contract Outlook - Great Track Record 20 Tip Fee Service Fee Owned Service Fee Operated Major Municipal Waste Contract Transitions from 2008 - 2020 Note: During Q1 2012 we extended contracts with Montgomery and Springfield |

| 21 Q1 2012 Summary Results |

| 22 Debt balances are presented at principal value, not book value. Net debt is calculated as total principal amount of debt outstanding less cash and cash equivalents and debt service principal-related restricted funds. Ratio is computed on a consolidated basis and differs from the calculation required under Covanta's credit facility. The ratio for 3/31/2012 is based on LTM Adjusted EBITDA as of 3/31/2012, while the ratios for 12/31/2010 and 12/31/2011 are based on full year 2010 and full year 2011 Adjusted EBITDA, respectively. See slide 24 for a reconciliation of 2010, 2011 and LTM Adjusted EBITDA. Capitalization is calculated as total debt outstanding plus stockholders' equity. Capitalization Summary Balance sheet remains strong; ample liquidity Over last 5 years, paid down approximately $800 million of maturing project debt, continuing to increase overall financial flexibility |
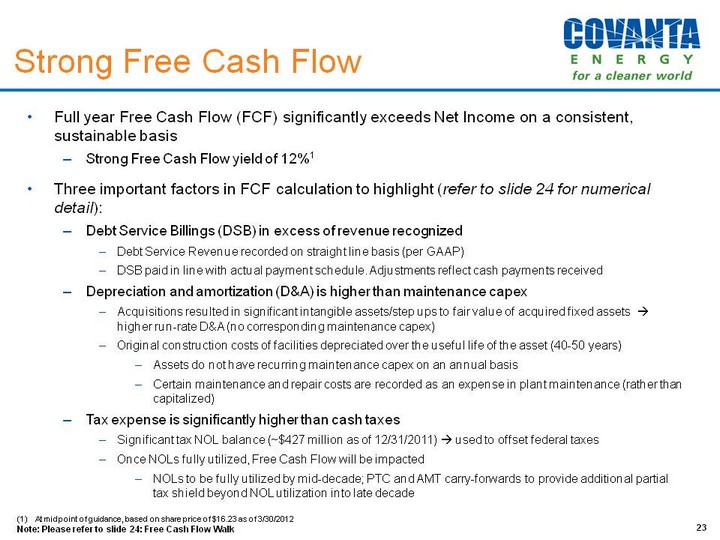
| At midpoint of guidance, based on share price of $16.23 as of 3/30/2012 Note: Please refer to slide 24 for a Non-GAAP Reconciliation for Adjusted EBITDA & Free Cash Flow 23 Full year Free Cash Flow significantly exceeds Net Income on a consistent, sustainable basis Strong Free Cash Flow yield of 12%1 Three important factors in FCF calculation to highlight (refer to slide 25 for numerical detail): Debt Service Billings (DSB) in excess of revenue recognized Debt Service Revenue recorded on straight line basis (per GAAP) DSB paid in line with actual payment schedule. Adjustments reflect cash payments received D&A is higher than maintenance capex Acquisitions resulted in significant intangible assets/step ups to fair value of acquired fixed assets ? higher run-rate D&A (no corresponding maintenance capex) Original construction costs of facilities depreciated over the useful life of the asset (40-50 years) Assets have minimal recurring maintenance capex Maintenance and repair costs are recorded as an expense in plant maintenance (rather than capitalized) Tax expense is significantly higher than cash taxes Significant tax NOL balance (~$427 million as of 12/31/2011) ? used to offset federal taxes Once NOLs fully utilized, Free Cash Flow will be impacted NOLs to be fully utilized by mid-decade; PTC and AMT carry-forwards to provide additional partial tax shield beyond NOL utilization into late decade Strong Free Cash Flow |

| Non-GAAP Reconciliation: Adjusted EBITDA & Free Cash Flow At midpoint of guidance, based on share price of $16.23 as of 3/30/2012. Re-affirmed guidance as of 4/18/2012. Depreciation and amortization expense is significantly higher than maintenance capital expenditures due to (a) amortization expense associated with intangible assets recognized in connection with business combinations; (b) the net step-up in our fixed asset book basis recognized in connection with business combinations; and (c) facility construction expenditures related to long-lived assets (40-50 year useful lives) incurred during initial construction, which will not have recurring maintenance capital expenditures on annual basis related to these assets. Cash taxes are significantly lower than income tax expense due to the utilization of our net operating loss carryforwards (NOLs). This amount represents a true-up between (a) revenue recognized in the period for client payments of project debt principal under service fee contract structures, which is accounted for on a straight-line basis over the term of the project debt, and (b) actual billings to clients for debt principal payments in the period. As a result of this adjustment, Adjusted EBITDA reflects the actual amounts billed to clients for debt service principal, not the straight-lined revenue as recognized. Other is primarily non-cash compensation expense, but does include other non-cash expenses. The calculation of Adjusted EBITDA is based on the definitions in the credit facilities of our most significant subsidiary, Covanta Energy, through which we conduct our core waste and energy services business. Note: Please refer to slide 23 for additional detail explaining why full year Free Cash Flow is higher than Net Income 24 Strong FCF Yield 12% (1) |

| Non-GAAP Reconciliation: Adjusted EBITDA 25 Note: Adjusted EBITDA results provided to reconcile the denominator of the Net Debt / Adjusted EBITDA ratios on slide 21 Please see slide 24 for the text of footnotes 3 to 7 |

| 26 Re-affirmed guidance as of 4/18/2012 Non-GAAP Reconciliation: Adjusted EPS |
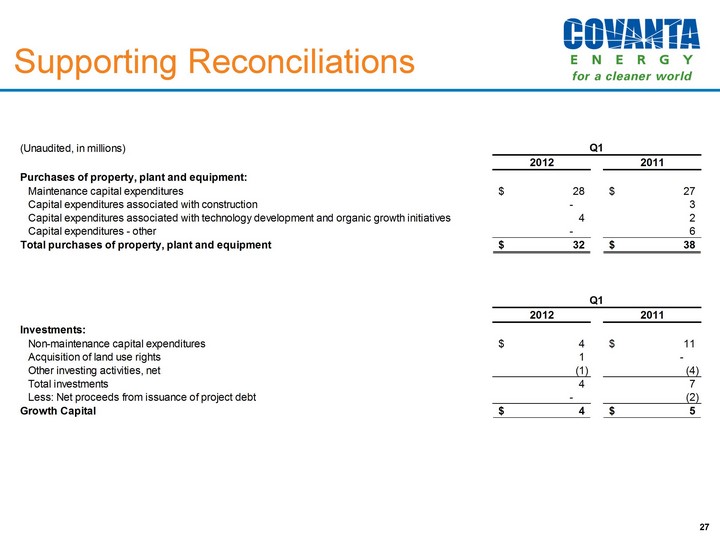
| 27 Supporting Reconciliations |

| Non-GAAP Reconciliation:Adjusted EBITDA Free Cash Flow At midpoint of guidance, based on share price of $16.23 as of 3/30/2012. Re-affirmed guidance as of 4/18/2012. Depreciation and amortization expense is significantly higher than maintenance capital expenditures due to (a) amortization expense associated with intangible assets recognized in connection with business combinations; (b) the net step-up in our fixed asset book basis recognized in connection with business combinations; and (c) facility construction expenditures related to long-lived assets (40-50 year useful lives) incurred during initial construction, which will not have recurring maintenance capital expenditures on annual basis related to these assets. Cash taxes are significantly lower than income tax expense due to the utilization of our net operating loss carryforwards (NOLs). This amount represents a true-up between (a) revenue recognized in the period for client payments of project debt principal under service fee contract structures, which is accounted for on a straight-line basis over the term of the project debt, and (b) actual billings to clients for debt principal payments in the period. As a result of this adjustment, Adjusted EBITDA reflects the actual amounts billed to clients for debt service principal, not the straight-lined revenue as recognized. Other is primarily non-cash compensation expense, but does include other non-cash expenses. See definition on slide 29 28 |

| Free Cash Flow Free Cash Flow is defined as cash flow provided by operating activities from continuing operations less maintenance capital expenditures, which are capital expenditures primarily to maintain our existing facilities. We use the non-GAAP measure of Free Cash Flow as a criterion of liquidity and performance-based components of employee compensation. We use Free Cash Flow as a measure of liquidity to determine amounts we can reinvest in our core businesses, such as amounts available to make acquisitions, invest in construction of new projects or make principal payments on debt. In order to provide a meaningful basis for comparison, we are providing information with respect to our Free Cash Flow reconciled for all periods to cash flow provided by operating activities from continuing operations, which we believe to be the most directly comparable measure under GAAP. Adjusted EBITDA We use Adjusted EBITDA to provide further information that is useful to an understanding of the financial covenants contained in the credit facilities of our most significant subsidiary, Covanta Energy, through which we conduct our core waste and energy services business, and as additional ways of viewing aspects of its operations that, when viewed with the GAAP results and the accompanying reconciliations to corresponding GAAP financial measures, provide a more complete understanding of our core business. The calculation of Adjusted EBITDA is based on the definition in Covanta Energy's credit facilities, which we have guaranteed. Adjusted EBITDA is defined as earnings before interest, taxes, depreciation and amortization, as adjusted for additional items subtracted from or added to net income. Because our business is substantially comprised of that of Covanta Energy, our financial performance is substantially similar to that of Covanta Energy. For this reason, and in order to avoid use of multiple financial measures which are not all from the same entity, the calculation of Adjusted EBITDA and other financial measures presented herein are ours, measured on a consolidated basis for continuing operations. In order to provide a meaningful basis for comparison, we are providing information with respect to our Adjusted EBITDA reconciled for all periods to net loss from continuing operations and cash flow provided by operating activities from continuing operations, which are believed to be the most directly comparable measures under GAAP. Adjusted EPS We use the non-GAAP measure of Adjusted EPS to enhance the usefulness of our financial information by providing a measure which management internally uses to assess and evaluate the overall performance and highlight trends in the ongoing business. Adjusted EPS excludes certain income and expense items that are not representative of our ongoing business and operations, which are included in the calculation of Diluted Earnings Per Share in accordance with GAAP. The following items are not all-inclusive, but are examples of reconciling items in prior comparative and future periods. They would include write-down of assets, the effect of derivative instruments not designated as hedging instruments, significant gains or losses from the disposition or restructuring of businesses, income and loss from discontinued operations, transaction-related costs, income and loss on the extinguishment of debt and other significant items that would not be representative of our ongoing business. In order to provide a meaningful basis for comparison, we are providing information with respect to our Adjusted EPS reconciled for all periods to diluted earnings per share from continuing operations, which is believed to be the most directly comparable measure under GAAP. 29 Non-GAAP Financial Measures |