Attached files
| file | filename |
|---|---|
| 8-K - FORM 8-K - Manitex International, Inc. | d335324d8k.htm |
 Manitex International, Inc.
Corporate Presentation
(NASDAQ: MNTX)
April 2012
“Focused
manufacturer of
engineered lifting
equipment”
Exhibit 99.1 |
 2
Forward Looking Statements &
Non GAAP Measures
Safe Harbor Statement under the U.S. Private Securities Litigation Reform Act of
1995: This presentation contains statements that are forward-looking in
nature which express the beliefs and expectations of management including
statements regarding the Company’s expected results of operations or
liquidity; statements concerning projections, predictions, expectations,
estimates or forecasts as to our business, financial and operational results and future
economic performance; and statements of management’s goals and objectives and
other similar expressions concerning matters that are not historical
facts. In some cases, you can identify forward-looking statements by
terminology such as “anticipate,”
“estimate,”
“plan,”
“project,”
“continuing,”
“ongoing,”
“expect,”
“we believe,”
“we
intend,”
“may,”
“will,”
“should,”
“could,”
and similar expressions. Such statements are based on current plans,
estimates and expectations and involve a number of known and unknown risks,
uncertainties and other factors that could cause the Company's future
results, performance or achievements to differ significantly from the results,
performance or achievements expressed or implied by such forward-looking
statements. These factors and additional information are discussed in the
Company's filings with the Securities and Exchange Commission and statements
in this presentation should be evaluated in light of these important factors. Although we believe that
these statements are based upon reasonable assumptions, we cannot guarantee future
results. Forward-looking statements
speak
only
as
of
the
date
on
which
they
are
made,
and
the
Company
undertakes
no
obligation
to
update
publicly or revise any forward-looking statement, whether as a result of new
information, future developments or otherwise.
Non-GAAP
Measures:
Manitex
International
from
time
to
time
refers
to
various
non-GAAP
(generally
accepted
accounting
principles)
financial
measures
in
this
presentation.
Manitex
believes
that
this
information
is
useful
to
understanding its operating results without the impact of special items. See
Manitex’s fourth quarter and full year 2011
earnings
release
on
the
Investor
Relations
section
of
our
website
www.manitexinternational.com
for
a
description and/or reconciliation of these measures.
“Focused
manufacturer of
engineered lifting
equipment” |
 3
Company Snapshot
“Focused
manufacturer of
engineered lifting
equipment”
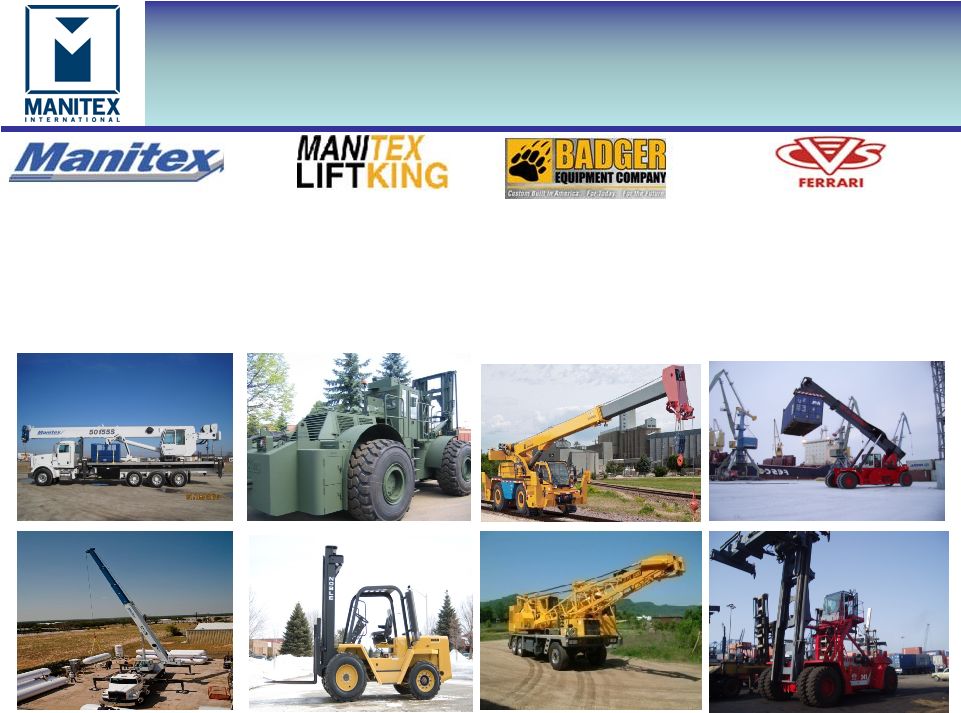
Manitex
International, Inc.
Global provider of highly specialized and custom configured
cranes, materials and container handling equipment sold
through dealerships
Launched as a private company in 2003, Manitex International,
is publicly traded as NASDAQ:MNTX and has steadily grown
organically and as a consolidator in its industry, acquiring
seven branded product lines since going public in 2007
Energy exploration and field development (including Canadian
oil sands and recent oil and natural gas development initiatives
throughout U.S.), power line construction, military, railroads,
port, government/agency
Niches
Served
Company
Origin |
 4
“Focused
manufacturer of
engineered lifting
equipment”
•
Engineered lifting
equipment
•
Manitex boom trucks
•
SkyCrane aerial platforms
•
Sign cranes
•
RT forklifts
•
Special mission-oriented
vehicles
•
Carriers
•
Heavy material handling
•
Transporters & steel mill
equipment
•
Specialized earthmoving,
railroad and material
handling equipment
since 1945
•
Has built ~ 10,000 units
•
Manufacturer of container
handling equipment for the
global port and inter-modal
sectors.
•
Products: reach stackers,
laden and unladen
container forklifts &
straddle carriers
Product
Overview |
 5
Summary Financials
“Focused
manufacturer of
engineered lifting
equipment”
Financial Summary
Total Enterprise Val. (4/11/2012):
$137.0 million
Market Cap (4/11/2012):
$94.9 million
2011 Revenue:
$142.3 million
2011 Adjusted Net Income**:
$3.6 million
2011 EBITDA:
$11.1 million
Stock Price (4/11/2012):
$8.12
Ticker / Exchange:
MNTX / NASDAQ
Capitalization
Diluted shares outstanding
(12/31/2011):
11.5 million
Total Debt: (12/31/2011)
$42.2 million
$000, except
percentages
2007
2008
2009
2010
2011
Revenues
$106,946
$106,341
$55,887
$95,875
$142,291
Gross Margin (%)
18.6%
16.4%
20.0%
24.3%
20.6%
EBITDA
$8,461
$5,416
$1,982
$8,676
$11,120
EBITDA Margin (%)
7.9%
5.1%
3.5%
9.0%
7.8%
Adjusted Net income**
$2,126
$1,799
$3,639*
$2,109
$3,561
Backlog
$45,100
$15,703
$22,122
$39,905
$83,700
* 2009 Net Income includes gain on bargain purchase of $3,815
** 2011 excludes $1.2 million for present value of legal settlement
agreement Recent Announcements
Backlog at
3/31/2012
$133.3 million |
 6
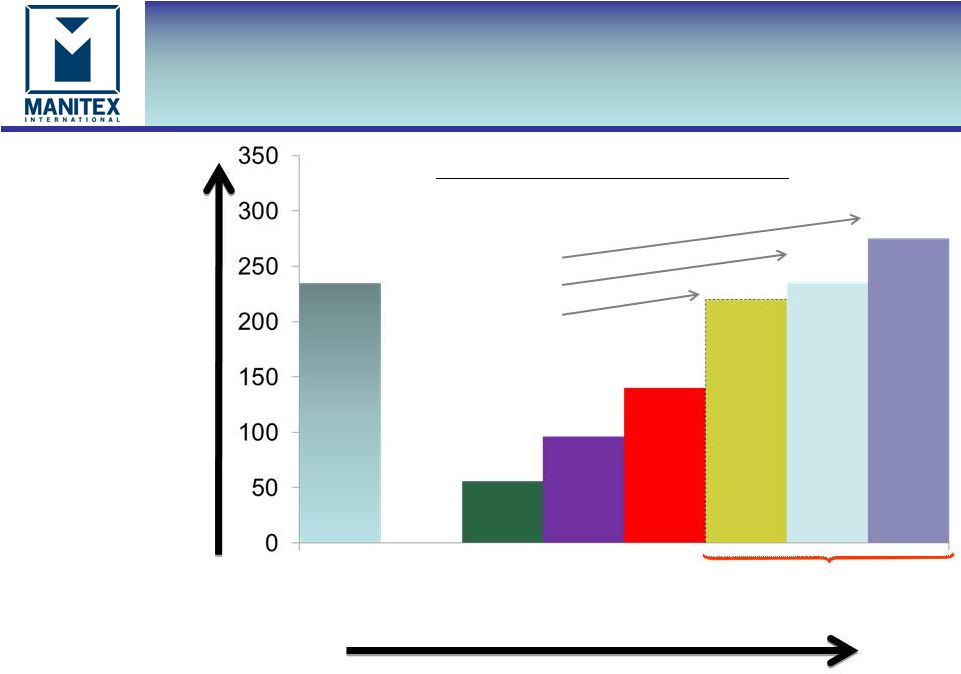
Potential for Future Growth in
Revenue and EBITDA
“Focused
manufacturer of
engineered lifting
equipment”
•
$235M represents
2007 revenues of
all product lines
acquired to date
•
Revenues,
EBITDA, earnings
have shown
consistent growth
•
Revenue and
backlog trajectory
suggests recovery
continues into
2012-2013
•
Long-term
EBITDA target is
9%-10%
•
2009-2011 (E)
CAGR was 59.6%
Opportunity
Rev:
$55.9M
EBITDA
$2M/3.5%
Backlog:
$22M
2007 Pro-forma
Normal non-peak
year
2009
2010
2011
Rev:
$95.9M
EBITDA
$8.7M/9%
Backlog:
$40M
Rev:
$142.3M
EBITDA
$11.1M/7.
8%
Backlog:
$84M
2013E
$275M
$235M
$220M
48.9% CAGR
43.2% CAGR
40.8% CAGR
4-Year
CAGR
(using
2009
as
base
year)
$235M
$M |
 7
Investment Highlights
“Focused
manufacturer of
engineered lifting
equipment”
2011 & beyond: strong metrics signal continued recovery and growth
–
2011 sales up 48% from 2010
–
2011 EBITDA a record $11.2 million up 28% YoY
–
December 31, 2011 backlog up 110% to record $83.7 million
–
March 31 2012 backlog up 59% from December 2011 to $133 million
Experienced senior management
–
Over 70 years of collective experience from
well-known
industrial
leaders
-
Terex,
Manitowoc, Rolls Royce, GKN Sinter Metals,
Grove and Genie
Global presence ~ 20K units
Operates worldwide
Equipment dealerships throughout country
–
High recurring parts revenue stream: approximately 20%
of total sales (average 40% margin)
Debt Management
–
Extended credit facility in June 2011; expanded
borrowing capacity and lowered interest costs
–
Targeting debt reduction through cash flows
throughout 2012
Focused on earnings,
cash flow & working
capital management |
 8
Key Management
“Focused
manufacturer of
engineered lifting
equipment”
Name & Title
Experience
David Langevin
Chairman & CEO
20+ years principally with Terex
Andrew Rooke
President & COO
20+ years principally with Rolls Royce, GKN Sinter
Metals, Off-Highway & Auto Divisions
David Gransee
CFO & Treasurer
Formerly with Arthur Andersen, 15+ years with Eon
Labs (formerly listed)
Robert Litchev
President –
Manufacturing
Operations
10+ years principally with Terex
Scott Rolston
SVP Strategic Planning
13+ years principally with Manitowoc |
 9
Manitex International Businesses
“Focused
manufacturer of
engineered lifting
equipment”
Global Provider
•
Boom trucks
•
Sign cranes
•
Rough-terrain cranes
•
Specialized material and
container handling
Growth Strategy
•
Quickly adapt to changes in
demand patterns (now focussed
on N.American crane market)
•
International diversified dealer
base
•
Targeted Product Development
Serving Major Industries
Business Model
•
Accretive, high margin niche
acquisitions; utilize seller
financing
•
2009: Badger & LoadKing
•
2010: CVS rental agreement
•
2011: CVS acquisition
•Energy
•Utilities
•Commercial
building
•Rental fleets
•Cargo transport
•Infrastructure
dev
•Port & Inter-
Modal |
 10
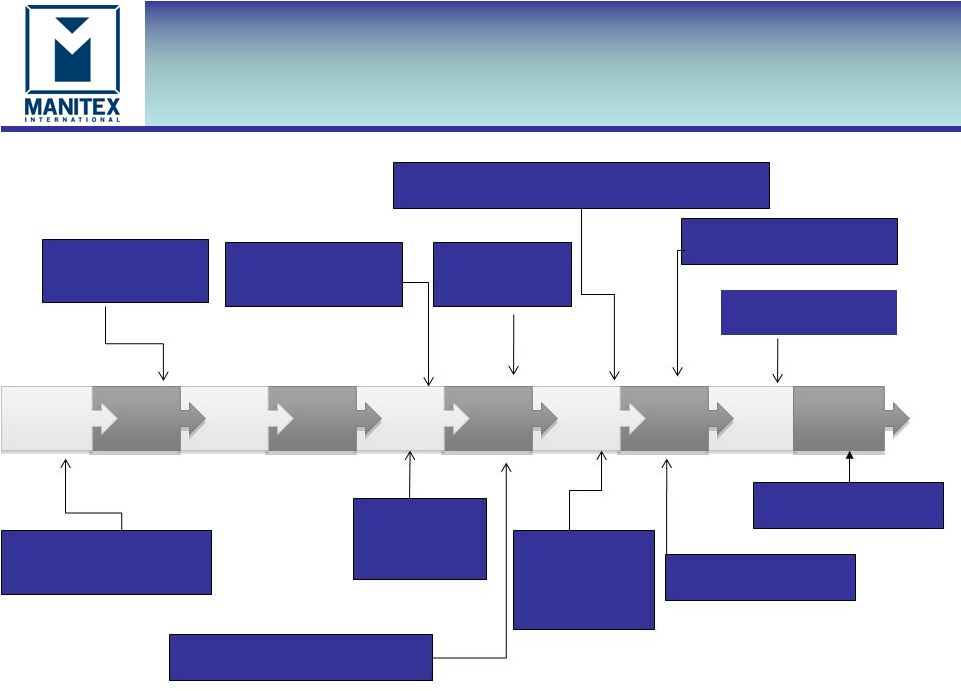
Company Timeline
“Focused
manufacturer of
engineered lifting
equipment”
March 2002:
Manitowoc (NYSE:MTW)
acquires Grove
January 2003:
Manitowoc divests
Manitex
December 2009: Acquire
Load King Trailers
July 2009: Acquire
Badger Equipment Co.
November
2006: Veri-Tek
Acquires
LiftKing
July 2007: VCC
acquires Noble
forklift
August 2007: Sale of assets and
closure of legacy VCC business
May 2008: Name changed to Manitex International
and listed on Nasdaq (MNTX)
October 2008:
Crane &
Machinery and
Schaeff Forklift
acquired
July 2006: Manitex
merges into Veri-Tek,
Intl. (VCC)
July 2010 : CVS
Operating Agreement
July 2011: Closes
Acquisition of CVS
2010
2008
2009
2007
2006
2004
2002
2005
2003
2011 |
 Replacement Parts & Service
Consistent Recurring Revenue
“Focused
manufacturer of
engineered lifting
equipment”
•
Recurring revenue of approximately 20% of total sales
•
Spares relate to swing drives, rotating components, and booms among others,
many of which are proprietary
–
Serve additional brands
–
Service team for crane equipment
–
Automated proprietary system implemented in principal operations
11 |
 12
R&D-Driven Product Line
Expansion
“Focused
manufacturer of
engineered lifting
equipment”
•
Continuous firm-wide commitment to innovation, research,
and product development remains a competitive advantage
•
Healthy R&D budget supports new product launches and
entry to new niches
•
Expect to see continued introduction of products that move
tonnage/capacity higher
•
Expect to see continued addition to niche sectors served by Manitex
equipment |
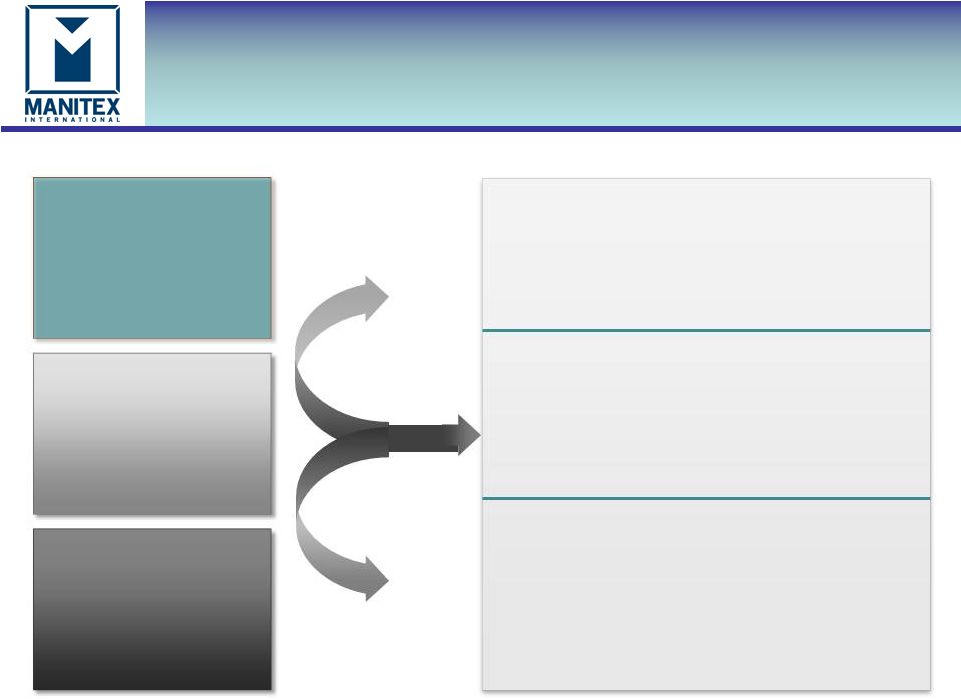 Competitive Positioning
“Focused
manufacturer of
engineered lifting
equipment”
•
Strong brand history
•
Acknowledged product development record
•
International dealers enable us to follow
demand
•
Focused on specialized equipment and niche
end-markets
Core competencies
Products
Superior ROI
•
Relatively low volume markets (niche)
•
Broad end-user base
•
Highly customized/specialized; will configure-
to-order
•
Parts and service an important part of
business model
•
Lower capital commitment for a boomtruck
vs. competitors’
custom cranes of similar
lifting capacity
•
Usually less or no special permitting vs.
competitors’
custom cranes of similar lifting
capacity |
 14
What Is Driving Growth?
“Focused
manufacturer of
engineered lifting
equipment”
•
Diversified product offering
•
International dealerships
•
Customer-focused design strategy
•
Operational flexibility
•
Product development and launch pipeline
•
Improving macro-economic conditions
•
More favorable credit markets |
 15
Summary
“Focused
manufacturer of
engineered lifting
equipment”
•
Strong operating metrics
•
2011 sales increased 48% to $142.3 million
•
2011
EBITDA
was
a
record
$11.1
million,
up
28%
YoY
•
Backlog at record $133 million as of 3/31/12
•
Focused on earnings, cash flow and working
capital management
•
Extended credit facility in June 2011; expanded
borrowing capacity and lowered interest costs
•
Targeting debt reduction through cash flows
throughout 2012
•
Increased penetration in oil & gas, power
grid & rail
•
Flexible operating model adapts to changes
in demand
•
Output increases expected throughout 2012
and 2013
•
Seeing North American expansion in 2012
and 2013
•
Recent orders have been for largest tonnage
cranes
Significant
opportunity to grow
from base
established in 2011 |
 16
Appendix
“Focused
manufacturer of
engineered lifting
equipment”
Manitex International, Inc.
Corporate Presentation
April 2012 |
 17
Key Figures -
Quarterly
“Focused
manufacturer of
engineered lifting
equipment”
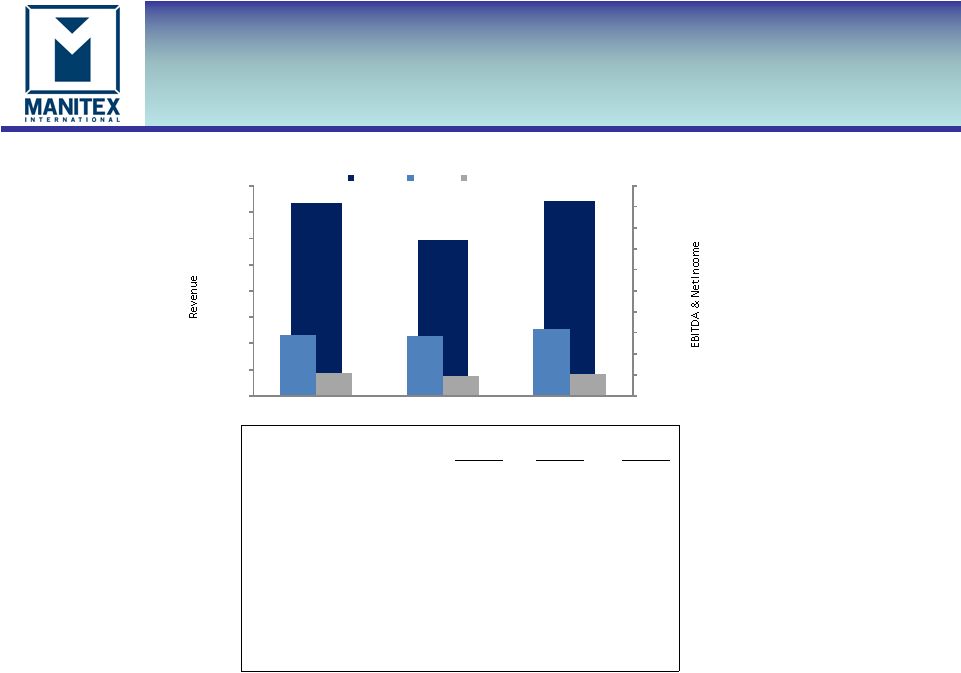
USD thousands
Q4-2011
Q4-2010
Q3-2011
Net sales
$36,561
$29,544
$36,942
Gross profit
7,489
7,660
7,824
Gross margin %
20.5%
25.9%
21.2%
Operating expenses
5,431
5,605
5,591
Net Income
1,070*
932
1,020
EBITDA
2,876
2,850
3,147
EBITDA % of Sales
7.9%
9.6%
8.5%
Backlog ($ million)
83.7
39.9
63.1
* Includes $1.2 million legal charge of present value of 20 annual payments of
$95k p.a. $36,561
$29,544
$36,942
$2,876
$2,850
$3,147
$1,070
$932
$1,020
$0
$1,000
$2,000
$3,000
$4,000
$5,000
$6,000
$7,000
$8,000
$9,000
$10,000
$0
$5,000
$10,000
$15,000
$20,000
$25,000
$30,000
$35,000
$40,000
Q4-2011
Q4-2010
Q3-2011
Revenue
EBITDA
Net Income |
 18
Summarized Balance Sheet
“Focused
manufacturer of
engineered lifting
equipment”
$000
30-Dec-11
31-Dec-10
31-Dec-09
31-Dec-08
Current assets
$71,209
$54,703
$40,147
$40,685
Fixed assets
11,017
10,659
11,804
5,878
Other long term assets
39,365
40,155
42,734
39,665
Total Assets
$121,591
$105,517
$94,685
$86,228
Current liabilities
30,177
23,011
14,569
17,062
Long term liabilities
44,620
39,232
39,688
34,152
Total Liabilities
$74,797
$62,243
$54,257
$51,214
Shareholders equity
46,794
43,274
40,428
35,014
Total liabilities & Shareholders
equity
$121,591
$105,517
$94,685
$86,228 |
 19
Working Capital
“Focused
manufacturer of
engineered lifting
equipment”
$000
2011
2010
2009
Working Capital
$41,032
$31,692
$25,578
Days sales outstanding (DSO)
61
60
67
Days payable outstanding (DPO)
59
62
73
Inventory turns
2.7
2.9
1.7
Current ratio
2.4
2.4
2.8
Operating working capital
50,007
36,763
29,112
Operating working capital % of annualized
LQS
34.2%
31.1%
48.7%
•Major movements in working capital increase 2011 v 2010 of $9.3m
•Receivables ($5.6m), inventory ($11.6m), offset by increased short term
notes ($2.7m), trade accounts payable ($4.0m) and accrued expenses
($0.6m) and reduced prepayments ($0.4m)
•Inventory increase v 2010 in raw materials and WIP to support growth,
and increased cost from material cost inflation
•Current ratio, DSO & DPO remain strong through growth phase,
and operating working capital % increased to support future revenue
growth |
 20
“Focused
manufacturer of
engineered lifting
equipment”
$000
2011
2010
2009
Total Cash
71
662
287
Total Debt
42,227
34,019
33,511
Total Equity
46,794
43,274
40,428
Net capitalization
88,950
76,631
73,652
Net debt / capitalization
47.4%
43.5%
45.1%
YTD EBITDA
11,120
8,676
1,982
YTD EBITDA % of sales
7.8%
9.0%
3.5%
•Increase in debt at 12/31/2011 from 12/31/2010 of $8.2m
•
Increase in lines of credit and Italian working capital finance $7.5m
•
Long
term
debt:
CVS
acquisition
funding
$3.8m;
Payments
on
other
debt
($3.0m)
•N. American revolver facilities, based on available collateral at December
31, 2011 was $30m. •Cash and N. American revolver availability at
December 31, 2011 $4.5m Debt & Liquidity
•
Net capitalization is the sum of debt plus equity minus cash
•
Net debt is total debt less cash |