Attached files
| file | filename |
|---|---|
| 8-K - 8-K - HARDINGE INC | a12-9225_18k.htm |
Exhibit 99.1
|
|
Investor Presentation April 2012 NASDAQ: HDNG www.hardinge.com Edward Gaio Vice President and Chief Financial Officer Richard Simons Chairman, President and Chief Executive Officer |
|
|
Forward-Looking Statements This presentation may contain forward-looking statements (within the meaning of Section 27A of the Securities Act of 1933, as amended and Section 21E of the Securities Exchange Act of 1934, as amended). Any such statements are based upon management’s current expectations that involve risks and uncertainties. Any statements that are not statements of historical fact or that are about future events may be deemed to be forward-looking statements. For example, words such as “may”, “will”, “should”, “estimates”, “predicts”, “potential”, “continue”, “strategy”, “believes”, “anticipates”, “plans”, “expects”, “intends” and similar expressions are intended to identify forward-looking statements. The Company’s actual results or outcomes and the timing of certain events may differ significantly from those discussed in any forward-looking statements. The following factors are among those that could cause actual results to differ materially from the forward-looking statements, which involve risks and uncertainties, and that should be considered in evaluating any such statement: fluctuations in the machine tool business cycles, changes in general economic conditions in the U.S. or internationally, the mix of products sold and the profit margins thereon, the relative success of the Company’s entry into new product and geographic markets, the Company’s ability to manage its operating costs, actions taken by customers such as order cancellations or reduced bookings by customers or distributors, competitor’s actions such as price discounting or new product introductions, governmental regulations and environmental matters, changes in the availability of cost of materials and supplies, the implementation of new technologies and currency fluctuations. The Company undertakes no obligation to publicly update any forward-looking statement, whether as a result of new information, future events, or otherwise. 2 |
|
|
Leading Global Machine Tool Manufacturer A leading global designer and top 40 manufacturer of high precision computer controlled metal-cutting machines with significant global brand recognition 3 Market capitalization $110.4 million Book value per share1 $12.61 Recent price $9.46 Current annual dividend rate $0.08 52 week price range $6.97 - $13.80 Dividend yield 0.8% Shares outstanding 11.7 million Institutional ownership 66.7% Average daily volume (3 mos.) 22,921 Insider ownership 3.4% Market Data as of March 30, 2012 market close; Ownership as of latest filing 1 As of December 31, 2011 Founded: 1890 IPO: 1995 NASDAQ: HDNG Year End: December 31 |
|
|
Global Expansion Strategy 4 Leverage our strong brands to capture greater global market share Emphasize growth in developing economies Expand through organic growth, acquisitions and strategic partnerships Create shareholder value by improving cash generation potential and build shareholders equity |
|
|
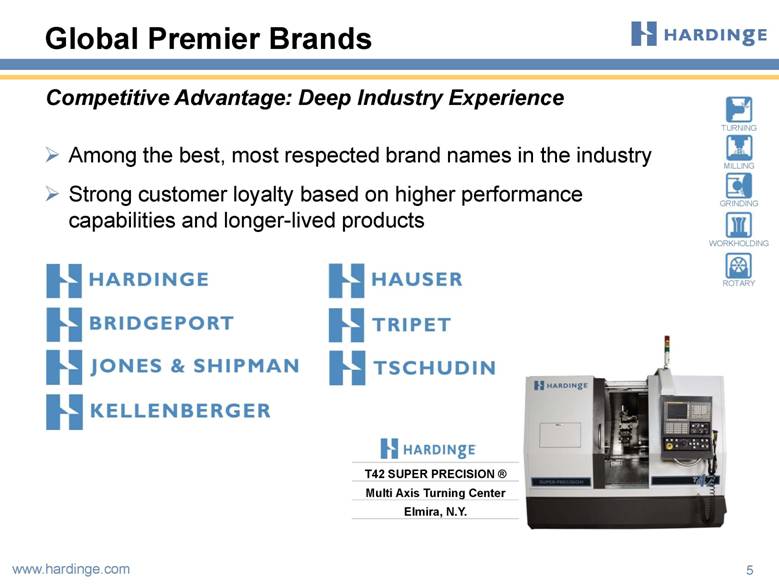
Global Premier Brands Among the best, most respected brand names in the industry Strong customer loyalty based on higher performance capabilities and longer-lived products 5 Competitive Advantage: Deep Industry Experience T42 SUPER PRECISION ® Multi Axis Turning Center Elmira, N.Y. |
|
|
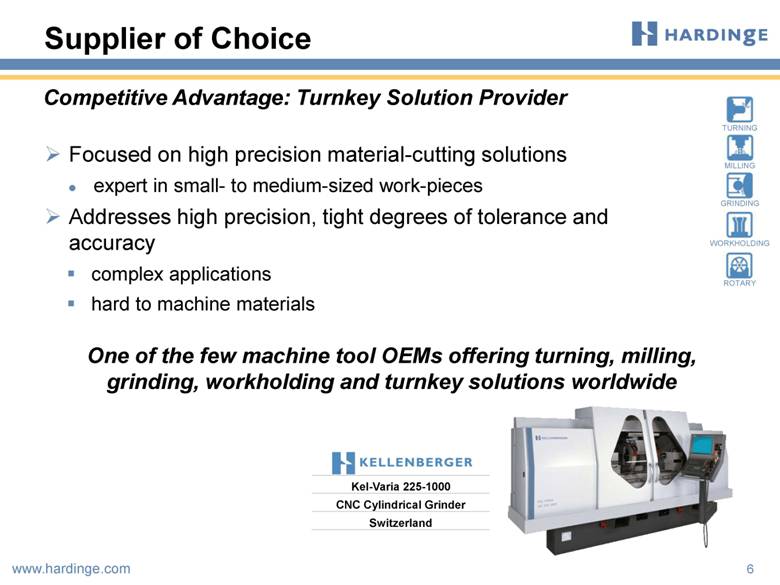
One of the few machine tool OEMs offering turning, milling, grinding, workholding and turnkey solutions worldwide Focused on high precision material-cutting solutions expert in small- to medium-sized work-pieces Addresses high precision, tight degrees of tolerance and accuracy complex applications hard to machine materials Supplier of Choice 6 Competitive Advantage: Turnkey Solution Provider Kel-Varia 225-1000 CNC Cylindrical Grinder Switzerland |
|
|
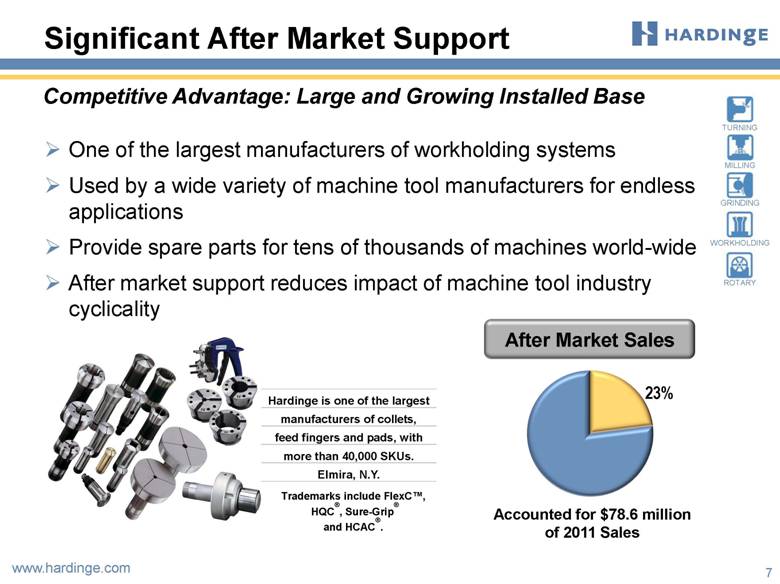
Significant After Market Support 7 Competitive Advantage: Large and Growing Installed Base After Market Sales One of the largest manufacturers of workholding systems Used by a wide variety of machine tool manufacturers for endless applications Provide spare parts for tens of thousands of machines world-wide After market support reduces impact of machine tool industry cyclicality Accounted for $78.6 million of 2011 Sales Hardinge is one of the largest manufacturers of collets, feed fingers and pads, with more than 40,000 SKUs. Elmira, N.Y. Trademarks include FlexC™, HQC®, Sure-Grip® and HCAC®. |
|
|
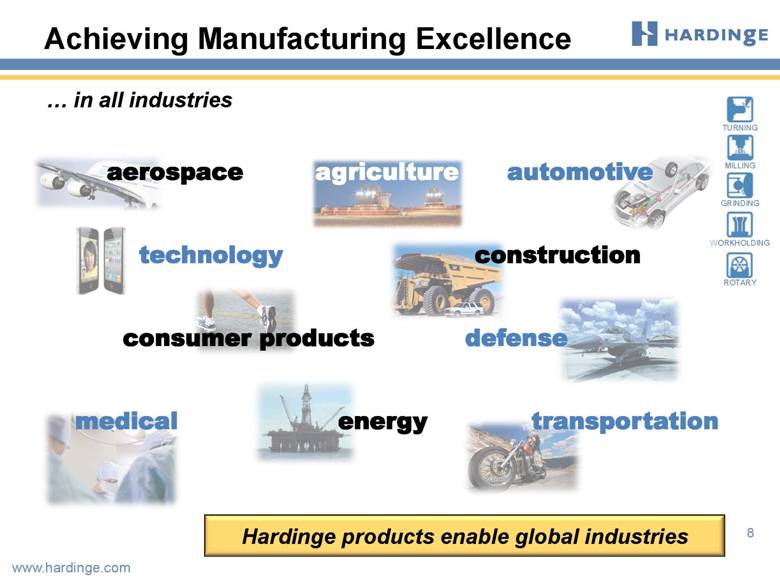
Achieving Manufacturing Excellence 8 in all industries aerospace agriculture automotive technology construction consumer products defense medical energy transportation Hardinge products enable global industries |
|
|
Diversified End Markets of Machined Products 9 Second tier supplier for OEMs in a wide range of end markets |
|
|
Competition 10 Turning & Milling Grinding Workholding North America Europe Asia/BRIC Yamazaki Mazak Corporation, Doosan Corporation, Haas Automation, Okuma Corporation, DMG, Mori Seiki and a number of manufacturers/assemblers in Taiwan Körber Schleifring (Studer), Moore Jig Grinding Smaller companies in the U.S., India and China Hardinge among world’s top 40 machine tool manufacturers |
|
|
Oxford Economics Machine Tool Forecast Source: Oxford Economics Autumn 2011 Global Machine Tool Outlook Report All MT figures are calculated using current exchange rates prior to 2011 and 2011 exchange rates after that date 11 Emerging Economies Drive Demand Growth Machine Tool Consumption (in US$ billions) Drivers of Machine Tool Consumption: Growing middle class in emerging economies Advancing productivity for global competitiveness Replacement of technologically obsolete older machines Shrinking supply of skilled machinists China: 71% of Asian demand Previous world peak surpassed in 2011 In 2014, Asian requirements surpass previous world peak $140 $120 $100 $80 $60 $40 $20 $0 2007 2008 2009 2010 2011 2012 2013 2014 2015 Americas Europe Asia Word |
|
|
12 Escalating Machine Tool Needs Positioned in Key Markets to Address Growing Demands Levels in US$ billions; based on 2011 exchange rates Source: Oxford Economics, Global Machine Tool Outlook, Autumn 2011 >5B 2B to 5B 1B to 2B 0.2B to 1B <0.2B Expected 2012 Machine Tool Consumption Expected 4-Year CAGR (2011 – 2015) Americas 14% Europe 10% Asia 15% World 14% |
|
|
2011 $342 million 2005 $290 million Successful Global Diversification Sales by Region 2000 $189 million 74% of the 2011 Sales outside of North America Largest customer less than 6% of 2011 Sales 13 North America 66% North America 37% North America 26% Asia & Other 11% Europe 23% Asia & Other 23% Europe 40% Asia & Other 43% Europe 31% |
|
|
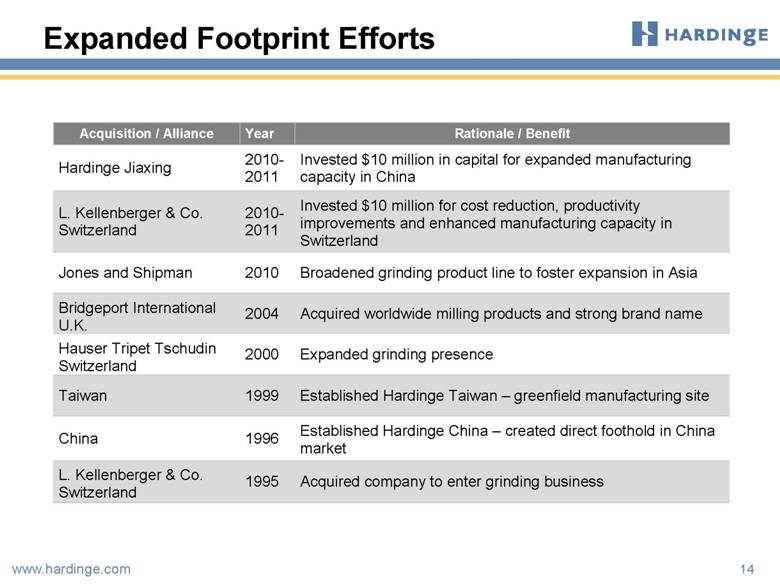
Expanded Footprint Efforts 14 Acquisition / Alliance Year Rationale / Benefit Hardinge Jiaxing 2010-2011 Invested $10 million in capital for expanded manufacturing capacity in China L. Kellenberger & Co. Switzerland 2010-2011 Invested $10 million for cost reduction, productivity improvements and enhanced manufacturing capacity in Switzerland Jones and Shipman 2010 Broadened grinding product line to foster expansion in Asia Bridgeport International U.K. 2004 Acquired worldwide milling products and strong brand name Hauser Tripet Tschudin Switzerland 2000 Expanded grinding presence Taiwan 1999 Established Hardinge Taiwan – greenfield manufacturing site China 1996 Established Hardinge China – created direct foothold in China market L. Kellenberger & Co. Switzerland 1995 Acquired company to enter grinding business |
|
|
Rationalized Channels to Market North America Eliminated 60 direct sales and service personnel Closed Canadian direct selling operations Contracted exclusive sales and support agreement with three premier distributors, with approximately 700 customer-facing roles and more than 900 employees Europe Eliminated 40 sales, service and applications support personnel Closed two offices Asia & Other Ten direct sales offices in China Distribution partners in key emerging markets in this region De-emphasized 22 countries 15 Undertook Initiatives in 2008 and 2009 |
|
|
Product line rationalization More effective distribution network Flexible manufacturing model: outsourced non-core activities Reduced headcount by 170 Cleared 200,000 sq. ft. of manufacturing space in the U.S. Disposed of under-utilized fixed assets Reduced working capital requirements Improved inventory management Strengthened cash management Improved Operating Leverage 16 Reduced Cost Structure |
|
|
Strategy for Growth 17 Capture Greater Global Market Share GX1000 Vertical Machining Center Nan Tou City, Taiwan Capitalize on brand strength New product development Expand capacity and capabilities in key markets Switzerland China |
|
|
FINANCIALS NASDAQ: HDNG www.hardinge.com |
|
|
Rebounding with Recovery 19 $214 $345 $257 $342 $356 Sales (in millions) $70 $164 $122 2007 $78 $158 $109 2008 $62 $88 $64 2009 $124 $75 $58 2010 $147 $105 $90 2011 North America Europe Asia & Other |
|
|
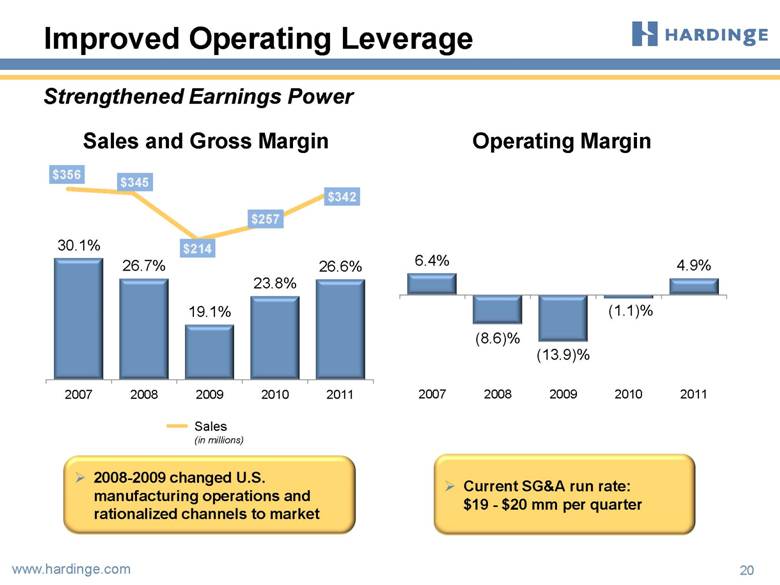
Improved Operating Leverage 20 Sales and Gross Margin Operating Margin 2008-2009 changed U.S. manufacturing operations and rationalized channels to market Current SG&A run rate: $19 - $20 mm per quarter Sales (in millions) Strengthened Earnings Power 356 30.1% 2007 $345 26.7 $214 $257 $342 2008 19.1% 2009 23.8% 2010 26.6% 2011 6.4% 2007 (8.6)% 2008 (13.9)% (1.1)% 4.9% 2009 2010 2011 Sales |
|
|
Improved Operating Leverage 21 Sales and Gross Margin Operating Margin Quarterly trends Sales (in millions) $82.0 $73.5 $86.7 $90.4 $91.0 24.1% 26.0% 26.9% 28.3% 25.4% 4.0% 3.1% 5.0% 7.0% 4.0% Q4 2010 Q1 2011 Q2 2011 Q3 2011 Q4 2011 Q4 2010 Q1 2011 Q2 2011 Q3 2011 Q4 2011 |
|
|
Emphasis on Productivity and Cash Sales per Employee ($ in thousands) Inventory Turns (Avg) Managed Working Capital* as a Percent of Sales Receivable Days Outstanding (Avg) 22 * Managed Working Capital is defined as : Receivables + Inventory - Payables - Customer Deposits $235 $242 $188 $216 $256 2007 2008 2009 2010 2011 1.6 1.6 1.5 1.8 2.1 2007 2008 2009 2010 2011 58% 55% 65% 46% 37% 2007 2008 2009 2010 2011 78 72 67 63 63 2007 2008 2009 2010 2011 |
|
|
Driving Cash Generation * EBITDA and Margins for 2008, 2009 and 2010 were adjusted to exclude unusual items. See supplemental slides for EBITDA reconciliation and other important disclaimers regarding EBITDA 23 EBITDA & Margin 9.5% 4.3% (5.0)% 2.4% 7.1% ($ in millions) $33.7 $15.0 $6.1 $24.3 ($10.7) 2007 2008* 2009* 2010* 2011 |
|
|
Growing Earnings Power 24 Diluted EPS $1.40 $0.10 ($2.01) ($0.30) $1.02 * Net income and EPS for 2008, 2009 and 2010 were adjusted to exclude unusual items. See supplemental slides for Adjusted Net Income reconciliation and other important disclaimers regarding Adjusted Net Income (in millions) |
|
|
Strong Order Expansion 25 $175 $341 $297 $372 Total Orders $361 Backlog (in millions) $14.9 $1.1 $12.0 ($22.9) ($3.4) 2007 2008* 2009* 2010* 2011 $72 $171 $118 2007 $82 $156 $103 2008 $72 $50 $53 2009 $139 $91 $67 2010 $157 $120 $95 2011 $104 2007 $97 2008 $58 2009 $106 2010 $139 2011 |
|
|
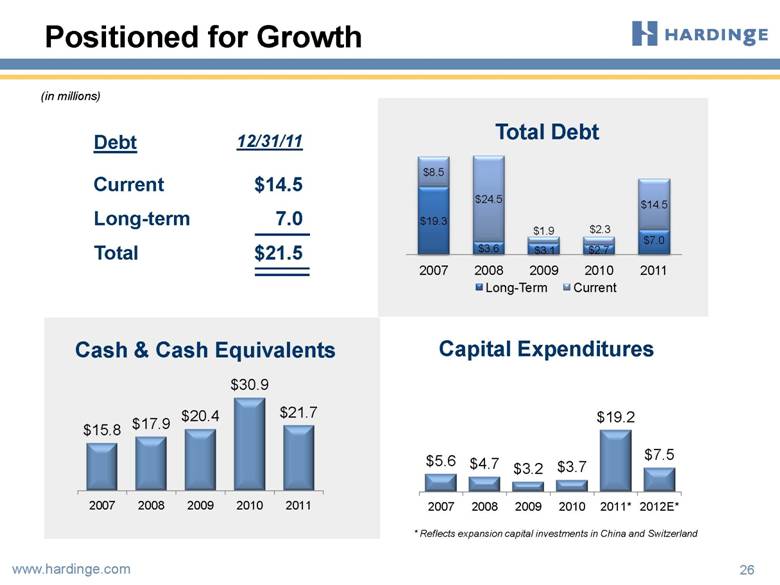
26 Positioned for Growth Debt 12/31/11 Current $14.5 Long-term 7.0 Total $21.5 Total Debt (in millions) * Reflects expansion capital investments in China and Switzerland Cash & Cash Equivalents Capital Expenditures $8.5 $19.3 $24.5 $3.6 $1.9 $3.1 $2.3 $2.7 $14.5 $7.0 2007 2008 2009 2010 2011 Long-term Current $15.8 $17.9 $20.4 $30.9 $21.7 2007 2008 2009 2010 2011 $5.6 $4.7 $3.2 $3.7 $19.2 $7.5 2007 2008 2009 2010 2011* 2012E* |
|
|
DRIVING LONG-TERM VALUE NASDAQ: HDNG www.hardinge.com |
|
|
Driving Long-Term Value 28 Initiatives generated annual fixed cost savings and expanded capacity to serve demand Restructured, Rationalized, and Invested Reduced working capital intensity by 30% Better fixed/variable cost structure for greater flexibility Rationalized product lines Simplified channels to market Invested $10 million each for expansion of Switzerland (grinding) and China (turning and milling) manufacturing capacity |
|
|
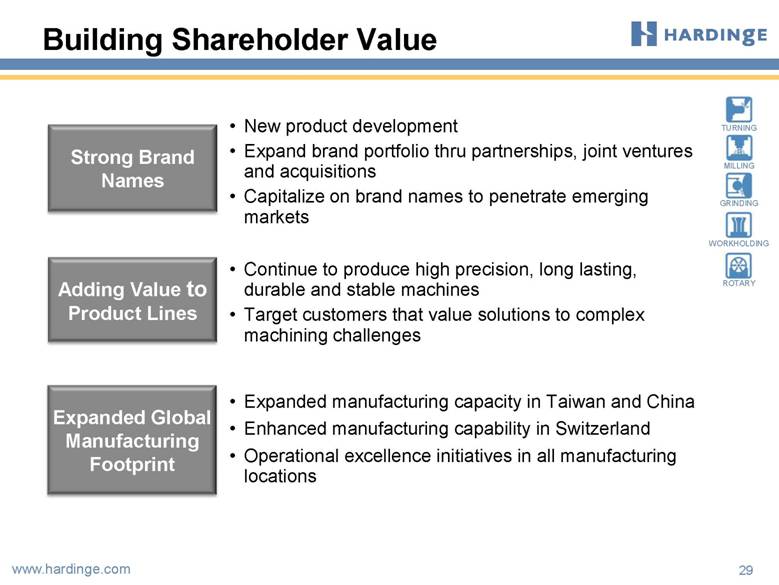
Building Shareholder Value Strong Brand Names New product development Expand brand portfolio thru partnerships, joint ventures and acquisitions Capitalize on brand names to penetrate emerging markets Expanded Global Manufacturing Footprint Expanded manufacturing capacity in Taiwan and China Enhanced manufacturing capability in Switzerland Operational excellence initiatives in all manufacturing locations Adding Value to Product Lines Continue to produce high precision, long lasting, durable and stable machines Target customers that value solutions to complex machining challenges 29 |
|
|
Capitalize on Machine Tool Industry Expansion Investment Highlights Comprehensive product and service offering with market leading brands Globally diverse sales and manufacturing platform Track record of successful strategic acquisitions and alliances Loyal customer base serving blue chip companies in a wide range of end markets Highly experienced management team 30 |
|
|
NASDAQ: HDNG www.hardinge.com Investor Presentation April 2012 Edward Gaio Vice President and Chief Financial Officer Richard Simons Chairman, President and Chief Executive Officer |
|
|
NASDAQ: HDNG SUPPLEMENTAL SLIDES www.hardinge.com |
|
|
Highly Experienced Management Team Total Machine Tool Industry Experience in Excess of 175 Years 33 Name Position Relevant Machine Tool Industry Experience Industrial Experience Richard Simons Chief Executive Officer & President 28 Years 33 Years Edward Gaio Chief Financial Officer & Vice President 5 Years 35 Years Jürg Kellenberger President of Grinding Technology Group 31 Years 38 Years Douglas Tifft Senior Vice President, Administration 34 Years 34 Years James Langa Senior Vice President, Asian Operations 5 Years 31 Years Paul Ling Vice President, Asian Supply Plants 27 Years 27 Years Alison Zhang General Manager, China Sales & Marketing 20 Years 29 Years John McTernan Director - European Sales & Marketing 34 Years 36 Years |
|
|
Net Income for 2008, 2009 and 2010 was adjusted for unusual items. Hardinge believes that when used in conjunction with GAAP measures, Adjusted Net Income, which is a non-GAAP measure, assists in the understanding of Hardinge’s operating performance. (1) Adjusted EBITDA, a non-GAAP financial measure, is defined as adjusted earnings before interest, taxes, depreciation and amortization. Adjusted EBITDA is used by management to internally measure our operating and management performance and by investors as a supplemental financial measure to evaluate the performance of our business that, when viewed with our GAAP results and the accompanying reconciliation, we believe provides additional information that is useful to gain an understanding of the factors and trends affecting our business. Adjusted Net Income / EBITDA Reconciliation (in millions, except for EPS) 2007 2008 2009 2010 2011 Net Income $ 14.9 $ (34.3) $ (33.3) $ (5.2) $ 12.0 Inventory impairment - 7.8 5.0 - - Goodwill write-off - 24.4 - - - Restructuring - 3.2 5.4 - - Gain on sale & acquisition - - - (1.7) - Other - - - 3.5 - Net Income / Adjusted Net Income 14.9 1.1 (22.9) (3.4) 12.0 Plus: Interest expense net of interest income 2.8 1.4 1.8 0.3 0.2 Taxes 6.5 3.1 1.9 2.2 4.4 Depreciation and amortization 9.5 9.4 8.5 7.0 7.7 EBITDA / Adjusted EBITDA (1) $ 33.7 $ 15.0 $ (10.7) $ 6.1 $ 24.3 Adjusted Net Income $ 14.9 $ 1.1 $ (22.9) $ (3.4) $ 12.0 Inc. to Participating Security (.02) - - - (0.2) Income for Common Shares $ 14.7 $ 1.1 $ (22.9) $ (3.4) $ 11.8 Weighted AVG Diluted Shares 10.5 11.3 11.4 11.4 11.6 Adjusted Diluted EPS $ 1.40 $ 0.10 $ (2.01) $ (0.30) $ 1.02 34 |

