Attached files
| file | filename |
|---|---|
| 8-K - FORM 8-K - GULFMARK OFFSHORE INC | d321414d8k.htm |
 GulfMark Offshore,
Inc GulfMark Offshore, Inc
Howard Weil Energy Conference -
2012
Exhibit 99.1 |
 Forward Looking Statements
2
Cautionary Statement Regarding Forward-Looking Statements
This presentation contains certain forward-looking statements within the
meaning of the Private Securities Litigation Reform Act of 1995, which
involve known and unknown risk, uncertainties and other factors. Among the
factors that could cause actual results to differ materially are: the price of
oil and gas and its effect on industry conditions; industry volatility;
fluctuations in the size of the offshore marine vessel fleet in areas where
the Company operates; changes in competitive factors; delay or cost overruns
on construction projects and other material factors that are described from time
to time in the Company's filings with the SEC, including the Company's Form
10-K for the year ended December
31, 2010. Consequently, the forward-looking statements contained herein should
not be regarded as representations that the projected outcomes can or will
be achieved. NYSE:
GLF
www.GulfMark.com |
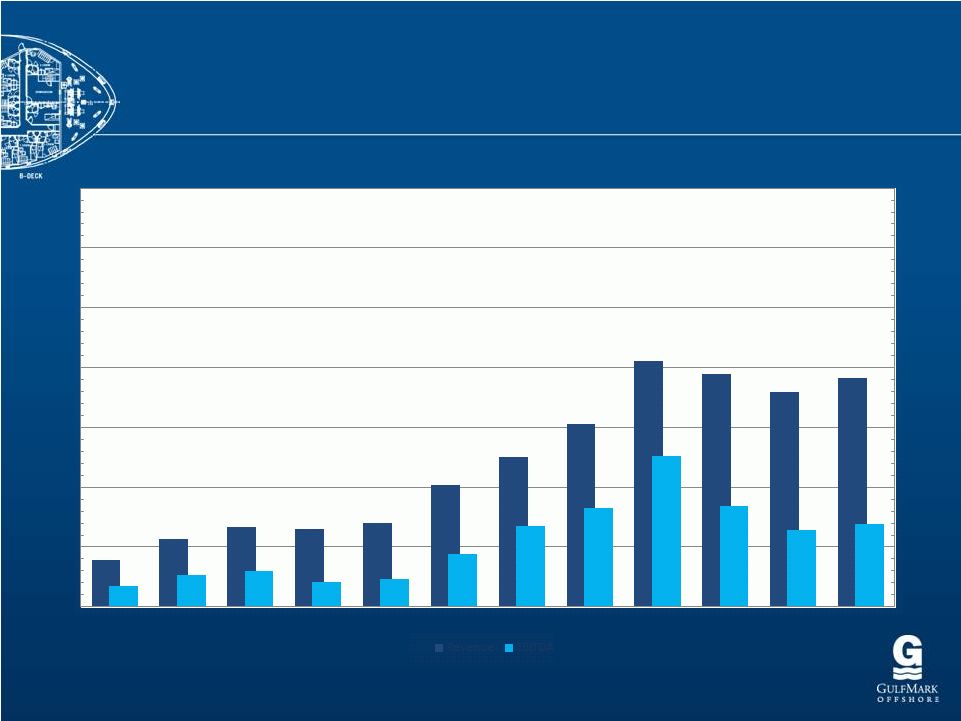 Long Term Revenue
& EBITDA Long Term Revenue & EBITDA
(in millions of dollars)
(in millions of dollars)
3
* Note: Adjusted for Special Items, See Supporting Information at the end of this Presentation
$0
$100
$200
$300
$400
$500
$600
$700
$0
$100
$200
$300
$400
$500
$600
$700
2000
2001
2002
2003
2004
2005
2006
2007
2008
2009
2010
2011
Revenue
EBITDA* |
 4
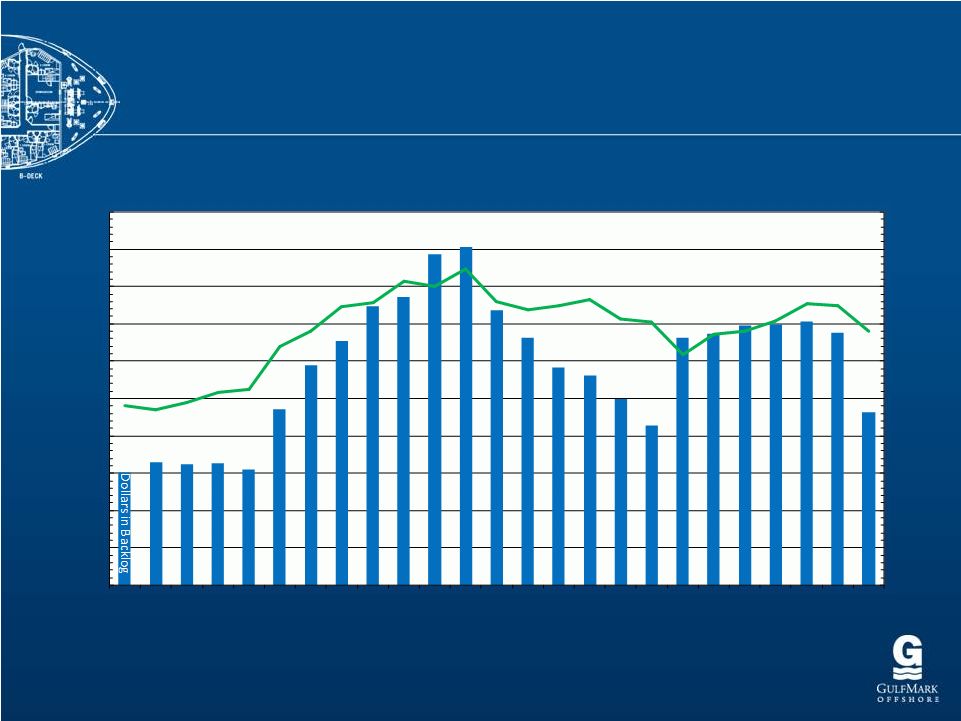
Total Revenue in Backlog
Total Revenue in Backlog
(in thousands of dollars)
(in thousands of dollars)
$0
$2,500
$5,000
$7,500
$10,000
$12,500
$15,000
$17,500
$20,000
$22,500
$25,000
$0
$100,000
$200,000
$300,000
$400,000
$500,000
$600,000
$700,000
$800,000
$900,000
$1,000,000
Q4
2005
Q1
2006
Q2
2006
Q3
2006
Q4
2006
Q1
2007
Q2
2007
Q3
2007
Q4
2007
Q1
2008
Q2
2008
Q3
2008
Q4
2008
Q1
2009
Q2
2009
Q3
2009
Q4
2009
Q1
2010
Q2
2010
Q3
2010
Q4
2010
Q1
2011
Q2
2011
Q3
2011
Q4
2011 |
 5
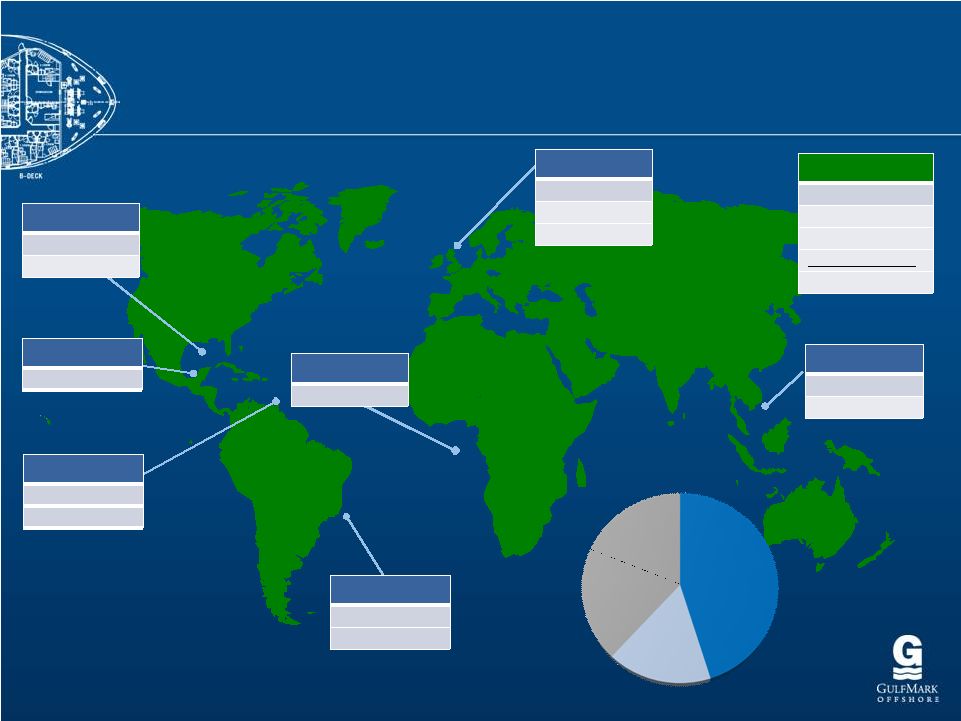
Global Vessel Diversification
Global Vessel Diversification
West Africa
AHTS 2
US Gulf
PSV 14
FSV/Crew 3
Mexico
AHTS 2
Trinidad
PSV
4 FSV/Crew 3
Brazil
PSV
7
SpV
1 North Sea
PSV
20 AHTS
1
SpV
1 Worldwide
PSV
47
AHTS
17 FSV/Crew 7
SpV
2
Total
73 SE Asia
PSV
3 AHTS 12
Revenue Breakout by Region
–
Year Ended December 31,
2011
North Sea
45%
Southeast
Asia
17%
19%
19%
Gulf of Mexico
Rest of Americas |
 Benefits of Geographic Diversification
6 |
 Gulf of Mexico:
Deepwater Utilization on Recovery
Deepwater Utilization on Recovery
7
Decreased Exposure to U.S. Gulf of Mexico by Approximately 50%
—
Lower Utilization, but also Lower Revenue Exposure in the U.S. Gulf of
Mexico Option Value of Positioning Vessels on Short-Term Contracts in
Trinidad —
Ability to Quickly Capitalize on a Recovery in the U.S. Gulf of Mexico
Supply Constraint of Deepwater Vessels
—
Due to the Disproportionate Movement of Higher Specification Vessels Out of the
Gulf of Mexico as Compared to Lower Specification Vessels
Vessel Differentiation Based on Safety, Quality, and Training
—
Due to the Deepwater Horizon Event, we Anticipate a Preference for Our Highly
Trained Mariners and the Modern Safety Equipment on Our Vessels
Modifying Certain Vessels in Existing Fleet in Anticipation of U.S. Gulf of
Mexico Recovery |
 The GulfMark
Fleet The GulfMark Fleet
8 |
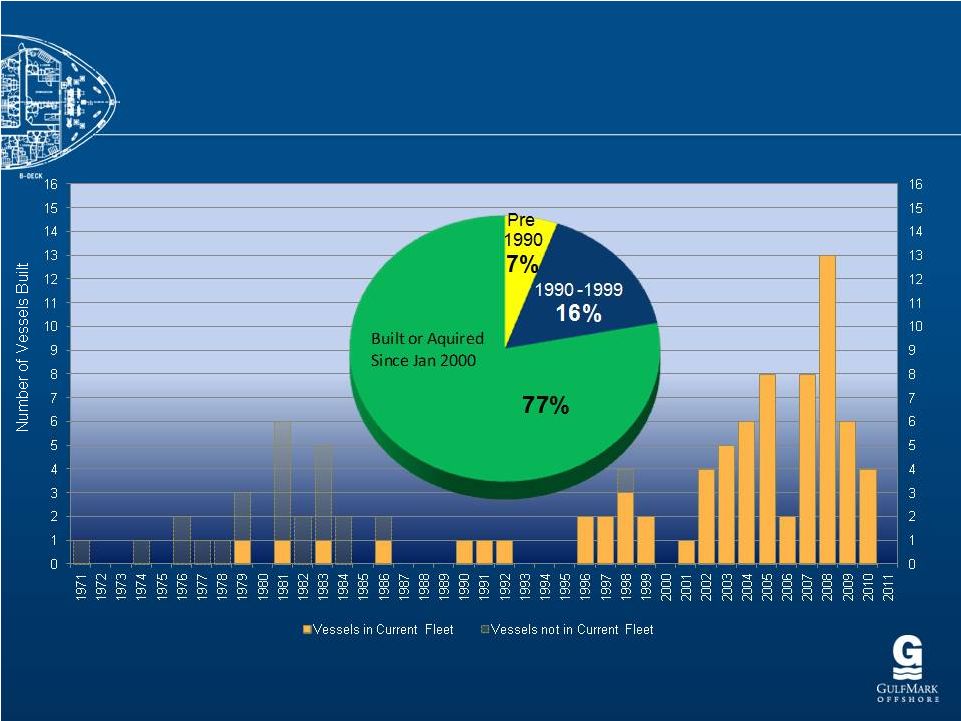 Young & Versatile Fleet
9
Number of Vessels We Built Per Year |
 10
Vessel Dispositions Demonstrate
Vessel Dispositions Demonstrate
Long-Term Value
Long-Term Value
Vessel
Name
Year
of
Sale
Year
Built
Age at
Disposal
Sales
Price
Original
Cost
Sales Price as
a Percentage
of Original
Cost
Bluefin
2012
2008
3
6,350,000
6,019,100
105%
Highland Pioneer
2011
1983
28
2,850,000
4,699,301
61%
North Traveller
2010
1998
12
18,692,000
17,775,436
105%
Seapower
2010
1974
36
380,000
1,355,389
28%
Sea Searcher
2009
1976
33
2,000,000
1,298,096
154%
Highland Sprite
2009
1986
23
5,075,000
6,935,050
73%
Sefton Supporter
2009
1971
38
1,029,000
909,535
113%
North Fortune
2008
1983
25
19,000,000
9,955,746
191%
Sea Eagle
2008
1976
32
2,000,000
985,754
203%
Sem Valiant
2008
1981
27
2,600,000
2,798,898
93%
North Crusader
2008
1984
24
19,000,000
12,380,504
153%
Sea Diligent
2008
1981
27
3,950,000
2,805,178
141%
Sea Endeavor
2007
1981
26
2,500,000
2,573,100
97%
Sea Explorer
2007
1981
26
5,125,000
2,821,841
182%
Sem Courageous
2007
1981
26
2,500,000
2,132,069
117%
North Prince
2007
1978
29
5,650,000
7,212,539
78%
Sentinel
2006
1979
27
7,400,000
4,733,578
156%
Highland Patriot
2006
1982
24
10,800,000
7,289,049
148%
Average Age
26
Total Average
123% |
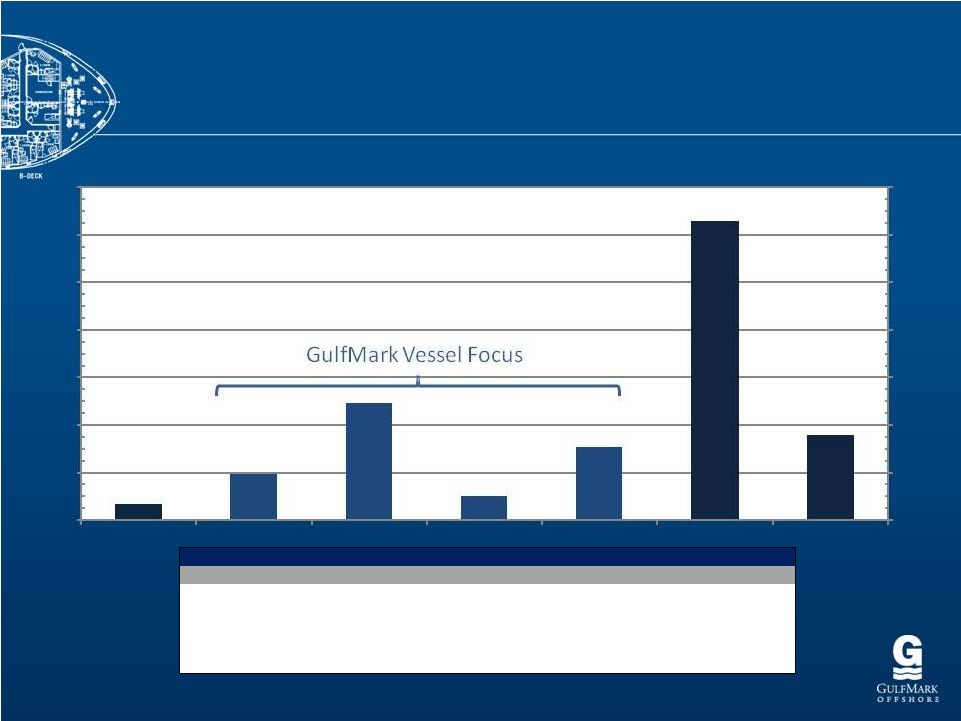 Worldwide Vessel Fleet by Category
11
Source:
RS
Platou
-
Global
Support
Vessel
Monthly
-
December
2011
Size (bhp)
Category
Spec
Size (m2)
Category
Spec
< 10,000
AHTS Small
Low-end
< 500
PSV Small
Low-end
10,000-15,999
AHTS Medium
Low-end
500-899
PSV Medium
High-end
16,000-19,999
AHTS Large
High-end
> 900
PSV Large
High-end
> 19,999
AHTS X-Large
High-end
Vessel categorization
AHTS
PSV
0
200
400
600
800
1000
1200
1400
0
200
400
600
800
1000
1200
1400
AHTS XL
PSV Large
PSV Medium
AHTS Large
AHTS Medium
AHTS Small
PSV Small |
 Building For Our Future
12
Significant number of new generation rigs on order
Increasing Activity both in the North Sea and New Frontiers
Industry call for higher specification vessels to meet increasing regulatory
demands:
•
Deeper Waters and Harsher Environments
•
Increased cargo carrying capacity and flexibility
•
Enhanced Green Footprint and offering greater safety support greater
|
 13
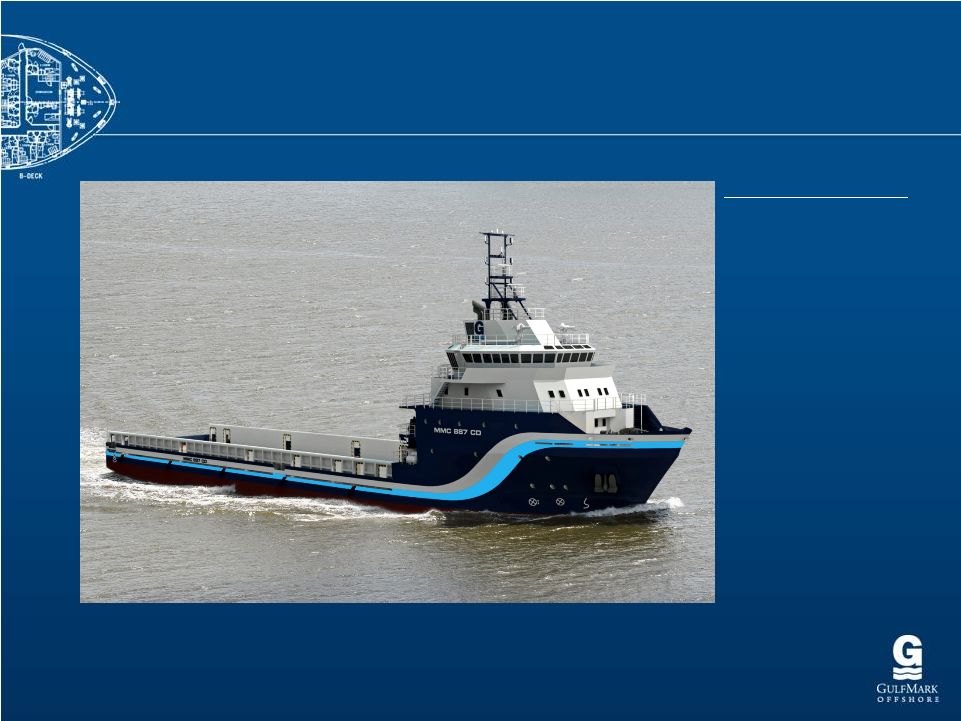
Remontowa Shipyard, Poland
Delivery Q2/2013 Q3/2013
Two
MMC
887
CD
1000m²
Deck
Area
DP
II
MAIN PARTICULARS
Large Cargo Capacities
LOA
88.93 m
Beam
18.80 m
Depth
7.40 m
DWT
5100 T
Max Draft
6.05 m
Speed
14.30 kts
FiFi System
Tank Cleaning System
Oil Recovery
SPS Code
Green Passport*
41 Berths
Gym
Recreational Lounges
Total Power
6800 kW
Propulsion
Diesel electric
2 x 2000 kW Azimuth
Thrusters
1 x 910 kW Bow Tunnel
1 x 800 kW Retractable Azimuth
New Build Program Announced
New Build Program Announced |
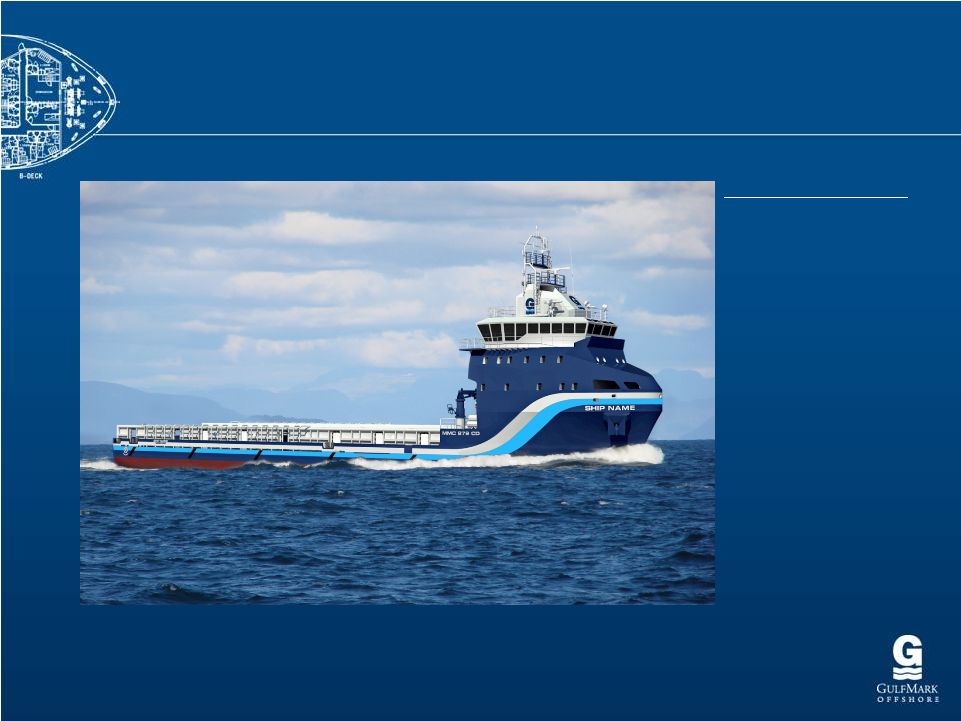 14
One MMC 879 CD 846m²
Deck Area DPII
Total Power
6800 kW
Propulsion
Diesel electric
2 x 2000 kW Azimuth
Thrusters
2 x 910 kW Bow Tunnel
MAIN PARTICULARS
Large Cargo Capacities
LOA
79.45 m
Beam
16.80 m
Depth
7.40 m
DWT
4000 T
Max Dr
6.00 m
Speed
14.00 kts
FiFi System
Tank Cleaning System
Oil Recovery
SPS Code
Green Passport
29 Berths
Gym
Recreational Lounges
Remontowa Shipyard, Poland
Delivery Q3/2013
New Build Program Cont’d
New Build Program Cont’d |
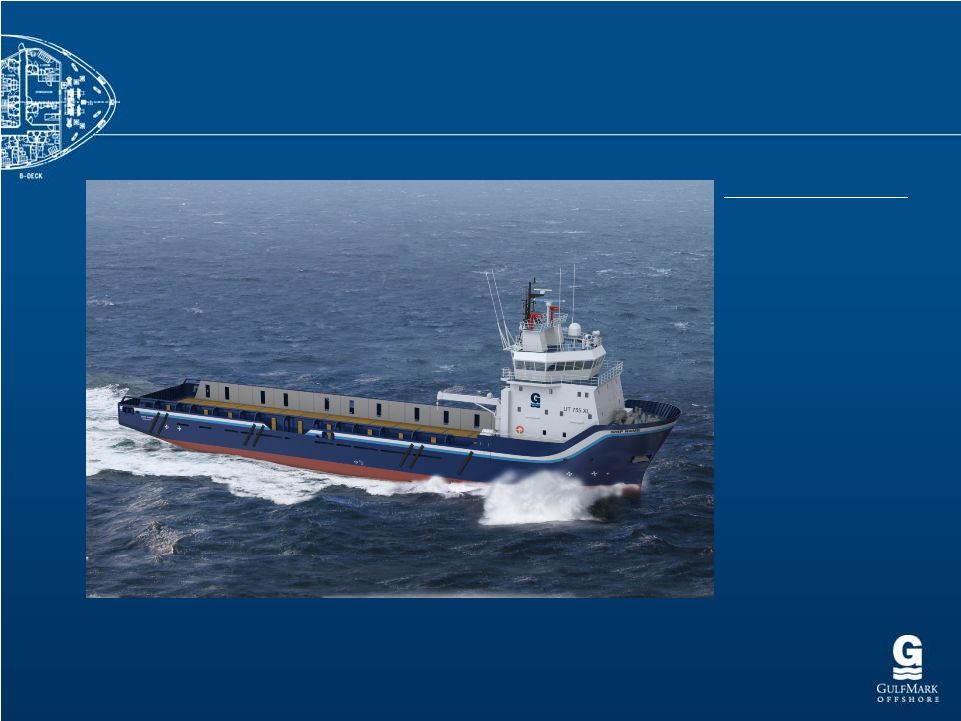 15
Two UT 755 XL 715m²
Deck Area DPII
Total Power
5580 kW
Propulsion
Conventional
2 x 2790 kW CPP
Thrusters
2 x 590 kW Stern Tunnel
2 x 660 kW Bow Tunnel
MAIN PARTICULARS
Large Cargo Capacities
LOA
74.95 m
Beam
16.00 m
Depth
7.00 m
DWT
3000 T
Max Dr
5.80 m
Speed
14.50 kts
FiFi System
Tank Cleaning System
Oil Recovery
SPS Code
Green Passport*
25 Berths
Gym
Recreational Lounges
Rosetti Shipyard, Italy
Delivery Q4/2013
Q1/2014
New Build Program Cont’d
New Build Program Cont’d |
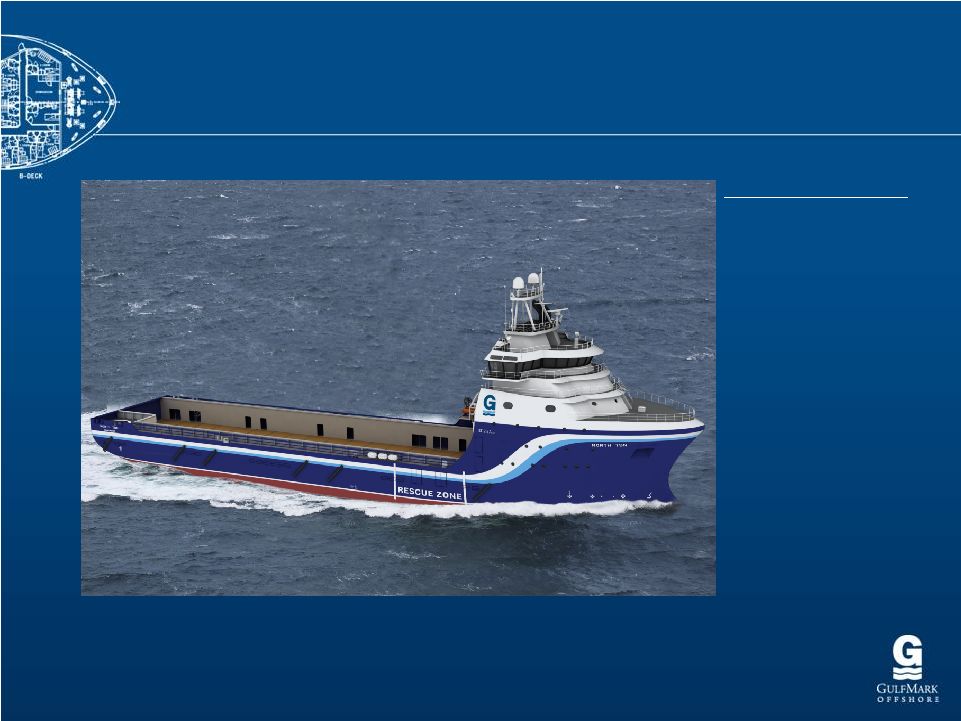 16
Two ST-216 Arctic 1050m²
Deck Area DPII
Total Power
8400 kW
Propulsion
Diesel electric
2 x 2600 kW CRP
Thrusters
2 x 1100 kW Bow Tunnel
1 x 883 kW Retractable
Azimuth
MAIN PARTICULARS
Large Cargo Capacities
LOA
92.60 m
Beam
19.20 m
Depth
8.40 m
DWT
4700 T
Max Dr
6.85 m
Speed
17.00 kts
Ice Classed
Winterized
Rescue
Oil Recovery
Tank Cleaning System
SPS Code
Green Passport
40 Berths
Gym
Recreational Lounges
Siemek A/S Shipyard, Flekkefjord, Norway
Delivery Q2/2013
New Build Program Cont’d
New Build Program Cont’d |
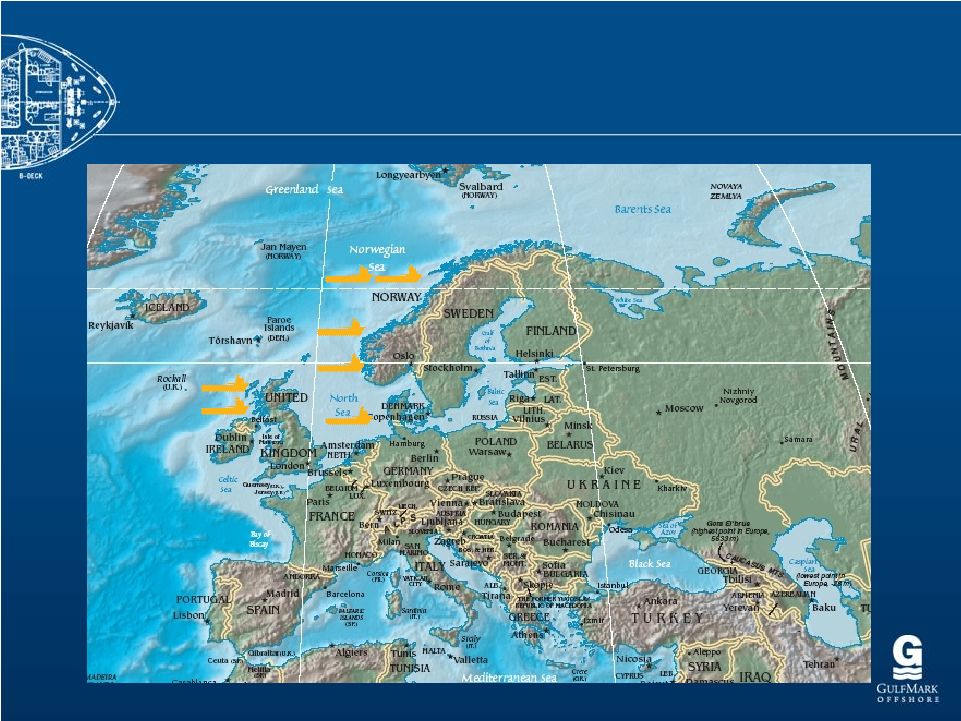 Planned Locations for New Build Vessels
(Map of North Sea)
(Map of North Sea)
17 |
 Stretch Project
18 |
 Financial
Information Financial Information
19 |
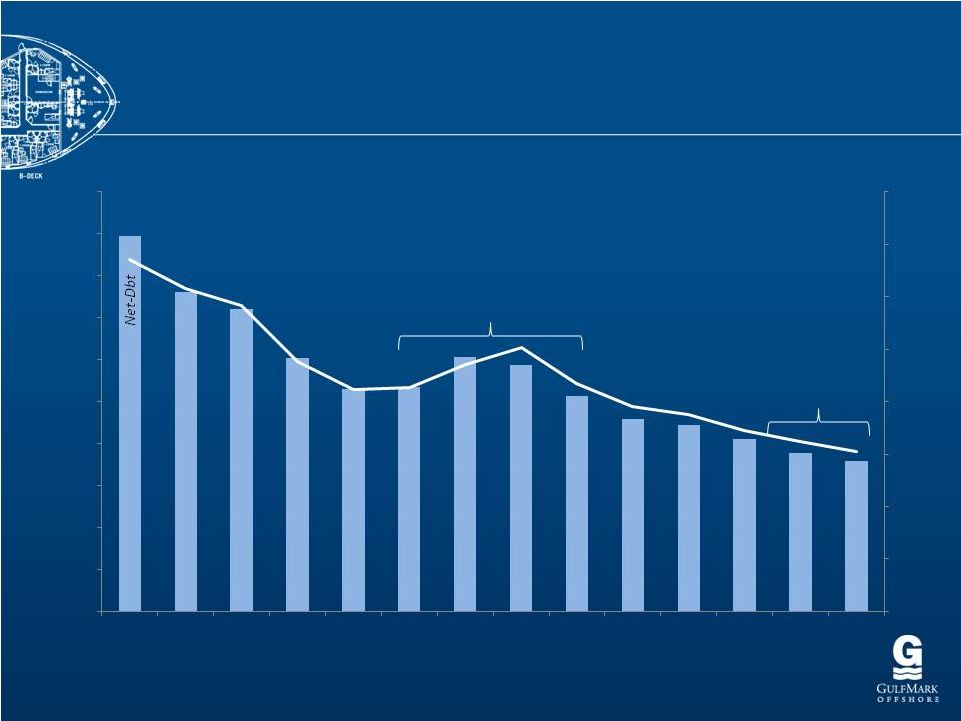 20
Consistent Reduction in
Consistent Reduction in
Net Debt Position
Net Debt Position
0%
5%
10%
15%
20%
25%
30%
35%
40%
$0
$50,000
$100,000
$150,000
$200,000
$250,000
$300,000
$350,000
$400,000
$450,000
$500,000
Q3 2008
Q4 2008
Q1 2009
Q2 2009
Q3 2009
Q4 2009
Q1 2010
Q2 2010
Q3 2010
Q4 2010
Q1 2011
Q2 2011
Q3 2011
Q4 2011
Net-Debt to
Total Book
Capitalization
Finalization of Previous
New-
Build Program
Initiation of Current
New-Build Program |
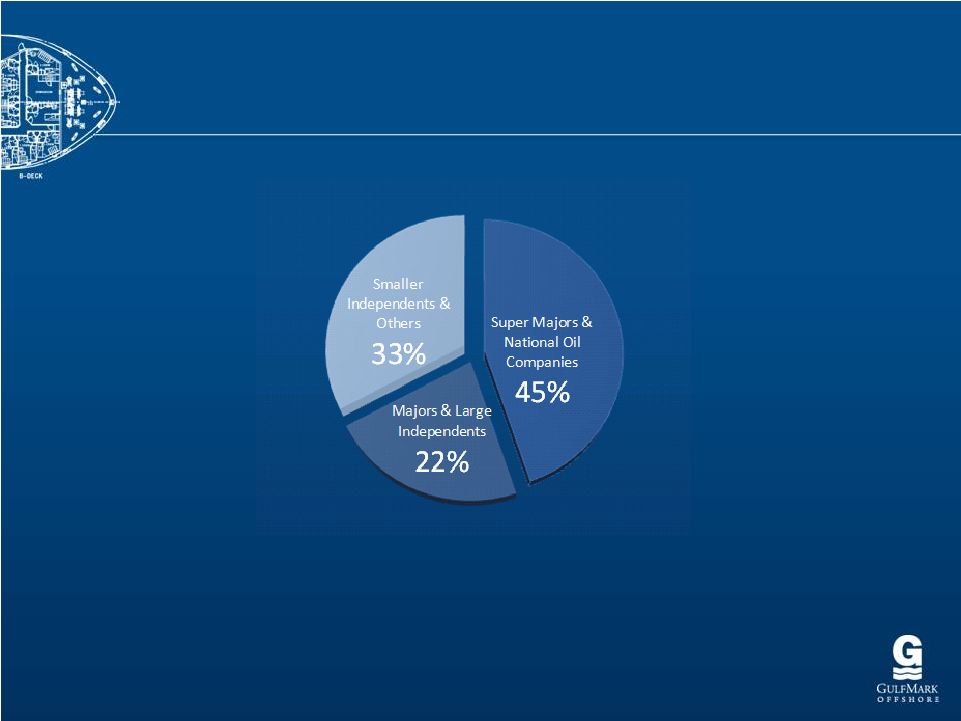 Strong Customer
Base Strong Customer Base
21
Note: Percentages Based on Vessel Count as of February 23, 2012 |
 22
Quarter Ended December 31, 2011
Quarter Ended December 31, 2011
(in thousands of dollars)
(in thousands of dollars)
Revenues
$ 43,982
$ 15,880
$ 40,030
99,892
Direct operating expenses
19,087
43%
2,848
18%
21,322
53%
43,257
43%
Drydock expense
124
0%
(92)
(1%)
(32)
0%
(1)
0%
General and administrative expenses (Regional)
3,051
7%
655
4%
2,172
5%
5,879
6%
General and administrative expenses (Corporate)
- 0%
-
0%
-
0%
5,425
5%
Depreciation expense
4,814
11%
2,428
15%
7,075
18%
15,032
15%
(Gain) loss on sale of assets / Other special items
(278)
1%
-
0%
-
0%
(278)
0%
Operating Income
$ 17,184
39%
$ 10,041
63%
$ 9,493
24%
$ 30,579
31%
Pre-Gain Operating Income
$ 16,906
38%
$ 10,041
63%
$ 9,493
24%
$ 30,301
30%
EBITDA (Pre Gain)
$ 21,720
49%
$ 12,469
79%
$ 16,568
41%
$ 45,333
45%
Interest expense
(5,201)
Interest income
368
Foreign currency gain (loss) and other
442
Income before income taxes
$ 26,188
Income tax benefit (provision)
(2,544)
10%
Net Income
$ 23,645
Diluted Earnings Per Share
$ 0.90
Diluted Earnings Per Share (Before Special Items)
$ 0.89
Weighted average diluted common shares
26,032
Consolidating Income Statement for the Three Months Ended Dec 31, 2011
North Sea
Southeast
Asia
Americas
Total |
 23
Year Ended December 31, 2011
Year Ended December 31, 2011
(in thousands of dollars)
(in thousands of dollars)
Q1
Q2
Q3
Q4
2011
Actual
Actual
Actual
Actual
Actual
Revenues
$ 81,289
$ 96,911
$ 103,778
$ 99,892
$ 381,870
Direct operating expenses
44,317
54.5%
46,909
48.4%
48,103
46.4%
43,257
43.3%
182,585
47.8%
Drydock expense
6,524
8.0%
3,683
3.8%
5,726
5.5%
(1)
0.0%
15,932
4.2%
General and administrative expenses (Regional)
6,178
7.6%
5,379
5.6%
5,961
5.7%
5,879
5.9%
23,397
6.1%
General and administrative expenses (Corporate)
5,245
6.5%
5,530
5.7%
5,897
5.7%
5,425
5.4%
22,098
5.8%
Depreciation expense
14,675
18.1%
14,982
15.5%
14,897
14.4%
15,032
15.0%
59,586
15.6%
(Gain) / loss on sale of assets / Other special items
10 0.0%
- 0.0%
- 0.0%
(278)
-0.3%
(268)
0.1%
Operating Income
4,339
5.3%
20,428
21.1%
23,194
22.3%
30,579
30.6%
78,540
20.6%
Pre-Gain Operating Income
4,350
5.4%
20,428
21.1%
23,194
22.3%
30,301
30.3%
78,272
20.5%
EBITDA (Pre Gain)
19,025
23.4%
35,411
36.5%
38,091
36.7%
45,333
45.4%
137,858
36.1%
Interest expense
(5,727)
(5,630)
(5,757)
(5,201)
(22,314)
Interest income
67 118
195
368
748
Foreign currency gain (loss) and other
(58)
74 (2,803)
442
(2,346)
Income before income taxes
(1,378)
14,990
14,829
26,189
54,628
Income tax benefit (provision)
212
-15.3%
(1,699)
11.3%
(664)
4.5%
(2,544)
9.7%
(4,694)
8.6%
Net Income
$ (1,167)
$ 13,292
$ 14,165
$ 23,645
$ 49,934
Diluted Earnings Per Share
:
$ (0.05)
$ 0.51
$ 0.54
$ 0.90
$ 1.91
(in thousands) |
 24
Investment Highlights
Investment Highlights
Industry Leaders in HSE Performance & People Development
Strong Demand for Modern Offshore Marine Equipment
Global Presence and Operations Expertise
Financial Stability & Flexibility to Pursue Opportunities
Growth through Acquisition and New Construction
Young, Versatile, High-Specification Fleet |
 Reconciliation of Adjusted EBITDA
25
2002
2003
2004
2005
2006
2007
2008
2009
2010
2011
Net (loss) income
$24.0
$0.5
($4.6)
$38.4
$89.7
$99.0
$183.8
$50.6
($34.7)
$49.9
Interest expense, net
10.9
12.8
17.0
18.4
14.4
4.8
12.8
19.9
20.7
21.6
Income tax (benefit)
3.0
0.2
(6.5)
3.4
3.0
30.2
11.7
(2.1)
(12.7)
4.7
Depreciation & Amortization
21.4
28.0
26.1
28.9
28.5
30.6
44.3
53.0
57.0
59.6
EBITDA
59.3
$
41.5
$
32.0
$
89.1
$
135.6
$
164.6
$
252.6
$
121.5
$
30.2
$
135.8
$
Adjustments:
Impairment
-
-
-
-
-
-
-
46.2
97.7
1.8
Debt refinancing costs
-
-
6.5
-
-
-
-
-
-
-
Accounting Change
-
-
7.3
-
-
-
-
-
-
-
Other
(2.5)
1.3
(1.5)
(0.5)
0.1
0.3
(1.6)
1.2
(0.1)
2.3
Adjusted EBITDA
$56.8
$42.8
$44.3
$88.6
$135.7
$164.9
$251.0
$168.8
$127.8
$139.9
EBITDA is defined as net income (loss) before interest expense, net,
income tax provision, and depreciation and amortization, which includes impairment. Adjusted
EBITDA is calculated by adjusting EBITDA for certain items that we
believe are non-cash or unusual, consisting of: (i) loss from unconsolidated ventures; (ii) minority
interest; and (iii) other (income) expense, net. EBITDA and
Adjusted EBITDA are not measurements of financial performance under GAAP and should not be
considered as an alternative to cash flow data, a measure of liquidity
or an alternative to income from operations or net income as indicators of our operating
performance or any other measures of performance derived in accordance
with GAAP. EBITDA and Adjusted EBITDA are presented because we believe they are used
by security analysts, investors and other interested parties in the
evaluation of companies in our industry. However, since EBITDA and Adjusted EBITDA are not
measurements determined in accordance with GAAP and are thus
susceptible to varying calculations, EBITDA and Adjusted EBITDA as presented may not be
comparable to other similarly titled measures of other companies.
|
 26 |
 27
|
 28 |