Attached files
| file | filename |
|---|---|
| EX-32.2 - EXHIBIT 32.2 - GULFMARK OFFSHORE INC | ex32-2.htm |
| EX-32.1 - EXHIBIT 32.1 - GULFMARK OFFSHORE INC | ex32-1.htm |
| EX-31.2 - EXHIBIT 31.2 - GULFMARK OFFSHORE INC | ex31-2.htm |
| EX-31.1 - EXHIBIT 31.1 - GULFMARK OFFSHORE INC | ex31-1.htm |
| EX-23.1 - EXHIBIT 23.1 - GULFMARK OFFSHORE INC | ex23-1.htm |
| EX-21 - EXHIBIT 21 - GULFMARK OFFSHORE INC | ex21.htm |
| EX-12.1 - EXHIBIT 12.1 - GULFMARK OFFSHORE INC | ex12-1.htm |
| EX-10.39 - EXHIBIT 10.39 - GULFMARK OFFSHORE INC | ex10-39.htm |
UNITED STATES SECURITIES AND EXCHANGE COMMISSION
WASHINGTON, D.C. 20549
FORM 10-K
☑ ANNUAL REPORT PURSUANT TO SECTION 13 OR 15(d) OF THE SECURITIES EXCHANGE ACT OF 1934
For the fiscal year ended December 31, 2016
OR
☐ TRANSITION REPORT PURSUANT TO SECTION 13 OR 15(d) OF THE SECURITIES EXCHANGE ACT OF 1934
Commission file number 001-33607
GulfMark Offshore, Inc.
(Exact name of registrant as specified in its charter)
|
Delaware |
76-0526032 |
|
(State or other jurisdiction of |
(I.R.S. Employer Identification No.) |
|
incorporation or organization) |
|
|
842 West Sam Houston Parkway North, Suite 400 |
|
|
Houston, Texas |
77024 |
|
(Address of principal executive offices) |
(Zip Code) |
Registrant’s telephone number, including area code: (713) 963-9522
Securities registered pursuant to Section 12(b) of the Act:
Class A Common Stock, $0.01 par value New York Stock Exchange
(Title of each class) (Name of each exchange on which registered)
Securities registered pursuant to Section 12(g) of the Act: None
Indicate by check mark if the registrant is a well-known seasoned issuer, as defined in Rule 405 of the Securities Act. Yes ☐ No ☑
Indicate by check mark if the registrant is not required to file reports pursuant to Section 13 or Section 15(d) of the Act. Yes ☐ No ☑
Indicate by check mark whether the registrant (1) has filed all reports required to be filed by Section 13 or 15(d) of the Securities Exchange Act of 1934 during the preceding 12 months (or for such shorter period that the registrant was required to file such reports), and (2) has been subject to such filings requirements for the past 90 days. Yes ☑ No ☐
Indicate by check mark whether the registrant has submitted electronically and posted on its corporate Website, if any, every Interactive Data File required to be submitted and posted pursuant to Rule 405 of Regulation S-T (§232.405 of this chapter) during the preceding 12 months (or for such shorter period that the registrant was required to submit and post such files). Yes ☑ No ☐
Indicate by check mark if disclosure of delinquent filers pursuant to Item 405 of Regulation in S-K (§229.405 of this chapter) is not contained herein, and will not be contained, to the best of the registrant’s knowledge, in definitive proxy or information statements incorporated by reference in Part III of this Form 10-K or any amendment to this Form 10-K. ☑
Indicate by check mark whether the registrant is a large accelerated filer, an accelerated filer, a non-accelerated filer, or a smaller reporting company. See definition of “large accelerated filer”, “accelerated filer” and “smaller reporting company” in Rule 12b-2 of the Exchange Act.
Large accelerated filer ☐ Accelerated filer ☑
Non-accelerated filer ☐ (Do not check if a smaller reporting company) Smaller reporting company ☐
Indicate by check mark whether the registrant is a shell company (as defined in Rule 12b-2 of the Act). Yes ☐ No ☑
The aggregate market value of the voting and non-voting common equity held by non-affiliates of the registrant as of June 30, 2016, the last business day of the registrant’s most recently completed second fiscal quarter was $61,768,744 calculated by reference to the closing price of $3.13 for the registrant’s common stock on the New York Stock Exchange on that date.
Number of shares of Class A common stock outstanding as of March 15, 2017: 27,147,009
DOCUMENTS INCORPORATED BY REFERENCE
The information called for by Part III, Items 10, 11, 12, 13 and 14 of this Form 10-K, will be included in a
definitive proxy statement or an amendment to this Form 10-K to be filed within 120 days after the end of
the fiscal year covered by this Form 10-K, and is incorporated herein by reference.
TABLE OF CONTENTS
|
Page | ||
|
PART I |
||
|
Item 1. |
Business |
5 |
|
General Business |
5 | |
|
Worldwide Fleet |
6 | |
|
Operating Segments |
11 | |
|
Other |
14 | |
|
Item 1A. |
Risk Factors |
18 |
|
Item 1B. |
Unresolved Staff Comments |
34 |
|
Item 2. |
Properties |
34 |
|
Item 3. |
Legal Proceedings |
34 |
|
Item 4. |
Mine Safety Disclosures |
35 |
|
PART II |
||
|
Item 5. |
Market for Registrant’s Common Equity, Related Stockholder Matters and Issuer Purchases of Equity Securities |
35 |
|
Item 6. |
Selected Financial Data |
38 |
|
Item 7. |
Management’s Discussion and Analysis of Financial Condition and Results of Operations |
40 |
|
Item 7A. |
Quantitative and Qualitative Disclosures about Market Risk |
59 |
|
Item 8. |
Financial Statements and Supplementary Data |
61 |
|
Item 9. |
Changes in and Disagreements with Accountants on Accounting and Financial Disclosure |
90 |
|
Item 9A. |
Controls and Procedures |
90 |
|
Item 9B. |
Other Information |
90 |
|
PART III |
||
|
Item 10. |
Directors, Executive Officers and Corporate Governance |
91 |
|
Item 11. |
Executive Compensation |
91 |
|
Item 12. |
Security Ownership of Certain Beneficial Owners and Management and Related Stockholder Matters |
91 |
|
Item 13. |
Certain Relationships and Related Transactions, and Director Independence |
91 |
|
Item 14. |
Principal Accountant Fees and Services |
91 |
|
PART IV |
||
|
Item 15. |
Exhibits and Financial Statement Schedules |
91 |
|
Item 16. |
Form 10-K Summary |
91 |
Forward-Looking Statements
This Annual Report on Form 10-K, particularly in Part I, Item 1 “Business” and Part II, Item 7 “Management’s Discussion and Analysis of Financial Condition and Results of Operations,” contains certain forward-looking statements within the meaning of Section 27A of the Securities Act of 1933, as amended, or the Securities Act, and Section 21E of the Securities Exchange Act of 1934, as amended, or the Exchange Act. All statements other than statements of historical fact are, or may be deemed to be, forward-looking statements. Forward-looking statements include, without limitation, any statement that may project, indicate or imply future results, events, performance or achievements, and may contain or be identified by the words “expect,” “intend,” “plan,” “predict,” “anticipate,” “estimate,” “believe,” “should,” “could,” “may,” “might,” “will,” “project,” “forecast,” “budget” and similar expressions. In addition, any statement concerning future financial performance (including, without limitation, future revenues, earnings or growth rates), ongoing business strategies or prospects, and possible actions taken by or against us, which may be provided by management, are also forward-looking statements as so defined. Statements made by us in this report that contain forward-looking statements may include, but are not limited to, information concerning our possible or assumed future results of operations and statements about the following subjects:
|
● |
our ability to continue as a going concern; |
|
● |
the potential need to seek bankruptcy protection; |
|
● |
covenant compliance and availability of borrowings under our revolving credit facilities; |
|
● |
financing plans, any potential debt restructuring or refinancing and access to sources of liquidity; |
|
● |
tax planning; |
|
● |
market conditions and the effect of such conditions on our future results of operations; |
|
● |
demand for marine supply and transportation services; |
|
● |
supply of vessels and companies providing services; |
|
● |
future capital expenditures and budgets for capital and other expenditures; |
|
● |
sources and uses of and requirements for financial resources; |
|
● |
market outlook; |
|
● |
operations outside the United States; |
|
● |
contractual obligations; |
|
● |
cash flows and contract backlog; |
|
● |
timing and cost of completion of vessel upgrades, construction projects and other capital projects; |
|
● |
asset impairments and impairment evaluations; |
|
● |
assets held for sale; |
|
● |
business strategy; |
|
● |
growth opportunities; |
|
● |
competitive position; |
|
● |
expected financial position; |
|
● |
interest rate and foreign exchange risk; |
|
● |
debt levels and the impact of changes in the credit markets and credit ratings for our debt; |
|
● |
timing and duration of required regulatory inspections for our vessels; |
|
● |
plans and objectives of management; |
|
● |
effective date and performance of contracts; |
|
● |
outcomes of legal proceedings; |
|
● |
compliance with applicable laws; |
|
● |
declaration and payment of dividends; and |
|
● |
availability, limits and adequacy of insurance or indemnification. |
These types of statements are based on current expectations about future events and inherently are subject to certain risks, uncertainties and assumptions, many of which are beyond our control, which could cause actual results to differ materially from those expected, projected or expressed in forward-looking statements. It should be understood that it is not possible to predict or identify all risks, uncertainties and assumptions. These risks, uncertainties and assumptions include, among others, the following:
|
|
● |
the risk factors discussed in Part I, Item 1A “Risk Factors”; |
|
|
● |
operational risk; |
|
|
● |
significant and sustained or additional declines in oil and natural gas prices; |
|
● |
sustained weakening of demand for our services; |
|
● |
general economic and business conditions; |
|
● |
the business opportunities that may be presented to and pursued or rejected by us; |
|
● |
insufficient access to sources of liquidity; |
|
● |
changes in law or regulations including, without limitation, changes in tax laws; |
|
● |
fewer than anticipated deepwater and ultra-deepwater drilling units operating in the Gulf of Mexico, the North Sea, offshore Southeast Asia or in other regions in which we operate; |
|
● |
unanticipated difficulty in effectively competing in or operating in international markets; |
|
● |
the level of fleet additions by us and our competitors that could result in overcapacity in the markets in which we compete; |
|
● |
advances in exploration and development technology; |
|
|
● |
dependence on the oil and natural gas industry; |
|
|
● |
drydocking delays or cost overruns on construction projects or insolvency of shipbuilders; |
|
● |
inability to accurately predict vessel utilization levels and day rates; |
|
|
● |
lack of shipyard or equipment availability; |
|
|
● |
unanticipated customer suspensions, cancellations, rate reductions or non-renewals; |
|
|
● |
uncertainty caused by the ability of customers to cancel some long-term contracts for convenience; |
|
|
● |
further reductions in capital expenditure budgets by customers; |
|
|
● |
ongoing capital expenditure requirements; |
|
● |
uncertainties surrounding deepwater permitting and exploration and development activities; |
|
● |
risks relating to compliance with the Jones Act, including the repeal or administrative weakening of the Jones Act or changes in the interpretation of the Jones Act related to the U.S. citizenship qualification; |
|
● |
uncertainties surrounding environmental and government regulations that could result in reduced exploration and production activities or that could increase our operations costs and operating requirements; |
|
|
● |
catastrophic or adverse sea or weather conditions; |
|
|
● |
risks of foreign operations, risk of war, sabotage, piracy, cyber-attack or terrorism; |
|
|
● |
public health threats; |
|
|
● |
disagreements with our joint venture partners; |
|
|
● |
assumptions concerning competition; |
|
● |
risks relating to leverage including potential difficulty in maintaining compliance with covenants in our material debt or other obligations or in obtaining covenant relief from lenders or other contract parties; |
|
|
● |
risks of currency fluctuations; and |
|
● |
the shortage of or the inability to attract and retain qualified personnel. |
These statements are based on certain assumptions and analyses made by us in light of our experience and perception of historical trends, current conditions, expected future developments and other factors we believe are appropriate under the circumstances. There can be no assurance that we have accurately identified and properly weighed all of the factors that affect market conditions and demand for our vessels, that the information upon which we have relied is accurate or complete, that our analysis of the market and demand for our vessels is correct or that the strategy based on such analysis will be successful.
The risks and uncertainties included here are not exhaustive. Other sections of this report and our other filings with the Securities and Exchange Commission, or SEC, include additional factors that could adversely affect our business, results of operations and financial performance. Given these risks and uncertainties, investors should not place undue reliance on forward-looking statements. Forward-looking statements included in this report are based only on information currently available to us and speak only as of the date of this report. We expressly disclaim any obligation or undertaking to release publicly any updates or revisions to any forward-looking statement to reflect any change in our expectations or beliefs with regard to the statement or any change in events, conditions or circumstances on which any forward-looking statement is based. In addition, in certain places in this report, we may refer to reports published by third parties that purport to describe trends or developments in energy production and drilling and exploration activity. We do so for the convenience of our investors and potential investors and in an effort to provide information available in the market intended to lead to a better understanding of the market environment in which we operate. We specifically disclaim any responsibility for the accuracy and completeness of such information and undertake no obligation to update such information.
PART I
ITEM 1. Business
GENERAL BUSINESS
Our Company
GulfMark Offshore, Inc., a Delaware corporation, was incorporated in 1996. We provide offshore marine support and transportation services primarily to companies involved in the offshore exploration and production of oil and natural gas. Our vessels transport materials, supplies and personnel to offshore facilities, and also move and position drilling and production facilities. The majority of our operations are conducted in the North Sea, offshore Southeast Asia and offshore the Americas. We currently operate a fleet of 69 owned or managed offshore supply vessels, or OSVs, in the following regions: 28 vessels in the North Sea, 10 vessels offshore Southeast Asia, and 31 vessels offshore the Americas. Our fleet is one of the world’s youngest, largest and most geographically balanced, high specification OSV fleets. Our owned vessels have an average age of approximately ten years.
We have three operating segments: the North Sea, Southeast Asia and the Americas. Our chief operating decision maker regularly reviews financial information about each of these operating segments in deciding how to allocate resources and evaluate our performance. Our operations within each of these geographic regions have similar economic characteristics, services, distribution methods and regulatory concerns. All of the operating segments are considered reportable segments under Financial Accounting Standards Board, or FASB, Accounting Standards Codification, or ASC, No. 280, “Segment Reporting,” or ASC 280. For financial information about our operating segments and geographic areas, see “Management’s Discussion and Analysis of Financial Condition and Results of Operations – Segment Results” included in Part II, Item 7, and Note 12 to our Consolidated Financial Statements included in Part II, Item 8.
Unless otherwise indicated, references to “we”, “us”, “our” and the “Company” refer to GulfMark Offshore, Inc., its subsidiaries and its predecessors.
Our principal executive offices are located at 842 West Sam Houston Parkway North, Suite 400, Houston, Texas 77024, and our telephone number at that address is (713) 963-9522. We file annual, quarterly, and current reports, proxy statements and other information with the Securities and Exchange Commission, or SEC. Our SEC filings are available free of charge to the public over the internet on our website at http://www.gulfmark.com and at the SEC’s website at http://www.sec.gov. The information provided on our website is not part of this report and is not incorporated by reference in this report. Filings are available on our website as soon as reasonably practicable after we electronically file them with or furnish them to the SEC. You may also read and copy any document we file at the SEC’s Public Reference Room at 100 F Street, NE, Washington, D.C. 20549. You may obtain information on the operation of the Public Reference Room by calling the SEC at 1-800-SEC-0330.
Offshore Marine Services Industry Overview
We utilize our vessels to provide services to our customers supporting the construction, positioning and ongoing operation of offshore oil and natural gas drilling rigs and platforms and related infrastructure, and substantially all of our revenue is derived from providing these services. The offshore marine services industry employs various types of OSVs that are used to transport materials, supplies and personnel, and to move and position drilling and production facilities. Offshore marine service providers are employed by companies that are engaged in the offshore exploration and production of oil and natural gas and related services. Services provided by companies in this industry are performed in numerous locations worldwide. The major markets that employ a large number of vessels include the North Sea, offshore Southeast Asia, offshore West Africa, offshore the Middle East, offshore Brazil and the Gulf of Mexico. Vessel usage is also significant in other international markets, including offshore India, offshore Australia, offshore Trinidad, the Persian Gulf, the Mediterranean Sea, offshore Russia and offshore East Africa. The industry is fragmented with many multi-national and regional competitors.
Our business is directly impacted by the level of activity in worldwide offshore oil and natural gas exploration, development and production, which in turn is influenced by trends in oil and natural gas prices. In addition, oil and natural gas prices are affected by a host of geopolitical and economic forces, including the fundamental principles of supply and demand. In particular, the oil price is significantly influenced by actions of the Organization of Petroleum Exporting Countries, or OPEC. Beginning in late 2014, the oil and gas industry experienced a significant decline in the price of oil causing an industry-wide downturn that continued into 2017. The decline was in part a result of an OPEC decision to increase production. The price of oil declined significantly from over $100 per barrel in July 2014 to below $30 per barrel in February 2016. The downturn of the last few years has significantly impacted the operational plans for oil companies, resulting in reduced expenditures for exploration and production activities, and consequently has adversely affected the drilling and support service sector. These changes in industry dynamics decreased demand for OSV services and led to an excess number of vessels in all of our operating regions. Although OPEC met in November 2016 and agreed to limit production going forward, day rates have not recovered. In many regions, day rates for OSV services have fallen below the levels needed to sustain our business. Assuming the industry cost structure remains at current levels, many industry observers believe that sustained oil price levels in excess of $60 per barrel are required to return the OSV business to profitability.
The characteristics and current marketing environment in each operating segment are discussed below in greater detail. Each of the major geographic offshore oil and natural gas production regions has unique characteristics that influence the economics of exploration and production and, consequently, the market demand for vessels in support of these activities. While there is some vessel interchangeability between geographic regions, barriers such as mobilization costs, vessel suitability and cabotage restrict migration of some vessels between regions. This is most notable in the North Sea, where vessel design requirements dictated by the harsh operating environment may restrict relocation of vessels into that market and in the U.S. Gulf of Mexico, where entry into the market is subject to the Jones Act restrictions. Conversely, these same design characteristics make North Sea capable vessels unsuitable for other areas where draft restrictions and, to a lesser degree, higher operating costs, restrict migration.
WORLDWIDE FLEET
In addition to the vessels we own, we manage vessels for third-party owners, providing support services ranging from chartering assistance to full operational management. Although these managed vessels provide limited direct financial contribution, the added market presence can provide a competitive advantage for the manager. In addition, as a result of the industry downturn, we have removed some vessels from active service (also called stacking) to preserve cash flow. The following table summarizes our overall owned, managed and total fleet changes since December 31, 2015 and our stacked vessels as of March 16, 2017:
|
Owned Vessels |
Managed Vessels |
Total Fleet |
||||||||||
|
December 31, 2015 |
70 | 3 | 73 | |||||||||
|
New-Build Program |
1 | - | 1 | |||||||||
|
Vessel Additions |
- | - | - | |||||||||
|
Vessel Dispositions |
(4 | ) | - | (4 | ) | |||||||
|
December 31, 2016 |
67 | 3 | 70 | |||||||||
|
New-Build Program |
1 | - | 1 | |||||||||
|
Vessel Additions |
- | - | - | |||||||||
|
Vessel Dispositions |
(2 | ) | - | (2 | ) | |||||||
|
March 16, 2017 |
66 | 3 | 69 | |||||||||
|
Stacked vessels |
28 | 2 | 30 | |||||||||
Vessel Classifications
OSVs generally fall into one or more of seven functional classifications derived from their primary or predominant operating characteristics or capabilities. These classifications are not rigid, however, and it is not unusual for a vessel to fit into more than one of the categories. These functional classifications are:
|
● |
Anchor Handling, Towing and Support Vessels, or AHTSs, are used to set anchors for drilling rigs and to tow mobile drilling rigs and equipment from one location to another. In addition, these vessels typically can be used in supply roles when they are not performing anchor handling and towing services. They are characterized by shorter aft decks and special equipment such as towing winches. Vessels of this type with less than 10,000 brake horsepower, or BHP, are referred to as small AHTSs, or SmAHTSs, while AHTSs in excess of 10,000 BHP are referred to as large AHTSs, or LgAHTSs. The most powerful North Sea class AHTSs have up to 25,000 BHP. All of our AHTSs can also function as platform supply vessels. |
|
● |
Platform Supply Vessels, or PSVs, serve drilling and production facilities and support offshore construction and maintenance work. They are differentiated from other OSVs by their cargo handling capabilities, particularly their large capacity and versatility. PSVs utilize space on deck and below deck and are used to transport supplies such as fuel, water, drilling fluids, equipment and provisions. PSVs typically range in size from 150 to 300 feet. Large PSVs, or LgPSVs, generally range from 210 to 300 feet in length, with a few vessels somewhat larger, and are particularly suited for supporting large concentrations of offshore production locations because of their large, clear after deck and below deck capacities. The majority of the LgPSVs we operate function primarily in this classification but are also capable of servicing construction support. |
|
● |
Fast Supply or Crew Vessels, or FSVs or crewboats, transport personnel and cargo to and from production platforms and rigs. Older crewboats (early 1980s build or earlier) are typically 100 to 120 feet in length, and are designed for speed and to transport personnel. Newer crewboat designs are generally larger, 130 to 185 feet in length, and can be longer with greater cargo carrying capacities. Vessels in the larger category are also called fast supply vessels. They are used primarily to transport cargo on a time-sensitive basis. |
|
● |
Specialty Vessels, or SpVs, generally have special features to meet the requirements of specific jobs. The special features can include large deck spaces, high electrical generating capacities, slow controlled speed and varied propulsion thruster configurations, extra berthing facilities and long-range capabilities. These vessels are primarily used to support floating production storing and offloading; diving operations; remotely operated vehicles; survey operations and seismic data gathering; as well as oil recovery, oil spill response and well stimulation. Some of our owned vessels frequently provide specialty functions. |
|
● |
Standby Rescue Vessels perform a safety patrol function for a particular area and are required for all manned locations in the North Sea and in some other locations where oil and natural gas exploitation occurs. These vessels typically remain on station to provide a safety backup to offshore rigs and production facilities and carry special equipment to rescue personnel. They are equipped to provide first aid, shelter and, in some cases, function as support vessels. |
|
● |
Construction Support Vessels are vessels such as pipe-laying barges, diving support vessels or specially designed vessels, such as pipe carriers, used to transport the large cargos of material and supplies required to support the construction and installation of offshore platforms and pipelines. A large number of our LgPSVs also function as pipe carriers. |
|
● |
Utility Vessels are typically 90 to 150 feet in length and are used to provide limited crew transportation, some transportation of oilfield support equipment and, in some locations, standby functions. |
The following table summarizes our owned vessel fleet by classification and by region as of March 16, 2017:
|
Owned Vessels by Classification |
||||||||||||||||||||||||||||
|
AHTS |
PSV |
|||||||||||||||||||||||||||
|
Region |
LgAHTS |
SmAHTS |
LgPSV |
PSV |
FSV |
SpV |
Total |
|||||||||||||||||||||
|
North Sea |
1 | - | 24 | - | - | - | 25 | |||||||||||||||||||||
|
Southeast Asia |
8 | 2 | - | - | - | - | 10 | |||||||||||||||||||||
|
Americas |
2 | 2 | 21 | 4 | 1 | 1 | 31 | |||||||||||||||||||||
| 11 | 4 | 45 | 4 | 1 | 1 | 66 | ||||||||||||||||||||||
Vessel Construction, Acquisitions and Divestitures
During 2016, we sold one older vessel from our North Sea fleet and three vessels from our Southeast Asia fleet for combined proceeds of $6.5 million. The sales of these vessels generated a combined loss on sales of assets of $8.6 million. In March 2017, we sold two of our fast supply vessels and will record a first quarter 2017 combined loss on sales of assets of $5.3 million.
At December 31, 2015, we had two vessels under construction in the U.S. that were significantly delayed. In March 2016, we resolved certain matters under dispute with the shipbuilder and reset the contract schedules so that we would take delivery of the first vessel in mid-2016 and the second vessel in mid-2017, at which time a final payment of $26.0 million would be due. We took delivery of the first of these vessels during the second quarter of 2016. Under the settlement, we can elect not to take delivery of the second vessel and forego the final payment, in which case the shipbuilder will retain the vessel.
We had a vessel under construction in Norway that was scheduled to be completed and delivered during the first quarter of 2016; however, in the fourth quarter of 2015 we amended our contract with the shipbuilder to delay delivery of the vessel until January 2017. Concurrently, in order to delay the payment of a substantial portion of the construction costs, we agreed to pay monthly installments through May 2016 totaling 92.2 million NOK (or approximately $11.0 million) and to pay a final installment on delivery in January 2017 of 195.0 million NOK (or approximately $23.3 million at delivery). We paid such final installment and took delivery of this vessel in January 2017.
|
Vessel Additions Since December 31, 2015 | |||||||
|
Year |
Length |
Month | |||||
| Vessel | Region | Type(1) |
Built |
(feet) |
BHP(2) | DWT(3) |
Delivered |
|
| |||||||
|
Hercules |
Americas |
LgPSV |
2016 |
286 |
10,960 |
5,300 |
Jun-16 |
|
North Barents |
N. Sea |
LgPSV |
2017 |
304 |
11,935 |
4,700 |
Jan-17 |
|
Vessels Disposed of Since December 31, 2015 | |||||||
|
Year |
Length |
Month | |||||
| Vessel | Region | Type(1) |
Built |
(feet) |
BHP(2) | DWT(3) |
Disposed |
|
Highland Spirit |
N. Sea |
SpV |
1998 |
202 |
6,000 |
1,620 |
May-16 |
|
Sea Intrepid |
SEA |
SmAHTS |
2005 |
193 |
5,150 |
1,500 |
Jul-16 |
|
Sea Guardian |
SEA |
SmAHTS |
2006 |
193 |
5,150 |
1,500 |
Jul-16 |
|
Highland Drummer |
SEA |
LgPSV |
1997 |
220 |
5,450 |
3,122 |
Nov-16 |
|
Mako |
Americas |
FSV |
2008 |
181 |
7,200 |
552 |
Mar-17 |
|
Tiger |
Americas |
FSV |
2009 |
181 |
7,200 |
552 |
Mar-17 |
(1) LgPSV - Large Platform Supply Vessel, SpV - Special Purpose Vessel, SmAHTS - Small Anchor Handling Vessel, FSV - Fast Supply Vessel
(2)BHP - Brake Horsepower
(3)DWT - Deadweight Tons
Maintenance of Our Vessels and Drydocking Obligations
In addition to repairs, we are required to make expenditures for the certification and maintenance of our actively marketed vessels, and those expenditures typically increase with the age of the vessels. We have determined that generally we will not maintain stacked vessels in class until they are likely to achieve positive cash flow in a return to market. However, we will determine the need to perform drydocks in some circumstances such as the ability to easily maintain class or a potential sale. The deferred drydocks will eventually be required prior to returning the vessels to active service. The demands of the market, management judgment as to which vessels to market and which vessels to stack, the expiration of existing contracts, the commencement of new contracts, and customer preferences influence the timing of drydocks. Our drydocking expenditures for 11 drydocks in 2016 totaled $4.7 million. Future drydock costs will depend on vessel activity and vessel class requirements.
Vessel Listing
Currently, we operate a fleet of 69 vessels. The 66 vessels that we own are listed in the table below (which excludes the three vessels we manage for other owners):
|
Owned Vessel Fleet | |||||||
|
Year |
Length |
||||||
| Vessel | Region | Type(1) |
Built |
(feet) |
BHP(2) | DWT (3) |
Flag |
|
Highland Challenger |
N. Sea |
LgPSV |
1997 |
220 |
5,450 |
3,115 |
UK |
|
Highland Rover |
N. Sea |
LgPSV |
1998 |
236 |
5,450 |
3,200 |
Malta |
|
North Stream |
N. Sea |
LgPSV |
1998 |
276 |
9,600 |
4,585 |
Norway |
|
Highland Fortress |
N. Sea |
LgPSV |
2001 |
236 |
5,450 |
3,200 |
Malta |
|
Highland Bugler |
N. Sea |
LgPSV |
2002 |
220 |
5,450 |
2,986 |
UK |
|
Highland Navigator |
N. Sea |
LgPSV |
2002 |
276 |
9,600 |
4,510 |
Malta |
|
North Mariner |
N. Sea |
LgPSV |
2002 |
276 |
9,600 |
4,400 |
Norway |
|
Highland Courage |
N. Sea |
LgAHTS |
2002 |
262 |
16,320 |
2,750 |
Malta |
|
Highland Citadel |
N. Sea |
LgPSV |
2003 |
236 |
5,450 |
3,280 |
UK |
|
Highland Eagle |
N. Sea |
LgPSV |
2003 |
236 |
5,450 |
3,200 |
UK |
|
Highland Monarch |
N. Sea |
LgPSV |
2003 |
220 |
5,450 |
3,000 |
UK |
|
Highland Laird |
N. Sea |
LgPSV |
2006 |
236 |
7,482 |
3,102 |
UK |
|
Highland Prestige |
N. Sea |
LgPSV |
2007 |
284 |
10,767 |
4,993 |
UK |
|
North Promise |
N. Sea |
LgPSV |
2007 |
284 |
10,767 |
4,993 |
Norway |
|
Highland Prince |
N. Sea |
LgPSV |
2009 |
284 |
10,738 |
4,826 |
UK |
|
North Purpose |
N. Sea |
LgPSV |
2010 |
284 |
10,738 |
4,836 |
Norway |
|
Highland Duke |
N. Sea |
LgPSV |
2012 |
246 |
7,482 |
3,121 |
UK |
|
North Pomor |
N. Sea |
LgPSV |
2013 |
304 |
11,465 |
5,000 |
Norway |
|
Highland Defender |
N. Sea |
LgPSV |
2013 |
286 |
9,598 |
5,100 |
UK |
|
Highland Chieftain |
N. Sea |
LgPSV |
2013 |
260 |
9,598 |
4,000 |
UK |
|
Highland Guardian |
N. Sea |
LgPSV |
2013 |
286 |
9,598 |
5,100 |
UK |
|
Highland Knight |
N. Sea |
LgPSV |
2013 |
246 |
7,482 |
3,116 |
UK |
|
North Cruys |
N. Sea |
LgPSV |
2014 |
304 |
11,465 |
5,000 |
Norway |
|
Highland Princess |
N. Sea |
LgPSV |
2014 |
246 |
7,482 |
3,081 |
UK |
|
North Barents |
N. Sea |
LgPSV |
2017 |
304 |
11,935 |
4,700 |
Norway |
|
Sea Sovereign |
SEA |
SmAHTS |
2006 |
230 |
5,500 |
1,875 |
Panama |
|
Sea Cheyenne |
SEA |
LgAHTS |
2007 |
250 |
10,760 |
2,700 |
Malaysia |
|
Sea Supporter |
SEA |
SmAHTS |
2007 |
230 |
7,954 |
2,605 |
Panama |
|
Sea Apache |
SEA |
LgAHTS |
2008 |
250 |
10,760 |
2,700 |
Panama |
|
Sea Choctaw |
SEA |
LgAHTS |
2008 |
250 |
10,760 |
2,700 |
Malaysia |
|
Sea Kiowa |
SEA |
LgAHTS |
2008 |
250 |
10,760 |
2,700 |
Panama |
|
Sea Cherokee |
SEA |
LgAHTS |
2009 |
250 |
10,700 |
2,700 |
Panama |
|
Sea Comanche |
SEA |
LgAHTS |
2009 |
250 |
10,760 |
2,700 |
Panama |
|
Sea Valiant |
SEA |
LgAHTS |
2010 |
230 |
10,000 |
2,058 |
Malaysia |
|
Sea Victor |
SEA |
LgAHTS |
2010 |
230 |
10,000 |
2,058 |
Malaysia |
|
Owned Vessel Fleet | |||||||
|
Year |
Length |
||||||
| Vessel | Region | Type(1) |
Built |
(feet) |
BHP (2) | DWT (3) |
Flag |
|
Highland Scout |
Americas |
LgPSV |
1999 |
218 |
4,640 |
2,800 |
Panama |
|
Austral Abrolhos |
Americas |
SpV |
2004 |
215 |
7,100 |
2,000 |
Brazil |
|
Highland Valour |
Americas |
LgAHTS |
2003 |
262 |
16,320 |
2,750 |
Malta |
|
Highland Endurance |
Americas |
LgAHTS |
2003 |
262 |
16,320 |
2,750 |
UK |
|
Orleans |
Americas |
LgPSV |
2004 |
252 |
6,342 |
2,929 |
USA |
|
Bourbon |
Americas |
LgPSV |
2004 |
252 |
6,342 |
2,929 |
USA |
|
Royal |
Americas |
LgPSV |
2004 |
252 |
6,342 |
2,929 |
USA |
|
Chartres |
Americas |
LgPSV |
2004 |
252 |
6,342 |
2,929 |
Mexico |
|
Iberville |
Americas |
LgPSV |
2005 |
252 |
6,342 |
2,929 |
USA |
|
Coloso |
Americas |
SmAHTS |
2005 |
199 |
5,916 |
1,645 |
Mexico |
|
Titan |
Americas |
SmAHTS |
2005 |
199 |
5,916 |
1,645 |
Mexico |
|
Bienville |
Americas |
LgPSV |
2005 |
210 |
6,342 |
2,374 |
USA |
|
Conti |
Americas |
LgPSV |
2005 |
210 |
6,342 |
2,374 |
USA |
|
St. Louis |
Americas |
LgPSV |
2005 |
252 |
6,342 |
2,929 |
USA |
|
Toulouse |
Americas |
LgPSV |
2004 |
252 |
6,342 |
2,929 |
USA |
|
Esplanade |
Americas |
LgPSV |
2005 |
252 |
6,342 |
2,929 |
USA |
|
First and Ten |
Americas |
PSV |
2007 |
190 |
3,894 |
1,686 |
USA |
|
Double Eagle |
Americas |
PSV |
2007 |
190 |
3,894 |
1,686 |
USA |
|
Triple Play |
Americas |
PSV |
2007 |
190 |
3,894 |
1,686 |
USA |
|
Grand Slam |
Americas |
LgPSV |
2008 |
224 |
3,894 |
2,129 |
USA |
|
Slam Dunk |
Americas |
LgPSV |
2008 |
224 |
3,894 |
2,129 |
USA |
|
Touchdown |
Americas |
LgPSV |
2008 |
224 |
3,894 |
2,129 |
USA |
|
Hat Trick |
Americas |
PSV |
2008 |
190 |
3,894 |
1,686 |
USA |
|
Jermaine Gibson |
Americas |
LgPSV |
2008 |
224 |
3,894 |
2,129 |
USA |
|
Homerun |
Americas |
LgPSV |
2008 |
224 |
3,894 |
2,129 |
USA |
|
Knockout |
Americas |
LgPSV |
2008 |
224 |
3,894 |
2,129 |
USA |
|
Hammerhead |
Americas |
FSV |
2008 |
181 |
7,200 |
552 |
USA |
|
Thomas Wainwright |
Americas |
LgPSV |
2010 |
242 |
4,200 |
2,448 |
USA |
|
Polaris |
Americas |
LgPSV |
2014 |
272 |
9,849 |
3,523 |
USA |
|
Regulus |
Americas |
LgPSV |
2015 |
272 |
9,849 |
3,523 |
USA |
|
Hercules |
Americas |
LgPSV |
2016 |
286 |
10,960 |
5,300 |
USA |
|
(1) |
Legend: LgPSV — Large platform supply vessel |
|
(2) |
Brake horsepower |
|
(3) |
Deadweight tons |
OPERATING SEGMENTS
The North Sea Operating Segment
|
Owned Vessels |
Managed Vessels |
Total Fleet |
||||||||||
|
December 31, 2015 |
27 | 3 | 30 | |||||||||
|
New-Build Program |
- | - | - | |||||||||
|
Vessel Additions |
- | - | - | |||||||||
|
Vessel Transfers |
(2 | ) | - | (2 | ) | |||||||
|
Vessel Dispositions |
(1 | ) | - | (1 | ) | |||||||
|
December 31, 2016 |
24 | 3 | 27 | |||||||||
|
New-Build Program |
1 | - | 1 | |||||||||
|
Vessel Additions |
- | - | - | |||||||||
|
Vessel Dispositions |
- | - | - | |||||||||
|
March 16, 2017 |
25 | 3 | 28 | |||||||||
|
Stacked Vessels |
8 | 2 | 10 | |||||||||
Market and Segment Overview
We define the North Sea market as offshore Norway, Great Britain, the Netherlands, Denmark, Germany, Ireland, the Faeroe Islands, Greenland and the Barents Sea. Historically, this market has been the most demanding of all exploration frontiers due to harsh weather, erratic sea conditions, significant water depth and some long sailing distances. Exploration and production operators in the North Sea market have typically been large and well-capitalized entities (major and state-owned oil and natural gas companies and large independents) in large part because of the significant financial commitment required. Projects in the North Sea tend to be large in scope with long planning horizons. As a result, vessel demand in the North Sea has historically been more stable and less susceptible to abrupt swings than in other regions.
The North Sea market can be broadly divided into three service segments: exploration support; production platform support; and field development and construction (which includes subsea services). The exploration support services market represents the primary demand for AHTSs and has historically been the most volatile segment of the North Sea market. While PSVs support the exploration segment, they also support the production platform and field development and construction segments, which generally are not affected significantly by the volatility in demand for the AHTSs. Our North Sea-based fleet is oriented toward supply vessels that work production platform support and field development and construction which are the more stable segments of the market.
Unless deployed to one of our other operating segments under long-term contract, vessels based in the North Sea but operating temporarily out of the region are included in our North Sea operating segment statistics, and all vessels based out of the region are supported through our onshore bases in Aberdeen, Scotland and Sandnes, Norway. The region typically has weaker periods of demand for vessels in the winter months of December through February primarily due to lower construction activity and harsh weather conditions affecting the movement of drilling rigs.
Market Development
Vessel demand in the North Sea is directly related to drilling and development activities in the region and construction work required in support of these activities. Geopolitical events, the demand for oil and natural gas in both mature and emerging countries, commodity prices and a host of other factors influence the expenditures of both independent and major oil and gas companies.
Exploration and development spending in the North Sea continued to decrease in 2016, as operators reacted to the decline in commodity prices. Continued depressed commodity pricing through 2016 and future commodity price uncertainty have put long-term planning and significant commitments to future spending on hold as operators focus on cost savings, efficiencies and cash preservation. See “Management’s Discussion and Analysis of Financial Condition and Results of Operations – Markets – North Sea” included in Part II, Item 7.
The Southeast Asia Operating Segment
|
Owned Vessels |
Managed Vessels |
Total Fleet |
||||||||||
|
December 31, 2015 |
13 | - | 13 | |||||||||
|
New-Build Program |
- | - | - | |||||||||
|
Vessel Additions |
- | - | - | |||||||||
|
Vessel Dispositions |
(3 | ) | - | (3 | ) | |||||||
|
December 31, 2016 |
10 | - | 10 | |||||||||
|
New-Build Program |
- | - | - | |||||||||
|
Vessel Additions |
- | - | - | |||||||||
|
Vessel Dispositions |
- | - | - | |||||||||
|
March 16, 2017 |
10 | - | 10 | |||||||||
|
Stacked Vessels |
3 | - | 3 | |||||||||
Market and Segment Overview
The Southeast Asia market is defined as offshore Asia bounded roughly on the west by the Indian subcontinent and on the north by China, then south to Australia and east to the Pacific Islands. This market includes offshore Brunei, Indonesia, Malaysia, Myanmar, the Philippines, Thailand, Australia, New Zealand, Bangladesh, Timor-Leste, Papua New Guinea and Vietnam. Traditionally, the design requirements for vessels in this market were generally similar to the requirements of the shallow water U.S. Gulf of Mexico. However, advanced exploration technology and rapid growth in energy demand among many Pacific Rim countries have led to more remote drilling locations, which has increased both the overall demand and the technical requirements for vessels. All vessels based out of the region are supported through our primary onshore base in Singapore.
Southeast Asia’s customer environment is broadly characterized by national oil companies of smaller nations and a large number of mid-sized companies, in contrast to many of the other major offshore exploration and production areas of the world, where a few large operators dominate the market. Affiliations with local companies are generally necessary to maintain a viable marketing presence. Our management has been involved in the region for many years and we currently maintain long-standing business relationships with a number of local companies.
Market Development
Vessels in this market are often smaller than those operating in areas such as the North Sea. However, the varying weather conditions, annual monsoons, severe typhoons and long distances between supply centers in Southeast Asia have allowed for a variety of vessel designs to compete, each suited for a particular set of operating parameters. Vessels designed for the U.S. Gulf of Mexico and other areas, where moderate weather conditions prevail, historically made up the bulk of the vessels in the Southeast Asia market. However, over the last several years Southeast Asian and Chinese shipyards have been focusing on larger, newer and higher specification vessels for deepwater projects and inclusion in the larger vessel fleet.
Changes in supply and demand dynamics have led to an excess number of vessels. It is possible that vessels currently located in the Arabian/Persian Gulf area, offshore Africa or the U.S. Gulf of Mexico could relocate to the Southeast Asia market; however, not all vessels currently located in those regions would be able to operate in Southeast Asia and oil and natural gas operators in this region are continuing to demand newer, higher specification vessels. Some countries have specified age limitations for vessels to operate in territorial waters, which limitations could adversely affect our ability to work in those markets. In addition, speculative building at Southeast Asian and Chinese yards as described above has led to a significant overhang of new build vessels, particularly in the mid-size PSV class and smaller AHTSs. Southeast Asia is a dynamic market and from time to time certain types of vessels may be subject to more intense competition. See “Management’s Discussion and Analysis of Financial Condition and Results of Operations – Markets – Southeast Asia” included in Part II, Item 7.
The Americas Operating Segment
|
Owned Vessels |
Managed Vessels |
Total Fleet |
||||||||||
|
December 31, 2015 |
30 | - | 30 | |||||||||
|
New-Build Program |
1 | - | 1 | |||||||||
|
Vessel Additions |
- | - | - | |||||||||
|
Vessel Transfers |
2 | - | 2 | |||||||||
|
Vessel Dispositions |
- | - | - | |||||||||
|
December 31, 2016 |
33 | - | 33 | |||||||||
|
New-Build Program |
- | - | - | |||||||||
|
Vessel Additions |
- | - | - | |||||||||
|
Vessel Dispositions |
(2 | ) | - | (2 | ) | |||||||
|
March 16, 2017 |
31 | - | 31 | |||||||||
|
Stacked Vessels |
17 | - | 17 | |||||||||
Market and Segment Overview
We define the Americas market as offshore North, Central and South America, specifically including the United States, Mexico, Trinidad and Brazil. All vessels based in the Americas are supported from our onshore bases in the United States, Mexico, Trinidad, and Brazil. During 2016, due to the continued decline in the commodities market and the resulting negative impact on demand for OSVs, we experienced further significant downward pressure on our utilization and day rates in all areas in which we operate. In response, we have taken a number of our vessels out of active service (and stacked them) to reduce operating expenses, preserve cash through deferred drydockings and improve the supply/demand balance in the market. We had 22 vessels stacked in the Americas at the end of 2016. See “Management’s Discussion and Analysis of Financial Condition and Results of Operations – Markets – Americas” included in Part II, Item 7.
Market Development
U.S. Gulf of Mexico
Drilling in the U.S. Gulf of Mexico can be divided into three sectors: the shallow waters of the continental shelf, the deepwater and the ultra-deepwater areas. The continental shelf has been explored since the late 1940s and the existing infrastructure and knowledge of this sector allows for incremental drilling costs to be on the lower end of the range of worldwide offshore drilling costs. A surge of deepwater drilling in this sector began in the 1990s as advances in technology made this type of drilling economically feasible. Deepwater and ultra-deepwater drilling is on the higher end of the cost range, and the substantial costs and long lead times required in these types of drilling historically have made it less susceptible to short-term fluctuations in the price of crude oil and natural gas, although all offshore drilling sectors have been dramatically impacted by the current market downturn. We do not expect significant recovery in deepwater or ultra-deepwater drilling until there is some stability in oil prices for several consecutive quarters. Most of our active vessels operate in the deepwater and ultra-deepwater areas of the U.S. Gulf of Mexico.
At the end of 2016, industry reports indicate that there were 32 “floater” rigs (semi-submersibles and drillships) supporting deepwater drilling in the U.S. Gulf of Mexico with 24 in working locations. According to the U.S. Energy Information Administration, Gulf of Mexico federal offshore oil production accounts for 17% of total U.S. crude oil production.
In general, the U.S. Gulf of Mexico remains a protected market. United States law requires that all vessels engaged in Coastwise Trade in the U.S. (which includes vessels servicing rigs and platforms in U.S. waters within the Exclusive Economic Zone), must be owned and managed by U.S. citizens, and be built in and registered under the laws of the United States. “Coastwise Trade”, as defined under the U.S. maritime and vessel documentation laws commonly referred to as the Jones Act, allows only those vessels that are owned and managed by U.S. citizens (as determined by those laws) and built in and registered under the laws of the United States to transport merchandise and passengers for hire between points in U.S. territorial waters.
We are currently actively marketing 11 DP-2 class OSVs in the U.S. Gulf of Mexico. These vessels support the shelf, deepwater and ultra-deepwater activities of the oil and gas industry including, but not limited to, seismic operations, oil and gas exploration, field development, production, offshore pipeline inspection and survey, subsea installation and oil recovery activities. We believe that drilling operators in the Gulf of Mexico generally prefer DP-2 class vessels. All 23 of our U.S. flagged OSVs that are operating in the U.S. Gulf of Mexico are DP-2 class vessels.
Mexico
Since 2005, we have operated Small AHTSs and other OSVs in Mexico. During the past several years, we have from time to time moved various vessels into and out of the area from the U.S. Gulf of Mexico. In December 2013, Mexico’s Congress approved a constitutional reform to allow private investment in Mexico’s energy sector which effectively ended the state controlled (Petroleos Mexicanos) 75-year monopoly on oil and natural gas extraction and production. Mexico’s recent deepwater oil auction was reported to have surpassed expectations with 8 of 10 blocks awarded by the National Hydrocarbons Commission in the Perdido and Salina Basins to some of the world’s top oil and gas companies. We currently operate two vessels offshore Mexico.
Trinidad
Over the past five years we mobilized several vessels between Trinidad and the U.S. Gulf of Mexico and the North Sea. Given recent licensing and exploration activity in nearby locations, including Suriname and Guyana, we anticipate OSVs operating in Trinidad for the foreseeable future. We currently operate two vessels offshore Trinidad.
Brazil
Brazil, which was once considered a key market for stable, long term PSV charters, continues to feel the effects of low oil prices which have resulted in the cancellation or renegotiation of numerous PSV charters as Petróleo Brasileiro S.A. (Petrobras) defers capital expenditures. Also, many Brazilian PSV owners have asserted their rights to challenge foreign flagged vessels on their charters. In 2016, we began to wind down our operations in Brazil, and mobilized all but one vessel out of the region. This Brazilian flagged vessel is currently on bareboat charter in Brazil.
Refer to Note 12 to our Consolidated Financial Statements in Part II, Item 8 for segment and geographical revenue data during our last three fiscal years.
OTHER
Seasonality
Operations in the North Sea are generally at their highest levels from April through August and at their lowest levels from December through February primarily due to lower construction activity and harsh weather conditions during the winter months which reduces the demand for movement of drilling rigs and deliveries to offshore platforms. Vessels operating offshore Southeast Asia are generally at their lowest utilization rates during the monsoon season, which moves across the Asian continent between September and early March. The monsoon season for a specific Southeast Asian location is generally about two months. Activity in the U.S. Gulf of Mexico is often lower during the North Atlantic hurricane season of June through November. Operations in any market may, however, be affected by seasonality often related to unusually long or short construction seasons due to, among other things, abnormal weather conditions, as well as market demand associated with increased or decreased drilling and development activities.
Other Markets
From time to time, we have contracted our vessels outside of our operating segment regions principally on short-term charters offshore Africa and in the Mediterranean region. We look to our core markets for the bulk of our term contracts; however, when the economics of a contract are attractive, or we believe it is strategically advantageous, we may operate our vessels in markets outside of our core regions. The operations of vessels in those markets are generally managed through our offices in the North Sea region.
Customers, Contract Terms and Competition
Our principal customers are major integrated oil and natural gas companies, large independent oil and natural gas exploration and production companies working in international markets, and foreign government-owned or controlled oil and natural gas companies. Additionally, our customers also include companies that provide logistic, construction and other services to such oil and natural gas companies and foreign government organizations. Generally, our contracts are industry standard time charters for periods ranging from a few days or months up to ten years. Contract terms vary and often are similar within geographic regions with certain contracts containing cancellation provisions (in some cases permitting cancellation for any reason including, without limitation, convenience) and others containing non-cancellable provisions except in the case of unsatisfactory performance by the vessel. For the year ended December 31, 2016, no customer accounted for 10% or more of our total consolidated revenue. For the year ended December 31, 2015, we had revenue from BG Group and Anadarko Petroleum Corporation in our North Sea and Americas regions totaling $32.4 million and $31.9 million, respectively, each accounting for 10% or more of our total consolidated revenue. For the year ended December 31, 2014, we had revenue from Anadarko Petroleum Corporation and British Petroleum, or BP, in our Americas and North Sea regions totaling $88.7 million and $50.8 million, respectively, each accounting for 10% or more of our total consolidated revenue.
Contract or charter durations vary from single-day to multi-year in length, based upon many different factors that vary by market. Additionally, there are “evergreen” charters (also known as “life of field” or “forever” charters), and at the other end of the spectrum, there are “spot” charters and “short duration” charters, which can vary from a single voyage to charters of less than six months. Longer duration charters are more common where equipment is not as readily available or specific equipment is required. In the North Sea region, multi-year charters are more common and historically have constituted a significant portion of that market. Term charters in the Southeast Asia region have historically been less common than in the North Sea and generally have terms of less than two years. In addition, charters for vessels in support of floating production are typically life of field or “full production horizon” charters. In the Americas, particularly in the U.S. Gulf of Mexico, charters vary in length from short-term to multi-year periods, many with thirty day cancellation clauses. In Brazil, Mexico and Trinidad contracts are generally multi-year term contracts. As a result of options and frequent renewals, the stated duration of charters may have little correlation with the length of time the vessel is actually contracted to provide services to a particular customer. See “Management’s Discussion and Analysis of Financial Condition and Results of Operations – Fleet Commitments and Backlog” included in Part II, Item 7.
Managed vessels add to the market presence of the manager but provide limited direct financial contribution. Management fees consist of a fixed annual management fee plus a monthly percentage of the charterhire day rate. The manager is typically responsible for disbursement of funds for operating the vessel on behalf of the owner. Currently, we have three vessels under management, all of which are stacked.
Substantially all of our charters are fixed in British Pounds, or GBP; Norwegian Kroner, or NOK; Euros; or U.S. Dollars. We attempt to reduce currency risk by matching each vessel’s contract revenue to the currency in which its operating expenses are incurred.
We have numerous mid-size and large competitors in the North Sea, Southeast Asia and Americas markets, some of which have significantly greater financial resources than we have. We compete principally on the basis of suitability of equipment, price and service. In the Americas region, we benefit from the provisions of the Jones Act which limits vessels that can operate in the U.S. Gulf of Mexico to those with U.S. ownership. Also, in certain foreign countries, preferences given to vessels owned by local companies may be mandated by local law or by national oil companies. We have attempted to mitigate some of the impact of such preferences through affiliations with local companies.
Government and Environmental Regulation
We must comply with extensive government regulation in the form of international conventions, federal, state and local laws and regulations in jurisdictions where our vessels operate and/or are registered. These conventions, laws and regulations govern matters of environmental protection, worker health and safety, vessel and port security, and the manning, construction, ownership and operation of vessels. Our operations are subject to extensive governmental regulation by the United States Coast Guard, the National Transportation Safety Board and the United States Custom and Border Protection, or CBP, and their foreign equivalents, and to regulation by private industry organizations such as the American Bureau of Shipping and Det Norske Veritas. The Coast Guard and the National Transportation Safety Board set safety standards and are authorized to investigate vessel accidents and recommend improved safety standards, while the CBP is authorized to inspect vessels at will. We are also subject to international laws and conventions and the laws of international jurisdictions where we operate. We believe that we are in compliance, in all material respects, with all applicable laws and regulations.
Maritime Regulations
We are subject to the Merchant Marine Act of 1936, which provides that, upon proclamation by the President of the United States of a national emergency or a threat to the security of the national defense, the Secretary of Transportation may requisition or purchase any vessel or other watercraft owned by United States citizens (which includes United States corporations), including vessels under construction in the United States. If one of the vessels in our fleet were purchased or requisitioned by the federal government under this law, we would be entitled to be paid the fair market value of the vessel in the case of a purchase or, in the case of a requisition, the fair market value of charter hire. However, we would not be entitled to be compensated for any consequential damages we suffer as a result of the requisition or purchase of any of our vessels.
Under the Jones Act, the privilege of transporting merchandise or passengers for hire in Coastwise Trade in U.S. territorial waters is restricted to only those Jones Act qualified vessels that are owned and managed by U.S. citizens and are built in and registered under the laws of the United States. A corporation is not considered a U.S. citizen unless:
|
● |
the corporation is organized under the laws of the U.S. or of a state, territory or possession thereof; |
|
● |
the chief executive officer, by whatever title, and the chairman of the board of directors are U.S. citizens; |
|
● |
directors representing not more than a minority of the number of directors of such corporation necessary to constitute a quorum for the transaction of business are non-U.S. citizens; and |
|
● |
at least a majority, or in the case of an endorsement for operating in Coastwise Trade, 75 percent of the ownership and voting power of the shares of the capital stock is owned by, voted by and controlled by U.S. citizens, free from any trust or fiduciary obligations in favor of, or any contract or understanding under which voting power or control may be exercised directly or indirectly on behalf of non-U.S. citizens. |
We are currently a U.S. citizen under these requirements, eligible to engage in Coastwise Trade. If we fail to comply with these U.S. citizen requirements, however, we would likely no longer be considered a U.S. citizen under the applicable laws. Such an event could result in our ineligibility to engage in Coastwise Trade, the imposition of substantial penalties against us, including seizure and forfeiture of our vessels, and the inability to flag our vessels in the United States and maintain a coastwise endorsement, each of which could have a material adverse effect on our financial condition and results of operations.
Environmental Regulations
Our operations are subject to a variety of federal, state, local and international laws and regulations regarding the emission or discharge of materials into the environment or otherwise relating to environmental protection. As some environmental laws impose strict liability for remediation of spills and releases of oil and hazardous substances, we could be subject to liability even if we were not negligent or at fault. These laws and regulations may expose us to liability for the conduct of or conditions caused by others, including charterers.
Numerous governmental authorities, such as the U.S. Environmental Protection Agency, or the EPA, analogous state agencies, and, in certain instances, citizens’ groups, have the power to enforce compliance with these laws and regulations and the permits issued under them. Failure to comply with applicable environmental laws and regulations may result in the imposition of administrative, civil and criminal penalties, revocation of permits, issuance of corrective action orders and suspension or termination of our operations. Environmental laws and regulations may change in ways that substantially increase costs, or impose additional requirements or restrictions which could adversely affect our financial condition and results of operations. We believe that we are in substantial compliance with currently applicable environmental laws and regulations, but failure to comply could have material adverse consequences. Environmental laws and regulations have been subject to frequent changes over the years, and the imposition of more stringent requirements could have a material adverse effect upon our capital expenditures, earnings or competitive position, including the suspension or cessation of operations in affected areas. As such, there can be no assurance that material costs and liabilities related to compliance with environmental laws and regulations will not be incurred in the future.
International Safety Management Code
The International Maritime Organization, or IMO, has made the regulations of the International Safety Management Code, or ISM Code, mandatory through the adoption by flag states of the ISM Code under the International Convention for the Safety of Life at Sea. The ISM Code provides an international standard for the safe management and operation of ships, pollution prevention and certain crew and vessel certifications. IMO has also adopted the International Ship & Port Facility Security Code, or ISPS Code. The ISPS Code provides that owners or operators of certain vessels and facilities must provide security and security plans for their vessels and facilities and obtain appropriate certification of compliance. We believe all of our vessels presently are certificated in accordance with ISPS Code. The risks of incurring substantial compliance costs, liabilities and penalties for non-compliance are inherent in offshore marine operations.
International Labour Organization’s Maritime Labour Convention
The International Labour Organization’s Maritime Labour Convention, 2006, or the Convention, mandates globally, among other things, seafarer living and working conditions (accommodations, wages, conditions of employment, health and other benefits) aboard ships that are engaged in commercial activities. Since its initial entry into force on August 20, 2013, 79 countries have now ratified the Convention, making for a diverse geographic footprint of enforcement.
Accordingly, we continue prioritizing certification of our vessels to Convention requirements based on the dates of enforcement by countries in which we have operations, perform maintenance and repairs at shipyards, or may make port calls during ocean voyages. Once obtained, vessel certifications are maintained, regardless of the area of operation. Additionally, where possible, we continue to work with operationally identified flag states to seek substantial equivalencies to comparable national and industry laws that meet the intent of the Convention, but allow us to maintain our long-standing operational protocols and mitigate changes to our business processes. As ratifications continue, we continue to assess our global seafarer labor relationships and fleet operational practices not only to undertake compliance with the Convention but also to gauge the impact of effective enforcement, the effects of which cannot be reasonably estimated at this time.
MARPOL
The International Convention for the Prevention of Pollution from Ships, 1973, as modified by the Protocol of 1978, or MARPOL, is the main international convention covering prevention of pollution of the marine environment by vessels from operational or accidental causes. It has been updated by amendments through the years and is implemented in the United States by the Act to Prevent Pollution from Ships. MARPOL has six specific annexes; Annex I governs oil pollution, Annex V governs garbage pollution, and Annex VI governs air pollution.
MARPOL Annex VI, which addresses air emissions from vessels, requires the use of low sulfur fuel worldwide in both auxiliary and main propulsion diesel engines on ships. Annex VI also specifies requirements for Emission Control Areas, or ECAs, with stricter limitations on sulfur emissions in these areas. Historically, ships operating in the Baltic Sea ECA, the North Sea/English Channel ECA and the North American ECA were required to use fuel with a sulfur content of no more than 1% or use alternative emission reduction methods rather than the current 3.5% global (non-ECA) limit. Beginning in January 2015, the fuel sulfur content limit in ECAs was reduced to 0.1%. The MARPOL global limit on fuel sulfur content outside of ECAs will be reduced to 0.5% on and after January 2020. We may incur additional compliance costs as part of our efforts to comply with Annex VI and other provisions of MARPOL. In addition, we could face fines and penalties for failure to meet requirements imposed by MARPOL and similar laws related to the operation of our vessels.
The Clean Water Act
The Federal Water Pollution Control Act, or the Clean Water Act, or CWA, imposes strict controls on the discharge of pollutants into the navigable waters of the United States. The CWA also provides for civil, criminal and administrative penalties for any unauthorized discharge of oil or other hazardous substances in reportable quantities and imposes liability for the costs of removal and remediation of an unauthorized discharge. Many states have laws that are analogous to the CWA and also require remediation of accidental releases of petroleum in reportable quantities. Our vessels routinely transport diesel fuel to offshore rigs and platforms and also carry diesel fuel for their own use. We maintain response plans as required by the Clean Water Act to address potential oil and fuel spills from either our vessels or our shore-based facilities.
In addition, the CWA established the National Pollutant Discharge Elimination System, or NPDES, permitting program, which governs discharges of pollutants into navigable waters of the United States from point sources, such as vessels operating in the navigable waters. Pursuant to the NPDES permitting program, the EPA issued a Vessel General Permit, or VGP. Beginning in December 2013, the EPA implemented the Phase II VGP Regime, or 2013 VGP, which covers 27 types of discharges. The 2013 VGP applies to U.S. and foreign-flag commercial vessels that are at least 79 feet in length, and therefore applies to our vessels. The 2013 VGP requires vessel owners and operators to adhere to “best management practices” to manage the covered discharges, including ballast water, which occur normally in the operation of a vessel. In addition, the 2013 VGP requires vessel owners and operators to implement various training, inspection, monitoring, recordkeeping, and reporting requirements, as well as corrective actions upon identification of each deficiency. The purpose of these limitations is to reduce the number of living organisms discharged via ballast water into waters regulated by the 2013 VGP. The 2013 VGP also contains requirements for oil-to-sea interfaces, which seeks to improve environmental protection of U.S. waters, by requiring all vessels to use an Environmentally Acceptable Lubricant in all oil-to-sea interfaces, unless not technically feasible. These regulations may increase the costs of compliance for our operations. In addition, failure to comply with the requirements of the 2013 VGP and other provisions of the CWA could result in the imposition of substantial fines and penalties.
The Oil Pollution Act
The Oil Pollution Act of 1990, or OPA, establishes a comprehensive regulatory and liability regime designed to increase pollution prevention, ensure better spill response capability, increase liability for oil spills, and facilitate prompt compensation for cleanup and damages. OPA is applicable to owners and operators whose vessels trade with the United States or its territories or possessions, or whose vessels operate in the navigable waters of the United States (generally three nautical miles from the coastline) and the 200 nautical mile exclusive economic zone of the United States. Under OPA, vessel owners, operators and bareboat charterers are “responsible parties” and are jointly, severally and strictly liable (unless it is subsequently determined by the Coast Guard or a court of competent jurisdiction that the spill results solely from the act or omission of a third party, an act of God or an act of war) for removal costs and damages arising from discharges or threatened discharges of oil from their vessels up to their limits of liability, unless the limits are broken as described below. “Damages” are defined broadly under OPA to include:
|
● |
natural resources damages and the costs of assessment thereof; |
|
● |
damages for injury to, or economic losses resulting from the destruction of, real or personal property; |
|
● |
the net loss of taxes, royalties, rents, fees and profits by the United States government, and any state or political subdivision thereof; |
|
● |
lost profits or impairment of earning capacity due to property or natural resources damage; |
|
● |
the net costs of providing increased or additional public services necessitated by a spill response, such as protection from fire, safety or other hazards; and |
|
● |
the loss of subsistence use of natural resources. |
OPA, through implementing regulations, currently limits the liability of responsible parties for discharges from non-tank vessels to $1,100 per gross ton or $939,800, whichever is greater. These limits are subject to increase. OPA’s liability limits do not apply: (1) if an incident was proximately caused by violation of applicable federal safety, construction or operating regulations or by a responsible party’s gross negligence or willful misconduct; or (2) if the responsible party fails or refuses to report the incident, fails to provide reasonable cooperation and assistance requested by a responsible official in connection with oil removal activities, or without sufficient cause fails to comply with an order issued under OPA. If an oil discharge or substantial threat of discharge were to occur, we may be liable for costs and damages, which costs and liabilities could be material to our results of operations and financial position.
Hazardous Wastes and Substances
The Comprehensive Environmental Response, Compensation, and Liability Act of 1980, also known as CERCLA or Superfund, and similar laws, impose liability for releases of hazardous substances into the environment. CERCLA currently exempts crude oil from the definition of hazardous substances for purposes of the statute, but our operations may involve the use or handling of other materials that may be classified as hazardous substances. CERCLA assigns strict liability to each responsible party for all response costs, as well as natural resource damages. CERCLA also imposes liability similar to OPA and provides compensation for cleanup, removal and natural resource damages. Liability per vessel under CERCLA is limited to the greater of $300 per gross ton or $5 million, unless the release is the result of willful misconduct or willful negligence, the primary cause of the release was a violation of applicable safety, construction or operating standards or regulations, or the responsible person fails to provide reasonable cooperation and assistance in connection with response activities, in which case liability is unlimited. A responsible person may be liable to the United States for punitive damages up to three times the amount of any costs incurred by the federal Hazardous Substances Superfund as a result of such person’s failure to take proper action. We could be held liable for releases of hazardous substances that resulted from operations by third parties not under our control or for releases associated with practices performed by us or others that were standard in the industry at the time. In addition, it is not uncommon for neighboring landowners and other third parties to file claims for personal injury and property damage allegedly caused by hazardous substances released into the environment.
The Resource Conservation and Recovery Act, or RCRA, regulates the generation, transportation, storage, treatment and disposal of onshore hazardous and non-hazardous wastes and requires states to develop programs to ensure the safe disposal of wastes. We generate non-hazardous wastes and small quantities of hazardous wastes in connection with routine operations. We believe that all of the wastes that we generate are handled in all material respects in compliance with the RCRA and analogous state statutes.
Insurance
We review our insurance coverages annually. In particular, we assess our coverage levels and limits for possible marine liabilities, including pollution, personal injury or death, and property damage. Our most recent review did not result in any substantial adjustments to our coverages or limits.
Litigation
We are not a party to any material pending regulatory litigation or other proceeding and we are unaware of any threatened litigation or proceeding, which, if adversely determined, would have a material adverse effect on our financial condition or results of operations.
Employees
We have approximately 900 employees located principally in the United States, the United Kingdom, Norway and Southeast Asia. Through our contract with a crewing agency, we participate in the negotiation of collective bargaining agreements for approximately 450 contract crew members, approximately half of our labor force, who are members of two North Sea unions. Wages are renegotiated annually in the second half of each year for the North Sea unions. We have no other collective bargaining agreements; however, we do employ crew members who are members of national unions but we do not participate in the negotiation of those collective bargaining agreements. We consider relations with our employees to be satisfactory. To date, our operations have not been interrupted by strikes or work stoppages. In addition, our obligations to our crew members are governed by the International Labour Organization’s Maritime Labour Convention which has been adopted in varying degrees by different flag states. We have adopted proactive procedures to ensure that we comply with or are entitled to an exemption from the Convention.
ITEM 1A. Risk Factors
We operate globally in challenging and highly competitive markets, and our business is subject to a variety of risks, including the risks described below, which could cause our actual results to differ materially from those anticipated, projected or assumed in forward-looking statements. You should carefully consider these risks when evaluating us and our securities. The risks and uncertainties described below are not the only ones facing our company. We are also subject to a variety of risks that affect many other companies generally, as well as additional risks and uncertainties not known to us or that, as of the date of this report, we believe are not as significant as the risks described below. If any of the following risks actually occur, the accuracy of any forward-looking statements made by us, including in this report, and our business, financial condition, results of operations and cash flows, and the trading prices of our securities, may be materially and adversely affected.
As a result of operating losses and negative cash flows from operations and our entry into a 30-day grace period with respect to certain interest payments, together with other factors, including covenant defaults under our revolving credit facilities and the possibility that a covenant default or other event of default could cause certain of our indebtedness to become immediately due and payable, subject to any available cure period, we may not have sufficient liquidity to sustain operations and to continue as a going concern.
We continued to incur significant losses from operations and had negative cash flows from operating activities for the year ended December 31, 2016. We expect to continue to incur losses from operations and generate negative cash flows from our operating activities which could also cause our vendors to require cash prepayment before goods are delivered and services are performed. These expectations and other liquidity risks described in this report raise substantial doubt about whether we will be able to meet our obligations as they become due within one year after the date of this report.
We are highly leveraged and had approximately $483.3 million of debt as of December 31, 2016, including $429.6 million outstanding under our unsecured 6.375% senior notes due 2022, or Senior Notes, $49.0 million outstanding under our secured Multicurrency Facility Agreement described below and $11.2 million outstanding under our secured Norwegian Facility Agreement described below. See Part II, Item 7 “Management’s Discussion and Analysis of Financial Condition and Results of Operations – Liquidity, Capital Resources and Financial Condition – Long-Term Debt.” Our revolving credit facilities and the indenture governing our Senior Notes contain certain financial and other covenants that are more fully described below under Part II, Item 7 “Management’s Discussion and Analysis of Financial Condition and Results of Operations – Liquidity, Capital Resources and Financial Condition – Long-Term Debt” and in Note 6 to our Consolidated Financial Statements included in Part II, Item 8. At December 31, 2016, we had an aggregate of approximately $94.0 million of borrowing capacity, net of standby letters of credit, under our Multicurrency Facility Agreement and Norwegian Facility Agreement and we had approximately $8.8 million of cash on hand.
At December 31, 2016, we were in compliance with all financial covenants set forth in our revolving credit facilities and the indenture governing our Senior Notes; however, we are forecasting that for the quarter ending March 31, 2017, we will no longer be in compliance with the minimum consolidated adjusted EBITDA requirement contained in the Multicurrency Facility Agreement and the Norwegian Facility Agreement. Absent waivers or cures, non-compliance with such covenants would constitute an event of default under the Multicurrency Facility Agreement and the Norwegian Facility Agreement. As a result, all indebtedness under the Multicurrency Facility Agreement and the Norwegian Facility Agreement could be declared immediately due and payable upon the occurrence of such event of default, subject to any available cure periods. It is possible that we could obtain waivers from our lenders; however, our expectations concerning future losses from operations and cash flows and other liquidity risks raise substantial doubt about whether we will be able to meet our obligations as they become due within one year after the date of this report.
We also have not paid the $13.7 million interest payment due March 15, 2017 on our Senior Notes and, as provided for in the indenture governing the Senior Notes, have entered into the 30-day grace period to make such payment. Failure to pay this amount on March 15, 2017 would constitute an event of default under the indenture governing the Senior Notes if the payment is not made within 30 days of such date and would result in a cross-default under the Multicurrency Facility Agreement and the Norwegian Facility Agreement. As a result of these factors and the additional matters discussed below, as well as the continued downturn in the oil and gas industry and the decrease in offshore oil and natural gas exploration activities, among others, there exists substantial doubt whether we will be able to continue as a going concern.
Since December 31, 2016, we have made additional borrowings under our revolving credit facilities and as of March 15, 2017, the amount outstanding under our Multicurrency Facility Agreement had increased to approximately $72.0 million and the amount outstanding under our Norwegian Facility Agreement had increased to approximately $35.0 million. On March 8, 2017, we entered into an agreement with the agent under our Multicurrency Facility Agreement that prohibits us from requesting any additional loans under the Multicurrency Facility Agreement without the prior written consent of the agent (acting upon the instruction of all the lenders following unanimous consent). In this agreement, the lenders agreed to extend additional revolving loans in the aggregate principal amount of $10.0 million, subject to certain conditions precedent, including payment by us of certain fees and retainers of a financial advisor and counsel for the agent, and the lenders agreed to waive any default or event of default (no such default or event of default having been admitted by us) arising by virtue of a borrowing request submitted previously by us, which request was deemed to be withdrawn pursuant to the agreement. The lenders funded loans in such amount on March 8, 2017.
Our consolidated financial statements as of and for the year ended December 31, 2016 have been prepared assuming we will continue as a going concern, which contemplates continuity of operations, realization of assets and the satisfaction of liabilities in the normal course of business for the twelve-month period following the date of the consolidated financial statements. However, for the reasons described herein, indebtedness with the stated maturities as summarized in Note 6 to our Consolidated Financial Statements included in Part II, Item 8 is classified as a current liability at December 31, 2016. The report from our independent registered public accounting firm on our consolidated financial statements for the year ended December 31, 2016 includes an uncertainty paragraph that arises from the substantial doubt about our ability to continue as a going concern.
Our Multicurrency Facility Agreement contains requirements that, among other things, require that we deliver an unqualified audit opinion from our auditors that is not subject to a going concern or like qualification or exception. The failure to deliver such an unqualified opinion constitutes an event of default under the Multicurrency Facility Agreement, which allows the lenders thereunder to cancel their commitments, accelerate the indebtedness thereunder and exercise remedies with respect to the collateral securing the Multicurrency Facility Agreement, the effect of which likewise is to cause a cross-default under our Norwegian Facility Agreement permitting the lenders thereunder to cancel their commitments, accelerate the indebtedness thereunder and exercise remedies with respect to the collateral securing the Norwegian Facility Agreement unless a waiver or forbearance is received from the lenders under the Multicurrency Facility Agreement. If the indebtedness under either the Multicurrency Facility Agreement or the Norwegian Facility Agreement is accelerated, it would, subject to a 15-business day cure period, constitute an event of default under the indenture governing our Senior Notes.
On March 14, 2017, we entered into a support agreement, or Support Agreement, with the agent under the Multicurrency Facility Agreement in which the lenders agreed to waive the existing or anticipated defaults or events of default under the Multicurrency Facility Agreement listed in the Support Agreement and forbear from exercising rights or remedies under the related finance documents as a result therefrom, for a limited support period. The Support Agreement, and the waiver and forbearance provided for therein, terminates upon the earliest to occur of certain termination events described therein or April 14, 2017. See Part II, Item 9B “Other Information” for a more detailed description of the Support Agreement.
If lenders or noteholders accelerate our outstanding indebtedness, our borrowings will become immediately payable and we will not have sufficient liquidity to repay those accelerated amounts. If we are unable to reach an agreement with lenders and noteholders to address any such defaults, we would likely pursue a variety of solutions that may include strategic and refinancing alternatives through a private restructuring of our indebtedness, seeking additional debt or equity financing, assets sales or a filing under Chapter 11 of the U.S. Bankruptcy Code, which could include a restructuring of our various debt obligations.
We are engaged in discussions with our principal lenders and noteholders to waive covenant breaches, including financial covenants and the inclusion of a going concern qualification in the audit opinion from our auditors, and/or to amend the underlying agreements. Any such amendments and/or waivers would require successful negotiations with our bank group and noteholders, and may require us to make certain concessions under the existing agreements, such as providing additional collateral, paying a higher rate of interest or some combination of these or others. Obtaining covenant relief will require us to reach an agreement that satisfies potentially divergent interests of our lenders and noteholders.
The current downturn in the oil and gas industry has had a significant negative effect on our results of operations and revenues, our customers’ ability to pay and our profitability.
Demand for our vessels and services, and therefore our results of operations, are highly dependent on the level of spending and investment in offshore exploration, development and production by the companies that operate in the energy industry. The energy industry’s level of capital spending is directly related to current and expected future demand for hydrocarbons and the prevailing commodity prices of crude oil and, to a lesser extent, natural gas. Hydrocarbon supply has increased at a faster pace than hydrocarbon demand, despite a significant decrease in exploration and development spending. This has resulted in significant declines in crude oil prices. When our customers experience low commodity prices or come to believe that they will be low in the future, they generally reduce their capital spending for offshore drilling, exploration and field development. The precipitous decline in crude oil prices that began in late 2014 and reached a 12-year low of less than $30/barrel in early 2016 has resulted in a decrease in the energy industry’s level of capital spending. Although crude oil prices have improved somewhat from these low levels, if prices decline further or continue to remain depressed for an extended period of time, capital spending and demand for our services may remain similarly depressed. If certain major oil producing nations do not intend to reduce crude oil output the current over-supply environment may continue for the foreseeable future unless there is a significant increase in worldwide demand, which may not occur or may occur very slowly. These market conditions negatively affected our 2016 results and are expected to continue to significantly affect future results, particularly if exploration and production activity levels and, therefore, demand for our products and services, as well as our customers’ ability to pay, remain depressed or continue to decline. The decrease in demand for offshore services could cause the industry to experience a prolonged downturn. These conditions could have a material adverse effect on our business, financial condition and results of operations.
We rely on the oil and natural gas industry, and volatile oil and natural gas prices impact demand for our services.
Demand for our services depends on activity in offshore oil and natural gas exploration, development and production. The level of exploration, development and production activity is affected by factors such as:
|
● |
prevailing oil and natural gas prices; |
|
● |
expectations about future prices and price volatility; |
|
● |
worldwide supply and demand for oil and gas; |
|
● |
the level of economic activity in energy-consuming markets; |
|
● |
the worldwide economic environment, trends in international trade or other economic trends, such as recessions; |
|
● |
the ability of the Organization of Petroleum Exporting Countries (OPEC) to set and maintain production levels and pricing; |
|
● |
the level of production in non-OPEC countries; |
|
● |
international sanctions on oil producing countries and the lifting of certain sanctions against Iran; |
|
● |
civil unrest and the worldwide political and military environment, including uncertainty or instability resulting from an escalation or additional outbreak of armed hostilities involving the Middle East, Russia, other oil-producing regions or other geographic areas or further acts of terrorism in the United States or elsewhere; |
|
● |
cost of exploring for, producing and delivering oil and natural gas; |
|
● |
sale and expiration dates of available offshore leases; |
|
● |
demand for petroleum products; |
|
● |
current availability of oil and natural gas resources; |
|
● |
rate of discovery of new oil and natural gas reserves in offshore areas; |
|
● |
local and international political, environmental and economic conditions; |
|
● |
changes in laws and regulations; |
|
● |
technological advances; |
|
● |
ability of oil and natural gas companies to obtain leases and permits, or obtain funds for capital expenditures; and |
|
● |
development and exploitation of alternative fuels or energy sources. |
An increase in commodity demand and prices will not necessarily result in an immediate increase in offshore drilling activity since our customers’ project development times, reserve replacement needs, expectations of future commodity demand, prices and supply of available competing vessels all combine to affect demand for our vessels. The level of offshore exploration, development and production activity has historically been characterized by volatility, and that volatility is likely to continue. The decline in exploration and development of offshore areas has resulted in a decline in the demand for our offshore marine services and may continue to do so or may worsen. Any such decrease in activity is likely to reduce our day rates and our utilization rates and, therefore, could have a material adverse effect on our financial condition and results of operations.
If we are unable to generate enough cash flow from operations to service our indebtedness or are unable to use future borrowings to fund other capital needs, we may have to undertake alternative financing plans, which may have onerous terms or may be unavailable.
If our business does not generate cash flow from operations in the future that is sufficient to service our outstanding indebtedness and other capital needs, we cannot assure you that future borrowings will be available to us in an amount sufficient to enable us to pay our indebtedness or to fund our other capital needs. If operational performance does not improve significantly and oil companies do not increase spending for exploration and production activities, we expect to need additional sources of liquidity as a result of an inability to generate sufficient cash flow from operations to service our long-term capital needs. We have a substantial amount of indebtedness, and if we do not generate sufficient cash flow from operations in the future to satisfy our debt obligations and other capital needs, we may have to undertake alternative financing plans, such as:
|
● |
refinancing or restructuring all or a portion of our debt; |
|
● |
obtaining alternative financing; |
|
● |
selling assets; |
|
● |
reducing or delaying capital investments; |
|
● |
seeking to raise additional capital; or |
|
● |
revising or delaying our strategic plans. |
We cannot assure you, however, that we would be able to implement alternative financing plans, if necessary, on commercially reasonable terms or at all, or that undertaking alternative financing plans, if necessary, would allow us to meet our debt obligations and capital requirements or that these actions would be permitted under the terms of our various debt instruments. In addition, any effort to implement alternative financing plans would result in diversion of management time and focus away from operating our business and could also result in dilutive issuances of our equity securities or the incurrence of debt, which could adversely affect our business and financial condition.
As previously reported, in November 2016 we launched a proposed recapitalization including, among other things, a tender offer for a minimum of $250 million in aggregate principal amount of our Senior Notes. In connection with the tender offer, we entered into an agreement with two investors to sell such investors 50,000 shares of our Series A convertible preferred stock, par value $0.01 per share, for an aggregate cash purchase price of $50 million in a private placement. The closing of such private placement was conditioned upon a minimum of $250 million in aggregate principal amount of our Senior Notes being tendered by December 31, 2016. This minimum tender condition was not satisfied, and on December 30, 2016, we announced the termination of the tender offer. In January 2017, the investors terminated the proposed private placement. As a result, we were unable to complete the proposed recapitalization. We incurred approximately $11.3 million of expenses in connection with these transactions, including a termination fee which was comprised of $3.0 million in cash and $1.0 million in shares of our Class A common stock, represented by 555,586 shares of Class A common stock.
Our inability to generate sufficient cash flow in the future to satisfy our debt obligations or to obtain alternative financing could materially and adversely affect our business, financial condition, results of operations and prospects. Any failure to make required or scheduled payments of interest and principal on our outstanding indebtedness could harm our ability to incur additional indebtedness on acceptable terms. Further, if for any reason we are unable to satisfy our covenants, debt service or repayment obligations, we would be in default under the terms of the agreements governing such debt, which, if not remedied or waived, would allow our creditors to declare all such outstanding indebtedness to be due and payable (which could in turn trigger cross-acceleration or cross-default rights between the relevant agreements). The lenders under our Multicurrency Facility Agreement and Norwegian Facility Agreement, as applicable, would have the right to terminate their commitments to loan money, and such lenders could foreclose against our assets securing their borrowings, which would have a material adverse effect on our business, financial condition and results of operations, and we could be forced to seek bankruptcy protection to restructure our business and capital structure and may have to liquidate our assets and may receive less than the value at which those assets are carried on our financial statements. If the amounts outstanding under our Multicurrency Facility Agreement or Norwegian Facility Agreement or any of our other indebtedness were to be accelerated, we cannot assure you that our assets would be sufficient at that time to repay in full the money owed to the lenders or to our other debt holders. See “Management’s Discussion and Analysis of Financial Condition and Results of Operations – Liquidity, Capital Resources and Financial Condition – Long-Term Debt” and “– Resources and Liquidity” and Note 2 to our Consolidated Financial Statements in Part II, Item 8. We are in the process of analyzing various strategic alternatives to address our sources of liquidity and capital structure. See “– Our failure to deliver an audit opinion without a going concern qualification results in an event of default under our revolving credit facilities. If we are unable to comply with the covenants in our revolving credit facilities, a default could result in an acceleration of our obligation to repay the funds that we have borrowed at that time which would materially adversely impact our liquidity and would limit our ability to continue as a going concern.”
On March 14, 2017, we entered into the Support Agreement with the agent under the Multicurrency Facility Agreement in which the lenders agreed to waive the existing or anticipated defaults or events of default under the Multicurrency Facility Agreement listed in the Support Agreement and forbear from exercising rights or remedies under the related finance documents as a result therefrom, for a limited support period. The Support Agreement, and the waiver and forbearance provided for therein, terminates upon the earliest to occur of certain termination events described therein or April 14, 2017. See Part II, Item 9B “Other Information” for a more detailed description of the Support Agreement.
We expect to be dependent on our revolving credit facilities for liquidity in 2017; however, our ability to access these facilities is constrained by our failure to comply with the terms thereof. Our ability to borrow under the Multicurrency Facility Agreement requires the consent of the lenders, and any further reduction of the commitments under or the value of the collateral securing our Multicurrency Facility Agreement or Norwegian Facility Agreement could further reduce or eliminate our ability to borrow under the facility and may require us to repay indebtedness under the facility earlier than anticipated, which would materially adversely impact our liquidity and would limit our ability to continue as a going concern.
As a result of our decline in operating revenues and market outlook, we expect to continue to be dependent on our Multicurrency Facility Agreement and Norwegian Facility Agreement for liquidity. Due to low commodity prices and other factors, our ability to access the capital markets has been constrained and if market conditions do not improve and these constraints continue, we will continue to be primarily reliant on our Multicurrency Facility Agreement and Norwegian Facility Agreement, if they are available to us and, to the extent available, the cash provided by operating activities, for liquidity.
At December 31, 2016, there was approximately $35.8 million of available borrowing capacity under the Multicurrency Facility Agreement and approximately $58.2 million of available borrowing capacity under the Norwegian Facility Agreement, in each case subject to the terms and conditions of the applicable facility. Since December 31, 2016, we have made additional borrowings under our revolving credit facilities and as of March 15, 2017, the amount outstanding under our Multicurrency Facility Agreement had increased to approximately $72.0 million and the amount outstanding under our Norwegian Facility Agreement had increased to approximately $35.0 million. In addition, on March 8, 2017, we entered into an agreement with the agent under our Multicurrency Facility Agreement that prohibits us from requesting any additional loans under the Multicurrency Facility Agreement without the prior written consent of the agent (acting upon the instruction of all the lenders following unanimous consent). If we are unable to implement amendments to our existing debt arrangements, a debt restructuring or strategic transaction, our creditors could potentially force us into bankruptcy or we could be forced to seek bankruptcy protection to restructure our business and capital structure, in which case we could be forced to liquidate our assets at potentially depressed valuations and may receive less than the value at which those assets are carried on our financial statements. Even if we are able to implement amendments to existing debt arrangements, a debt restructuring or strategic transaction, such amendments, debt restructuring or strategic transaction may impose onerous terms on us. As a result, any amendments to existing debt arrangements, debt restructuring, strategic transaction or bankruptcy proceeding could place equity holders at significant risk of losing some or all of their interests in our company. See “– Our failure to deliver an audit opinion without a going concern qualification results in an event of default under our revolving credit facilities. If we are unable to comply with the covenants in our revolving credit facilities, a default could result in an acceleration of our obligation to repay the funds that we have borrowed at that time which would materially adversely impact our liquidity and would limit our ability to continue as a going concern” and Part II, Item 7 “Management’s Discussion and Analysis of Financial Condition and Results of Operations – Liquidity, Capital Resources and Financial Condition – Long-Term Debt.”
On March 14, 2017, we entered into the Support Agreement with the agent under the Multicurrency Facility Agreement in which the lenders agreed to waive the existing or anticipated defaults or events of default under the Multicurrency Facility Agreement listed in the Support Agreement and forbear from exercising rights or remedies under the related finance documents as a result therefrom, for a limited support period. The Support Agreement, and the waiver and forbearance provided for therein, terminates upon the earliest to occur of certain termination events described therein or April 14, 2017. See Part II, Item 9B “Other Information” for a more detailed description of the Support Agreement.
Our failure to deliver an audit opinion without a going concern qualification results in an event of default under our revolving credit facilities. If we are unable to comply with the covenants in our revolving credit facilities, a default could result in an acceleration of our obligation to repay the funds that we have borrowed at that time which would materially adversely impact our liquidity and would limit our ability to continue as a going concern.
Our Multicurrency Facility Agreement and Norwegian Facility Agreement include numerous affirmative and negative covenants, including financial covenants that are tested quarterly. Our ability to comply with these covenants can be affected by events beyond our control. Reduced activity levels in the oil and natural gas industry, such as we are currently experiencing, or the absence of substantial improvements in such activity levels could adversely impact our ability to comply with such covenants. Our failure to comply with any such covenant would result in an event of default under the applicable facility, and may result in a cross-default to other indebtedness. On March 8, 2017, we entered into an agreement with the agent under our Multicurrency Facility Agreement in which the lenders agreed to waive any default or event of default (no such default or event of default having been admitted by us) arising by virtue of a borrowing request submitted previously by us, which request was deemed to be withdrawn pursuant to the agreement. The agreement also imposes additional covenants and limitations on us, including prohibiting us from requesting any additional loans under the Multicurrency Facility Agreement without the prior written consent of the agent (acting upon the instruction of all the lenders following unanimous consent). In addition, the report from our independent registered public accounting firm on our consolidated financial statements for the year ended December 31, 2016 includes an uncertainty paragraph that arises from the substantial doubt about our ability to continue as a going concern. Our Multicurrency Facility Agreement contains requirements that, among other things, require that we deliver an unqualified audit opinion from our auditors that is not subject to a going concern or like qualification or exception. The failure to deliver such an unqualified opinion constitutes an event of default under the Multicurrency Facility Agreement, the effect of which likewise is to cause a cross-default under our Norwegian Facility Agreement unless a waiver or forbearance is received from the lenders under the Multicurrency Facility Agreement. If the indebtedness under either the Multicurrency Facility Agreement or the Norwegian Facility Agreement is accelerated, it would, subject to a 15-business day cure period, constitute an event of default under the indenture governing our Senior Notes.
On March 14, 2017, we entered into the Support Agreement with the agent under the Multicurrency Facility Agreement in which the lenders agreed to waive the existing or anticipated defaults or events of default under the Multicurrency Facility Agreement listed in the Support Agreement and forbear from exercising rights or remedies under the related finance documents as a result therefrom, for a limited support period. The Support Agreement, and the waiver and forbearance provided for therein, terminates upon the earliest to occur of certain termination events described therein or April 14, 2017. See Part II, Item 9B “Other Information” for a more detailed description of the Support Agreement.
An event of default further prevents us from borrowing under our revolving credit facilities, which could have a material adverse effect on our available liquidity and would limit our ability to continue as a going concern. In addition, an event of default could result in our having to immediately repay all amounts outstanding under the Multicurrency Facility Agreement, Norwegian Facility Agreement and our Senior Notes and in foreclosure of liens on our assets. See Part II, Item 7 “Management’s Discussion and Analysis of Financial Condition and Results of Operations – Liquidity, Capital Resources and Financial Condition – Long-Term Debt” and “– Resources and Liquidity” and Notes 2 and 6 to our Consolidated Financial Statements in Part II, Item 8.
In addition, the continued downturn in the OSV industry has made it more difficult to meet our financial covenants. If the OSV industry conditions do not improve, we may not be able to be in compliance with the covenants in our Multicurrency Facility Agreement and our Norwegian Facility Agreement that require us to maintain minimum consolidated adjusted EBITDA, and we are forecasting that for the quarter ending March 31, 2017, we will not be in compliance with the minimum consolidated adjusted EBITDA requirement contained in the Multicurrency Facility Agreement and the Norwegian Facility Agreement. See Part II, Item 7 “Management’s Discussion and Analysis of Financial Condition and Results of Operations – Liquidity, Capital Resources and Financial Condition – Long-Term Debt” and “– Resources and Liquidity.” We plan to continue to work with the respective lenders to attempt to negotiate any amendments, waivers or forbearance agreements that may be required for any such non-compliance. There can be no assurance, however, that we would be able to negotiate acceptable terms with the lenders in these circumstances.
In light of the recent and forecasted defaults under our debt instruments, we are in the process of analyzing various strategic alternatives to address our sources of liquidity and capital structure, including strategic and refinancing alternatives through a private restructuring of our indebtedness, seeking additional debt or equity financing, assets sales and a filing under Chapter 11 of the U.S. Bankruptcy Code. Seeking bankruptcy court protection could have a material adverse effect on our business, financial condition, results of operations and liquidity. So long as a proceeding related to a Chapter 11 proceeding continues, our senior management would be required to spend a significant amount of time and effort dealing with the reorganization instead of focusing on our business operations. Bankruptcy court protection also might make it more difficult to retain management and other key personnel necessary to the success and growth of our business. In addition, the longer a proceeding related to a Chapter 11 proceeding continues, the more likely it is that our customers and suppliers could lose confidence in our ability to reorganize our businesses successfully and would seek to establish alternative commercial relationships. There is no certainty that we will be able to implement any such options, and we can provide no assurance that any refinancing or changes in our debt or equity capital structure would be possible or that additional equity or debt financing could be obtained on acceptable terms, if at all.
We have a substantial amount of indebtedness. We may not be able to generate sufficient cash to service all of our indebtedness, including our Senior Notes, and may be forced to take other actions to satisfy our obligations under our indebtedness, which may not be successful.
At December 31, 2016, we had approximately $483.3 million of long-term debt and approximately $23.3 million due on a vessel under construction which was delivered in January upon payment of such amount. Our substantial amount of indebtedness could:
|
● |
increase our vulnerability to general adverse economic and industry conditions; |
|
● |
limit our ability to fund future working capital, capital expenditures and other general corporate financing needs; |
|
● |
require us to dedicate a substantial portion of our cash flow from operations to payments on our indebtedness, thereby reducing the availability of our cash flow to fund working capital, capital expenditures and other general corporate purposes; |
|
● |
limit our flexibility in planning for, or reacting to, changes in our business and the industry in which we operate; |
|
● |
place us at a competitive disadvantage compared to our competitors that have less debt; and |
|
● |
limit or inhibit, along with the financial and other restrictive covenants in our indebtedness, among other things, our ability to borrow additional funds, obtain future financing for debt service or other purposes, or dispose of assets. |
We may not be able to maintain a level of cash flows from operating activities sufficient to permit us to pay the principal, premium, if any, and interest on our indebtedness. If our capital resources are insufficient to fund our debt service obligations, we may be forced to reduce or delay investments and capital expenditures, sell assets, seek additional capital or restructure or refinance our indebtedness. These alternative measures may not be successful and may not permit us to meet our scheduled debt service obligations. Our ability to restructure or refinance our debt will depend on our ability to access the capital markets and our financial position at such time. Any refinancing of our debt could be at higher interest rates and may require us to comply with more onerous covenants, which could further restrict our business operations. In addition, any failure to make payments of interest and principal on our outstanding indebtedness on a timely basis would likely result in a reduction of our credit rating, which could harm our ability to incur additional indebtedness. Moreover, our facilities agreements and the indenture governing our Senior Notes restrict our ability to dispose of assets and use the proceeds from the disposition. We may not be able to consummate those dispositions or to obtain the proceeds that we could realize from them and these proceeds may not be adequate to meet any debt service obligations then due.
As described above, we were unable to complete the proposed recapitalization that we launched in November 2016. An unsuccessful debt restructuring could result in negative publicity or a negative impression of us in the investment community, and could adversely affect our relationships with employees, vendors, creditors and other business partners, could adversely affect the trading price of our Class A common stock and could result in less favorable terms for any alternative means of reducing our debt or improving our liquidity. This could enhance the risk that we may violate financial covenants in our debt instruments. See “If we are unable to generate enough cash flow from operations to service our indebtedness or are unable to use future borrowings to fund other capital needs, we may have to undertake alternative financing plans, which may have onerous terms or may be unavailable.” In addition, as discussed above, we are in the process of analyzing various strategic alternatives to address our sources of liquidity and capital structure, including strategic and refinancing alternatives through a private restructuring of our indebtedness, seeking additional debt or equity financing, assets sales and a filing under Chapter 11 of the U.S. Bankruptcy Code. See “Our failure to deliver an audit opinion without a going concern qualification results in an event of default under our revolving credit facilities. If we are unable to comply with the covenants in our revolving credit facilities, a default could result in an acceleration of our obligation to repay the funds that we have borrowed at that time which would materially adversely impact our liquidity and would limit our ability to continue as a going concern.”
We have high levels of fixed costs that will be incurred regardless of our level of business activity.
Our business has high fixed costs. Downtime or low productivity due to reduced demand, weather interruptions or other causes can have a significant negative effect on our operating results and financial condition. Some of our fixed costs will not decline during periods of reduced revenue or activity, and we may incur additional operating costs for which we are generally reimbursed by the customer when a vessel is under contract. During times of reduced utilization, reductions in costs may not be immediate as we may incur additional costs associated with the stacking of a vessel, or we may not be able to fully reduce the cost of our support operations in a particular geographic region due to the need to support the remaining vessels in that region. A decline in revenue due to lower day rates and/or utilization may not be offset by a corresponding decrease in our fixed costs and could have a material adverse effect on our financial condition, results of operations and cash flows.
We may not be able to renew or replace expiring contracts for our vessels.
We have a number of charters that will expire in 2017 and 2018. Our ability to renew or replace expiring contracts or obtain new contracts, and the terms of any such contracts, will depend on various factors, including market conditions and the specific needs of our customers. Given the highly competitive and historically cyclical nature of our industry, we may not be able to renew or replace the contracts or we may be required to renew or replace expiring contracts or obtain new contracts at rates that are below, and potentially substantially below, existing day rates, or that have terms that are less favorable to us than our existing contracts, or we may be unable to secure contracts for these vessels. This could have a material adverse effect on our financial condition, results of operations and cash flows.
Our industry is highly competitive, which could depress vessel prices and utilization and adversely affect our financial performance.
We operate in a competitive industry. The principal competitive factors in the marine support and transportation services industry include:
|
● |
price, service and reputation of vessel operations and crews; |
|
● |
national flag preference; |
|
● |
operating conditions; |
|
● |
suitability of vessel types; |
|
● |
vessel availability; |
|
● |
technical capabilities of equipment and personnel; |
|
● |
safety and efficiency; |
|
● |
complexity of maintaining logistical support; and |
|
● |
cost of moving equipment from one market to another. |
In addition, an expansion in the supply of vessels in the regions in which we compete, whether through new vessel construction, the refurbishment of older vessels, or the conversion of vessels, could lower charter rates, which could adversely affect our business, financial condition and results of operations. Many of our competitors have substantially greater resources than we have. Competitive bidding and downward pressures on profits and pricing margins could adversely affect our business, financial condition and results of operations.
An increase in the supply of offshore supply vessels would likely have a negative effect on charter rates for our vessels, which could reduce our earnings.
Our industry is highly competitive, with oversupply and intense price competition. Charter rates for marine supply vessels depend in part on the supply of the vessels. We could experience an increased reduction in demand as a result of the current oversupply of vessels. Excess vessel capacity has resulted from:
|
● |
constructing new vessels; |
|
● |
moving vessels from one offshore market area to another; |
|
● |
converting vessels formerly dedicated to services other than offshore marine services; and |
|
● |
declining offshore oil and gas drilling production activities. |
In the past decade, construction of vessels of the types we operate has increased. Significant new OSV construction and upgrades of existing OSVs has intensified price competition. The resulting increases in OSV supply has depressed OSV utilization and intensified price competition from both existing competitors, as well as new entrants into the offshore vessel supply market. As of the date of this report, not all of the vessels currently under construction have been contracted for future work, which may further intensify price competition as scheduled delivery dates occur. Such price competition could further reduce day rates, utilization rates and operating margins, which would adversely affect our financial condition and results of operations.
We may incur additional asset impairments as a result of reduced demand for certain vessels.
The current oversupply of vessels in offshore oil and gas exploration and production markets has resulted in numerous vessels being idled or stacked and in some cases retired or scrapped. We evaluate our long-lived assets for impairment whenever events or changes in circumstances indicate that the carrying amount of such assets may not be recoverable. Impairment write-offs could result if, for example, any of our vessels become obsolete or commercially less desirable or their carrying values become excessive due to the condition of the vessel, stacking the vessel, the expectation of stacking the vessel in the near future, a decision to retire or scrap the vessel, changes in technology, market demand or market expectations, or excess spending over budget on a new-build vessel. Asset impairment evaluations are, by their nature, highly subjective. The use of different estimates and assumptions could result in materially different carrying values of our assets, which could impact the need to record an impairment charge and the amount of any charge taken. See “Management’s Discussion and Analysis of Financial Condition and Results of Operations – Critical Accounting Policies and Estimates – Long-Lived Assets, Goodwill and Intangibles” in Part II, Item 7 and Note 2 to our Consolidated Financial Statements included in Part II, Item 8.
We can provide no assurance that our assumptions and estimates used in our asset impairment evaluations will ultimately be realized or that the current carrying value of our property and equipment, including vessels designated as held for sale, will ultimately be realized.
As the markets recover or we change our marketing strategies or for other reasons, we may be required to incur higher than expected costs to return previously stacked vessels to class.
Stacked vessels are not maintained with the same diligence as our marketed fleet. As a result, and depending on the length of time the vessels are stacked, we may incur costs beyond normal drydock costs to return these vessels to active service. These costs are difficult to estimate and may be substantial.
Government regulation and environmental risks can reduce our business opportunities, increase our costs, and adversely affect the manner or feasibility of doing business.
We and our customers are subject to extensive governmental regulation in the form of international conventions, federal, state and local laws and laws and regulations in jurisdictions where our vessels operate and are registered. The risks of incurring substantial compliance costs, liabilities and penalties for noncompliance are inherent in offshore marine services operations. Compliance with the Jones Act, as well as with environmental, occupational, health and safety, and vessel and port security laws can reduce our business opportunities and increase our costs of doing business. Additionally, these laws change frequently. Therefore, we are unable to predict with certainty the future costs or other future impact of these laws on our operations and our customers. We could also incur substantial costs, including cleanup costs, fines, civil or criminal sanctions and third party claims for property damage or personal injury as a result of violations of, or liabilities under, environmental laws and regulations. In addition, there can be no assurance that we can avoid significant costs, liabilities and penalties imposed on us as a result of government regulation in the future.
We have been adversely affected by a decrease in offshore oil and gas drilling as a result of unconventional crude oil and unconventional natural gas production and the improved economics of producing natural gas and oil from shale.
The rise in production of unconventional crude oil and gas resources in North America and the commissioning of a number of new large liquefied natural gas export facilities around the world are, at least to date, primarily contributing to an over-supplied natural gas market. While production of crude oil and natural gas from unconventional sources is still a relatively small portion of the worldwide crude oil and natural gas production, production from unconventional resources is increasing because improved drilling efficiencies are lowering the costs of extraction. There is an oversupply of natural gas inventories in the United States in part due to the increased development of unconventional crude oil and natural gas resources. Prolonged increases in the worldwide supply of crude oil and natural gas, whether from conventional or unconventional sources, will likely continue to depress crude oil and natural gas prices. Prolonged periods of low natural gas prices have a negative impact on development plans of exploration and production companies, which in turn, results in a decrease in demand for offshore support vessel services. The rise in production of natural gas and oil, particularly from onshore shale, as a result of improved drilling efficiencies that are lowering the costs of extraction, has resulted in a reduction of capital invested in offshore oil and gas exploration. Because we provide vessels servicing offshore oil and gas exploration, the significant reduction in investments in offshore exploration and development has had a material adverse effect on our operations and financial position.
Failure to comply with the Foreign Corrupt Practices Act and similar worldwide anti-bribery laws may have an adverse effect on us.
Our international operations require us to comply with a number of U.S. and international laws and regulations, including those involving anti-bribery and anti-corruption. We do business and may do additional business in the future in countries and regions where strict compliance with anti-bribery laws may not be customary. In order to effectively operate in certain foreign jurisdictions, circumstances may require that we establish joint ventures with local operators or find strategic partners. As a U.S. corporation, we are subject to the regulations imposed by the Foreign Corrupt Practices Act, or FCPA, which generally prohibits U.S. companies and their intermediaries from making improper payments to foreign officials for the purpose of obtaining or keeping business or obtaining an improper business benefit. We have an ongoing program of proactive procedures to promote compliance with the FCPA and other similar anti-bribery and anti-corruption laws, but we may be held liable for actions taken by our strategic or local partners or agents even though these partners or agents may not themselves be subjected to the FCPA or other similar laws. Our personnel and intermediaries, including our local operators and strategic partners, may face, directly or indirectly, corrupt demands by government officials, political parties and officials, tribal or insurgent organizations, or private entities in the countries in which we operate or may operate in the future. As a result, we face the risk that an unauthorized payment or offer of payment could be made by one of our employees or intermediaries, even if such parties are not always subject to our control or are not themselves subject to the FCPA or other similar laws to which we may be subject. Any allegation that we have violated the FCPA or other similar laws or any determination that we have violated the FCPA or other similar laws could have a material adverse effect on our business, results of operations, and cash flows.
We are subject to hazards customary for the operation of vessels that could adversely affect our financial performance if we are not adequately insured or indemnified.
Our operations are subject to various operating hazards and risks, including:
|
● |
catastrophic marine disaster; |
|
● |
adverse sea and weather conditions; |
|
● |
mechanical failure; |
|
● |
navigation errors; |
|
● |
collision; |
|
● |
oil and hazardous substance spills, containment and clean up; |
|
● |
labor shortages and strikes; |
|
● |
damage to and loss of drilling rigs and production facilities; |
|
● |
war, sabotage, piracy, cyber-attack and terrorism risks; and |
|
● |
outbreak of contagious disease. |
These risks present a threat to the safety of our personnel and to our vessels, cargo, equipment under tow and other property, as well as the environment. We could be required to suspend our operations or request that others suspend their operations as a result of these hazards. In such event, we would experience loss of revenue and possibly property damage, and additionally, third parties may make significant claims against us for damages due to personal injury, death, property damage, pollution and loss of business.
We maintain insurance coverage against many of the casualty and liability risks listed above, subject to deductibles and certain exclusions. We have renewed our primary insurance program for the insurance year 2016-2017. We can provide no assurance, however, that our insurance coverage will be available beyond the renewal periods, or that it will be adequate to cover future claims that may arise. Claims covered by insurance are subject to deductibles, the aggregate amount of which could be material. Insurance policies are also subject to compliance with certain conditions, the failure of which could lead to a denial of coverage as to a particular claim or the voiding of a particular insurance policy. There also can be no assurance that existing insurance coverage can be renewed at commercially reasonable rates or that available coverage will be adequate to cover future claims. If a loss occurs that is partially or completely uninsured, we could be exposed to substantial liability that could have a material adverse effect on our financial condition, results of operations and cash flows.
We may not be fully indemnified by our customers for damage to their property or the property of their other contractors. Our contracts are individually negotiated, and the levels of indemnity and allocation of liabilities in them can vary from contract to contract depending on market conditions, particular customer requirements and other factors existing at the time a contract is negotiated. Additionally, the enforceability of indemnification provisions in our contracts may be limited or prohibited by applicable law or may not be enforced by courts having jurisdiction, and we could be held liable for substantial losses or damages and for fines and penalties imposed by regulatory authorities. The indemnification provisions of our contracts may be subject to differing interpretations, and the laws or courts of certain jurisdictions may enforce such provisions while other laws or courts may find them to be unenforceable, void or limited by public policy considerations, including when the cause of the underlying loss or damage is our gross negligence or willful misconduct, when punitive damages are attributable to us or when fines or penalties are imposed directly against us. The law with respect to the enforceability of indemnities varies from jurisdiction to jurisdiction. Current or future litigation in particular jurisdictions, whether or not we are a party, may impact the interpretation and enforceability of indemnification provisions in our contracts. There can be no assurance that our contracts with our customers, suppliers and subcontractors will fully protect us against all hazards and risks inherent in our operations. There can also be no assurance that those parties with contractual obligations to indemnify us will be financially able to do so or will otherwise honor their contractual obligations.
We may not be able to sell vessels to improve our cash flow and liquidity because we may be unable to locate buyers with access to financing or to complete any sales on acceptable terms or within a reasonable timeframe.
We may seek to sell some of our vessels to provide liquidity and cash flow. However, given the current downturn in the oil and gas industry, there may not be sufficient activity in the market to sell our vessels and we may not be able to identify buyers with access to financing or to complete any such sales. Even if we are able to locate appropriate buyers for our vessels, any sales may occur on significantly less favorable terms than the terms that might be available in a more liquid market or at other times in the business cycle.
The early termination of contracts on our vessels could have an adverse effect on our operations and our backlog may not be converted to actual operating results for any future period.
Some of the long-term contracts for our vessels and all contracts with governmental entities and national oil companies contain early termination options in favor of the customer, in some cases permitting termination for any reason. Although some of these contracts have early termination remedies in our favor or other provisions designed to discourage the customers from exercising such options, we cannot assure you that our customers would not choose to exercise their termination rights in spite of such remedies or the threat of litigation with us. Until replacement of such business with other customers, any termination could temporarily disrupt our business or otherwise adversely affect our financial condition and results of operations. We might not be able to replace such business, or replace it on economically equivalent terms. In those circumstances, the amount of backlog could be reduced and the conversion of backlog into revenue could be impaired. Additionally, because of depressed commodity prices, restricted credit markets, economic downturns, changes in priorities or strategy or other factors beyond our control, a customer may no longer want or need a vessel that is currently under contract or may be able to obtain a comparable vessel at a lower rate. For these reasons, customers may seek to renegotiate the terms of our existing contracts, terminate our contracts without justification or repudiate or otherwise fail to perform their obligations under our contracts. In any case, an early termination of a contract may result in our vessel being idle for an extended period of time. Each of these results could have a material adverse effect on our financial condition, results of operations and cash flows.
We may be unable to collect amounts owed to us by our customers.
We typically grant our customers credit on a short-term basis. Related credit risks are inherent as we do not typically collateralize receivables due from customers. We provide estimates for uncollectible accounts based primarily on our judgment using historical losses, current economic conditions and individual evaluations of each customer as evidence supporting the receivables valuations stated on our financial statements. However, our receivables valuation estimates may not be accurate and receivables due from customers reflected in our financial statements may not be collectible. Our inability to perform under our contractual obligations, or our customers’ inability or unwillingness to fulfill their contractual commitments to us, may have a material adverse effect on our financial condition, results of operations and cash flows.
A substantial portion of our revenue is derived from our international operations which are subject to foreign government regulation and operating risks.
We derive a substantial portion of our revenue from foreign sources. We therefore face risks inherent in conducting business internationally, such as:
|
● |
foreign currency exchange fluctuations; |
|
● |
legal and governmental regulatory requirements; |
|
● |
difficulties and costs of staffing and managing international operations; |
|
● |
language and cultural differences; |
|
● |
potential vessel seizure or nationalization of assets; |
|
● |
import-export quotas or other trade barriers; |
|
● |
difficulties in collecting accounts receivable and longer collection periods; |
|
● |
political and economic instability; |
|
● |
changes to shipping tax regimes; |
|
● |
risk arising from counterparty conduct; |
|
● |
imposition of currency exchange controls; and |
|
● |
potentially adverse tax consequences. |
We cannot predict whether any such conditions or events might develop in the future or whether they might have a material effect on our operations. Our ability to compete in international markets may be adversely affected by foreign government regulations, such as regulations that favor or require the awarding of contracts to local competitors, or that require foreign persons to employ citizens of, or purchase supplies from, a particular jurisdiction.
Our subsidiary structure and our operations are in part based on certain assumptions about various foreign and domestic tax laws, currency exchange requirements and capital repatriation laws. While we believe our assumptions are correct, there can be no assurance that taxing or other authorities will reach the same conclusions. If our assumptions are incorrect or if the relevant countries change or modify such laws or the current interpretation of such laws, we may suffer adverse tax and financial consequences, including the reduction of cash flow available to meet required debt service and other obligations.
Due to the continuous evolution of laws and regulations in the various markets in which we operate, we may be restricted or even lose the right to operate in certain international markets where we currently have a presence.
Many of the countries in which we operate have laws, regulations and enforcement systems that are largely undeveloped, and the requirements of these systems are not always readily discernible even to experienced operators. Further, these laws, regulations and enforcement systems can be subject to frequent change or reinterpretation, sometimes with retroactive effect, and taxes, fees, fines or penalties may be sought from us based on that reinterpretation or retroactive effect. While we endeavor to comply with applicable laws and regulations, our compliance efforts might not always be wholly successful, and failure to comply may result in administrative and civil penalties, criminal sanctions, imposition of remedial obligations or the suspension or termination of our operations in the jurisdiction. In addition, laws and regulations could be changed or be interpreted in new, unexpected ways that substantially increase our costs, which we may not be able to pass through to our customers. Any changes in laws, regulations or standards that would impose additional requirements or restrictions could adversely affect our financial condition, results of operations or cash flows.
Our tax expense and effective tax rate on our worldwide earnings could be higher if there are changes in tax legislation in countries where we operate, if we lose our tonnage tax qualifications or tax exemptions, if we increase our operations in high tax jurisdictions where we operate, if there are changes in the mix of income and losses we recognize in tax jurisdictions and/or if we elect to repatriate cash from our foreign operations in amounts higher than recent years.
Our worldwide operations are conducted through our various domestic and foreign subsidiaries and as a result we are subject to income taxes in the United States and foreign jurisdictions. Any material changes in tax laws and related regulations, tax treaties or their interpretations where we have significant operations could result in a higher effective tax rate on our worldwide earnings and a materially higher tax expense.
For example, our North Sea operations based in the U.K. and Norway have special tax incentives for qualified shipping operations, commonly referred to as tonnage tax, which provides for a tax based on the net tonnage capacity of qualified vessels, resulting in significantly lower taxes than those that would apply if we were not a qualified shipping company in those jurisdictions. There is no guarantee that current tonnage tax regimes will not be changed or modified which could, along with any of the above mentioned factors, materially adversely affect our international operations and, consequently, our business, operating results and financial condition. Our U.K. and Norway tonnage tax companies are subject to specific disqualification triggers, which, if we fail to manage them, could jeopardize our qualified tonnage tax status in those countries. Certain of the disqualification events or actions are coupled with one or more opportunities to cure or otherwise maintain the tonnage tax qualification but not all are curable. Our qualified Singapore-based vessels are exempt from Singapore taxation through December 2017, with extensions available in certain circumstances beyond 2017, but there is no assurance that extensions will be granted. The qualified Singapore vessels are also subject to specific qualification requirements which, if not met, could jeopardize our qualified status in Singapore.
In addition, our worldwide operations may change in the future such that the mix of our income and losses recognized in the various jurisdictions could change. Any such changes could reduce our ability to utilize tax benefits, such as foreign tax credits, and could result in an increase in our effective tax rate and tax expense.
Our reported tax expense reflects our intention to permanently reinvest earnings from certain of our foreign operations and therefore those earnings are not subject to U.S. taxation. In the future, we may elect to decrease the portion of annual foreign earnings we intend to permanently reinvest, and, if so, this would increase our overall effective tax rate upward toward the U.S. federal statutory rate, which is currently 35%. If we should change our intention with regard to our prior years’ accumulated unremitted foreign earnings, we would recognize a charge to current earnings to reflect the effect of U.S. taxation on those prior years’ unremitted foreign earnings and that charge could be significant and material.
Our income tax expense, or benefit, and effective tax rate are impacted by inclusion of related U.S. earnings, or losses, taxed at the combined U.S. federal and state tax rates, which are subject to tax law changes. In addition, our tax returns are subject to examination and review by the tax authorities in the jurisdictions in which we operate.
Our international operations and new vessel construction programs are vulnerable to currency exchange rate fluctuations and exchange rate risks.
We are exposed to foreign currency exchange rate fluctuations and exchange rate risks as a result of our foreign operations and when we construct vessels abroad. To minimize the financial impact of these risks, we attempt to match the currency of our debt and operating costs with the currency of the revenue streams. We occasionally enter into forward foreign exchange contracts to hedge specific exposures, which include exposures related to firm contractual commitments in the form of future vessel payments, but we do not speculate in foreign currencies. Because we conduct a large portion of our operations in foreign currencies, any increase in the value of the U.S. Dollar in relation to the value of applicable foreign currencies could adversely affect our operating revenue or construction costs when translated into U.S. Dollars.
Our stock price has been volatile and has declined significantly during the period from the fourth quarter of 2014 through the present, and it could decline further.
The securities markets in general and our Class A common stock in particular have experienced significant price and volume volatility in recent years. The market price and trading volume of our Class A common stock may continue to experience significant fluctuations due not only to general stock market conditions but also to a change in our industry conditions and in the price of crude oil.
If the average closing price of our Class A common stock declines to less than $1.00 over 30 consecutive trading days or we fail to satisfy the minimum market capitalization requirements or other continued listing criteria, our Class A common stock could be delisted from the New York Stock Exchange or trading could be suspended.
Our Class A common stock is listed for trading on the New York Stock Exchange, or NYSE. The listing of our Class A common stock on the NYSE could be suspended or terminated if we fail to attain the NYSE’s quantitative and qualitative continued listing criteria, including if the minimum average closing price of our Class A common stock is less than $1.00 per share for 30 consecutive trading days. Our market capitalization decreased substantially in 2016, and since September 12, 2016, our Class A common stock has generally traded below $2.00 per share. In addition, the NYSE’s continued listing standards provide that a listed company will be considered to be below compliance if its average global market capitalization over a consecutive 30 trading-day period is less than $50 million and, at the same time, stockholders’ equity is less than $50 million. If our average global market capitalization over a consecutive 30 trading-day period were less than $15 million or there were “abnormally low” trading prices or trading volume for shares of our Class A Common Stock, the NYSE would initiate suspension and delisting procedures. Further declines in the trading price of our Class A common stock could cause us to fail to satisfy one or more of the NYSE’s continued listing criteria. As such, we cannot assure you that our Class A common stock will continue to be listed on the NYSE. The delisting of our Class A common stock from the NYSE could result in several adverse consequences, including reduced trading liquidity of our Class A common stock, lower demand for those shares, adverse publicity and a reduced interest in our company from investors, analysts and other market participants. In addition, a suspension or delisting could impair our ability to raise additional capital through equity or debt financing and our ability to attract and retain employees by means of equity compensation.
Doing business through joint venture operations may require us to surrender some control over our assets and may lead to disruptions in our operations and business.
We operate in several foreign areas through joint ventures with local companies, in some cases as a result of local laws requiring local company ownership. While the joint venture partner may provide local knowledge and experience, entering into joint ventures often requires us to surrender a measure of control over the assets and operations devoted to the joint venture, and occasions may arise when we do not agree with the business goals and objectives of our joint venture partner, or other factors may arise that make the continuation of the relationship unwise or untenable. Any such disagreements or discontinuation of the relationship could disrupt our operations, put assets dedicated to the joint venture at risk, or adversely affect the continuity of our business. If we are unable to resolve issues with a joint venture partner, we may decide to terminate the joint venture and either locate a different partner and continue to work in the area or seek opportunities for our assets in another market. The unwinding of an existing joint venture could prove to be difficult or time-consuming, and the loss of revenue related to the termination or unwinding of a joint venture and costs related to the sourcing of a new partner or the mobilization of assets to another market could adversely affect our financial condition, results of operations or cash flows.
Vessel construction, enhancement, repair and drydock projects are subject to risks, including delays, cost overruns, and ship yard insolvencies which could have an adverse impact on our results of operations.
Our vessel construction, enhancement, repair and drydock projects are subject to risks, including delay and cost overruns, inherent in any large construction project, including:
|
● |
shortages of equipment; |
|
● |
unforeseen engineering problems; |
|
● |
work stoppages; |
|
● |
lack of shipyard availability; |
|
● |
weather interference; |
|
● |
unanticipated cost increases; |
|
● |
shortages of materials or skilled labor; and |
|
● |
insolvency of the ship repairer or ship builder. |
Significant cost overruns or delays in connection with our vessel construction, enhancement, repair and drydock projects could adversely affect our financial condition and results of operations. Significant delays could also result, under certain circumstances, in penalties under, or the termination of, long-term contracts under which our vessels operate. The demand for vessels we construct may diminish from anticipated levels, or we may experience difficulty in acquiring new vessels or obtaining equipment to repair our older vessels due to high demand, and both circumstances may have a material adverse effect on our revenues and profitability. Recent global economic issues may increase the risk of insolvency of ship builders and ship repairers, which could adversely affect the cost of new construction and the vessel repairs and could result, under certain circumstances, in penalties under, or termination of, long-term contracts relating to vessels under construction.
The operations of our fleet may be subject to seasonal factors.
Operations in the North Sea are generally at their highest levels during the months from April through August and at their lowest levels from December through February, primarily due to lower construction activity and harsh weather conditions during the winter months affecting the movement of drilling rigs. Vessels operating offshore Southeast Asia are generally at their lowest utilization rates during the monsoon season, which moves across the Asian continent between September and early March. The monsoon season for a specific Southeast Asian location generally lasts about two months. Activity in the U.S. Gulf of Mexico, like the North Sea, is often slower during the winter months when construction projects and other specialized jobs are most difficult, and during the hurricane season from June through November. Operations in any market may be affected by seasonality often related to unusually long or short construction seasons due to, among other things, abnormal weather conditions, as well as market demand associated with changes in drilling and development activities.
We are subject to war, sabotage, piracy, cyber-attacks and terrorism risk.
War, sabotage, pirate, cyber and terrorist attacks or any similar risk may adversely affect our operations in unpredictable ways, including changes in the insurance markets, disruptions of fuel supplies and markets, particularly oil, and the possibility that infrastructure facilities, including pipelines, production facilities, refineries, electric generation, transmission and distribution facilities, offshore rigs and vessels, and communications infrastructures, could be direct targets of, or indirect casualties of, a cyber-attack or an act of piracy or terror. War or risk of war or any such attack may also have an adverse effect on the economy, which could adversely affect activity in offshore oil and natural gas exploration, development and production and the demand for our services. Insurance coverage can be difficult to obtain in areas of pirate and terrorist attacks resulting in increased costs that could continue to increase. We periodically evaluate the need to maintain this insurance coverage as it applies to our fleet. Instability in the financial markets as a result of war, sabotage, piracy, cyber-attacks or terrorism could also adversely affect our ability to raise capital and could also adversely affect the oil, natural gas and power industries and restrict their future growth.
A failure in our operational systems or cyber security attacks on any of our facilities, or those of third parties, may adversely affect our financial results.
Our business is dependent upon our operational systems to process a large amount of data and complex transactions. If any of our financial, operational, or other data processing systems fail or have other significant shortcomings, our financial results could be adversely affected. Our financial results could also be adversely affected if an employee or other third party causes our operational systems to fail, either as a result of inadvertent error or by deliberately tampering with or manipulating our operational systems. In addition, dependence upon automated systems may further increase the risk that operational system flaws, employee or other tampering or manipulation of those systems will result in losses that are difficult to detect.
Due to increasing technological advances, we have become more reliant on technology to help increase efficiency in our business. We use computer programs to help run our financial and operations sectors, and this may subject our business to increased risks. Any cyber security attacks that affect our facilities or operations, our customers or any financial data could have a material adverse effect on our business. In addition, cyber-attacks on our customer and employee data may result in a financial loss and may negatively impact our reputation. Third-party systems on which we rely could also suffer such attacks or operational system failures. Any of these occurrences could disrupt our business, result in potential liability or reputational damage or otherwise have an adverse effect on our business, operations and financial results.
Adverse results of legal proceedings could materially adversely affect us.
We are subject to and may in the future be subject to a variety of legal proceedings and claims that arise out of the ordinary conduct of our business. Results of legal proceedings cannot be predicted with certainty. Irrespective of its merits, litigation may be both lengthy and disruptive to our operations and may require significant expenditures and cause diversion of management attention. We may be faced with significant monetary damages or injunctive relief against us that could materially adversely affect a portion of our business operations or materially and adversely affect our financial position and our results of operations should we fail to prevail in such matters.
Our U.S. flagged vessels may be requisitioned or purchased by the United States in case of national emergency or a threat to security.
We are subject to the Merchant Marine Act of 1936, which provides that, upon proclamation by the President of a national emergency or a threat to the security of the national defense, the Secretary of Transportation may requisition or purchase any vessel or other watercraft owned by United States citizens (which includes United States corporations), including vessels under construction in the United States. If our vessels were purchased or requisitioned by the federal government, we would be entitled to be paid the fair market value of the vessel in the case of a purchase or, in the case of a requisition, the fair market value of charter hire, but we would not be entitled to be compensated for any consequential damages we suffer. The purchase or the requisition for an extended period of time of one or more of our vessels could adversely affect our results of operations and financial condition.
The Maritime Restrictions established to comply with the Jones Act may have an adverse effect on us and our stockholders.
Under our certificate of incorporation, our Class A common stock is subject to certain transfer and ownership restrictions designed to protect our eligibility to engage in Coastwise Trade, including restrictions that limit the maximum permitted percentage of outstanding shares of Class A common stock that may be owned or controlled in the aggregate by non-U.S. citizens to a maximum of 22 percent, which we refer to collectively as the Maritime Restrictions. These Maritime Restrictions:
|
● |
may cause the market price of our Class A common stock to be lower than the market price of our competitors who may not impose similar restrictions; |
|
● |
may result in transfers to non-U.S. citizens being void and ineffective and, thus, may impede or limit the ability of our stockholders to transfer or purchase shares of our Class A common stock; |
|
● |
provide for the automatic transfer of shares in excess of the maximum permitted percentage, which we refer to as Excess Shares, to a trust for sale and may result in non-U.S. citizens suffering losses from the sale of Excess Shares; |
|
● |
permit us to redeem Excess Shares, which may result in stockholders who are non-U.S. citizens being required to sell their Excess Shares of Class A common stock at an undesirable time or price or on unfavorable terms; |
|
● |
may adversely affect our financial condition if we must redeem Excess Shares or if we do not have the funds or ability to redeem the Excess Shares; and |
|
● |
may impede or discourage efforts by a third party to acquire us, even if doing so would benefit our stockholders. |
Our business could be adversely affected if we do not comply with the Jones Act.
We are subject to the Jones Act, which requires that vessels carrying passengers or cargo between U.S. ports in Coastwise Trade be owned and managed by U.S. citizens, and be built in and registered under the laws of the United States. Violations of the Jones Act would result in our losing eligibility to engage in Coastwise Trade, the imposition of substantial penalties against us, including seizure or forfeiture of our vessels, and/or the inability to register our vessels in the United States, each of which could have a material adverse effect on our financial condition and results of operations. Although we currently believe we meet the requirements to engage in Coastwise Trade, and the Maritime Restrictions were designed to assist us in complying with these requirements, there can be no assurance that we will be in compliance with the Jones Act in the future.
Circumvention or repeal of the Jones Act may have an adverse impact on us.
The Jones Act’s provisions restricting Coastwise Trade to vessels controlled by U.S. citizens may from time to time be circumvented by foreign interests that seek to engage in trade reserved for vessels controlled by U.S. citizens and otherwise qualifying for Coastwise Trade. Legal challenges against such actions are difficult, costly to pursue and are of uncertain outcome. There have also been attempts to repeal or amend the Jones Act, and these attempts are expected to continue. In addition, the Secretary of Homeland Security may suspend the citizenship requirements of the Jones Act in the interest of national defense. To the extent foreign competition is permitted from vessels built in lower-cost shipyards and crewed by non-U.S. citizens with favorable tax regimes and with lower wages and benefits, such competition could have a material adverse effect on domestic companies in the offshore service vessel industry subject to the Jones Act such as us.
We depend on key personnel, and our U.S. citizen requirements may limit our ability to recruit and retain qualified directors and executive officers.
We depend to a significant extent upon the efforts and abilities of our executive officers and other key management personnel. There is no assurance that these individuals will continue in such capacity for any particular period of time. The loss of the services of one or more of our executive officers or key management personnel could adversely affect our operations.
As long as shares of our Class A common stock remain outstanding, our chairman of the board and chief executive officer, by whatever title, must be U.S. citizens. In addition, our certificate of incorporation and bylaws specify that not more than a minority of directors comprising the minimum number of members of the Board of Directors necessary to constitute a quorum of the Board of Directors (or such other portion as the Board of Directors determines is necessary to comply with applicable law) may be non-U.S. citizens so long as shares of our Class A common stock remain outstanding. Our bylaws provide for similar citizenship requirements with regard to committees of the Board of Directors. As a result, we may be unable to allow a non-U.S. citizen, who would otherwise be qualified, to serve as a director or as our chairman of the board or chief executive officer.
Maintaining our current fleet size and configuration and acquiring vessels required for additional future growth require significant capital.
Expenditures required for the repair, certification and maintenance of a vessel typically increase with vessel age. These expenditures may increase to a level at which they are not economically justifiable and, therefore, to maintain our current fleet size we may seek to construct or acquire additional vessels. Also, customers may prefer modern vessels over older vessels, especially in weaker markets. The cost of adding a new vessel to our fleet can range from under $10 million to $100 million and potentially higher.
While we expect our cash on hand, cash flow from operations and available borrowings under our credit facilities to be adequate to fund our existing commitments, including our new-build vessel construction program, our ability to pay these amounts is dependent upon the success of our operations. To date, we have been able to obtain adequate financing to fund all of our commitments. See “Management’s Discussion and Analysis of Financial Condition and Results of Operations – Liquidity, Capital Resources and Financial Condition – Long-Term Debt” and “– Resources and Liquidity” included in Part II, Item 7. We can give no assurance that we will have sufficient capital resources to build or acquire the vessels required to expand or to maintain our current fleet size and vessel configuration.
Growth through acquisitions and investment could result in operating difficulties, dilution and other harmful consequences that may adversely impact our business and results of operations.
We routinely evaluate potential acquisitions of single vessels, vessel fleets and businesses, and we expect to continue to enter into discussions regarding a wide array of potential strategic transactions. The process of integrating an acquisition could create unforeseen operating difficulties and expenditures. The areas where we face risks include:
|
● |
diversion of management time and focus away from operating our business to integrating the business; |
|
● |
integration of the acquired company’s accounting, human resources and other administrative systems and the coordination of various business functions; |
|
● |
implementation of, and changes to, controls, procedures and policies at the acquired company; |
|
● |
transition of customers into our operations; |
|
● |
in the case of foreign acquisitions, the need to integrate operations across different cultures and languages and to address the particular economic, currency, political and regulatory risks associated with specific countries or regions; |
|
● |
cultural challenges associated with integrating employees from the acquired company into our organization, and retention of employees from the businesses we acquire; |
|
● |
liability for activities of the acquired company before the acquisition, including violations of laws, commercial disputes, tax liabilities and other known and unknown liabilities; and |
|
● |
litigation or other claims in connection with the acquired company, including claims from terminated employees, customers, former stockholders or other third parties. |
Our failure to address these risks or other problems encountered in connection with our past or future acquisitions or investments could cause us to fail to realize the anticipated benefits of such acquisitions or investments, incur unanticipated liabilities, and harm our business in general.
Future acquisitions could also result in dilutive issuances of our equity securities, the incurrence of debt or contingent liabilities, an increase in amortization expenses or write-offs of goodwill, any of which could harm our financial condition.
We can give no assurance that we will be able to identify desirable acquisition candidates or that we will have the financial resources necessary to pursue desirable acquisition candidates or be successful in entering into definitive agreements or closing any such acquisition on satisfactory terms. An inability to acquire additional vessels or businesses may limit our growth potential.
We may be unable to attract and retain qualified, skilled employees necessary to operate our business.
Our success depends in large part on our ability to attract and retain highly skilled and qualified personnel. Our inability to hire, train and retain a sufficient number of qualified employees could impair our ability to manage, maintain and grow our business. In crewing our vessels, we require skilled employees who can perform physically demanding work, often in harsh or challenging environments for extended periods of time. As a result of the volatility of the oil and gas industry and the demanding nature of the work, potential vessel employees may choose to pursue employment in fields that offer a more desirable work environment at wage rates that are competitive with ours. Further, we face strong competition within the broader oilfield industry for potential employees, including competition from drilling rig operators, for our fleet personnel. As vessels under our new vessel construction program are placed in service, we may not be able to hire a sufficient number of employees. It is possible that we will have to raise wage rates to attract workers and to retain our current employees. If we are not able to increase our charges to our customers to compensate for wage increases, our financial condition and results of operations may be adversely affected. If we are unable to recruit qualified personnel we may not be able to operate our vessels at full utilization, which would adversely affect our results of operations.
Climate change, climate change regulations and greenhouse gas effects may adversely impact our operations and markets.
There is a concern that emissions of greenhouse gases, or GHGs, such as carbon dioxide and methane, alter the composition of the global atmosphere in ways that affect the global climate. Climate change, including the impact of global warming, may create physical and financial risk for organizations whose operations are affected by the climate. Some scientists have concluded that increasing concentrations of GHGs in the Earth’s atmosphere may produce climate changes that have significant physical effects, such as increased frequency and severity of storms, droughts, floods and other climatic events. If any such effects were to occur, they could have an adverse effect on our business, financial condition and results of operations.
Financial risks relating to climate change are likely to arise from increasing regulation of GHG emissions, as compliance with any new rules could be difficult and costly. For example, from time to time legislation has been proposed in the U.S. Congress to reduce GHG emissions. In addition, in the absence of federal GHG legislation, the EPA has taken steps to regulate GHG emissions. Depending on the outcome of these or other regulatory initiatives, increased energy, environmental and other costs and capital expenditures could be necessary to comply with the relevant limitations. Our vessels also operate in foreign jurisdictions that are addressing climate changes by legislation or regulation. Unless and until legislation or regulations are enacted and their terms are finalized, we cannot reasonably or reliably estimate its impact on our financial condition, operating performance or ability to compete. In addition, any GHG related legislation or regulatory programs could also increase the cost of consuming, and thereby reduce demand for, the oil and gas produced by our customers. Consequently, legislation and regulatory programs to reduce emissions of GHGs could have an adverse effect on our business, financial condition and results of operations.
Prior events in the U.S. Gulf of Mexico have adversely impacted and are likely to continue to adversely impact our operations and financial condition.
In the aftermath of the Macondo Incident, the rig explosion and fire and subsequent oil spill in the Gulf of Mexico in April 2010, regulatory agencies with jurisdiction over oil and gas exploration adopted numerous new regulations and operating procedures. If these regulations, operating procedures and possibility of increased legal liability are viewed by our current or future customers as a significant increased financial burden on the drilling projects in the U.S. Gulf of Mexico, drillships and other floating rigs could depart the U.S. Gulf of Mexico for other potentially more profitable regions, which would likely adversely affect the demand for our equipment and services. In addition, government agencies could issue new safety and environmental guidelines or regulations for drilling in the U.S. Gulf of Mexico that could disrupt or delay drilling operations, increase the cost of drilling operations or reduce the area of operations available for drilling. All of these uncertainties, including such announced and potential changes in laws and regulations, the cost or availability of insurance and the decisions by customers, governmental agencies or other industry participants could result in a reduced demand for our equipment and services or increase our cost of operations, which could have an adverse effect on our business. We cannot reasonably or reliably estimate to what extent any of the foregoing changes may occur, when they may occur, or how severely they may impact us.
A decrease in our customer base could adversely affect demand for our services and reduce our revenues.
We derive a significant amount of our revenue from a small number of offshore energy companies. Our loss of one of these significant customers, if not offset by sales to new or other existing customers, could have a material adverse effect on our business, financial condition and results of operations. In addition, in recent years, oil and natural gas companies, energy companies and drilling contractors have undergone substantial consolidation and additional consolidation is possible. Consolidation results in fewer companies to charter or contract for our services. Also, merger activity among both major and independent oil and natural gas companies affects exploration, development and production activity as the consolidated companies integrate operations to increase efficiency and reduce costs. Less promising exploration and development projects of a combined company may be dropped or delayed. Such activity may result in an exploration and development budget for a combined company that is lower than the total budget of both companies before consolidation, which could adversely affect demand for our vessels and thereby reduce our revenues.
ITEM 1B. Unresolved Staff Comments
NONE
ITEM 2. Properties
Our principal executive offices are leased and located in Houston, Texas. We lease offices and, in most cases, warehouse facilities for our local operations. Offices for our Southeast Asia operating segment are located in Singapore. Offices for our North Sea operating segment are located in Aberdeen, Scotland and Sandnes, Norway. Offices for our Americas operating segment are located in Macae, Brazil; Ciudad del Carmen, Mexico; Chaguaramus, Trinidad; and St. Rose and Youngsville, Louisiana. Our operations generally do not require highly specialized facilities, and suitable facilities are generally available on a lease basis as required.
ITEM 3. Legal Proceedings
Various legal proceedings and claims that arise in the ordinary course of business may be instituted or asserted against us. Although the outcome of litigation cannot be predicted with certainty, we believe, based on discussions with legal counsel and in consideration of reserves recorded, that an unfavorable outcome of these legal actions would not have a material adverse effect on our consolidated financial position and results of operations. We cannot predict whether any such claims may be made in the future.
ITEM 4. Mine Safety Disclosures
NOT APPLICABLE
PART II
ITEM 5. Market for Registrant’s Common Equity, Related Stockholder Matters and Issuer Purchases of Equity Securities
Our Class A common stock is traded on the New York Stock Exchange (NYSE) under the symbol “GLF”. The following table sets forth the range of high and low sales prices per share for our common stock and the amount of cash dividends per share declared for the periods indicated:
|
2016 |
2015 |
|||||||||||||||||||||||
|
High |
Low |
Dividend |
High |
Low |
Dividend |
|||||||||||||||||||
|
Quarter ended March 31, |
$ | 7.38 | $ | 2.60 | $ | 0.00 | $ | 24.80 | $ | 13.04 | $ | 0.00 | ||||||||||||
|
Quarter ended June 30, |
$ | 6.94 | $ | 3.06 | $ | 0.00 | $ | 17.38 | $ | 11.31 | $ | 0.00 | ||||||||||||
|
Quarter ended September 30, |
$ | 3.76 | $ | 1.52 | $ | 0.00 | $ | 10.90 | $ | 6.09 | $ | 0.00 | ||||||||||||
|
Quarter ended December 31, |
$ | 2.30 | $ | 1.10 | $ | 0.00 | $ | 8.79 | $ | 4.65 | $ | 0.00 | ||||||||||||
As of March 15, 2017, there were approximately 447 holders of record of our Class A common stock.
Issuer Repurchases of Equity Securities
In December 2012, our Board approved a stock repurchase program for up to a total of $100.0 million of our issued and outstanding Class A common stock. Under the program, repurchases can be made from time to time using a variety of methods, which may include open market purchases or purchases through a Rule 10b5-1 trading plan, or in privately negotiated transactions, all in accordance with SEC and other applicable legal requirements. In late 2012 and early 2013, we repurchased 373,619 shares of our Class A common stock for $13.3 million. In 2014, we repurchased 1,883,648 shares of our Class A common stock for $57.7 million.
We did not repurchase any of our Class A common stock in 2015 or, except as discussed below, 2016. We are limited under the terms of our Multicurrency Facility Agreement and our Norwegian Facility Agreement described below in our ability to make certain payments beyond permitted amounts for share repurchases. See “Management’s Discussion and Analysis of Financial Condition and Results of Operations – Liquidity, Capital Resources and Financial Condition – Long-Term Debt” included in Part II, Item 7.
Although we did not purchase any of our Class A common stock pursuant to the stock repurchase program in 2016, we acquired some shares of our Class A common stock in satisfaction of tax withholding obligations in connection with certain payouts under our Deferred Compensation Plan. The following table sets forth the number of such shares and the average effective acquisition price per share on a monthly basis during 2016:
| Repurchase of Equity Securities | ||||||||||||||||||
|
Period |
Total Number of Shares Repurchased |
Average Price Paid Per Share |
Total Number of Shares Purchased as Part of Publicly Announced Plans or Programs |
Maximum Number of Shares that May Yet Be Purchased Under the Plans or Programs (a) |
||||||||||||||
| January 1 | - |
31 |
- | $ | - | - | - | |||||||||||
| February 1 | - |
29 |
- | - | - | - | ||||||||||||
| March 1 | - |
31 |
69,339 | 5.95 | - | - | ||||||||||||
| April 1 | - |
30 |
7,080 | 6.69 | - | - | ||||||||||||
| May 1 | - |
31 |
20,238 | 5.21 | - | - | ||||||||||||
| June 1 | - |
30 |
4,763 | 3.21 | - | - | ||||||||||||
| July 1 | - |
31 |
164 | 3.22 | - | - | ||||||||||||
| August 1 | - |
31 |
- | - | - | - | ||||||||||||
| September 1 | - |
30 |
- | - | - | - | ||||||||||||
| October 1 | - |
31 |
- | - | - | - | ||||||||||||
| November 1 | - |
30 |
- | - | - | - | ||||||||||||
| December 1 | - |
31 |
- | - | - | - | ||||||||||||
|
Total |
101,584 | (b) | $ | 4.86 | - | - | ||||||||||||
|
(a) |
We are limited under the terms of our Multicurrency Facility Agreement and our Norwegian Facility Agreement in our ability to make certain payments beyond permitted amounts for share purchases. See “Management’s Discussion and Analysis of Financial Condition and Results of Operations – Liquidity, Capital Resources and Financial Condition – Long-Term Debt” included in Part II, Item 7. |
|
(b) |
None of these shares were purchased pursuant to a publicly announced share repurchase program. |
Dividend Program
Our dividend policy is reviewed by the Board at such times as it deems appropriate in light of operating conditions, dividend restrictions of subsidiaries and investors or lenders, financial requirements, general business conditions and other factors it considers relevant. Beginning in December 2012 and for each quarter of 2013 and 2014, we paid a dividend of $0.25 per share ($1.00 per share in December 2012) of our Class A common stock. In February 2015, the Board suspended dividend payments indefinitely. The Board declared no dividends for the years ended December 31, 2015 and 2016.
Pursuant to the terms of the indenture governing our Senior Notes, as further described in Note 6 to our Consolidated Financial Statements in Part II, Item 8, we may be restricted from declaring or paying any future dividends. In addition, we were limited under the terms of our Multicurrency Facility Agreement and are limited under our Norwegian Facility Agreement in our ability to make certain payments beyond permitted amounts for dividends, acquisitions or share repurchases. See “Management’s Discussion and Analysis of Financial Condition and Results of Operations – Liquidity, Capital Resources and Financial Condition – Long-Term Debt.”
Performance Graph
The following performance graph and table compare the cumulative return on our Class A common stock to the Dow Jones Total Market Index and the Dow Jones Oilfield Equipment and Services Index for the periods indicated. The graph assumes (i) the reinvestment of dividends, if any, and (ii) that the value of the investment in our Class A common stock and each index was $100 at December 31, 2010.
Comparison of Cumulative Total Return
|
|
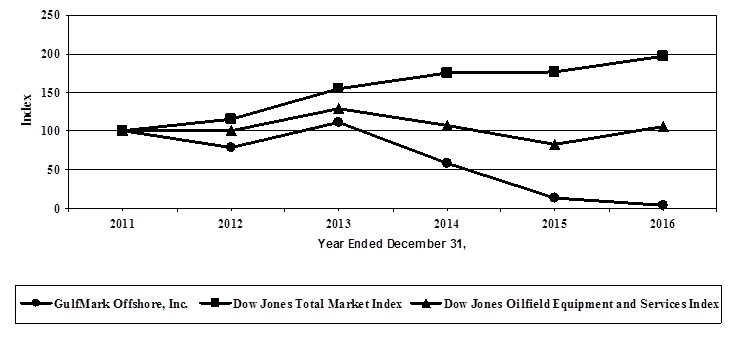
|
December 31, |
||||||||||||||||||||||||
|
2011 |
2012 |
2013 |
2014 |
2015 |
2016 |
|||||||||||||||||||
|
GulfMark Offshore, Inc. |
100 | 78 | 111 | 58 | 13 | 4 | ||||||||||||||||||
|
Dow Jones Total Market Index |
100 | 116 | 155 | 175 | 176 | 197 | ||||||||||||||||||
|
Dow Jones Oilfield Equipment and Services Index |
100 | 100 | 129 | 107 | 83 | 106 | ||||||||||||||||||
ITEM 6. Selected Financial Data
The data that follows should be read in conjunction with our Consolidated Financial Statements and the notes thereto included in Part II, Item 8 “Financial Statements and Supplementary Data,” and “Management’s Discussion and Analysis of Financial Condition and Results of Operations,” included in Part II, Item 7.
|
Year Ended December 31, |
||||||||||||||||||||
|
2016 |
2015 |
2014 |
2013 |
2012 |
||||||||||||||||
|
(Amounts in thousands, except per share amounts and vessels) |
||||||||||||||||||||
|
Operating Data: |
||||||||||||||||||||
|
Revenue |
$ | 123,719 | $ | 274,806 | $ | 495,769 | $ | 454,604 | $ | 389,205 | ||||||||||
|
Direct operating expenses |
83,165 | 169,837 | 236,244 | 217,422 | 198,187 | |||||||||||||||
|
Drydock expense |
4,662 | 15,387 | 24,840 | 24,094 | 33,280 | |||||||||||||||
|
General and administrative expenses |
37,663 | 47,280 | 62,728 | 54,527 | 54,600 | |||||||||||||||
|
Depreciation and amortization |
58,182 | 72,591 | 75,336 | 63,955 | 59,722 | |||||||||||||||
|
Impairment charges |
162,808 | 152,103 | 8,995 | - | 1,152 | |||||||||||||||
|
(Gain) loss on sale of assets and other |
8,564 | 1,160 | (14,039 | ) | (5,870 | ) | (8,741 | ) | ||||||||||||
|
Operating income (loss) |
(231,325 | ) | (183,552 | ) | 101,665 | 100,476 | 51,005 | |||||||||||||
|
Interest expense |
(33,486 | ) | (36,946 | ) | (29,332 | ) | (23,821 | ) | (23,244 | ) | ||||||||||
|
Interest income |
133 | 260 | 307 | 202 | 338 | |||||||||||||||
|
Gain (loss) on extinguishment of debt |
35,912 | 458 | - | - | (4,378 | ) | ||||||||||||||
|
Other financing costs |
(11,287 | ) | - | - | - | 0 | ||||||||||||||
|
Foreign currency gain (loss) and other |
(2,384 | ) | (1,088 | ) | (995 | ) | (1,289 | ) | (1,779 | ) | ||||||||||
|
Income tax (provision) benefit (a) |
39,458 | 5,633 | (9,270 | ) | (4,962 | ) | (2,669 | ) | ||||||||||||
|
Net income (loss) |
$ | (202,979 | ) | $ | (215,235 | ) | $ | 62,375 | $ | 70,606 | $ | 19,273 | ||||||||
|
Amounts per common share (basic) (b): |
||||||||||||||||||||
|
Net income (loss) |
$ | (8.09 | ) | $ | (8.70 | ) | $ | 2.39 | $ | 2.70 | $ | 0.73 | ||||||||
|
Weighted average common shares (basic) |
25,094 | 24,729 | 26,097 | 26,175 | 26,208 | |||||||||||||||
|
Amounts per common share (diluted) (b): |
||||||||||||||||||||
|
Net income (loss) |
$ | (8.09 | ) | $ | (8.70 | ) | $ | 2.39 | $ | 2.70 | $ | 0.73 | ||||||||
|
Weighted average common shares (diluted) |
25,094 | 24,729 | 26,097 | 26,185 | 26,228 | |||||||||||||||
|
Statement of Cash Flows Data: |
||||||||||||||||||||
|
Cash provided by (used in) operating activities |
$ | (23,339 | ) | $ | 43,357 | $ | 153,848 | $ | 126,702 | $ | 102,736 | |||||||||
|
Cash used in investing activities |
(9,659 | ) | (22,835 | ) | (121,104 | ) | (210,069 | ) | (198,764 | ) | ||||||||||
|
Cash provided by (used in) financing activities |
20,167 | (47,281 | ) | (40,024 | ) | (39,598 | ) | 150,604 | ||||||||||||
|
Effect of exchange rate changes on cash |
(286 | ) | (2,087 | ) | (2,501 | ) | (1,644 | ) | 1,782 | |||||||||||
|
Other Data: |
||||||||||||||||||||
|
Adjusted EBITDA (c) |
$ | (10,412 | ) | $ | 41,142 | $ | 185,996 | $ | 164,431 | $ | 111,879 | |||||||||
|
Cash dividends per share (d) |
$ | - | $ | - | $ | 1.00 | $ | 1.00 | $ | 1.00 | ||||||||||
|
Total vessels in fleet as of year end (e) |
71 | 73 | 76 | 79 | 78 | |||||||||||||||
|
Average number of owned or chartered vessels (f) |
68.9 | 71.4 | 74.3 | 70.5 | 71.0 | |||||||||||||||
|
As of December 31, |
||||||||||||||||||||
|
2016 |
2015 |
2014 |
2013 |
2012 |
||||||||||||||||
|
(In thousands) |
||||||||||||||||||||
|
Balance Sheet Data: |
||||||||||||||||||||
|
Cash and cash equivalents |
$ | 8,822 | $ | 21,939 | $ | 50,785 | $ | 60,566 | $ | 185,175 | ||||||||||
|
Vessels, equipment and other fixed assets, including construction in progress, net |
995,220 | 1,266,487 | 1,484,561 | 1,494,611 | 1,305,789 | |||||||||||||||
|
Total assets |
1,053,895 | 1,361,252 | 1,716,355 | 1,773,292 | 1,745,674 | |||||||||||||||
|
Current portion of long-term debt (g) |
483,326 | - | - | - | - | |||||||||||||||
|
Long-term debt (h) |
- | 490,589 | 544,732 | 500,864 | 500,999 | |||||||||||||||
|
Total stockholders’ equity |
449,621 | 698,308 | 968,753 | 1,063,341 | 1,027,882 | |||||||||||||||
|
(a) |
See Note 7 “Income Taxes” to our Consolidated Financial Statements included in Part II, Item 8. |
|
(b) |
Earnings per share is based on the weighted-average number of shares of common stock and common stock equivalents outstanding. |
|
(c) |
EBITDA is defined as net income (loss) before interest expense, interest income, income tax (benefit) provision, and depreciation, amortization and impairment. Adjusted EBITDA is calculated by adjusting EBITDA for certain items that we believe are non-cash or non-operational, consisting of: (i) the cumulative effect of change in accounting principle, (ii) debt refinancing costs, (iii) loss from unconsolidated ventures, (iv) minority interests, (v) gain on extinguishment of debt, and (vi) other (income) expense, net. EBITDA and Adjusted EBITDA are not measurements of financial performance under generally accepted accounting principles, or GAAP, and should not be considered as an alternative to cash flow data, a measure of liquidity or an alternative to operating income or net income as indicators of our operating performance or any other measures of performance derived in accordance with GAAP. |
EBITDA and Adjusted EBITDA are presented because they are widely used by securities analysts, creditors, investors and other interested parties in the evaluation of companies in our industry. This information is a material component of certain financial covenants in our debt obligations. Failure to comply with the financial covenants could result in an inability to borrow under our revolving credit facilities and the imposition of restrictions on our financial flexibility. When viewed with GAAP results and the accompanying reconciliation, we believe the EBITDA and Adjusted EBITDA calculations provide additional information that is useful to gain an understanding of the factors and trends affecting our ability to service debt and meet our ongoing liquidity requirements. EBITDA is also a financial metric used by management as a supplemental internal measure for planning and forecasting overall expectations and for evaluating actual results against such expectations. However, because EBITDA and Adjusted EBITDA are not measurements determined in accordance with GAAP and are thus susceptible to varying calculations, EBITDA and Adjusted EBITDA as presented may not be comparable to other similarly titled measures used by other companies or comparable for other purposes. Also, EBITDA and Adjusted EBITDA, as non-GAAP financial measures, have material limitations as compared to cash flow provided by operating activities. EBITDA does not reflect the future payments for capital expenditures, financing–related charges and deferred income taxes that may be required as part of normal business operations.
The following table summarizes the calculation of EBITDA and Adjusted EBITDA for the periods indicated.
|
Year Ended December 31, |
||||||||||||||||||||
|
2016 |
2015 |
2014 |
2013 |
2012 |
||||||||||||||||
|
(In thousands) |
||||||||||||||||||||
|
Net income (loss) |
$ | (202,979 | ) | $ | (215,235 | ) | $ | 62,375 | $ | 70,606 | $ | 19,273 | ||||||||
|
Interest expense |
33,486 | 36,946 | 29,332 | 23,821 | 23,244 | |||||||||||||||
|
Interest income |
(133 | ) | (260 | ) | (307 | ) | (202 | ) | (338 | ) | ||||||||||
|
Income tax provision (benefit) |
(39,458 | ) | (5,633 | ) | 9,270 | 4,962 | 2,669 | |||||||||||||
|
Depreciation, amortization and impairment |
220,990 | 224,694 | 84,331 | 63,955 | 60,874 | |||||||||||||||
|
EBITDA |
11,906 | 40,512 | 185,001 | 163,142 | 105,722 | |||||||||||||||
|
Adjustments: |
||||||||||||||||||||
|
Other, net * |
(22,318 | ) | 630 | 995 | 1,289 | 6,157 | ||||||||||||||
|
Adjusted EBITDA |
$ | (10,412 | ) | $ | 41,142 | $ | 185,996 | $ | 164,431 | $ | 111,879 | |||||||||
* Net amount includes foreign currency transaction adjustments, other financing costs and gain/loss on extinguishment of debt.
|
(d) |
In December 2012, our Board declared an annual cash dividend on our Class A common stock of $1.00 per share. In each quarter of 2013 and 2014, our Board declared a quarterly cash dividend of $0.25 per share for a total dividend of $1.00 per share in each of the years 2012, 2013 and 2014. In February 2015, the dividend was suspended and no dividends were declared in 2015 or 2016. |
|
(e) |
Includes managed vessels in addition to those that are owned at the end of the applicable period (excludes vessels held for sale). See “Worldwide Fleet” in Part I, Item 1 “Business” for further information concerning our fleet. |
|
(f) |
Average number of vessels is calculated based on the aggregate number of vessel days available during each period divided by the number of calendar days in such period and is adjusted for additions and dispositions occurring during each period. |
|
(g) |
Amounts at December 31, 2016 reflect the reclassification of the $483.3 million of long-term debt to current as a result of an event of default under our Multicurrency Facility Agreement as more fully described in Part II, Item 7 “Management’s Discussion and Analysis of Financial Condition and Results of Operations – Liquidity, Capital Resources and Financial Condition – Resources and Liquidity.” On March 14, 2017, we entered into a support agreement, or Support Agreement, with the agent under the Multicurrency Facility Agreement in which the lenders agreed to waive the existing or anticipated defaults or events of default under the Multicurrency Facility Agreement listed in the Support Agreement and forbear from exercising rights or remedies under the related finance documents as a result therefrom, for a limited support period. The Support Agreement, and the waiver and forbearance provided for therein, terminates upon the earliest to occur of certain termination events described therein or April 14, 2017. See Part II, Item 9B “Other Information.” |
|
(h) |
Excludes current portion of long-term debt. |
ITEM 7. Management’s Discussion and Analysis of Financial Condition and Results of Operations
This information should be read in conjunction with our Consolidated Financial Statements, including the notes thereto, contained in Part II, Item 8 “Financial Statements and Supplementary Data.” See also Part II, Item 6 “Selected Financial Data” and “Forward-Looking Statements.”
General
We provide marine support and transportation services to companies involved in the offshore exploration and production of oil and natural gas. Our vessels transport drilling materials, supplies and personnel to offshore facilities, and also move and position drilling structures. A substantial portion of our operations are international. Our fleet has grown in both size and capability, from 11 vessels in 1990 to our present number of 69 vessels, through strategic acquisitions and the new construction of technologically advanced vessels, partially offset by dispositions of certain older, less profitable vessels. As of March 16, 2017, our fleet includes 66 owned vessels, 28 of which are stacked, and three managed vessels.
Our results of operations are affected primarily by day rates, fleet utilization and the number and type of vessels in our fleet. Utilization and day rates, in turn, are influenced principally by the demand for vessel services from the offshore exploration and production sectors of the oil and natural gas industry. The supply of vessels to meet this fluctuating demand is related directly to the perception of future activity in both the drilling and production phases of the oil and natural gas industry as well as the availability of capital to build new vessels to meet the changing market requirements. As discussed below, the recent and sustained decline in the price of oil has materially and negatively impacted our results of operations.
We also provide management services to other vessel owners for a fee. We do not include charter revenue and vessel expenses of these vessels in our operating results; however, management fees are included in revenue. These vessels are excluded for purposes of calculating fleet rates per day worked and utilization in the applicable periods. All three of our managed vessels are currently stacked.
The operations of our fleet may be subject to seasonal factors. Operations in the North Sea are often at their highest levels from April to August and at their lowest levels from December through February. Operations in our other areas, although involving some seasonal factors, tend to remain more consistent throughout the year. Activity in the U.S. Gulf of Mexico may be slower during the hurricane season from June through November, although following a hurricane, activity may increase as there may be a greater demand for vessel services as repair and remediation activities take place.
Our operating costs are primarily a function of fleet configuration. The most significant direct operating cost is wages paid to vessel crews, followed by repairs and maintenance. Generally, fluctuations in vessel utilization have little effect on direct operating costs in the short term and, as a result, direct operating costs as a percentage of revenue may vary substantially due to changes in day rates and utilization.
In addition to direct operating costs, we incur fixed charges related to (i) the depreciation of our fleet, (ii) costs for routine drydock inspections, (iii) modifications designed to ensure compliance with applicable regulations and (iv) maintaining certifications for our vessels with various international classification societies. The number of drydockings and other repairs undertaken in a given period generally determines our repair and maintenance expenses. The demands of the market, the expiration of existing contracts, the commencement of new contracts, seasonal factors and customer preferences influence the timing of drydocks. As a result of the current market downturn, we have taken some vessels out of service (also referred to as stacking) and deferred a number of drydocks as part of our cost cutting initiatives. The deferred drydocks will eventually be required to be performed prior to returning the vessels to active service.
Oil Price Impact
Our business is directly impacted by the level of activity in worldwide offshore oil and natural gas exploration, development and production, which in turn is influenced by trends in oil and natural gas prices. In addition, oil and natural gas prices are affected by a host of geopolitical and economic forces, including the fundamental principles of supply and demand. In particular, the oil price is significantly influenced by actions of the Organization of Petroleum Exporting Countries, or OPEC. Beginning in late 2014, the oil and gas industry experienced a significant decline in the price of oil causing an industry-wide downturn that continued into 2017. The decline was in part a result of an OPEC decision to increase production. The price of oil declined significantly from over $100 per barrel in July 2014 to below $30 per barrel in February 2016. The downturn of the last few years has significantly impacted the operational plans for oil companies, resulting in reduced expenditures for exploration and production activities, and consequently has adversely affected the drilling and support service sector. These changes in industry dynamics decreased demand for OSV services and led to an excess number of vessels in all of our operating regions. Although OPEC met in November 2016 and agreed to limit production going forward, day rates have not recovered. In many regions, day rates for OSV services have fallen below the levels needed to sustain our business. Assuming the industry cost structure remains at current levels, many industry observers believe that sustained oil price levels in excess of $60 per barrel are required to return the OSV business to profitability.
Going Concern
We continued to incur significant losses from operations and had negative cash flows from operating activities for the year ended December 31, 2016. We expect to continue to incur losses from operations and generate negative cash flows from our operating activities. These expectations and other liquidity risks described in this report raise substantial doubt about whether we will be able to meet our obligations as they become due within one year after the date of this report.
Our consolidated financial statements as of and for the year ended December 31, 2016 have been prepared assuming we will continue as a going concern, which contemplates continuity of operations, realization of assets and the satisfaction of liabilities in the normal course of business for the twelve-month period following the date of the consolidated financial statements. However, for the reasons described herein, indebtedness with the stated maturities as summarized in Note 6 to our Consolidated Financial Statements included in Part II, Item 8 is classified as a current liability at December 31, 2016. The report from our independent registered public accounting firm on our consolidated financial statements for the year ended December 31, 2016 includes an uncertainty paragraph that arises from the substantial doubt about our ability to continue as a going concern. See “– Liquidity, Capital Resources and Financial Condition – Resources and Liquidity.”
We are highly leveraged and had approximately $483.3 million of debt as of December 31, 2016, including $429.6 million outstanding under our unsecured Senior Notes described below, $49.0 million outstanding under our secured Multicurrency Facility Agreement described below and $11.2 million outstanding under our secured Norwegian Facility Agreement described below. See “– Liquidity, Capital Resources and Financial Condition – Long-Term Debt.” Since December 31, 2016, we have made additional borrowings under our revolving credit facilities and as of March 15, 2017, the amount outstanding under our Multicurrency Facility Agreement had increased to approximately $72.0 million and the amount outstanding under our Norwegian Facility Agreement had increased to approximately $35.0 million. As of March 15, 2017, we had approximately $25.8 million of cash on hand. On March 8, 2017, we entered into an agreement with the agent under our Multicurrency Facility Agreement that prohibits us from requesting any additional loans under the Multicurrency Facility Agreement without the prior written consent of the agent (acting upon the instruction of all the lenders following unanimous consent). In this agreement, the lenders agreed to extend additional revolving loans in the aggregate principal amount of $10.0 million subject to certain conditions precedent, including payment by us of certain fees and retainers of a financial advisor and counsel for the agent, and the lenders agreed to waive any default or event of default (no such default or event of default having been admitted by us) arising by virtue of a borrowing request submitted previously by us, which request was deemed to be withdrawn pursuant to the agreement. The lenders funded loans in such amount on March 8, 2017.
At December 31, 2016, we were in compliance with all financial covenants set forth in our revolving credit facilities and the indenture governing our Senior Notes; however, we are forecasting that for the quarter ending March 31, 2017, we will no longer be in compliance with the minimum consolidated adjusted EBITDA requirement contained in the Multicurrency Facility Agreement and the Norwegian Facility Agreement. Absent waivers or cures, non-compliance with such covenants would constitute an event of default under the Multicurrency Facility Agreement and the Norwegian Facility Agreement. As a result, all indebtedness under the Multicurrency Facility Agreement and the Norwegian Facility Agreement could be declared immediately due and payable upon the occurrence of such event of default, subject to any available cure periods. It is possible that we could obtain waivers from our lenders; however, our expectations concerning future losses from operations and cash flows and other liquidity risks raise substantial doubt about whether we will be able to meet our obligations as they become due within one year after the date of this report.
On March 14, 2017, we entered into a support agreement, or Support Agreement, with the agent under the Multicurrency Facility Agreement in which the lenders agreed to waive the existing or anticipated defaults or events of default under the Multicurrency Facility Agreement listed in the Support Agreement and forbear from exercising rights or remedies under the related finance documents as a result therefrom, for a limited support period. The Support Agreement, and the waiver and forbearance provided for therein, terminates upon the earliest to occur of certain termination events described therein or April 14, 2017. See Part II, Item 9B “Other Information” for a more detailed description of the Support Agreement.
We also have not paid the $13.7 million interest payment due March 15, 2017 on our Senior Notes and, as provided for in the indenture governing the Senior Notes, have entered into the 30-day grace period to make such payment. Failure to pay this amount on March 15, 2017 would constitute an event of default under the indenture governing the Senior Notes if the payment is not made within 30 days of such date and would result in a cross-default under the Multicurrency Facility Agreement and the Norwegian Facility Agreement. As a result of these factors and the additional matters discussed herein, as well as the continued downturn in the oil and gas industry and the decrease in offshore oil and natural gas exploration activities, among others, there exists substantial doubt whether we will be able to continue as a going concern. See “– Liquidity, Capital Resources and Financial Condition – Resources and Liquidity.”
Markets
North Sea. We continue to expect significant activity in the North Sea region during 2017. We also expect the renewed focus on operator savings, diminishing rig utilization and oversupply of OSVs to adversely impact vessel day rates.
Although cost efficiencies are currently a priority of operators, we believe the North Sea region remains viable long-term with several large field developments in the United Kingdom, or U.K., and Norwegian sectors forecasted by industry analysts, along with decommissioning work and projects in the renewables sector. We expect these factors, combined with an upturn in drilling in remote northerly areas such as the Barents Sea, Kara Sea and offshore Greenland, to drive demand in the North Sea region in the coming years, although we can provide no assurance as to when these developments may occur.
Southeast Asia. The Southeast Asia resource basin consists predominantly of shallow water mature fields where development drilling is expected to continue throughout 2017. It is apparent that operators, both national oil companies and independent operators, are experiencing significant pressure to reduce their costs in light of depressed oil prices and as a result their capital expenditure budgets may continue to fall. As of the date of this report, we generally expect exploration drilling activities to remain at current levels throughout 2017 in the Southeast Asian markets, resulting in a continuation of current market conditions for AHTS support, although further declines in commodity prices or reductions of operators’ capital budgets would result in additional downward pressure on drilling activities in this region, and therefore on market conditions for AHTS support vessels.
Americas. During 2016, due to the decline in the oil and gas commodities market and the resulting negative impact on demand for OSVs, we experienced significant downward pressure on our utilization and day rates in the Americas in all areas in which we operate. We do not expect the market in the Americas operating segment to recover to any great extent in 2017.
In December 2013, Mexico’s Congress approved a constitutional reform to allow private investment in Mexico’s energy sector which effectively ended the state controlled (Petroleos Mexicanos) 75-year monopoly on oil and natural gas extraction and production. We anticipate Mexico to be a growing market for expanded deepwater activity when market conditions improve. We plan to continue to actively pursue opportunities in the area as they arise.
Fleet Commitments and Backlog
A portion of our available fleet is committed under contracts of various terms. The following table outlines the percentage of our forward days under contract and revenue backlog as of the dates shown:
|
As of March 16, 2017 |
As of February 29, 2016 |
|||||||||||||||
|
2017 |
2018 |
2016 |
2017 |
|||||||||||||
|
Vessel Days |
Vessel Days |
Vessel Days |
Vessel Days |
|||||||||||||
|
North Sea |
42.0 | % | 25.0 | % | 41.0 | % | 18.0 | % | ||||||||
|
Southeast Asia |
22.0 | % | 14.0 | % | 23.0 | % | 17.0 | % | ||||||||
|
Americas |
19.0 | % | 3.0 | % | 2.0 | % | 0.0 | % | ||||||||
|
Overall Fleet |
28.0 | % | 13.0 | % | 21.0 | % | 10.0 | % | ||||||||
|
Revenue backlog (in thousands) |
$ | 111,221 | $ | 143,965 | ||||||||||||
Our revenue backlog is calculated based on executed contracts with scheduled start dates. Some of the long-term contracts for our vessels and all contracts with governmental entities and national oil companies contain early termination options in favor of the customer, in some cases permitting termination for any reason. Although some of these contracts have early termination remedies in our favor or other provisions designed to discourage the customers from exercising such options, we cannot assure you that our customers would not choose to exercise their termination rights in spite of such remedies or the threat of litigation with us.
Critical Accounting Policies and Estimates
The Consolidated Financial Statements, including the notes thereto, contained in Part II, Item 8 “Financial Statements and Supplementary Data,” contain information that is pertinent to management’s discussion and analysis of our financial condition and results of operations. The preparation of financial statements in conformity with U. S. GAAP requires management to make estimates and assumptions that affect the reported amounts of assets and liabilities and disclosure of any contingent assets and liabilities. Management believes these accounting policies involve judgment due to the sensitivity of the methods, assumptions and estimates necessary in determining the related asset and liability amounts. We believe we have exercised proper judgment in determining these estimates based on the facts and circumstances available to management at the time the estimates were made.
Income Taxes
The majority of our non-U.S. based operations are subject to foreign tax systems that provide significant incentives to qualified shipping activities. Our U.K. and Norway based vessels are taxed under “tonnage tax” regimes. Our U.K. regime was renewed in November 2010 for another ten years. Our qualified Singapore based vessels are exempt from Singapore taxation through December 2017 with extensions available in certain circumstances beyond 2017, although there is no assurance that the extensions will be granted. The qualified Singapore vessels are also subject to specific qualification requirements which if not met could jeopardize our qualified status in Singapore. The tonnage tax regimes provide for a tax based on the net tonnage weight of a qualified vessel. These foreign tax beneficial systems continued to result in our earnings incurring significantly lower taxes than those that would apply if we were not a qualified shipping company in those jurisdictions. The tonnage tax regimes in the North Sea significantly reduce the cash required for taxes in that region.
Our overall effective tax rate is substantially lower than the U.S. federal statutory income tax rate because our Southeast Asia and North Sea operations are tonnage tax qualified shipping activities that are taxed at relatively low rates and our qualified Singapore based vessels are exempt from Singapore taxation through 2017. Should our operational structure change or should the laws that created these shipping tax regimes change, we could be required to provide for taxes at rates much higher than those currently reflected in our consolidated financial statements. In addition, if our pre-tax earnings in higher tax jurisdictions increase, there could be a significant increase in our annual effective tax rate. Any such increase could cause volatility in the comparisons of our effective tax rate from period to period.
U.S. foreign tax credits can be carried forward for ten years. We have $33.5 million of such foreign tax credit carry-forwards that began to expire in 2017. As of December 31, 2016 we had an $21.8 million valuation allowance for certain of our foreign tax credits. We have considered estimated future taxable income in the relevant tax jurisdictions to utilize these tax credits and have considered what we believe to be ongoing prudent and feasible tax planning strategies in assessing the need for the valuation allowance. This information is based on estimates and assumptions including projected taxable income. If these estimates and related assumptions change in the future, or if we determine that we would not be able to realize other deferred tax assets in the future, an adjustment to the valuation allowance would be provided in the period such determination was made.
Utilizing a more likely than not, or greater than 50% probability, minimum recognition threshold for measurement of a tax position taken or expected to be taken in a tax return, we evaluate and record in certain circumstances an income tax asset/liability for uncertain income tax positions. Numerous factors contribute to our evaluation and estimation of our tax positions and related tax liabilities and/or benefits, which may be adjusted periodically and may ultimately be resolved differently than we anticipate. We also consider existing accounting guidance on derecognition, measurement, classification, interest and penalties, accounting in interim periods and disclosure. We continue to recognize income tax related penalties and interest in our provision for income taxes and include those interest and penalties and any amounts for uncertain tax positions in the corresponding consolidated balance sheet presentations for accrued income tax assets and liabilities.
We reduce the carrying value of certain deferred tax assets by the tax effect of the amount of excess stock compensation income tax deductions until such time as those tax deductions can be realized. This may result in our not recognizing any tax benefits for those excess tax deductions in the period in which they arise. Future recognition will result in a credit to additional paid-in capital rather than a reduction of income tax expense.
See also Note 1 and Note 7 to our Consolidated Financial Statements included in Part II, Item 8.
Long-Lived Assets, Goodwill and Intangibles
Our tangible long-lived assets consist primarily of vessels and construction-in-progress. Our intangible asset was associated with customer relationships in the U.S. Gulf of Mexico acquired in our 2008 acquisition of Rigdon Marine Corporation and Rigdon Marine Holdings, LLC. Our goodwill was related to the 2001 acquisition of Sea Truck Holding AS and the 1998 acquisition of Brovig Supply AS. We review long-lived assets for impairment whenever events or changes in circumstances indicate that the carrying amount of such assets may not be recoverable. We assess potential impairment by comparing the carrying values of the long-lived assets to the undiscounted cash flows expected to be received from those assets. If impairment is indicated, we determine the amount of impairment expense by comparing the carrying value of the long-lived assets with their fair market value. We base our undiscounted cash flow estimates on, among other things, historical results adjusted to reflect the best estimate of future operating performance. We obtain estimates of fair value of our vessels from independent appraisal firms. Goodwill was tested for impairment in the third quarter each year or on an interim basis if events or circumstances indicated that the fair value of goodwill had decreased below its carrying value. Management’s assumptions are an inherent part of our asset impairment evaluation, and the use of different assumptions could produce results that differ from those reported.
Beginning in late 2014, oil prices declined significantly. Prices continued to decline throughout 2015and into 2016, reaching a low of less than $30 per barrel in the first quarter of 2016. Prices recovered over the remainder of 2016, stabilizing at over $40 per barrel for much of the second and third quarters of 2016 further increasing to over $50 per barrel in the fourth quarter of 2016. This recent surge in prices is attributable in part to the OPEC decision to limit production at its November 2016 meeting. However, prices continue to be volatile and are subject to significant uncertainty. The lower price environment impacted the operational plans for oil companies beginning in late 2014 and consequently adversely affected the drilling and support service sector. The decrease in day rates and utilization for offshore vessels has been significant. In addition, the independent appraisal firms have lowered the fair value estimates related to our vessels in each quarter since the fourth quarter of 2014. As a result of these factors, we have performed a number of reviews for impairment since the fourth quarter of 2014.
See the discussions below detailing our impairment analyses and processes for each of goodwill, long-lived assets, intangible assets, vessel components and assets held for sale. The components of reduction in value of assets are as follows (in thousands):
|
2016 |
2015 |
2014 |
||||||||||
|
Goodwill impairment |
$ | - | $ | 22,554 | $ | - | ||||||
|
Long-lived assets impairment |
160,222 | 115,489 | - | |||||||||
|
Intangible asset impairment |
- | 13,695 | - | |||||||||
|
Vessel component impairment |
2,586 | 365 | 7,459 | |||||||||
|
Assets held for sale |
- | - | 1,536 | |||||||||
|
Total reduction in value of assets |
$ | 162,808 | $ | 152,103 | $ | 8,995 | ||||||
Goodwill Impairment
We completed a qualitative analysis of goodwill in the third quarter of 2015 and determined that further testing was necessary. Our goodwill impairment evaluation indicated that the carrying value of the North Sea segment exceeded its fair value so that goodwill was potentially impaired. We then performed the second step of the goodwill impairment test, which involved calculating the implied fair value of our goodwill by allocating the fair value of the North Sea segment to all of the assets and liabilities (other than goodwill) and comparing it to the carrying amount of goodwill. To estimate the fair value of the reporting unit we used a 50% weighting of the discounted cash flow method and a 50% weighting of the public company guideline method in determining fair value of the North Sea reporting unit.
We determined that the implied fair value of our goodwill for the North Sea segment was less than its carrying value and in the third quarter of 2015 recorded a $22.6 million impairment of the North Sea segment’s goodwill. As a result of this impairment, we no longer have any goodwill.
Long-Lived Asset Impairment
In third quarter of 2015, we recorded $129.2 million of impairment expense related to our long-lived assets in the U.S. Gulf of Mexico, which is a part of our Americas segment. The impairment consisted of $115.5 million related to our vessels and $13.7 million related to our intangible asset. As a result of this impairment, we no longer have an intangible asset.
In the first and second quarters of 2016, we recorded an aggregate of $160.2 million of impairment expense related to our long-lived assets. Impairment charges totaled $94.5 million for the U.S. Gulf of Mexico and $15.9 million for the non-U.S. Americas, both part of the Americas segment. We also recorded impairment in Southeast Asia totaling $49.8 million.
Vessel Component Impairment
We have vessel components in our North Sea and Southeast Asia segments that we intend to sell. We recorded impairment based on third party appraisals of the North Sea components totaling $7.5 million in the third quarter of 2014 and $0.4 million in the third quarter of 2015. Based on third party valuations, we recorded impairment expense related to these assets totaling $2.6 million, consisting of $2.0 million in the North Sea and $0.6 million in Southeast Asia, in the first quarter of 2016.
Assets Held For Sale
At December 31, 2014, we classified an additional North Sea vessel as an asset held for sale and determined that its carrying value was less than our estimate of the amount we would realize in a sale. As a result, we reduced the carrying value by $1.5 million which is included in our results of operations as an impairment. The adjusted carrying value of this vessel was based on a purchase and sale agreement. In January 2015, we completed the sale of the asset at its adjusted carrying value.
Drydocking, Mobilization and Financing Costs
The periodic requirements of the various classification societies require vessels to be placed in drydock twice in a five-year period. Generally, drydocking costs include refurbishment of structural components as well as major overhaul of operating equipment, subject to scrutiny by the relevant classification society. We expense these costs as incurred. As a result of current market conditions, we have taken many of our vessels out of service (stacked) and deferred a number of scheduled drydocks as part of our cost cutting initiatives. Eventually, the drydock will be required before the vessel can return to active service.
In connection with new long-term contracts, incremental costs incurred that directly relate to mobilization of a vessel from one region to another are deferred and recognized over the primary contract term. Should the contract be terminated by either party prior to the end of the contract term, the unamortized deferred amount would be immediately expensed. In contrast, costs of relocating vessels from one region to another without a contract are expensed as incurred.
Deferred financing costs are capitalized and amortized over the expected term of the related debt. Should the specific debt terminate by means of payment in full, tender offer or lender termination, the associated deferred financing costs would be immediately expensed.
Allowance for Doubtful Accounts
Our customers are primarily major and independent oil and gas companies, national oil companies and oil service companies. Given our experience where our historical losses on accounts receivable have been insignificant and our belief that our related credit risks are minimal, our major and independent oil and gas company and oil service company customers are generally granted credit on customary business terms. Our exposure to foreign government-owned and controlled oil and gas companies, as well as companies that provide logistics, construction or other services to such oil and natural gas companies, may result in longer payment terms; however, we monitor our aged accounts receivable on an ongoing basis and provide an allowance for doubtful accounts in accordance with our written policy. This formalized policy requires a critical review of our aged accounts receivable to evaluate the collectability of our receivables and to establish appropriate allowances for bad debt. This policy states that a reserve for bad debt is to be established if an account receivable is outstanding a year or longer. The amount of such reserve to be established by management is based on the facts and circumstances relating to the particular customer.
Historically, we have collected substantially all of our accounts receivable balances. However, we have recently seen an increase in uncollectible amounts from certain customers. At December 31, 2016, 2015 and 2014 we provided an allowance for doubtful accounts of $2.5 million, $1.5 million and $2.5 million, respectively. Additional allowances for doubtful accounts may be necessary as a result of our ongoing assessment of our customers’ ability to pay, particularly in the event of further deteriorating industry conditions. Since amounts due from individual customers can be significant, future adjustments to our allowance for doubtful accounts could be material if one or more individual customer balances are deemed uncollectible. If an account receivable were deemed uncollectible and all reasonable collection efforts were exhausted, the balance would be removed from accounts receivable and the allowance for doubtful accounts.
Commitments and Contingencies
We have contingent liabilities and future claims for which we have made estimates of the amount of the eventual cost to liquidate these liabilities or claims. These liabilities and claims may involve threatened or actual litigation where damages have not been specifically quantified but we have made an assessment of our exposure and recorded a provision in our accounts for the expected loss. Other claims or liabilities, including those related to taxes in foreign jurisdictions, may be estimated based on our experience in these matters and, where appropriate, the advice of outside counsel or other outside experts. Upon the ultimate resolution of the uncertainties surrounding our estimates of contingent liabilities and future claims, our future reported financial results will be impacted by the difference, if any, between our estimates and the actual amounts paid to settle the liabilities. In addition to estimates related to litigation and tax liabilities, other examples of liabilities requiring estimates of future exposure include contingencies arising out of acquisitions and divestitures. We determine our contingent liabilities based on the most recent information available to us at the time of such determination regarding the nature of the exposure. Such exposures change from period to period based upon updated relevant facts and circumstances, which can cause the estimates to change. In the recent past, our estimates for contingent liabilities have been sufficient to cover the actual amount of our exposure.
Multi-employer Pension Obligation
Certain of our current and former U.K. subsidiaries are participating in a multi-employer retirement fund known as the Merchant Navy Officers Pension Fund, or MNOPF. At December 31, 2016, we had accrued $2.6 million related to this liability, which reflects all obligations assessed on us by the fund’s trustee as of such date. We continue to have employees who participate in the MNOPF and will as a result continue to make routine payments to the fund as those employees accrue additional benefits over time. The status of the fund is calculated by an actuarial firm every three years. The last assessment was completed in March 2015 and resulted in a significantly improved funding position, mainly due to hedging the interest rate and inflation risk, to between 65% and 80%. The reported net deficit of the fund at March 31, 2015 was $7.5 million and, as a result, the MNOPF trustee did not propose to collect any additional deficit contributions related to the new deficit. The amount and timing of additional potential future obligations relating to underfunding depend on a number of factors, but principally on future fund performance and the underlying actuarial assumptions. Our share of the fund’s deficit is dependent on a number of factors including future actuarial valuations, asset performance, the number of participating employers, and the final method used in allocating the required contribution among participating employers. In addition, our obligation could increase if other employers no longer participated in the plan. In the years ended December 31, 2016, 2015 and 2014 we made contributions to the plan of $0.4 million, $0.4 million and $0.7 million, respectively. Our contributions do not make up more than five percent of total contributions to the plan.
In addition, we participate in the Merchant Navy Ratings Pension Fund, or MNRPF, in a capacity similar to our participation in the MNOPF. Prior to 2013, we were not required to contribute to any deficit in the MNRPF. Due to a change in the plan rules, however, we were advised that we would be required to make contributions beginning in 2013. An actuarial valuation was completed as of March 31, 2014 and deficit notices were communicated in the third quarter of 2015. Our share of the deficit was calculated at $2.2 million, of which we paid $1.9 million in October 2015 and $0.3 million in October 2016. During 2016, we accrued amounts in respect of future deficit contributions. As of December 31, 2016, the amount of this accrual was $1.1 million.
Off-Balance Sheet Arrangements
At December 31, 2016 and 2015, we had no off-balance sheet debt or other arrangements required to be disclosed in this report.
Consolidated Results of Operations
Comparison of Fiscal Years Ended December 31, 2016 and December 31, 2015
Our consolidated revenue decreased from $274.8 million in 2015 to $123.7 million in 2016, a decrease of $151.1 million or 55.0%. For the year ended December 31, 2016, we had a net loss of $203.0 million, or $8.09 per share, compared to a net loss of $215.2 million, or $8.70 per share, for the year ended December 31, 2015.
In late 2014, the oil and natural gas industry entered a downturn precipitated by falling oil prices. The oil price decline had a significant negative effect on the demand for offshore supply vessels and, consequently, there has been substantial pressure on day rates and utilization. In 2016, overall fleet utilization decreased by 23.9% which decreased revenue by $113.1 million, while day rates decreased by $5,253 per day contributing to a decrease in revenue of $29.8 million. The continued strength of the U.S. Dollar caused a further decrease in revenue of $9.7 million, as a large portion of our revenue is earned in foreign currencies. Partially offsetting these decreases was an increase in capacity of $1.0 million. The capacity increase was related to the addition of one new-build vessel in 2016 and one additional work day during 2016, partially offset by the sale of four older vessels during the year. Our total fleet size decreased from an average of 71.4 vessels during 2015 to an average of 69.0 vessels during 2016.
|
Year Ended December 31, |
||||||||||||
|
Increase |
||||||||||||
|
2016 |
2015 |
(Decrease) |
||||||||||
|
(Dollars in thousands) |
||||||||||||
|
Average Rate Per Day Worked (a) (b): |
||||||||||||
|
North Sea (c) |
$ | 11,960 | $ | 16,991 | $ | (5,031 | ) | |||||
|
Southeast Asia ( c) |
7,291 | 11,471 | (4,180 | ) | ||||||||
|
Americas ( c) |
10,441 | 17,128 | (6,687 | ) | ||||||||
|
Overall Utilization (a) (b): |
||||||||||||
|
North Sea |
66.8 | % | 80.5 | % | (13.7 | )% | ||||||
|
Southeast Asia |
42.5 | % | 64.2 | % | (21.7 | )% | ||||||
|
Americas |
20.7 | % | 52.1 | % | (31.4 | )% | ||||||
|
Average Owned or Chartered Vessels (a) (d): |
||||||||||||
|
North Sea |
25.7 | 28.4 | (2.7 | ) | ||||||||
|
Southeast Asia |
12.0 | 13.0 | (1.0 | ) | ||||||||
|
Americas |
31.3 | 30.0 | 1.3 | |||||||||
|
Total |
69.0 | 71.4 | (2.4 | ) | ||||||||
|
(a) |
Owned vessels. |
|
(b) |
Average rate per day worked is defined as total charter revenues divided by number of days worked. Overall utilization rate is defined as the total number of days worked divided by the total number of days of availability in the period. |
|
(c) |
Revenues for vessels in our North Sea fleet are primarily earned in GBP, NOK and Euros, and have been converted to U.S. Dollars at the average exchange rate (U.S. Dollar/GBP, U.S. Dollar/NOK and U.S. Dollar/Euro) for the periods indicated below. Payment for vessels in our Americas fleet can be earned in other currencies, including the Brazilian Reais (or BRL). |
|
Year Ended December 31, |
||||||||
|
2016 |
2015 |
|||||||
|
$1 US=GBP |
0.738 | 0.654 | ||||||
|
$1 US=NOK |
8.395 | 8.048 | ||||||
|
$1 US=Euro |
0.903 | 0.901 | ||||||
|
$1 US=BRL |
3.467 | 3.277 | ||||||
|
$1 US=SGD |
1.380 | 1.374 | ||||||
|
(d) |
Adjusted for vessel additions and dispositions occurring during each period. |
During 2016 we continued cost saving initiatives that were started in 2015, including the additional reduction of onshore staffing levels. These initiatives continued to significantly decrease our operating costs in 2016. Direct operating expenses decreased $86.7 million from 2015 to 2016, drydock expense decreased $10.7 million, and general and administrative expenses decreased $9.6 million. Depreciation expense decreased $14.4 million due to the sale of seven older vessels during 2015 and 2016, for which we recognized a loss of $1.2 million and $8.6 million, respectively. During 2016 we recognized impairment charges of $162.8 million, a $10.7 million increase from the 2015 impairment charge of $152.1 million. These impairment charges were related to the write-down of certain assets as described in Note 3 to our Consolidated Financial Statements in Part II, Item 8.
Other expenses decreased by $26.2 million in 2016 compared to 2015. The change is due primarily to a $35.9 million gain related to the purchase in the open market of $69.4 million in face value of our Senior Notes during the 2016 period. Interest expense decreased $3.5 million, while other expenses increased by $12.6 million, due largely to other financing costs of $11.3 million related to an attempted capital restructuring and an increased foreign currency expense from year to year.
During 2016 we had an income tax benefit of $39.5 million, compared to a benefit of $5.6 million for 2015. The 2016 effective tax rate was negative (16.3)% and the 2015 effective tax rate was also negative (2.6)%. Tax expense from year to year can vary based on the mix of profitability and taxing jurisdictions.
Comparison of Fiscal Years Ended December 31, 2015 and December 31, 2014
Our consolidated revenue decreased from $495.8 million in 2014 to $274.8 million in 2015, a decrease of $221.0 million or 44.6%. For the year ended December 31, 2015, we had a net loss of $215.2 million, or $8.70 per share, compared to net income of $62.4 million, or $2.39 per share, for the year ended December 31, 2014.
In late 2014, the oil and natural gas industry entered a downturn precipitated by falling oil prices. The oil price decline had a significant negative effect on the demand for offshore supply vessels and, consequently, there has been substantial pressure on day rates and utilization. In 2015, overall fleet utilization decreased by 19.9% or $123.8 million, while day rates decreased by $5,476 per day or $73.2 million. The strength of the U.S. Dollar caused a further decrease in revenue of $23.6 million, as a large portion of our revenue is earned in foreign currencies. An additional decrease of $0.4 million resulted from the net effect of a change in capacity as the sale of seven older vessels during 2014 and 2015 was partially offset by the acquisition of one vessel and the delivery of three new-builds. Our total fleet size decreased from an average of 74.3 vessels during 2014 to an average of 71.4 vessels during 2015.
|
Year Ended December 31, |
||||||||||||
|
Increase |
||||||||||||
|
2015 |
2014 |
(Decrease) |
||||||||||
|
(Dollars in thousands) |
||||||||||||
|
Average Rate Per Day Worked (a) (b): |
||||||||||||
|
North Sea (c) |
$ | 16,991 | $ | 22,782 | $ | (5,791 | ) | |||||
|
Southeast Asia ( c) |
11,471 | 15,210 | (3,739 | ) | ||||||||
|
Americas ( c) |
17,128 | 23,248 | (6,120 | ) | ||||||||
|
Overall Utilization (a) (b): |
||||||||||||
|
North Sea |
80.5 | % | 89.0 | % | (8.5 | )% | ||||||
|
Southeast Asia |
64.2 | % | 79.1 | % | (14.9 | )% | ||||||
|
Americas |
52.1 | % | 85.0 | % | (32.9 | )% | ||||||
|
Average Owned or Chartered Vessels (a) (d): |
||||||||||||
|
North Sea |
28.4 | 30.4 | (2.0 | ) | ||||||||
|
Southeast Asia |
13.0 | 15.2 | (2.2 | ) | ||||||||
|
Americas |
30.0 | 28.7 | 1.3 | |||||||||
|
Total |
71.4 | 74.3 | (2.9 | ) | ||||||||
|
(a) |
Owned vessels. |
|
(b) |
Average rate per day worked is defined as total charter revenues divided by number of days worked. Overall utilization rate is defined as the total number of days worked divided by the total number of days of availability in the period. |
|
(c) |
Revenues for vessels in our North Sea fleet are primarily earned in GBP, NOK and Euros, and have been converted to U.S. Dollars at the average exchange rate (U.S. Dollar/GBP, U.S. Dollar/NOK and U.S. Dollar/Euro) for the periods indicated below. Payment for vessels in our Americas fleet can be earned in other currencies, including the Brazilian Reais (or BRL). |
|
Year Ended December 31, |
||||||||
|
2015 |
2014 |
|||||||
|
$1 US=GBP |
0.654 | 0.607 | ||||||
|
$1 US=NOK |
8.048 | 6.285 | ||||||
|
$1 US=Euro |
0.901 | 0.753 | ||||||
|
$1 US=BRL |
3.277 | 2.347 | ||||||
|
$1 US=SGD |
0.374 | 1.267 | ||||||
|
(d) |
Adjusted for vessel additions and dispositions occurring during each period. |
In response to the pressure on our revenues, we implemented aggressive cost saving initiatives, including stacking some vessels. The major cost saving attributable to stacking vessels is the reduction of crew wages and travel expense. In addition, we have deferred drydock costs on these stacked vessels even though these costs will eventually be required to return the vessels to active service. These initiatives have significantly decreased our operating costs. Concurrently, we reduced our onshore staffing levels globally. As a result, direct operating expenses decreased $66.9 million from 2014 to 2015, drydock expense decreased $9.5 million, and general and administrative expenses decreased $15.4 million. Depreciation expense decreased $2.7 million due to the sale of three older vessels during 2015, for which we recognized a loss of $1.2 million. During the third quarter of 2015 we recognized impairment charges of $152.1 million related to the write-down of certain assets as described in Note 3 to our Consolidated Financial Statements in Part II, Item 8.
Other expenses increased by $7.3 million in 2015 compared to 2014. This increase was primarily due to higher interest expense of $7.6 million year over year related to the decrease in capitalized interest as we wound down our new-build program and acceleration of the amortization of debt issuance costs resulting from the modification of our debt facility agreements during 2015. Other expense increased $0.1 million due largely to an increase in foreign currency losses in 2015. Partially offsetting these expenses was a gain on extinguishment of debt of $0.5 million recognized during 2015.
The income tax benefit for 2015 was $5.6 million, compared to a tax expense of $9.3 million for 2014. The 2015 effective tax rate was a negative (2.6)% and the 2014 effective tax rate was 12.9%. Tax expense from year to year can vary based on the mix of profitability and taxing jurisdictions.
Segment Results
As discussed in “General Business” included in Part I, Item 1 “Business,” we have three operating segments: the North Sea, Southeast Asia and the Americas, each of which is considered a reportable segment under FASB ASC 280. The majority of our revenue is derived from our long-lived assets located in foreign jurisdictions. We had $28.5 million in revenue in 2016 and $371.6 million in long-lived assets as of December 31, 2016 attributed to the United States, our country of domicile.
Management evaluates segment performance primarily based on operating income. Cash and debt are managed centrally, and since the regions do not manage those items, the gains and losses on foreign currency re-measurements associated with these items are excluded from operating income. Management considers segment operating income to be a good indicator of each segment’s operating performance from its continuing operations, because it represents the results of the ownership interest in operations without regard to financing methods or capital structures. Each segment’s operating income is summarized in the following table, and further detailed in the following paragraphs.
Operating Income (Loss) by Operating Segment
|
Year Ended December 31, |
||||||||||||
|
2016 |
2015 |
2014 |
||||||||||
|
(In thousands) |
||||||||||||
|
North Sea |
$ | (10,686 | ) | $ | (8,774 | ) | $ | 48,062 | ||||
|
Southeast Asia |
(64,784 | ) | 29 | 29,723 | ||||||||
|
Americas |
(133,884 | ) | (147,577 | ) | 54,097 | |||||||
|
Total reportable segment operating income (loss) |
(209,354 | ) | (156,322 | ) | 131,882 | |||||||
|
Other |
(21,971 | ) | (27,230 | ) | (30,217 | ) | ||||||
|
Total reportable segment and other operating income (loss) |
$ | (231,325 | ) | $ | (183,552 | ) | $ | 101,665 | ||||
North Sea Region:
|
Year Ended December 31, |
||||||||||||
|
2016 |
2015 |
2014 |
||||||||||
|
(In thousands) |
||||||||||||
|
Revenue |
$ | 76,759 | $ | 142,168 | $ | 225,253 | ||||||
|
Direct operating expenses |
45,872 | 84,474 | 113,140 | |||||||||
|
Drydock expense |
2,549 | 4,112 | 9,094 | |||||||||
|
General and administrative expense |
6,961 | 9,469 | 17,226 | |||||||||
|
Depreciation and amortization expense |
24,157 | 28,724 | 32,440 | |||||||||
|
Impairment charge |
1,986 | 22,919 | 8,551 | |||||||||
|
(Gain) loss on sale of assets and other |
5,920 | 1,244 | (3,260 | ) | ||||||||
|
Operating income (loss) |
$ | (10,686 | ) | $ | (8,774 | ) | $ | 48,062 | ||||
Comparison of Fiscal Years Ended December 31, 2016 and December 31, 2015
Revenue for the North Sea region decreased $65.4 million, or 46.0%, from $142.2 million in 2015 to $76.8 million in 2016. Utilization decreased from 80.5% during 2015 to 66.8% during 2016, causing a decrease in revenue of $35.9 million. Day rates decreased by $5,031 per day, from $16,991 in 2015 to $11,960 in 2016. This decrease accounted for $17.0 million of the revenue decrease. The continued strength of the U.S. Dollar added $9.7 million to the decrease in revenue. In addition, the sale of four vessels during 2015 and 2016 and the transfer of two vessels to another region during the third quarter of 2016 resulted in a decrease in revenue of $3.4 million. The average fleet size in the region decreased from 28.5 vessels in 2015 to 25.7 vessels in 2016. Operating loss increased by $1.9 million, from $8.8 million in 2015 to $10.7 million in 2016. Excluding the impairment charges of $22.9 million and $2.0 million recorded in 2015 and 2016, respectively, the decrease in operating income would have been $22.8 million. The decrease in revenue was the main contributing factor in the decrease in operating income. In addition, during 2016 we recognized a loss on sale of assets of $5.9 million, compared to a loss of $1.2 million during 2015. Offsetting these decreases were reductions in direct operating expenses of $38.6 million, drydock expense of $1.6 million, general and administrative expenses of $2.5 million, and depreciation expense of $4.6 million. All these reductions are directly attributable to cost cutting measures implemented during 2015 and the decrease in average fleet size.
Comparison of Fiscal Years Ended December 31, 2015 and December 31, 2014
Revenue for the North Sea region decreased $83.1 million, or 36.9%, from $225.3 million in 2014 to $142.2 million in 2015. A decrease in average day rate of $5,791 per day accounted for $33.4 million of this decrease in revenue and was the largest contributor to the decrease. In addition, a decrease in utilization of 8.5% caused a decrease in revenue of $23.7 million. The strength of the U.S. Dollar, particularly against the Norwegian Kroner, added $21.5 million to the decrease in revenue. The effect of the sale of four older vessels, offset somewhat by the addition of an acquired vessel and two new-build vessels, reduced revenue an additional $4.5 million. The average fleet size in the region decreased from 30.4 vessels in 2014 to 28.5 vessels in 2015. The operating loss of $8.8 million in 2015 was a decrease of $56.8 million from the 2014 result. This was caused primarily by the decrease in revenue, partially offset by decreases in direct operating expenses of $28.7 million, drydock expense of $5.0 million, general and administrative expenses of $7.8 million, and depreciation expense of $3.7 million. All these decreases are directly attributable to cost cutting measures implemented during 2015 and the decrease in average fleet size. We recognized an impairment charge of $22.9 million related to goodwill in 2015 and an impairment charge of $8.6 million related to certain equipment in 2014. In addition, during 2015 we recognized a loss on sale of assets of $1.2 million, compared to a gain of $3.3 million during 2014.
Southeast Asia Region:
|
Year Ended December 31, |
||||||||||||
|
2016 |
2015 |
2014 |
||||||||||
|
(In thousands) |
||||||||||||
|
Revenue |
$ | 14,069 | $ | 35,524 | $ | 64,753 | ||||||
|
Direct operating expenses |
11,308 | 16,483 | 22,831 | |||||||||
|
Drydock expense |
588 | 4,356 | 4,400 | |||||||||
|
General and administration expense |
5,218 | 4,296 | 5,387 | |||||||||
|
Depreciation and amortization expense |
8,654 | 10,419 | 11,168 | |||||||||
|
Impairment charge |
50,437 | - | 444 | |||||||||
|
(Gain) loss on sale of assets and other |
2,648 | (59 | ) | (9,200 | ) | |||||||
|
Operating income (loss) |
$ | (64,784 | ) | $ | 29 | $ | 29,723 | |||||
Comparison of Fiscal Years Ended December 31, 2016 and December 31, 2015
Revenues for the Southeast Asia based fleet decreased by $21.5 million to $14.1 million in 2016. Utilization decreased from 64.2% in 2015 to 42.5% in 2016, decreasing revenue by $13.8 million. Day rates decreased from $11,471 during 2015 to $7,291 for 2016, causing a further reduction in revenue of $7.7 million. Although we sold three vessels from the region during the second half of 2016, capacity did not change as the sold vessels had been stacked for most of the year. However, average fleet size decreased from 13.0 vessels in 2015 to 12.0 vessels in 2016. Operating income for the region decreased by $64.8 million. During 2016, we recorded an impairment charge of $50.4 million. Excluding this charge, the decrease in operating income for the region was $14.4 million. The decrease in revenue was the largest contributor to the decrease in operating income. In addition, an increase in general and administrative expenses of $0.9 million, mainly related to an increase in bad debt expense, added to the reduction. We also incurred a loss of $2.6 million on the sale of three older vessels. Partially offsetting these expenses and losses were cost cutting measures undertaken during 2015, the decrease in fleet size, and the effect of the impairment charges to the vessel net book value, the overall effect of which was a decrease in operating expenses of $5.2 million, drydock expense of $3.8 million, and depreciation and amortization of $1.8 million.
Comparison of Fiscal Years Ended December 31, 2015 and December 31, 2014
Revenues for the Southeast Asia based fleet decreased by $29.2 million to $35.5 million in 2015. Utilization decreased from 79.1% in 2014 to 64.2% in 2015, decreasing revenue by $17.0 million. Day rates decreased from $15,210 during 2014 to $11,471 for 2015, reducing revenue by $7.9 million. In addition, the effect of capacity changes decreased revenue by $4.3 million resulting from the full year effect of the sale of three older vessels during 2014. Average fleet size decreased by 2.2 vessels, from 15.2 vessels in 2014 to 13.0 vessels in 2015. Operating income decreased by $29.7 million due mainly to the decrease in revenue. Partially offsetting this decrease, cost cutting measures undertaken during 2015 and the decrease in fleet size decreased operating expenses by $6.3 million, general and administrative expenses by $1.1 million, and depreciation and amortization by $0.7 million. Drydock expense remained unchanged at $4.4 million during both years. In 2014, we recorded impairment related to certain equipment. There was no impairment charge in 2015, improving operating results by $0.4 million. The above expense decreases were partially offset by a gain on sale of $0.1 million recognized during 2015.
Americas Region:
|
Year Ended December 31, |
||||||||||||
|
2016 |
2015 |
2014 |
||||||||||
|
(In thousands) |
||||||||||||
|
Revenue |
$ | 32,891 | $ | 97,114 | $ | 205,763 | ||||||
|
Direct operating expenses |
25,985 | 68,880 | 100,273 | |||||||||
|
Drydock expense |
1,525 | 6,919 | 11,346 | |||||||||
|
General and administrative expense |
6,876 | 9,906 | 12,837 | |||||||||
|
Depreciation and amortization expense |
22,008 | 29,827 | 28,789 | |||||||||
|
Impairment charge |
110,385 | 129,184 | - | |||||||||
|
(Gain) loss on sale of assets and other |
(4 | ) | (25 | ) | (1,579 | ) | ||||||
|
Operating income (loss) |
$ | (133,884 | ) | $ | (147,577 | ) | $ | 54,097 | ||||
Comparison of Fiscal Years Ended December 31, 2016 and December 31, 2015
Revenue for the Americas region decreased by $64.2 million in 2016, or 66.1%, to $32.9 million. Utilization for the region decreased from 52.1% in 2015 to 20.7% in 2016, resulting in a decrease in revenue of $63.4 million. Day rates decreased from $17,128 in 2015 to $10,441 in 2016, contributing $5.2 million to the revenue decrease. Partially offsetting these decreases was an increase of $4.4 million related to the delivery of one new-build vessel and the transfer of two vessels in from another region during 2016. Average fleet size increased from 30.0 vessels in 2015 to 31.3 vessels in 2016. During 2016 the region had an operating loss of $133.9 million, compared to a loss of $147.6 million during 2015, an increase of $13.7 million. During 2016 and 2015, we recorded impairment charges of $110.4 million and $129.2 million, respectively. Excluding these charges, the decrease in operating income was $5.1 million. The decrease in revenue was the main contributor to the decrease in operating income. Partially offsetting the decrease in revenue were decreases in direct operating expenses of $42.9 million, drydock expense of $5.4 million, general and administrative expenses of $3.0 million, and depreciation and amortization of $7.8 million. These decreases were the direct result of cost cutting measures undertaken in early 2015, and the effect of the impairment charges to the vessel net book values.
Comparison of Fiscal Years Ended December 31, 2015 and December 31, 2014
Revenue for the Americas region decreased by $108.6 million in 2015, or 52.8%, to $97.1 million. Utilization for the region decreased from 85.0% in 2014 to 52.1% in 2015, resulting in a decrease in revenue of $83.1 million. Day rates decreased from $23,248 in 2014 to $17,128 in 2015, contributing $31.9 million to the revenue decrease. The strength of the U.S. Dollar during 2015 caused a further decrease in revenue of $2.1 million. Partially offsetting these decreases was an increase of $8.5 million related to the full year effect of the delivery of one new-build vessel during 2014 and an additional new-build in early 2015. Average fleet size increased from 28.7 vessels in 2014 to 30.0 vessels in 2015. During 2015 the region had an operating loss of $147.6 million, compared to operating income of $54.1 million during 2014, a decrease of $201.7 million. Included in the 2015 operating loss were impairment charges of $129.2 million related to the write down of U.S. long lived and intangible assets. Excluding these charges, the decrease in operating income was $72.5 million. Partially offsetting the decrease in revenue were decreases in direct operating expenses of $31.4 million, drydock expense of $4.4 million, and general and administrative expenses of $2.9 million. These decreases were the direct result of cost cutting measures undertaken in early 2015. Depreciation and amortization expense increased by $1.0 million due to the addition of the two new-builds mentioned above. During 2014 we recognized a gain on sale of assets of $1.6 million compared to no such gain during 2015.
Liquidity, Capital Resources and Financial Condition
Our ongoing liquidity requirements are generally associated with our need to service debt, fund working capital, maintain our fleet, and, when market conditions are favorable, finance the construction of new vessels and acquire or improve equipment or vessels. Bank financing, proceeds from the issuance of debt and equity, and internally generated funds have historically provided funding for these activities. Internally generated funds are directly related to fleet activity and vessel day rates, which are generally dependent upon the demand for our vessels which is ultimately determined primarily by the supply and demand for offshore drilling for crude oil and natural gas.
Industry Conditions
The ongoing and sustained decline in the price of oil that began in 2014 has materially and adversely affected our results of operations. These lower commodity prices have negatively impacted revenues, earnings and cash flows, and further sustained low oil and natural gas prices could have a material adverse effect on our liquidity position. This downturn has also impacted the operational plans for the major oil companies, resulting in reduced expenditures for exploration and production activities, and consequently has adversely affected the drilling and support service sector. As a result, we experienced a significant negative impact on day rates and utilization starting in 2015 that is continuing into 2017. In response to the downturn and the lower day rates, we have made changes to our cost structure, particularly to our onshore and offshore compensation and staffing. We are continuing to adjust staffing and compensation levels and more closely control maintenance and outside services costs. We have stacked some vessels, significantly reducing variable costs associated with such vessels. We are required to make expenditures for the certification and maintenance of our vessels. We expect to make $5.6 million in drydocking expenditures during 2017. As a result of the current market downturn we have taken some vessels out of service and deferred a number of drydocks as part of our cost cutting initiatives. The deferred drydocks will eventually be required prior to returning the vessels to active service.
During 2015, as a result of the reduction in our revenues, we determined to repatriate all future foreign earnings and $200.0 million of prior earnings of certain of our non-U.S. subsidiaries, thereby reducing our total permanently reinvested earnings. During 2016, we determined to repatriate an additional $40.0 million of prior earnings of certain of our non-U.S. subsidiaries. This resulted in a non-cash tax charge in 2016 of approximately $14.0 million. We have not provided for U.S. deferred taxes on the remaining permanently reinvested earnings of approximately $565.3 million at December 31, 2016. If these amounts were repatriated we would owe U.S. income taxes at the U.S. statutory tax rate minus applicable foreign tax credits. As of December 31, 2016 we had approximately $8.6 million of cash held by our foreign subsidiaries which would be subject to U.S. tax upon repatriation.
Construction of New Vessels
At December 31, 2015, we had two vessels under construction in the U.S. that were significantly delayed. In March 2016, we resolved certain matters under dispute with the shipbuilder and reset the contract schedules so that we would take delivery of the first vessel in mid-2016 and the second vessel in mid-2017, at which time a final payment of $26.0 million would be due. We took delivery of the first of these vessels during the second quarter of 2016. Under the settlement, we can elect not to take delivery of the second vessel and forego the final payment, in which case the shipbuilder will retain the vessel.
We had a vessel under construction in Norway that was scheduled to be completed and delivered during the first quarter of 2016; however, in the fourth quarter of 2015, we amended our contract with the shipbuilder to delay delivery of the vessel until January 2017. Concurrently, in order to delay the payment of a substantial portion of the construction costs, we agreed to pay monthly installments through May 2016 totaling 92.2 million NOK (or approximately $11.0 million) and to pay a final installment on delivery in January 2017 of 195.0 million NOK (or approximately $23.3 million at delivery). We paid such final installment and took delivery of this vessel in January 2017.
Cash and Working Capital
At December 31, 2016, our cash on hand totaled $8.8 million and net working capital was $11.0 million. The following table shows cash from operating, investing and financing activities:
|
Year Ended December 31, |
||||||||
|
2016 |
2015 |
|||||||
| (in millions) | ||||||||
|
Net cash provided by (used in) operating activities |
$ | (23.3 | ) | $ | 43.4 | |||
|
Net cash used in investing activities |
(9.7 | ) | (22.8 | ) | ||||
| Net cash provided by (used in) financing activities | 20.2 | (47.3 | ) | |||||
|
Net decrease in cash and cash equivalents |
$ | (12.8 | ) | $ | (26.7 | ) | ||
Operating Activities
Net cash used in operating activities for the year ended December 31, 2016 was $23.3 million compared to $43.4 million cash provided by operating activities for the year ended December 31, 2015. The decrease was due primarily to lower revenue in 2016.
Investing Activities
Net cash used in investing activities for the year ended December 31, 2016 was $9.7 million compared to $22.8 million for the year ended December 31, 2015. The decrease in cash used in investing activities in 2016 was primarily due to less activity in our new build program.
Financing Activities
Net cash provided by financing activities for the year ended December 31, 2016 was $20.2 million compared to $47.3 million used in financing activities for the year ended December 31, 2015. The increase in cash provided by financing activities in 2016 was due to lower repayments of borrowings in 2016, offset by the repurchases of Senior Notes and the incurrence of other financing costs related to the attempted debt and equity restructuring that we launched in the fourth quarter of 2016.
Resources and Liquidity
We continued to incur significant losses from operations and had negative cash flows from operating activities for the year ended December 31, 2016. We expect to continue to incur losses from operations and generate negative cash flows from our operating activities which could also cause our vendors to require cash prepayment before goods are delivered and services are performed. These expectations and other liquidity risks described in this report raise substantial doubt about whether we will be able to meet our obligations as they become due within one year after the date of this report.
We are highly leveraged and had approximately $483.3 million of debt as of December 31, 2016, including $429.6 million outstanding under our unsecured Senior Notes described below, $49.0 million outstanding under our secured Multicurrency Facility Agreement described below and $11.2 million outstanding under our secured Norwegian Facility Agreement described below. See “– Long-Term Debt.” Our revolving credit facilities and the indenture governing our Senior Notes contain certain financial and other covenants that are more fully described below under “– Long-Term Debt” and in Note 6 to our Consolidated Financial Statements included in Part II, Item 8. At December 31, 2016, we had an aggregate of approximately $94.0 million of borrowing capacity, net of standby letters of credit, under our Multicurrency Facility Agreement and Norwegian Facility Agreement and we had approximately $8.8 million of cash on hand.
At December 31, 2016, we were in compliance with all financial covenants set forth in our revolving credit facilities and the indenture governing our Senior Notes; however, we are forecasting that for the quarter ending March 31, 2017, we will no longer be in compliance with the minimum consolidated adjusted EBITDA requirement contained in the Multicurrency Facility Agreement and the Norwegian Facility Agreement. Absent waivers or cures, non-compliance with such covenants would constitute an event of default under the Multicurrency Facility Agreement and the Norwegian Facility Agreement. As a result, all indebtedness under the Multicurrency Facility Agreement and the Norwegian Facility Agreement could be declared immediately due and payable upon the occurrence of such event of default, subject to any available cure periods. It is possible that we could obtain waivers from our lenders; however, our expectations concerning future losses from operations and cash flows and other liquidity risks raise substantial doubt about whether we will be able to meet our obligations as they become due within one year after the date of this report.
We also have not paid the $13.7 million interest payment due March 15, 2017 on our Senior Notes and, as provided for in the indenture governing the Senior Notes, have entered into the 30-day grace period to make such payment. Failure to pay this amount on March 15, 2017 would constitute an event of default under the indenture governing the Senior Notes if the payment is not made within 30 days of such date and would result in a cross-default under the Multicurrency Facility Agreement and the Norwegian Facility Agreement. As a result of these factors and the additional matters discussed below, as well as the continued downturn in the oil and gas industry and the decrease in offshore oil and natural gas exploration activities, among others, there exists substantial doubt whether we will be able to continue as a going concern.
Since December 31, 2016, we have made additional borrowings under our revolving credit facilities and as of March 15, 2017, the amount outstanding under our Multicurrency Facility Agreement had increased to approximately $72.0 million and the amount outstanding under our Norwegian Facility Agreement had increased to approximately $35.0 million. As of March 15, 2017, we had approximately $25.8 million of cash on hand. On March 8, 2017, we entered into an agreement with the agent under our Multicurrency Facility Agreement that prohibits us from requesting any additional loans under the Multicurrency Facility Agreement without the prior written consent of the agent (acting upon the instruction of all the lenders following unanimous consent). In this agreement, the lenders agreed to extend additional revolving loans in the aggregate principal amount of $10.0 million subject to certain conditions precedent, including payment by us of certain fees and retainers of a financial advisor and counsel for the agent, and the lenders agreed to waive any default or event of default (no such default or event of default having been admitted by us) arising by virtue of a borrowing request submitted previously by us, which request was deemed to be withdrawn pursuant to the agreement. The lenders funded loans in such amount on March 8, 2017.
Our consolidated financial statements as of and for the year ended December 31, 2016 have been prepared assuming we will continue as a going concern, which contemplates continuity of operations, realization of assets and the satisfaction of liabilities in the normal course of business for the twelve-month period following the date of the consolidated financial statements. However, for the reasons described herein, indebtedness with the stated maturities as summarized in Note 6 to our Consolidated Financial Statements included in Part II, Item 8 is classified as a current liability at December 31, 2016. The report from our independent registered public accounting firm on our consolidated financial statements for the year ended December 31, 2016 includes an uncertainty paragraph that arises from the substantial doubt about our ability to continue as a going concern.
Our Multicurrency Facility Agreement contains requirements that, among other things, require that we deliver an unqualified audit opinion from our auditors that is not subject to a going concern or like qualification or exception. The failure to deliver such an unqualified opinion constitutes an event of default under the Multicurrency Facility Agreement, which allows the lenders thereunder to cancel their commitments, accelerate the indebtedness thereunder and exercise remedies with respect to the collateral securing the Multicurrency Facility Agreement, the effect of which likewise is to cause a cross-default under our Norwegian Facility Agreement permitting the lenders thereunder to cancel their commitments, accelerate the indebtedness thereunder and exercise remedies with respect to the collateral securing the Norwegian Facility Agreement unless a waiver or forbearance is received from the lenders under the Multicurrency Facility Agreement. If the indebtedness under either the Multicurrency Facility Agreement or the Norwegian Facility Agreement is accelerated, it would, subject to a 15-business day cure period, constitute an event of default under the indenture governing our Senior Notes.
On March 14, 2017, we entered into the Support Agreement with the agent under the Multicurrency Facility Agreement in which the lenders agreed to waive the existing or anticipated defaults or events of default under the Multicurrency Facility Agreement listed in the Support Agreement and forbear from exercising rights or remedies under the related finance documents as a result therefrom, for a limited support period. The Support Agreement, and the waiver and forbearance provided for therein, terminates upon the earliest to occur of certain termination events described therein or April 14, 2017. See Part II, Item 9B “Other Information” for a more detailed description of the Support Agreement.
If lenders or noteholders accelerate our outstanding indebtedness, our borrowings will become immediately payable and we will not have sufficient liquidity to repay those accelerated amounts. If we are unable to reach an agreement with lenders and noteholders to address any such defaults, we would likely pursue a variety of solutions that may include strategic and refinancing alternatives through a private restructuring of our indebtedness, seeking additional debt or equity financing, assets sales or a filing under Chapter 11 of the U.S. Bankruptcy Code, which could include a restructuring of our various debt obligations.
We are engaged in discussions with our principal lenders and noteholders to waive covenant breaches, including financial covenants and the inclusion of a going concern qualification in the audit opinion from our auditors, and/or to amend the underlying agreements. Any such amendments and/or waivers would require successful negotiations with our bank group and noteholders, and may require us to make certain concessions under the existing agreements, such as providing additional collateral, paying a higher rate of interest or some combination of these or others. Obtaining covenant relief will require us to reach an agreement that satisfies potentially divergent interests of our lenders and noteholders.
Long-Term Debt
Senior Notes Due 2022
In March and December 2012, we issued $500.0 million aggregate principal amount of 6.375% senior notes due 2022. The Senior Notes pay interest semi-annually on March 15 and September 15. Prior to March 15, 2017, we may redeem some or all of the Senior Notes for cash at a redemption price equal to 100% of their principal amount plus an applicable make-whole premium and accrued and unpaid interest to the redemption date. The make-whole premium is based on the U.S. Treasury Rate plus 50 basis points. On and after March 15, 2017, we may redeem some or all of the Senior Notes at the redemption prices (expressed as percentages of principal amount) equal to 103.188% for the twelve-month period beginning March 15, 2017, 102.125% for the twelve-month period beginning March 15, 2018, 101.063% for the twelve-month period beginning March 15, 2019 and 100.000% beginning March 15, 2020 and thereafter, plus accrued and unpaid interest to the redemption date.
In December 2015, we repurchased in the open market $1.0 million face value of the Senior Notes leaving $499.0 million aggregate principal amount of the Senior Notes outstanding at December 31, 2015. In 2016, we repurchased in the open market $69.4 million face value of the Senior Notes and recorded gains totaling approximately $35.9 million, which gains are included in other income and expense in our consolidated statements of operations.
In conjunction with the Senior Notes offering, we incurred a total of $12.7 million in debt issuance costs. In prior periods, debt issuance costs were included in our consolidated balance sheet under deferred costs and other assets. Under the provisions of FASB Accounting Standard Update No. 2015-03, the unamortized balance in debt issuance costs is included in our consolidated balance sheet as a direct deduction from the face amount of the Senior Notes. This change in accounting principle was applied retrospectively; therefore, the December 31, 2015 presentation of deferred costs and other assets and long term debt in our consolidated financial statements has been adjusted to conform to this standard. The effective interest rate on the Senior Notes, adjusted for the premium and debt issuance costs, is 6.73%.
At December 31, 2016, the fair value of the Senior Notes, based on quoted market prices, was approximately $234.9 million compared to a carrying amount of $429.6 million.
We have not paid the $13.7 million interest payment due March 15, 2017 on our Senior Notes and, as provided for in the indenture governing the Senior Notes, have entered into the 30-day grace period to make such payment. Failure to pay this amount on March 15, 2017 would constitute an event of default under the indenture governing the Senior Notes if the payment is not made within 30 days of such date and would result in a cross-default under the Multicurrency Facility Agreement and the Norwegian Facility Agreement.
Multicurrency Facility Agreement
We are party to a senior secured, revolving multicurrency credit facility, or the Multicurrency Facility Agreement, among GulfMark Offshore, Inc., as guarantor, one of our indirect wholly-owned subsidiaries, GulfMark Americas, Inc., as the Borrower, a group of financial institutions as the lenders and the Royal Bank of Scotland plc, as agent for the lenders, and the other parties thereto. The Multicurrency Facility Agreement has a scheduled maturity date of September 26, 2019 and, as amended, commits the lenders to provide revolving loans of up to $100.0 million at any one time outstanding, subject to certain terms and conditions set forth in the Multicurrency Facility Agreement, and contains a sublimit of $25.0 million for swingline loans and a sublimit of $5.0 million for the issuance of letters of credit. Revolving loans drawn under the Multicurrency Facility Agreement and denominated in U.S. Dollars accrue interest at the London Interbank Offered Rate, or LIBOR, plus an applicable margin which may range from 2.75% to 4.00%, while swingline loans drawn under the Multicurrency Facility Agreement accrue interest at the alternate base rate. The applicable margin is determined by reference to the capitalization ratio calculated as of the last day of the most recent fiscal quarter. The applicable interest rate for overdue amounts increases by an additional 2.00%. The fee for unused commitments is 1.25% per annum. We are subject to certain covenants and other obligations under the Multicurrency Facility Agreement, which include, among others:
● the maintenance of a capitalization ratio not to exceed 60% at the end of each fiscal quarter;
● the maintenance of a minimum consolidated interest coverage ratio, for any period of four consecutive fiscal quarters, of 1.5 to 1.0 beginning on September 30, 2017 and increasing periodically thereafter;
● the maintenance of a minimum collateral to debt ratio of 3.0 to 1.0 at the end of each fiscal quarter;
● the maintenance of a minimum collateral to commitments ratio of 2.0 to 1.0 at the end of each fiscal quarter;
● the maintenance of a minimum consolidated adjusted EBITDA, at the end of each fiscal quarter, of $20.0 million for the twelve-month period ended September 30, 2016, and for each twelve-month period thereafter through the fiscal quarter ending June 30, 2017;
● the maintenance of a minimum liquidity amount of $35.0 million (as determined under the Multicurrency Facility Agreement) at the end of each fiscal quarter;
● the delivery of a monthly information packet to the agent;
● the delivery of an appraised value for each of the collateral vessels to the agent in each fiscal quarter;
● the mandatory prepayment of any loans outstanding if, at the end of a fiscal quarter, we have cash, on a consolidated basis, in excess of $35.0 million;
● a prohibition against drawing loans under the Multicurrency Facility Agreement for the purpose of funding payments on our platform supply vessel, or PSV, delivered by Simek in January 2017;
● the limitation of the amount of cash we may invest for certain capital expenditures, acquisitions, joint ventures, dividends and share repurchases;
● the limitation of acquisitions, mergers, consolidations, joint ventures, changes of business, changes of ownership, indebtedness and asset sales, subject to certain exceptions; and
● the prohibition of liens on certain of our assets, subject to certain exceptions.
We had unamortized fees paid to the arrangers, the agent and the security trustee totaling $2.5 million at December 31, 2016, which fees were amortized into interest cost on a straight-line basis over the life of the Multicurrency Facility Agreement.
The Multicurrency Facility Agreement is secured by 24 vessels owned by the Borrower. The collateral that secures the loans under the Multicurrency Facility Agreement may also secure all of the Borrower’s obligations under any hedging agreements between the Borrower and any lender or other hedge counterparty to the Multicurrency Facility Agreement.
We unconditionally guaranteed all existing and future indebtedness and liabilities of the Borrower arising under the Multicurrency Facility Agreement and other related loan documents. Such guarantee may also cover obligations of the Borrower arising under any hedging arrangements. At December 31, 2016 we had $49.0 million borrowed and outstanding under the Multicurrency Facility Agreement and we were in compliance with all the covenants under the Multicurrency Facility Agreement. The unused borrowing capacity under the Multicurrency Facility Agreement at December 31, 2016, after giving effect to standby letters of credit, was $35.8 million. The weighted average interest rate on our outstanding borrowings under the Multicurrency Facility Agreement was 4.62%.
On March 8, 2017, we entered into an agreement with the agent under our Multicurrency Facility Agreement that prohibits us from requesting any additional loans under the Multicurrency Facility Agreement without the prior written consent of the agent (acting upon the instruction of all the lenders following unanimous consent). In this agreement, the lenders agreed to extend additional revolving loans in the aggregate principal amount of $10.0 million subject to certain conditions precedent, including payment by us of certain fees and retainers of a financial advisor and counsel for the agent, and the lenders agreed to waive any default or event of default (no such default or event of default having been admitted by us) arising by virtue of a borrowing request submitted previously by us, which request was deemed to be withdrawn pursuant to the agreement. The lenders funded loans in such amount on March 8, 2017. In addition, we are obligated to provide the agent certain information including a revised budget, a revised forecast and weekly financial information, in each case by specified deadlines, and to keep the agent and the lenders informed of negotiations and discussions with holders of our indebtedness. The lenders agreed that between the date of the agreement through March 14, 2017, no lender shall, in its capacity as lender, exercise any right of set off, combination of accounts or similar remedy in relation to the cash of the obligors under the Multicurrency Facility Agreement in respect of any amounts that are outstanding or may become outstanding under the Multicurrency Facility Agreement.
On March 14, 2017, we entered into the Support Agreement with the agent under the Multicurrency Facility Agreement in which the lenders agreed to waive the existing or anticipated defaults or events of default under the Multicurrency Facility Agreement listed in the Support Agreement and forbear from exercising rights or remedies under the related finance documents as a result therefrom, for a limited support period. The Support Agreement, and the waiver and forbearance provided for therein, terminates upon the earliest to occur of certain termination events described therein or April 14, 2017. See Part II, Item 9B “Other Information” for a more detailed description of the Support Agreement.
Norwegian Facility Agreement
We are party to a senior secured revolving credit facility, or the Norwegian Facility Agreement, among GulfMark Offshore, Inc., as guarantor, one of our indirect wholly-owned subsidiaries, GulfMark Rederi AS, as the borrower, which we refer to as the Norwegian Borrower, and DNB Bank ASA, a Norwegian bank, as lead arranger and lender, which we refer to as the Norwegian Lender. The Norwegian Facility Agreement has a scheduled maturity date of September 30, 2019 and commits the Norwegian Lender to provide loans of up to an aggregate principal amount of 600.0 million NOK (or approximately $69.4 million at December 31, 2016) at any one time outstanding, subject to certain terms and conditions. Loans under the Norwegian Facility Agreement accrue interest at the Norwegian Interbank Offered Rate, or NIBOR, or, if the loan is denominated in U.S. Dollars, LIBOR, plus an applicable margin which may range from 2.50% to 4.00%, depending on the interest coverage ratio. During the continuance of an event of default, upon notice by the agent under the Norwegian Facility Agreement, the applicable interest rate increases by an additional 2.00%. The fee for unused commitments is 1.25% per annum. We are subject to certain covenants and other obligations under the Norwegian Facility Agreement, which include, among others:
● the maintenance of a capitalization ratio not to exceed 60% at the end of each fiscal quarter;
● the maintenance of a minimum consolidated interest coverage ratio for any period of four consecutive fiscal quarters, of 1.5 to 1.0, beginning at the end of our third fiscal quarter of 2017 and increasing periodically thereafter
● the maintenance of a minimum collateral to debt ratio, as defined, of 3.0 to 1.0 at the end of each fiscal quarter;
● the maintenance of a minimum collateral to commitments ratio, as defined, of 2.0 to 1.0 at the end of each fiscal quarter;
● the maintenance of a minimum consolidated adjusted EBITDA as of the end of each fiscal quarter of $20.0 million for the twelve-month period ended September 30, 2016, and for each twelve-month period thereafter through the fiscal quarter ending June 30, 2017;
● the maintenance of a minimum liquidity amount of $35.0 million at the end of each fiscal quarter;
● the mandatory prepayment of any loans outstanding if, at the end of a fiscal quarter, we have cash, on a consolidated basis, in excess of $35.0 million;
● the mandatory prepayment of any loans outstanding if, at any time, the fleet market value of the vessels securing the Norwegian Facility Agreement is less than 300% of the aggregate outstanding unpaid loans (unless we elect to provide additional security acceptable to the agent in its sole discretion)
● the limitation of mergers, consolidations, divestitures, restructurings and changes of business, subject to certain exceptions;
● the prohibition of liens on certain of our vessels, subject to certain exceptions; and
● the requirement that we remain listed on the New York Stock Exchange or another recognized stock exchange.
We had unamortized fees paid to the arrangers, the agent and the security trustee totaling $1.3 million at December 31, 2016, which fees are being amortized into interest cost on a straight-line basis over the life of the Norwegian Facility Agreement.
The Norwegian Facility Agreement is secured by seven vessels owned by our subsidiary GulfMark UK Ltd. and by four vessels of the Norwegian Borrower and our additional North Sea PSV which was delivered in January 2017. The collateral that secures the loans under the Norwegian Facility Agreement may also secure all of the Norwegian Borrower’s obligations under any hedging agreements between the Norwegian Borrower and the Norwegian Lender or other hedge counterparty to the Norwegian Facility Agreement.
We unconditionally guaranteed all existing and future indebtedness and liabilities of the Norwegian Borrower arising under the Norwegian Facility Agreement and other related loan documents. Such guarantee may also cover obligations of the Norwegian Borrower arising under any hedging arrangements described above. At December 31, 2016, we had $11.2 million borrowed and outstanding under the Norwegian Facility Agreement and we were in compliance with all the covenants under the Norwegian Facility Agreement. The unused borrowing capacity under the Norwegian Facility Agreement at December 31, 2016 was $58.2 million.
At December 31, 2016, the weighted average interest rate on our outstanding borrowings under the Norwegian Facility Agreement was 4.38%.
Stock Repurchases
In December 2012, our Board approved a stock repurchase program for up to a total of $100.0 million of our issued and outstanding Class A common stock. Under the program, repurchases can be made from time to time using a variety of methods, which may include open market purchases or purchases through a Rule 10b5-1 trading plan, or in privately negotiated transactions, all in accordance with SEC and other applicable legal requirements. In late 2012 and early 2013, we repurchased 373,619 shares of our Class A common stock for $13.3 million. In 2014, we repurchased 1,883,648 shares of our Class A common stock for $57.7 million.
We did not repurchase any of our Class A common stock in 2015. Although we did not repurchase any of our Class A common stock pursuant to the stock repurchase program in 2016, we acquired some shares of our Class A common stock in satisfaction of tax withholding obligations in connection with certain payouts under our Deferred Compensation Plan. See “Market for Registrant’s Common Equity, Related Stockholder Matters and Issuer Purchases of Equity Securities – Issuer Repurchases of Equity Securities” included in Part II, Item 5. We were limited under the terms of our Multicurrency Facility Agreement and are limited under our Norwegian Facility Agreement in our ability to make certain payments beyond permitted amounts for share repurchases. See “-- Long-Term Debt.”
Dividends
Our dividend policy is reviewed by the Board at such times as it deems appropriate in light of operating conditions, dividend restrictions of subsidiaries and investors or lenders, financial requirements, general business conditions and other factors it considers relevant. Beginning in December 2012 and for each quarter of 2013 and 2014, we paid a dividend of $0.25 per share ($1.00 per share in December 2012) of our Class A common stock. In February 2015, the Board suspended dividend payments indefinitely. The Board declared no dividends for the years ended December 31, 2015 and 2016.
Pursuant to the terms of the indenture governing our Senior Notes, as further described in Note 6 to our Consolidated Financial Statements in Part II, Item 8, we may be restricted from declaring or paying any future dividends. In addition, we were limited under the terms of our Multicurrency Facility Agreement and are limited under our Norwegian Facility Agreement in our ability to make certain payments beyond permitted amounts for dividends, acquisitions or share repurchases. See “– Long-Term Debt.”
Contractual Obligations
The following table summarizes our contractual obligations at December 31, 2016, and the effect these obligations are expected to have on liquidity and cash flows in future periods (in millions). Long-term debt obligations are shown below according to their stated maturities. All of our long-term obligations are shown as a current liability in our consolidated balance sheet as of December 31, 2016 as a result of an event of default under our Multicurrency Facility Agreement arising from the inclusion of the going concern uncertainty paragraph in the audit opinion from our auditors. Pursuant to the Support Agreement, the lenders agreed to waive the existing or anticipated defaults or events of default under the Multicurrency Facility Agreement listed in the Support Agreement and forbear from exercising rights or remedies under the related finance documents as a result therefrom for a limited support period that terminates upon the earliest to occur of certain termination events described therein or April 14, 2017. See “– Liquidity, Capital Resources and Financial Condition – Long-Term Debt” and “– Resources and Liquidity,” Notes 2 and 6 to our Consolidated Financial Statements in Part II, Item 8 and “Other Information” in Part II, Item 9B.
| Payments Due By Period | ||||||||||||||||||||
|
Contractual Obligations |
Total |
Less than one year |
One to three years |
Three to five years |
Thereafter |
|||||||||||||||
|
Purchase Obligations for New-Build Program |
$ | 23.3 | $ | 23.3 | $ | - | $ | - | $ | - | ||||||||||
|
Repayment of Long-Term Debt |
489.8 | - | 60.2 | - | 429.6 | |||||||||||||||
|
Interest Payments |
157.2 | 31.4 | 61.8 | 54.9 | 9.1 | |||||||||||||||
|
Non-Cancelable Operating Leases |
8.1 | 1.5 | 2.6 | 1.4 | 2.6 | |||||||||||||||
|
Other |
2.1 | 0.5 | 1.1 | 0.5 | - | |||||||||||||||
|
Total |
$ | 680.5 | $ | 56.7 | $ | 125.7 | $ | 56.8 | $ | 441.3 | ||||||||||
Due to the uncertainty with respect to the timing of future cash payments, if any, associated with our unrecognized tax benefits at December 31, 2016 we are unable to make reasonably reliable estimates of cash settlements with the respective taxing authorities. Therefore, $21.1 million of unrecognized tax benefits have been excluded from the contractual obligations table above.
Other Commitments
We execute letters of credit, performance bonds and other guarantees in the normal course of business that ensure our performance or payments to third parties. We had $1.2 million in letters of credit outstanding at December 31, 2016. In the past, no significant claims have been made against these financial instruments. We believe the likelihood of demand for payment is minimal and expect no material cash outlays to occur from these instruments.
Currency Fluctuations and Inflation
A majority of our operations are international; therefore we are exposed to currency fluctuations and exchange rate risks. Charters for vessels in our North Sea fleet are primarily denominated in GBP, with a portion denominated in NOK or Euros. In areas where currency risks are potentially high, we normally accept only a small percentage of charter hire in local currency, with the remainder payable in U.S. Dollars. Operating costs are substantially denominated in the same currency as charter hire in order to reduce the risk of currency fluctuations. The North Sea fleet generated 62% of our total consolidated revenue for the year ended December 31, 2016.
In 2016, the exchange rates of GBP, NOK, Euro, BRL, and SGD against the U.S. Dollar ranged as follows:
| High | Low |
Year |
As of |
|||||||||||||
|
$1 US=GBP |
0.822 | 0.672 | 0.738 | 0.08225 | ||||||||||||
|
$1 US=NOK |
8.946 | 7.978 | 8.395 | 8.6095 | ||||||||||||
|
$1 US=Euro |
0.962 | 0.868 | 0.903 | 0.9423 | ||||||||||||
|
$1 US=BRL |
4.159 | 3.112 | 3.467 | 3.1652 | ||||||||||||
|
$1 US=SGD |
1.451 | 1.338 | 1.380 | 1.4152 | ||||||||||||
Our outstanding debt is denominated in U.S. Dollars, but a substantial portion of our revenue is generated in currencies other than the U.S. Dollar. We have evaluated these conditions and have determined that it is not in our interest to use any financial instruments to hedge this exposure under present conditions. Our strategy is in part based on a number of factors including the following:
|
● |
the cost of using hedging instruments in relation to the risks of currency fluctuations; |
|
● |
the propensity for adjustments in these foreign currency denominated vessel day rates over time to compensate for changes in the purchasing power of these currencies as measured in U.S. Dollars; |
|
● |
the level of U.S. Dollar-denominated borrowings available to us; and |
|
● |
the conditions in our U.S. Dollar-generating regional markets. |
One or more of these factors may change and, in response, we may begin to use financial instruments to hedge risks of currency fluctuations. We may from time to time hedge known liabilities denominated in foreign currencies to reduce the effects of exchange rate fluctuations on our financial results. We do not use foreign currency forward contracts for trading or speculative purposes.
Reflected in the accompanying consolidated balance sheet at December 31, 2016, is a $148.4 million loss in accumulated other comprehensive income primarily relating to the lower exchange rates at December 31, 2016 in comparison to the exchange rate when we invested capital in these markets. Accumulated other comprehensive income related to the changes in foreign currency exchange rates was a $96.2 million loss at December 31, 2015. Changes in the accumulated other comprehensive income are non-cash items that are primarily attributable to investments in vessels and U.S. Dollar-based capitalization between our parent company and our foreign subsidiaries. The 2016 activity reflects the changes in the U.S. Dollar compared to the functional currencies of our major operating subsidiaries, particularly in the U.K. and Norway.
To date, general inflationary trends have not had a material effect on our operating revenues or expenses.
New Accounting Pronouncements
Refer to Note 1 “Nature of Operations and Summary of Significant Accounting Policies–New Accounting Pronouncements” to our Consolidated Financial Statements included in Part II, Item 8 “Financial Statements and Supplementary Data”.
ITEM 7A. Quantitative and Qualitative Disclosures about Market Risk
The information included in this Item 7A is considered to constitute “forward-looking statements” for purposes of the statutory safe harbor provided in Section 27A of the Securities Act and Section 21E of the Exchange Act. See “Forward-Looking Statements.”
Financial Instruments
We are subject to financial market risks, including fluctuations in foreign currency exchange rates and interest rates. In order to manage and mitigate our exposure to these risks, we may use derivative financial instruments in accordance with established policies and procedures. At December 31, 2016, we had no outstanding derivative contracts. Refer to Note 1 “Nature of Operations and Summary of Significant Accounting Policies—Fair Value of Financial Instruments” to our Consolidated Financial Statements included in Part II, Item 8 “Financial Statements and Supplementary Data” for additional information on financial instruments.
Our measure of market risk exposure represents an estimate of the change in fair value of our financial instruments. Market risk exposure is presented for each class of financial instrument held by us at December 31, 2016 and 2015, assuming immediate adverse market movements of the magnitude described below. We believe that the various rates of adverse market movements represent a measure of exposure to loss under hypothetically assumed adverse conditions. The estimated market risk exposure represents the hypothetical loss to future earnings and does not represent the maximum possible loss or any expected actual loss, even under adverse conditions, because actual adverse fluctuations would likely differ. In addition, since our investment portfolio is subject to change based on our portfolio management strategy as well as in response to changes in the market, these estimates are not necessarily indicative of the actual results that may occur.
Foreign Currency Risk
The functional currency for the majority of our international operations is that operation’s local currency. Adjustments resulting from the translation of the local functional currency financial statements to the U.S. Dollar, which is based on current exchange rates, are included in the Consolidated Statements of Stockholders’ Equity as a separate component of “Accumulated Other Comprehensive Income (Loss).” Working capital of our international operations may in part be held or denominated in a currency other than the local currency, and gains and losses resulting from holding those balances are included in the Consolidated Statements of Operations in “Foreign currency loss and other” in the current period.
We operate in a number of international areas and are involved in transactions denominated in currencies other than U.S. Dollars, which exposes us to foreign currency exchange risk. At various times we may utilize forward exchange contracts, local currency borrowings and the payment structure of customer contracts to selectively hedge exposure to exchange rate fluctuations in connection with monetary assets, liabilities and cash flows denominated in certain foreign currencies. See Part II, Item 7 “Management’s Discussion and Analysis of Financial Condition and Results of Operations – Currency Fluctuations and Inflation.” Other than trade accounts receivable and trade accounts payable, we do not currently have financial instruments that are sensitive to foreign currency exchange rates.
We transact business in various foreign currencies which subjects our cash flows and earnings to exposure related to changes in foreign currency exchange rates. We generally attempt to manage this exposure through operational strategies and not through the use of foreign currency forward exchange contracts. We do not engage in hedging activity for speculative or trading purposes.
From time to time, however, we may hedge firmly committed, anticipated transactions in the normal course of business and these contracts are designated and qualify as fair value hedges. Changes in the fair value of derivatives that are designated as fair value hedges are deferred in the Consolidated Statements of Stockholders’ Equity as a separate component of “Consolidated Statements of Comprehensive Income” until the underlying transactions occur. At such time, the related deferred hedging gains or losses are recorded on the same line as the hedged item.
Net foreign currency losses, including derivative activity, for the years ended December 31, 2016, 2015 and 2014 were $2.3 million, $1.1 million and $1.0 million, respectively.
Interest Rate Risk
We are subject to market risk for changes in interest rates related primarily to our long-term debt. The following table, which presents principal cash flows by expected maturity dates and weighted average interest rates, summarizes our fixed and variable rate debt obligations at December 31, 2016 and 2015 that are sensitive to changes in interest rates. The floating portion of our variable rate debt is based on LIBOR.
The following table shows our debt principal obligations as of December 31, 2016 and 2015 and the interest rate exposure in subsequent years of the components of our debt:
|
December 31, 2016 |
2017 |
2018 |
2019 |
2020 |
2021 |
Thereafter |
||||||||||||||||||
|
(Dollar amounts in thousands) |
||||||||||||||||||||||||
|
Long-term Debt: |
||||||||||||||||||||||||
|
Senior Notes (fixed rate) |
$ | 429,640 | $ | 429,640 | $ | 429,640 | $ | 429,640 | $ | 429,640 | $ | 429,640 | ||||||||||||
|
Average interest rate |
6.375 | % | 6.375 | % | 6.375 | % | 6.375 | % | 6.375 | % | 6.375 | % | ||||||||||||
|
Variable rate-Multicurrency Facility Agreement |
$ | 49,000 | $ | 49,000 | $ | 49,000 | $ | - | $ | - | $ | - | ||||||||||||
|
Average interest rate |
4.62 | % | 4.62 | % | 4.62 | % | 0.00 | % | 0.00 | % | 0.00 | % | ||||||||||||
|
Variable rate-Norwegian Facility Agreement |
$ | 11,157 | $ | 11,157 | $ | 11,157 | $ | - | $ | - | $ | - | ||||||||||||
|
Average interest rate |
4.59 | % | 4.59 | % | 4.59 | % | 0.00 | % | 0.00 | % | 0.00 | % | ||||||||||||
|
December 31, 2015 |
2016 |
2017 |
2018 |
2019 |
2020 |
Thereafter |
||||||||||||||||||
|
(Dollar amounts in thousands) |
||||||||||||||||||||||||
|
Long-term Debt: |
||||||||||||||||||||||||
|
Senior Notes (fixed rate) |
$ | 499,000 | $ | 499,000 | $ | 499,000 | $ | 499,000 | $ | 499,000 | $ | 499,000 | ||||||||||||
|
Average interest rate |
6.375 | % | 6.375 | % | 6.375 | % | 6.375 | % | 6.375 | % | 6.375 | % | ||||||||||||
|
Variable rate-Multicurrency Facility Agreement |
$ | - | $ | - | $ | - | $ | - | $ | - | $ | - | ||||||||||||
|
Average interest rate |
0.00 | % | 0.00 | % | 0.00 | % | 0.00 | % | 0.00 | % | 0.00 | % | ||||||||||||
|
Variable rate-Norwegian Facility Agreement |
$ | - | $ | - | $ | - | $ | - | $ | - | $ | - | ||||||||||||
|
Average interest rate |
0.00 | % | 0.00 | % | 0.00 | % | 0.00 | % | 0.00 | % | 0.00 | % | ||||||||||||
Our fixed rate 6.375 % Senior Notes outstanding at December 31, 2016 subject us to risks related to changes in the fair value of the debt and expose us to potential gains or losses if we were to repay or refinance such debt. In general, the fair value of debt with a fixed interest rate will increase as interest rates fall. Conversely, the fair value of such debt will decrease as interest rates rise. A 1.0% change in market interest rates would increase or decrease the fair value of our fixed rate debt by approximately $30.0 million.
The fair value of our 6.375% Senior Notes compared to the carrying value at December 31, 2016 and 2015, was as follows:
|
December 31, |
||||||||||||||||
|
2016 |
2015 |
|||||||||||||||
|
Carrying Value |
Fair Value |
Carrying Value |
Fair Value |
|||||||||||||
|
(In millions) |
||||||||||||||||
|
6.375% Senior Notes due 2022 |
$ | 429.6 | $ | 234.9 | $ | 499.0 | $ | 254.5 | ||||||||
ITEM 8. Financial Statements and Supplementary Data
Report of Independent Registered Public Accounting Firm
The Board of Directors and Stockholders
GulfMark Offshore, Inc.:
We have audited the accompanying consolidated balance sheets of GulfMark Offshore, Inc. and consolidated subsidiaries (the Company) as of December 31, 2016 and 2015, and the related consolidated statements of operations, comprehensive income (loss), stockholders’ equity, and cash flows for each of the years in the three-year period ended December 31, 2016. These consolidated financial statements are the responsibility of the Company’s management. Our responsibility is to express an opinion on these consolidated financial statements based on our audits.
We conducted our audits in accordance with the standards of the Public Company Accounting Oversight Board (United States). Those standards require that we plan and perform the audit to obtain reasonable assurance about whether the financial statements are free of material misstatement. An audit includes examining, on a test basis, evidence supporting the amounts and disclosures in the financial statements. An audit also includes assessing the accounting principles used and significant estimates made by management, as well as evaluating the overall financial statement presentation. We believe that our audits provide a reasonable basis for our opinion.
In our opinion, the consolidated financial statements referred to above present fairly, in all material respects, the financial position of GulfMark Offshore, Inc. and consolidated subsidiaries as of December 31, 2016 and 2015, and the results of their operations and their cash flows for each of the years in the three-year period ended December 31, 2016, in conformity with U.S. generally accepted accounting principles.
The accompanying consolidated financial statements have been prepared assuming that the Company will continue as a going concern. As discussed in Note 2 to the consolidated financial statements, the Company expects to be in violation of certain of their financial covenants which will result in the Company's debt becoming subject to acceleration, which raise substantial doubt about its ability to continue as a going concern. Management’s plans in regard to these matters are also described in Note 2. The consolidated financial statements do not include any adjustments that might result from the outcome of this uncertainty.
We also have audited, in accordance with the standards of the Public Company Accounting Oversight Board (United States), GulfMark Offshore, Inc. and consolidated subsidiaries’ internal control over financial reporting as of December 31, 2016, based on criteria established in Internal Control – Integrated Framework (2013) issued by the Committee of Sponsoring Organizations of the Treadway Commission (COSO), and our report dated March 16, 2017 expressed an unqualified opinion on the effectiveness of the Company’s internal control over financial reporting.
/s/ KPMG LLP
Houston, Texas
March 16, 2017
Report of Independent Registered Public Accounting Firm
The Board of Directors and Stockholders
GulfMark Offshore, Inc.:
We have audited GulfMark Offshore, Inc. and consolidated subsidiaries (the Company) internal control over financial reporting as of December 31, 2016, based on criteria established in Internal Control – Integrated Framework (2013) issued by the Committee of Sponsoring Organizations of the Treadway Commission (COSO). GulfMark Offshore, Inc. and consolidated subsidiaries’ management is responsible for maintaining effective internal control over financial reporting and for its assessment of the effectiveness of internal control over financial reporting, included in the accompanying Management’s Annual Report on Internal Control over Financial Reporting. Our responsibility is to express an opinion on the Company’s internal control over financial reporting based on our audit.
We conducted our audit in accordance with the standards of the Public Company Accounting Oversight Board (United States). Those standards require that we plan and perform the audit to obtain reasonable assurance about whether effective internal control over financial reporting was maintained in all material respects. Our audit included obtaining an understanding of internal control over financial reporting, assessing the risk that a material weakness exists, and testing and evaluating the design and operating effectiveness of internal control based on the assessed risk. Our audit also included performing such other procedures as we considered necessary in the circumstances. We believe that our audit provides a reasonable basis for our opinion.
A company’s internal control over financial reporting is a process designed to provide reasonable assurance regarding the reliability of financial reporting and the preparation of financial statements for external purposes in accordance with generally accepted accounting principles. A company’s internal control over financial reporting includes those policies and procedures that (1) pertain to the maintenance of records that, in reasonable detail, accurately and fairly reflect the transactions and dispositions of the assets of the company; (2) provide reasonable assurance that transactions are recorded as necessary to permit preparation of financial statements in accordance with generally accepted accounting principles, and that receipts and expenditures of the company are being made only in accordance with authorizations of management and directors of the company; and (3) provide reasonable assurance regarding prevention or timely detection of unauthorized acquisition, use, or disposition of the company’s assets that could have a material effect on the financial statements.
Because of its inherent limitations, internal control over financial reporting may not prevent or detect misstatements. Also, projections of any evaluation of effectiveness to future periods are subject to the risk that controls may become inadequate because of changes in conditions, or that the degree of compliance with the policies or procedures may deteriorate.
In our opinion, GulfMark Offshore, Inc. and consolidated subsidiaries maintained, in all material respects, effective internal control over financial reporting as of December 31, 2016, based on Internal Control – Integrated Framework (2013) issued by the Committee of Sponsoring Organizations of the Treadway Commission (COSO).
We also have audited, in accordance with the standards of the Public Company Accounting Oversight Board (United States), the consolidated balance sheets of GulfMark Offshore, Inc. and consolidated subsidiaries as of December 31, 2016 and 2015, and the related consolidated statements of operations, comprehensive income (loss), stockholders’ equity, and cash flows for each of the years in the three-year period ended December 31, 2016, and our report dated March 16, 2017 expressed an unqualified opinion on those consolidated financial statements.
/s/ KPMG LLP
Houston, Texas
March 16, 2017
GULFMARK OFFSHORE, INC. AND SUBSIDIARIES
CONSOLIDATED BALANCE SHEETS
|
December 31, |
||||||||
|
2016 |
2015 |
|||||||
|
(In thousands) |
||||||||
| ASSETS | ||||||||
|
Current assets: |
||||||||
|
Cash and cash equivalents |
$ | 8,822 | $ | 21,939 | ||||
|
Trade accounts receivable, net of allowance for doubtful accounts of $2,482 and $1,480, respectively |
22,043 | 40,838 | ||||||
|
Other accounts receivable |
7,650 | 7,571 | ||||||
|
Inventory |
7,465 | 8,485 | ||||||
|
Prepaid expenses |
3,799 | 4,354 | ||||||
|
Other current assets |
3,110 | 3,810 | ||||||
|
Total current assets |
52,889 | 86,997 | ||||||
|
Vessels, equipment, and other fixed assets at cost, net of accumulated depreciation of $468,817 and $457,670, respectively |
970,522 | 1,195,669 | ||||||
|
Construction in progress |
24,698 | 70,817 | ||||||
|
Deferred costs and other assets |
5,794 | 7,769 | ||||||
|
Total assets |
$ | 1,053,903 | $ | 1,361,252 | ||||
|
LIABILITIES AND STOCKHOLDERS' EQUITY |
||||||||
|
Current liabilities: |
||||||||
|
Current maturities of long-term debt |
$ | 483,326 | $ | - | ||||
|
Accounts payable |
11,666 | 13,170 | ||||||
|
Income and other taxes payable |
3,678 | 6,485 | ||||||
|
Accrued personnel costs |
9,109 | 12,942 | ||||||
|
Accrued interest expense |
8,163 | 9,620 | ||||||
|
Other accrued liabilities |
9,305 | 5,316 | ||||||
|
Total current liabilities |
525,247 | 47,533 | ||||||
|
Long-term debt |
- | 490,589 | ||||||
|
Long-term income taxes: |
||||||||
|
Deferred income tax liabilities |
58,094 | 99,439 | ||||||
|
Other income taxes payable |
17,768 | 21,351 | ||||||
|
Other liabilities |
3,173 | 4,032 | ||||||
|
Stockholders' equity: |
||||||||
|
Preferred stock, $0.01 par value; 2,000 shares authorized; no shares issued |
- | - | ||||||
|
Class A Common stock, $0.01 par value; 60,000 shares authorized; 29,104 and 27,994 shares issued and 27,122 and 25,792 shares outstanding, respectively; Class B Common Stock $.01 par value; 60,000 shares authorized; no shares issued |
278 | 274 | ||||||
|
Additional paid-in capital |
411,983 | 417,289 | ||||||
|
Retained earnings |
241,207 | 444,181 | ||||||
|
Accumulated other comprehensive income (loss) |
(148,402 | ) | (96,234 | ) | ||||
|
Treasury stock, at cost |
(64,580 | ) | (75,922 | ) | ||||
|
Deferred compensation |
9,135 | 8,720 | ||||||
|
Total stockholders' equity |
449,621 | 698,308 | ||||||
|
Total liabilities and stockholders' equity |
$ | 1,053,903 | $ | 1,361,252 | ||||
The accompanying notes are an integral part of these consolidated financial statements.
GULFMARK OFFSHORE, INC. AND SUBSIDIARIES
CONSOLIDATED STATEMENTS OF OPERATIONS
|
Year Ended December 31, |
||||||||||||
|
2016 |
2015 |
2014 |
||||||||||
|
(In thousands, except per share amounts) |
||||||||||||
|
Revenue |
$ | 123,719 | $ | 274,806 | $ | 495,769 | ||||||
|
Costs and expenses: |
||||||||||||
|
Direct operating expenses |
83,165 | 169,837 | 236,244 | |||||||||
|
Drydock expenses |
4,662 | 15,387 | 24,840 | |||||||||
|
General and administrative expenses |
37,663 | 47,280 | 62,728 | |||||||||
|
Depreciation and amortization |
58,182 | 72,591 | 75,336 | |||||||||
|
Impairment charges |
162,808 | 152,103 | 8,995 | |||||||||
|
(Gain) loss on sale of assets and other |
8,564 | 1,160 | (14,039 | ) | ||||||||
|
Total costs and expenses |
355,044 | 458,358 | 394,104 | |||||||||
|
Operating income (loss) |
(231,325 | ) | (183,552 | ) | 101,665 | |||||||
|
Other income (expense): |
||||||||||||
|
Interest expense |
(33,486 | ) | (36,946 | ) | (29,332 | ) | ||||||
|
Interest income |
133 | 260 | 307 | |||||||||
|
Gain on extinguishment of debt |
35,912 | 458 | - | |||||||||
|
Other financing costs |
(11,287 | ) | - | - | ||||||||
|
Foreign currency loss and other |
(2,384 | ) | (1,088 | ) | (995 | ) | ||||||
|
Total other expense |
(11,112 | ) | (37,316 | ) | (30,020 | ) | ||||||
|
Income (loss) before income taxes |
(242,437 | ) | (220,868 | ) | 71,645 | |||||||
|
Income tax benefit (provision) |
39,458 | 5,633 | (9,270 | ) | ||||||||
|
Net income (loss) |
$ | (202,979 | ) | $ | (215,235 | ) | $ | 62,375 | ||||
|
Earnings (loss) per share: |
||||||||||||
|
Basic |
$ | (8.09 | ) | $ | (8.70 | ) | $ | 2.39 | ||||
|
Diluted |
$ | (8.09 | ) | $ | (8.70 | ) | $ | 2.39 | ||||
|
Weighted average shares outstanding: |
||||||||||||
|
Basic |
25,094 | 24,729 | 26,097 | |||||||||
|
Diluted |
25,094 | 24,729 | 26,097 | |||||||||
|
Cash dividends declared per common share |
$ | - | $ | - | $ | 1.00 | ||||||
The accompanying notes are an integral part of these consolidated financial statements.
GULFMARK OFFSHORE, INC. AND SUBSIDIARIES
CONSOLIDATED STATEMENTS OF COMPREHENSIVE INCOME (LOSS)
|
Year Ended December 31, |
||||||||||||
|
2016 |
2015 |
2014 |
||||||||||
|
(In thousands) |
||||||||||||
|
Net income (loss) |
$ | (202,979 | ) | $ | (215,235 | ) | $ | 62,375 | ||||
|
Comprehensive income: |
||||||||||||
|
Foreign currency |
(52,168 | ) | (65,569 | ) | (80,630 | ) | ||||||
|
Total comprehensive income (loss) |
$ | (255,147 | ) | $ | (280,804 | ) | $ | (18,255 | ) | |||
The accompanying notes are an integral part of these consolidated financial statements.
GULFMARK OFFSHORE, INC. AND SUBSIDIARIES
CONSOLIDATED STATEMENTS OF STOCKHOLDERS’ EQUITY
For the Years Ended December 31, 2016, 2015 and 2014
(In thousands)
|
Common Stock at $0.01 Par Value |
Additional Paid-in Capital |
Retained Earnings | Accumulated Other Comprehensive Income (loss) | Treasury Stock | Deferred Compen- sation |
Total Stockholders' Equity |
||||||||||||||||||||||||||
| Share | ||||||||||||||||||||||||||||||||
| Shares | Value | |||||||||||||||||||||||||||||||
|
Balance at December 31, 2013 |
269 | 402,286 | 623,221 | 49,965 | (549 | ) | (18,690 | ) | 6,290 | 1,063,341 | ||||||||||||||||||||||
|
Net income |
- | - | 62,375 | - | - | - | - | 62,375 | ||||||||||||||||||||||||
|
Issuance of common stock |
2 | 8,190 | - | - | - | - | - | 8,192 | ||||||||||||||||||||||||
|
Deferred compensation plan |
- | 165 | - | - | (37 | ) | (1,254 | ) | 1,254 | 165 | ||||||||||||||||||||||
|
Stock repurchases |
- | - | - | - | (1,898 | ) | (58,497 | ) | - | (58,497 | ) | |||||||||||||||||||||
|
Cash dividends declared |
- | - | (26,193 | ) | - | - | - | - | (26,193 | ) | ||||||||||||||||||||||
|
Translation adjustment |
- | - | - | (80,630 | ) | - | - | - | (80,630 | ) | ||||||||||||||||||||||
|
Balance at December 31, 2014 |
271 | 410,641 | 659,403 | (30,665 | ) | (2,484 | ) | (78,441 | ) | 7,544 | 968,753 | |||||||||||||||||||||
|
Net loss |
- | - | (215,235 | ) | - | - | - | - | (215,235 | ) | ||||||||||||||||||||||
|
Issuance of common stock |
3 | 9,890 | - | - | - | - | - | 9,893 | ||||||||||||||||||||||||
|
Deferred compensation plan |
- | (3,242 | ) | - | - | (104 | ) | (1,176 | ) | 1,176 | (3,242 | ) | ||||||||||||||||||||
|
Treasury stock activity (net) |
- | - | - | - | 45 | 3,695 | - | 3,695 | ||||||||||||||||||||||||
|
Forfeiture of dividends |
- | - | 13 | - | - | - | - | 13 | ||||||||||||||||||||||||
|
Translation adjustment |
- | - | - | (65,569 | ) | - | - | - | (65,569 | ) | ||||||||||||||||||||||
|
Balance at December 31, 2015 |
274 | 417,289 | 444,181 | (96,234 | ) | (2,543 | ) | (75,922 | ) | 8,720 | 698,308 | |||||||||||||||||||||
|
Net loss |
- | - | (202,979 | ) | - | - | - | - | (202,979 | ) | ||||||||||||||||||||||
|
Issuance of common stock |
4 | 6,265 | - | - | - | - | - | 6,269 | ||||||||||||||||||||||||
|
Deferred compensation plan |
- | (11,571 | ) | - | - | (263 | ) | (415 | ) | 415 | (11,571 | ) | ||||||||||||||||||||
|
Treasury stock activity (net) |
- | - | - | - | 220 | 11,757 | - | 11,757 | ||||||||||||||||||||||||
|
Dividends paid |
- | - | 5 | - | - | - | - | 5 | ||||||||||||||||||||||||
|
Translation adjustment |
- | - | - | (52,168 | ) | - | - | - | (52,168 | ) | ||||||||||||||||||||||
|
Balance at December 31, 2016 |
278 | 411,983 | 241,207 | (148,402 | ) | (2,586 | ) | (64,580 | ) | 9,135 | 449,621 | |||||||||||||||||||||
The accompanying notes are an integral part of these consolidated financial statements.
GULFMARK OFFSHORE, INC. AND SUBSIDIARIES
CONSOLIDATED STATEMENTS OF CASH FLOWS
|
Year Ended December 31, |
||||||||||||
|
2016 |
2015 |
2014 |
||||||||||
|
(In thousands) |
||||||||||||
|
Cash flows from operating activities: |
||||||||||||
|
Net income (loss) |
$ | (202,979 | ) | $ | (215,235 | ) | $ | 62,375 | ||||
|
Adjustments to reconcile net income (loss) to net cash provided by operating activities: |
||||||||||||
|
Depreciation and amortization |
58,182 | 72,591 | 75,336 | |||||||||
|
Amortization of deferred financing costs |
3,254 | 2,394 | 1,945 | |||||||||
|
Amortization of stock-based compensation |
5,209 | 6,735 | 7,330 | |||||||||
|
Provision for doubtful accounts receivable, net of write offs |
1,801 | (862 | ) | 3,236 | ||||||||
|
Deferred income tax benefit |
(38,456 | ) | (3,784 | ) | (66 | ) | ||||||
|
(Gain) loss on sale of assets |
8,564 | 1,160 | (12,461 | ) | ||||||||
|
Impairment charges |
162,808 | 152,103 | 8,995 | |||||||||
|
Gain on extinguishment of debt |
(35,912 | ) | (458 | ) | - | |||||||
|
Other financing costs |
5,988 | - | - | |||||||||
|
Foreign currency (gain) loss |
1,025 | (160 | ) | 1,490 | ||||||||
|
Change in operating assets and liabilities — |
||||||||||||
|
Accounts receivable |
15,144 | 47,317 | 5,700 | |||||||||
|
Prepaids and other |
1,677 | 214 | (476 | ) | ||||||||
|
Accounts payable |
(593 | ) | (8,602 | ) | (3,888 | ) | ||||||
|
Other accrued liabilities and other |
(9,051 | ) | (10,056 | ) | 4,332 | |||||||
|
Net cash (used in) provided by operating activities |
(23,339 | ) | 43,357 | 153,848 | ||||||||
|
Cash flows from investing activities: |
||||||||||||
|
Purchases of vessels, equipment and other fixed assets |
(16,188 | ) | (35,428 | ) | (158,425 | ) | ||||||
|
Release of deposits held in escrow |
- | 3,683 | 5,060 | |||||||||
|
Proceeds from disposition of vessels, equipment and other fixed assets |
6,529 | 8,910 | 32,261 | |||||||||
|
Net cash used in investing activities |
(9,659 | ) | (22,835 | ) | (121,104 | ) | ||||||
|
Cash flows from financing activities: |
||||||||||||
|
Repuchase of 6.375% senior notes |
(33,448 | ) | (542 | ) | - | |||||||
|
Repayment of revolving loan facility |
(5,000 | ) | (91,000 | ) | - | |||||||
|
Borrowings under revolving loan facility, net |
65,194 | 47,000 | 47,167 | |||||||||
|
Cash dividends |
- | - | (26,152 | ) | ||||||||
|
Stock repurchases |
- | - | (57,887 | ) | ||||||||
|
Debt issuance costs |
(971 | ) | (3,566 | ) | (4,198 | ) | ||||||
|
Other financing costs |
(5,988 | ) | - | - | ||||||||
|
Proceeds from issuance of stock |
380 | 827 | 1,046 | |||||||||
|
Net cash provided by (used in) financing activities |
20,167 | (47,281 | ) | (40,024 | ) | |||||||
|
Effect of exchange rate changes on cash |
(286 | ) | (2,087 | ) | (2,501 | ) | ||||||
|
Net decrease in cash and cash equivalents |
(13,117 | ) | (28,846 | ) | (9,781 | ) | ||||||
|
Cash and cash equivalents at beginning of year |
21,939 | 50,785 | 60,566 | |||||||||
|
Cash and cash equivalents at end of year |
$ | 8,822 | $ | 21,939 | $ | 50,785 | ||||||
|
Supplemental cash flow information: |
||||||||||||
|
Interest paid, net of interest capitalized |
$ | 30,820 | $ | 29,834 | $ | 27,067 | ||||||
|
Income taxes paid, net |
$ | 2,124 | $ | 2,048 | $ | 4,454 | ||||||
The accompanying notes are an integral part of these consolidated financial statements.
GULFMARK OFFSHORE, INC. AND SUBSIDIARIES
NOTES TO CONSOLIDATED FINANCIAL STATEMENTS
(1) NATURE OF OPERATIONS AND SUMMARY OF SIGNIFICANT ACCOUNTING POLICIES
Nature of Operations
GulfMark Offshore, Inc. and its subsidiaries (collectively referred to as “we”, “us”, “our” or the “Company”) own and operate offshore supply vessels, principally in the North Sea, offshore Southeast Asia and offshore the Americas. The vessels provide transportation of materials, supplies and personnel to and from offshore platforms and drilling rigs. Some of these vessels also perform anchor handling and towing services.
Principles of Consolidation
Our consolidated financial statements include our accounts and those of our majority-owned subsidiaries. All significant inter-company accounts and transactions have been eliminated.
Use of Estimates
The preparation of financial statements in conformity with accounting principles generally accepted in the United States of America, or U.S. GAAP, requires us to make estimates and assumptions that affect the reported amounts of assets and liabilities and disclosure of contingent assets and liabilities at the date of the consolidated financial statements and the reported amounts of revenue and expenses during the reporting period. The accompanying consolidated financial statements include significant estimates for allowance for doubtful accounts receivable, depreciable lives of vessels and equipment, valuation of goodwill, income taxes and commitments and contingencies. While we believe current estimates are reasonable and appropriate, actual results could differ from these estimates.
Cash and Cash Equivalents
Our investments, consisting of U.S. Government securities and commercial paper with original maturities of up to three months, are included in cash and cash equivalents in the accompanying consolidated balance sheets and consolidated statements of cash flows.
Vessels and Equipment
Vessels and equipment are stated at cost, net of accumulated depreciation, which is provided by the straight-line method over their estimated useful life of 25 years for all vessels other than crew boats which are depreciated over 20 years. Interest is capitalized in connection with the construction of vessels. The capitalized interest is included as part of the asset to which it relates and is depreciated over the asset’s estimated useful life. In 2016, 2015, and 2014, interest of $2.6 million, $5.0 million and $8.4 million, respectively, was capitalized. Office equipment, furniture and fixtures, and vehicles are depreciated over two to five years.
Major renovation costs and modifications that extend the life or usefulness of the related assets are capitalized and depreciated over the assets’ estimated remaining useful lives. Maintenance and repair costs are expensed as incurred. Included in the consolidated statements of operations for 2016, 2015, and 2014, are $9.3 million, $19.3 million and $31.6 million, respectively, of costs for maintenance and repairs.
Impairment of Long-Lived Assets
We review long-lived assets for impairment whenever there is evidence that the carrying amount of such assets may not be recoverable. This review consists of comparing the carrying amount of the asset with its expected future undiscounted cash flows before tax and interest costs. If the asset’s carrying amount is less than such cash flow estimate, it is written down to its fair value on a discounted cash flow basis. Estimates of expected future cash flows represent management’s best estimate based on currently available information and reasonable and supportable assumptions. Any impairment recognized is permanent and may not be restored. See Note 3 for the results of our impairment analyses.
Fair Value of Financial Instruments
As of December 31, 2016 and 2015, our financial instruments consisted primarily of accounts receivable and payable (which are stated at carrying value which approximates fair value) and long-term debt. Periodically, we enter into forward derivative contracts to hedge our exposure to interest rate or foreign currency fluctuations. In the past we have had open positions in such derivative contracts that are considered financial instruments for which we would disclose certain fair value information. As of December 31, 2016 and 2015, we had no forward derivative open contracts.
Deferred Costs and Other Assets
Deferred costs and other assets consist primarily of deferred financing costs and deferred vessel mobilization costs. Deferred financing costs are amortized over the expected term of the related debt. Should the debt for which a deferred financing cost has been recorded terminate by means of payment in full, tender offer or lender termination, the associated deferred financing costs would be immediately expensed.
In connection with new long-term contracts, costs incurred that directly relate to mobilization of a vessel from one region to another are deferred and recognized over the primary contract term. Should either party terminate the contract prior to the end of the original contract term, the deferred amount would be immediately expensed. Costs of relocating vessels from one region to another without a contract are expensed as incurred.
Revenue Recognition
Revenue from charters for offshore marine services is recognized as performed based on contractual charter rates and when collectability is reasonably assured. Currently, charter terms range from as short as several days to as long as 10 years in duration. Management services revenue is recognized in the period in which the services are performed.
Income Taxes
We recognize the amount of current year income taxes payable or refundable and deferred tax assets and liabilities for the expected future tax consequences of events that have been recognized in the financial statements or tax returns previously filed. Under this method, deferred tax assets and liabilities are determined based on the difference between the financial statement carrying amounts and tax bases of assets and liabilities using enacted tax rates and laws in effect for the years in which the differences are expected to reverse. The likelihood and amount of future taxable income and tax planning strategies are included in the criteria used to determine the timing and amount of net deferred tax assets recognized for net operating loss and tax credit carry-forwards in our consolidated financial statements. These deferred tax assets are, when appropriate, reduced by a valuation allowance resulting in net deferred tax assets that are more likely than not to be realized.
A significant amount of judgment in our use of assumptions and estimates is required in our methodology for determining and recording income taxes. In some instances we use forecasts of expected operations and related tax implications and we consider the possibility of implementing tax planning strategies. Such variables can result in uncertainty and measurable variation between anticipated and actual results can occur. Changes to these variables as a result of unforeseen events may have a material impact on our income tax accounts.
In recent years we have had operations in over 40 countries and are or have been subject to a significant number of taxing jurisdictions. Our income earned in these jurisdictions is taxed on various bases, including actual income earned, deemed profits, and revenue based withholding taxes. Our income tax determinations involve the interpretation of applicable tax laws, tax treaties, and related tax rules and regulations of those jurisdictions. Changes in tax law, currency/repatriation controls and interpretation of local tax laws by the relevant tax authority could impact our income tax liabilities or assets in those jurisdictions.
In addition, we also account for uncertainty in income taxes by utilizing a more likely than not, or greater than 50% probability, minimum recognition threshold for measurement of a tax position taken or expected to be taken in a tax return that would be sustained upon examination by the relevant tax authorities. We recognize penalties and/or interest related to uncertain tax benefits as a component of income tax expense. Numerous factors contribute to our evaluation and estimation of our tax positions and related tax liabilities and /or benefits, which may be adjusted periodically and may be resolved differently than we anticipate.
We reduce the carrying value of certain deferred tax assets by the tax effect of the amount of excess stock compensation income tax deductions until such time as those tax deductions can be realized. This may result in our not recognizing any tax benefits for those excess tax deductions in the period in which they arise. Future recognition will result in a credit to additional paid-in capital rather than a reduction of income tax expense.
Foreign Currency Translation
The local currencies of the majority of our foreign operations have been determined to be their functional currencies, except for certain foreign operations whose functional currency has been determined to be the U.S. Dollar, based on an assessment of the economic circumstances of the foreign operations. Assets and liabilities of our foreign affiliates are translated at year-end exchange rates, while revenue and expenses are translated at average rates for the period. As a result, amounts related to changes in assets and liabilities reported in the consolidated statements of cash flows will not necessarily agree to changes in the corresponding balances on the consolidated balance sheets. We consider most intercompany loans to be long-term investments; accordingly, the related translation gains and losses are reported as a component of stockholders’ equity. Transaction gains and losses are reported directly in the consolidated statements of operations. During the years ended December 31, 2016, 2015 and 2014, we reported net foreign currency losses in the amounts of $2.3 million, $1.2 million and $2.0 million, respectively.
Concentration of Credit Risk
We extend credit to various companies in the energy industry that may be affected by changes in economic or other external conditions. Our policy is to manage our exposure to credit risk through credit approvals and limits. Our trade accounts receivable are aged based on contractual payment terms and an allowance for doubtful accounts is established in accordance with our written corporate policy. The age of the trade accounts receivable, customer collection history and management’s judgment as to the customer’s ability to pay are considered in determining whether an allowance is necessary. In 2014, we reserved $3.2 million related to two North Sea customers. In 2015, there were no significant write-offs or increases in our allowance for doubtful accounts. In 2016, we reserved $1.8 million related to three Southeast Asia customers. For the year ended December 31, 2016, no customer accounted for 10% or more of our total consolidated revenue. For the year ended December 31, 2015, we had revenue from one customer in our North Sea region and one customer in our Americas region which each accounted for 10% or more of our total consolidated revenue, totaling $32.4 million and $31.9 million, respectively, or 23.5% of our total consolidated revenue. For the year ended December 31, 2014, we had revenue from one customer in our Americas region and one customer in our North Sea region which each accounted for 10% or more of our total consolidated revenue, totaling $88.7 million and $50.0 million, respectively, or 28.2% of our total consolidated revenue.
Stock-Based Compensation
We have share-based compensation plans covering officers and other employees as well as our Board of Directors. Stock-based grants made under our stock plans are recorded at fair value on the date of the grant and the cost is recognized ratably over the vesting period for the restricted stock and the stock options. The fair value of stock option awards is determined using the Black-Scholes option-pricing model. Restricted stock awards are valued using the market price of our Class A common stock on the grant date. Our stock-based compensation plans are more fully described in Note 9.
Our employee stock purchase plan would be considered compensatory whereby it allows all of our U.S. employees and employees of participating subsidiaries to acquire shares of our Class A common stock at 85% of the fair market value of the Class A common stock under a qualified plan as defined by Section 423 of the Internal Revenue Code. The plan has a look-back option that establishes the purchase price as an amount based on the lesser of the Class A common stock’s market price at the grant date or its market price at the exercise date. The total value of the look-back option imbedded in the plan is calculated using the component approach where each award is computed as the sum of 15% of a share of non-vested stock, a call option on 85% of a share of non-vested stock, and a put option on 15% of a share of non-vested stock.
Earnings Per Share
Basic earnings per share, or EPS, is computed by dividing net income (loss) by the weighted average number of shares of Class A common stock outstanding during the year. Diluted EPS is computed using the treasury stock method for common stock equivalents.
Reclassifications
Certain reclassifications of previously reported information have been made to conform to the current year presentation.
New Accounting Pronouncements
In May 2014, the Financial Accounting Standards Board, or FASB, issued Accounting Standards Update, or ASU, 2014-09, “Revenue from Contracts with Customers.” The ASU will replace most existing revenue recognition guidance in U.S. GAAP. The FASB subsequently issued ASU 2015-14 which delayed the effective date from January 1, 2017 until January 1, 2018. Early application is permitted only to the original effective date. The standard permits the use of either the retrospective or cumulative effect transition method. We are evaluating this standard in conjunction with the new lease standard (ASU 2016-02) discussed in the next paragraph.
In February 2016, the FASB issued ASU 2016-02, “Leases” to increase transparency and comparability among organizations by recognizing all leases on the balance sheet and disclosing key information about leasing arrangements. The main difference between current accounting standards and ASU 2016-02 is the recognition of assets and liabilities by lessees for those leases classified as operating leases under current accounting standards. The new standard is effective for fiscal years beginning after December 15, 2018. We are evaluating this standard in conjunction with the new revenue standard discussed in the previous paragraph.
We intend to adopt the new revenue and lease standards on January 1, 2018. While we are continuing to assess all potential impacts of these standards, we expect our revenues related to the offshore marine support and transportation services to remain substantially unchanged. However, the actual revenue recognition treatment required under the new standards may be dependent on contract-specific terms and may vary in some instances. In addition, we anticipate that our revenues will be classified into two general categories – lease revenue and service revenue. The lease revenue will reflect the consideration earned while our vessels are being chartered to our customers while the service revenue component will be primarily composed of the services rendered by our crews that operate the vessels.
On August 27, 2014, the FASB issued ASU 2014-15, Presentation of Financial Statements – Going Concern (Subtopic 205-40), which requires management to evaluate whether there are conditions and events that raise substantial doubt about the entity’s ability to continue as a going concern within one year after the financial statements are issued for both annual and interim reporting periods. We adopted the standard effective for the year ended December 31, 2016.
In November 2015, the FASB issued ASU 2015-17, “Income Taxes.” Current accounting requires an entity to separate deferred income tax liabilities and assets into current and noncurrent amounts in a classified balance sheet. ASU 2015-17 requires that deferred tax liabilities and assets be classified as noncurrent in a classified balance sheet. We adopted this standard in the first quarter of 2017. This standard did not have a material effect on our financial condition or results of operations.
In April 2016, the FASB issued ASU 2016-09, “Improvements to Employee Share-based Payments.” The ASU allows entities to record excess tax benefits or tax deficiencies as tax benefit or expense, allows entities to elect a methodology of using actual forfeitures instead of estimated forfeitures, and allows entities to withhold up to the maximum individual statutory tax rate without classifying the awards as liabilities. The new standard is effective for fiscal years beginning after December 15, 2016. We do not expect the adoption of this standard to have a material effect on financial condition or results of operations.
In August 2016, the FASB issued ASU 2016-15, “Statement of Cash Flows Classification of Certain Cash Receipts and Cash Payments” The objective of the new standard is to eliminate diversity in practice related to the classification of certain cash receipts and payments by adding or clarifying guidance on eight classification issues related to the statement of cash flows: debt prepayment or debt extinguishment costs; settlement of zero-coupon bonds; contingent consideration payments made after a business combination; proceeds from the settlement of insurance claims; proceeds from the settlement of corporate-owned life insurance policies, including bank-owned life insurance policies; distributions received from equity method investees; beneficial interests in securitization transactions; and separately identifiable cash flows and application of the predominance principle. This standard is effective for annual and interim periods in fiscal years beginning after December 15, 2017. Early adoption is permitted. The standard should be applied retrospectively to all periods presented. We do not expect the adoption of this standard to have a material effect on our financial condition or results of operations.
In October 2016, the FASB issued ASU 2016-16, “Income Taxes, Intra-Entity Transfers of Assets Other Than Inventory.” This standard requires recognition of tax consequences in the period in which a transfer takes place, with the exception of inventory transfers. There will be an immediate effect on earnings if the tax rates in the tax jurisdictions of the selling entity and buying entity are different. The new standard is effective for fiscal years beginning after December 15, 2017. We do not expect the adoption of this standard to have a material effect on our financial condition or results of operations.
In January 2017, the FASB issued ASU 2017-01, “Business Combinations - Clarifying the Definition of a Business” to clarify the definition of a business with the objective of adding guidance to assist entities with evaluating whether transactions should be accounted for as acquisitions (or disposals) of assets or businesses. The definition of a business affects many areas of accounting including acquisitions, disposals, goodwill, and consolidation. ASU 2017-01 is effective in annual periods beginning after December 15, 2017. We do not expect the adoption of this standard to have a material effect on our financial condition or results of operations.
(2) LIQUIDITY AND RESOURCES
We continued to incur significant losses from operations and had negative cash flows from operating activities for the year ended December 31, 2016. We expect to continue to incur losses from operations and generate negative cash flows from our operating activities. These expectations and other liquidity risks described in this report raise substantial doubt about whether we will be able to meet our obligations as they become due within one year after the date of this report.
We are highly leveraged and had approximately $483.3 million of debt as of December 31, 2016, including $429.6 million outstanding under our unsecured Senior Notes described below, $49.0 million outstanding under our secured Multicurrency Facility Agreement described below and $11.2 million outstanding under our secured Norwegian Facility Agreement described below. See Note 6. Our revolving credit facilities and the indenture governing our Senior Notes contain certain financial and other covenants that are more fully described below in Note 6. At December 31, 2016, we had an aggregate of approximately $94.0 million of borrowing capacity, net of standby letters of credit, under our Multicurrency Facility Agreement and Norwegian Facility Agreement and we had approximately $8.8 million of cash on hand.
At December 31, 2016, we were in compliance with all financial covenants set forth in our revolving credit facilities and the indenture governing our Senior Notes; however, we are forecasting that for the quarter ending March 31, 2017, we will no longer be in compliance with the minimum consolidated adjusted EBITDA requirement contained in the Multicurrency Facility Agreement and the Norwegian Facility Agreement. Absent waivers or cures, non-compliance with such covenants would constitute an event of default under the Multicurrency Facility Agreement and the Norwegian Facility Agreement. As a result, all indebtedness under the Multicurrency Facility Agreement and the Norwegian Facility Agreement could be declared immediately due and payable upon the occurrence of such event of default, subject to any available cure periods. It is possible that we could obtain waivers from our lenders; however, our expectations concerning future losses from operations and cash flows and other liquidity risks raise substantial doubt about whether we will be able to meet our obligations as they become due within one year after the date of this report.
We also have not paid the $13.7 million interest payment due March 15, 2017 on our Senior Notes and, as provided for in the indenture governing the Senior Notes, have entered into the 30-day grace period to make such payment. Failure to pay this amount on March 15, 2017 would constitute an event of default under the indenture governing the Senior Notes if the payment is not made within 30 days of such date and would result in a cross-default under the Multicurrency Facility Agreement and the Norwegian Facility Agreement. As a result of these factors and the additional matters discussed below, as well as the continued downturn in the oil and gas industry and the decrease in offshore oil and natural gas exploration activities, among others, there exists substantial doubt whether we will be able to continue as a going concern.
Since December 31, 2016, we have made additional borrowings under our revolving credit facilities and as of March 15, 2017, the amount outstanding under our Multicurrency Facility Agreement had increased to approximately $72.0 million and the amount outstanding under our Norwegian Facility Agreement had increased to approximately $35.0 million. As of March 15, 2017, we had approximately $25.8 million of cash on hand. On March 8, 2017, we entered into an agreement with the agent under our Multicurrency Facility Agreement that prohibits us from requesting any additional loans under the Multicurrency Facility Agreement without the prior written consent of the agent (acting upon the instruction of all the lenders following unanimous consent). In this agreement, the lenders agreed to extend additional revolving loans in the aggregate principal amount of $10.0 million, subject to certain conditions precedent, including payment by us of certain fees and retainers of a financial advisor and counsel for the agent, and the lenders agreed to waive any default or event of default (no such default or event of default having been admitted by us) arising by virtue of a borrowing request submitted previously by us, which request was deemed to be withdrawn pursuant to the agreement. The lenders funded loans in such amount on March 8, 2017.
Our consolidated financial statements as of and for the year ended December 31, 2016 have been prepared assuming we will continue as a going concern, which contemplates continuity of operations, realization of assets and the satisfaction of liabilities in the normal course of business for the twelve-month period following the date of the consolidated financial statements. However, for the reasons described herein, indebtedness with the stated maturities as summarized in Note 6 is classified as a current liability at December 31, 2016. The report from our independent registered public accounting firm on our consolidated financial statements for the year ended December 31, 2016 includes an uncertainty paragraph that arises from the substantial doubt about our ability to continue as a going concern.
Our Multicurrency Facility Agreement contains requirements that, among other things, require that we deliver an unqualified audit opinion from our auditors that is not subject to a going concern or like qualification or exception. The failure to deliver such an unqualified opinion constitutes an event of default under the Multicurrency Facility Agreement, which allows the lenders thereunder to cancel their commitments, accelerate the indebtedness thereunder and exercise remedies with respect to the collateral securing the Multicurrency Facility Agreement, the effect of which likewise is to cause a cross-default under our Norwegian Facility Agreement permitting the lenders thereunder to cancel their commitments, accelerate the indebtedness thereunder and exercise remedies with respect to the collateral securing the Norwegian Facility Agreement unless a waiver or forbearance is received from the lenders under the Multicurrency Facility Agreement. If the indebtedness under either the Multicurrency Facility Agreement or the Norwegian Facility Agreement is accelerated, it would, subject to a 15-business day cure period, constitute an event of default under the indenture governing our Senior Notes.
On March 14, 2017, we entered into a support agreement, or Support Agreement, with the agent under the Multicurrency Facility Agreement in which the lenders agreed to waive the existing or anticipated defaults or events of default under the Multicurrency Facility Agreement listed in the Support Agreement and forbear from exercising rights or remedies under the related finance documents as a result therefrom, for a limited support period. The Support Agreement, and the waiver and forbearance provided for therein, terminates upon the earliest to occur of certain termination events described therein or April 14, 2017.
If lenders or noteholders accelerate our outstanding indebtedness, our borrowings will become immediately payable and we will not have sufficient liquidity to repay those accelerated amounts. If we are unable to reach an agreement with lenders and noteholders to address any such defaults, we would likely pursue a variety of solutions that may include strategic and refinancing alternatives through a private restructuring of our indebtedness, seeking additional debt or equity financing, assets sales or a filing under Chapter 11 of the U.S. Bankruptcy Code, which could include a restructuring of our various debt obligations.
We are engaged in discussions with our principal lenders and noteholders to waive covenant breaches, including financial covenants and the inclusion of a going concern qualification in the audit opinion from our auditors, and/or to amend the underlying agreements. Any such amendments and/or waivers would require successful negotiations with our bank group and noteholders, and may require us to make certain concessions under the existing agreements, such as providing additional collateral, paying a higher rate of interest or some combination of these or others. Obtaining covenant relief will require us to reach an agreement that satisfies potentially divergent interests of our lenders and noteholders.
(3) IMPAIRMENT CHARGES
Reduction in Value of Long-lived Assets and Goodwill
Our tangible long-lived assets consist primarily of vessels and construction-in-progress. Our intangible asset was associated with customer relationships in the U.S. Gulf of Mexico acquired in our 2008 acquisition of Rigdon Marine Corporation and Rigdon Marine Holdings, LLC. Our goodwill was related to the 2001 acquisition of Sea Truck Holding AS and the 1998 acquisition of Brovig Supply AS. We review long-lived assets for impairment whenever events or changes in circumstances indicate that the carrying amount of such assets may not be recoverable. We assess potential impairment by comparing the carrying values of the long-lived assets to the undiscounted cash flows expected to be received from those assets. If impairment is indicated, we determine the amount of impairment expense by comparing the carrying value of the long-lived assets with their fair market value. We base our undiscounted cash flow estimates on, among other things, historical results adjusted to reflect the best estimate of future operating performance. We obtain estimates of fair value of our vessels from independent appraisal firms. Goodwill was tested for impairment in the third quarter each year or on an interim basis if events or circumstances indicated that the fair value of goodwill had decreased below its carrying value. Management’s assumptions are an inherent part of our asset impairment evaluation, and the use of different assumptions could produce results that differ from those reported.
Beginning in late 2014, oil prices declined significantly. Prices continued to decline throughout 2015and into 2016, reaching a low of less than $30 per barrel in the first quarter of 2016. Prices recovered over the remainder of 2016, stabilizing at over $40 per barrel for much of the second and third quarters of 2016 and further increasing to over $50 per barrel in the fourth quarter of 2016. This recent surge in prices is attributable to the Organization of Petroleum Exporting Countries (OPEC) decision to limit production at its November 2016 meeting. However, prices continue to be volatile and are subject to significant uncertainty. The lower price environment impacted the operational plans for oil companies beginning in late 2014 and consequently adversely affected the drilling and support service sector. The decrease in day rates and utilization for offshore vessels has been significant. In addition, the independent appraisal firms have lowered the fair value estimates related to our vessels in each quarter since the fourth quarter of 2014. As a result of these factors, we have performed a number of reviews for impairment since the fourth quarter of 2014.
See the discussions below detailing our impairment analyses and processes for each of goodwill, long-lived assets, intangible assets, vessel components and assets held for sale. The components of reduction in value of assets are as follows (in thousands):
|
2016 |
2015 |
2014 |
||||||||||
|
Goodwill impairment |
$ | - | $ | 22,554 | $ | - | ||||||
|
Long-lived assets impairment |
160,222 | 115,489 | - | |||||||||
|
Intangible asset impairment |
- | 13,695 | - | |||||||||
|
Vessel component impairment |
2,586 | 365 | 7,459 | |||||||||
|
Assets held for sale |
- | - | 1,536 | |||||||||
|
Total reduction in value of assets |
$ | 162,808 | $ | 152,103 | $ | 8,995 | ||||||
Goodwill Impairment
We completed a qualitative analysis of goodwill in the third quarter of 2015 and determined that further testing was necessary. Our goodwill impairment evaluation indicated that the carrying value of the North Sea segment exceeded its fair value so that goodwill was potentially impaired. We then performed the second step of the goodwill impairment test, which involved calculating the implied fair value of our goodwill by allocating the fair value of the North Sea segment to all of the assets and liabilities (other than goodwill) and comparing it to the carrying amount of goodwill. To estimate the fair value of the reporting unit we used a 50% weighting of the discounted cash flow method and a 50% weighting of the public company guideline method in determining fair value of the North Sea reporting unit.
We determined that the implied fair value of our goodwill for the North Sea segment was less than its carrying value and in the third quarter of 2015 we recorded a $22.6 million impairment of the North Sea segment’s goodwill. As a result of this impairment, we no longer have any goodwill.
Long-Lived Asset Impairment
In the third quarter of 2015, we recorded $129.2 million of impairment expense related to our long-lived assets in the U.S. Gulf of Mexico, which is a part of our Americas segment. The impairment consisted of $115.5 million related to our vessels and $13.7 million related to our intangible asset. As a result of this impairment, we no longer have an intangible asset.
In the first and second quarters of 2016, we recorded an aggregate of $160.2 million of impairment expense related to our long-lived assets. Impairment charges totaled $94.5 million for the U.S. Gulf of Mexico and $15.9 million for the non-U.S. Americas, both part of the Americas segment. We also recorded impairment in Southeast Asia totaling $49.8 million.
Vessel Component Impairment
We have vessel components in our North Sea and Southeast Asia segments that we intend to sell. We recorded impairment based on third party appraisals of the North Sea components totaling $7.5 million in the third quarter of 2014 and $0.4 million in the third quarter of 2015. Based on third party valuations, we recorded impairment expense related to these assets totaling $2.6 million, consisting of $2.0 million in the North Sea and $0.6 million in Southeast Asia, in the first quarter of 2016.
Assets Held For Sale
At December 31, 2014, we classified an additional North Sea vessel as an asset held for sale and determined that its carrying value was less than our estimate of the amount we would realize in a sale. As a result, we reduced the carrying value by $1.5 million which is included in our results of operations as an impairment. The adjusted carrying value of this vessel is based on a purchase and sale agreement. In January 2015, we completed the sale of the asset at its adjusted carrying value.
(4) VESSEL ACQUISITIONS, DISPOSITIONS AND NEW-BUILD PROGRAM
During 2016, we sold one older vessel from our North Sea region fleet and three vessels from our Southeast Asia fleet for combined proceeds of $6.5 million. The sales of these vessels generated a combined loss on sales of assets of $8.6 million. In March 2017, we sold two of our fast supply vessels and will record a first quarter 2017 combined loss on sales of assets of $5.3 million.
At December 31, 2015, we had two vessels under construction in the U.S. that were significantly delayed. In March 2016, we resolved certain matters under dispute with the shipbuilder and reset the contract schedules so that we would take delivery of the first vessel in mid-2016 and the second vessel in mid-2017, at which time a final payment of $26.0 million would be due. We took delivery of the first of these vessels during the second quarter of 2016. Under the settlement, we can elect not to take delivery of the second vessel and forego the final payment, in which case the shipbuilder will retain the vessel.
We had a vessel under construction in Norway that was scheduled to be completed and delivered during the first quarter of 2016; however, in the fourth quarter of 2015 we amended our contract with the shipbuilder to delay delivery of the vessel until January 2017. Concurrently, in order to delay the payment of a substantial portion of the construction costs, we agreed to pay monthly installments through May 2016 totaling 92.2 million NOK (or approximately $11.0 million) and to pay a final installment on delivery in January 2017 of 195.0 million NOK (or approximately $23.3 million at delivery). We paid such final installment and took delivery of this vessel in January 2017.
|
Vessel Additions Since December 31, 2015 | ||||||||||||||||
|
Year |
Length |
Month | ||||||||||||||
| Vessel | Region | Type(1) |
Built |
(feet) |
BHP(2) | DWT(3) |
Delivered | |||||||||
|
Hercules |
Americas |
LgPSV |
2016 |
286 | 10,960 | 5,300 |
Jun-16 | |||||||||
|
North Barents |
N. Sea |
LgPSV |
2017 |
304 | 11,935 | 4,700 |
Jan-17 | |||||||||
|
Vessels Disposed of Since December 31, 2015 | ||||||||||||||||
|
Year |
Length |
Month | ||||||||||||||
| Vessel | Region | Type(1) |
Built |
(feet) |
BHP(2) | DWT(3) |
Disposed | |||||||||
|
Highland Spirit |
N. Sea |
SpV |
1998 |
202 | 6,000 | 1,620 |
May-16 | |||||||||
|
Sea Intrepid |
SEA |
SmAHTS |
2005 |
193 | 5,150 | 1,500 |
Jul-16 | |||||||||
|
Sea Guardian |
SEA |
SmAHTS |
2006 |
193 | 5,150 | 1,500 |
Jul-16 | |||||||||
|
Highland Drummer |
SEA |
LgPSV |
1997 |
220 | 5,450 | 3,122 |
Nov-16 | |||||||||
|
Mako |
Americas |
FSV |
2008 |
181 | 7,200 | 552 |
Mar-17 | |||||||||
|
Tiger |
Americas |
FSV |
2009 |
181 | 7,200 | 552 |
Mar-17 | |||||||||
(1) LgPSV - Large Platform Supply Vessel, SpV - Special Purpose Vessel, SmAHTS - Small Anchor Handling Vessel, FSV - Fast Supply Vessel
(2)BHP - Brake Horsepower
(3)DWT - Deadweight Tons
|
Vessel Additions Since December 31, 2014 | ||||||||||||||||
|
Vessel |
Region |
Type(1) |
Year Built |
Length (feet) |
BHP(2) |
DWT(3) |
Month Delivered | |||||||||
|
Regulus |
Americas |
LgPSV |
2015 |
272 | 9,849 | 3,580 |
Jan-15 | |||||||||
|
Vessels Disposed of Since December 31, 2014 | ||||||||||||||||
|
Vessel |
Region |
Type(1) |
Year Built |
Length (feet) |
BHP(2) |
DWT(3) |
Month Disposed | |||||||||
|
North Truck |
N. Sea |
LgPSV |
1983 |
265 | 6,120 | 3,370 |
Jan-15 | |||||||||
|
Highland Trader |
N. Sea |
LgPSV |
1996 |
220 | 5,450 | 3,115 |
Jul-15 | |||||||||
|
Highland Star |
N. Sea |
LgPSV |
1991 |
268 | 6,600 | 3,075 |
Nov-15 | |||||||||
(1) LgPSV - Large Platform Supply Vessel
(2)BHP - Brake Horsepower
(3)DWT - Deadweight Tons
(5) GOODWILL AND INTANGIBLES
Changes to goodwill are as follows:
|
2016 |
2015 |
2014 |
||||||||||
|
(In thousands) |
||||||||||||
|
Balance, January 1, |
$ | - | $ | 25,010 | $ | 30,676 | ||||||
|
Impact of foreign currency translation and adjustment |
- | (2,456 | ) | (5,666 | ) | |||||||
|
Impairment |
- | (22,554 | ) | - | ||||||||
|
Balance, December 31, |
$ | - | $ | - | $ | 25,010 | ||||||
We recorded impairment equal to 100% of the balance in goodwill on September 30, 2015. See Note 3.
Intangible assets were recorded at cost and were amortized on a straight-line basis over the years expected to be benefited, estimated to be 12 years. We recorded an impairment equal to 100% of the balance in intangible assets on September 30, 2015. See Note 3. Amortization expense related to intangible assets was $2.1 million for the year ended December 31, 2015 and $2.9 million for the year ended December 31, 2014.
(6) LONG-TERM DEBT
Our long-term debt at December 31, 2016 and 2015 consisted of the following:
|
December 31, 2016 |
December 31, 2015 |
|||||||
|
(In thousands) |
||||||||
|
Senior Notes Due 2022 |
$ | 429,640 | $ | 499,000 | ||||
|
Multicurrency Facility Agreement |
49,000 | - | ||||||
|
Norwegian Facility Agreement |
11,157 | - | ||||||
| 489,797 | 499,000 | |||||||
|
Debt Premium |
423 | 607 | ||||||
|
Debt Issuance Costs Associated with the Senior Notes |
(6,894 | ) | (9,018 | ) | ||||
|
Total |
$ | 483,326 | $ | 490,589 | ||||
The following is a summary of scheduled debt maturities by year:
|
Year |
Debt Maturity |
|||
|
(In thousands) |
||||
|
2017 |
- | |||
|
2018 |
- | |||
|
2019 |
60,157 | |||
|
2020 |
- | |||
|
2021 |
- | |||
|
Thereafter |
429,640 | |||
|
Total |
$ | 489,797 | ||
Our consolidated financial statements as of and for the year ended December 31, 2016 have been prepared assuming we will continue as a going concern, which contemplates continuity of operations, realization of assets and the satisfaction of liabilities in the normal course of business for the twelve-month period following the date of the consolidated financial statements. However, for the reasons described in Note 2, indebtedness with the stated maturities as summarized above is classified as a current liability at December 31, 2016.
Senior Notes Due 2022
In March and December 2012, we issued $500.0 million aggregate principal amount of 6.375% senior notes due 2022, or the Senior Notes. The Senior Notes pay interest semi-annually on March 15 and September 15. Prior to March 15, 2017, we may redeem some or all of the Senior Notes for cash at a redemption price equal to 100% of their principal amount plus an applicable make-whole premium and accrued and unpaid interest to the redemption date. The make-whole premium is based on the U.S. Treasury Rate plus 50 basis points. On and after March 15, 2017, we may redeem some or all of the Senior Notes at the redemption prices (expressed as percentages of principal amount) equal to 103.188% for the twelve-month period beginning March 15, 2017, 102.125% for the twelve-month period beginning March 15, 2018, 101.063% for the twelve-month period beginning March 15, 2019 and 100.000% beginning March 15, 2020 and thereafter, plus accrued and unpaid interest to the redemption date.
In December 2015, we repurchased in the open market $1.0 million face value of the Senior Notes leaving $499.0 million aggregate principal amount of the Senior Notes outstanding at December 31, 2015. In 2016, we repurchased in the open market $69.4 million face value of the Senior Notes and recorded gains totaling approximately $35.9 million, which gains are included in other income and expense in our consolidated statements of operations.
In conjunction with the Senior Notes offering, we incurred a total of $12.7 million in debt issuance costs. In prior periods, debt issuance costs were included in our consolidated balance sheet under deferred costs and other assets. Under the provisions of ASU No. 2015-03, the unamortized balance in debt issuance costs is included in our consolidated balance sheet as a direct deduction from the face amount of the Senior Notes. This change in accounting principle was applied retrospectively; therefore, the December 31, 2015 presentation of deferred costs and other assets and long term debt in our consolidated financial statements has been adjusted to conform to this standard. The effective interest rate on the Senior Notes, adjusted for the premium and debt issuance costs, is 6.73%.
At December 31, 2016, the fair value of the Senior Notes, based on quoted market prices, was approximately $234.9 million compared to a carrying amount of $429.6 million.
We have not paid the $13.7 million interest payment due March 15, 2017 on our Senior Notes and, as provided for in the indenture governing the Senior Notes, have entered into the 30-day grace period to make such payment. Failure to pay this amount on March 15, 2017 would constitute an event of default under the indenture governing the Senior Notes if the payment is not made within 30 days of such date and would result in a cross-default under the Multicurrency Facility Agreement and the Norwegian Facility Agreement.
Multicurrency Facility Agreement
We are party to a senior secured, revolving multicurrency credit facility, or the Multicurrency Facility Agreement, among GulfMark Offshore, Inc., as guarantor, one of our indirect wholly-owned subsidiaries, GulfMark Americas, Inc., as the Borrower, a group of financial institutions as the lenders and the Royal Bank of Scotland plc, as agent for the lenders, and the other parties thereto. The Multicurrency Facility Agreement has a scheduled maturity date of September 26, 2019 and, as amended, commits the lenders to provide revolving loans of up to $100.0 million at any one time outstanding, subject to certain terms and conditions set forth in the Multicurrency Facility Agreement, and contains a sublimit of $25.0 million for swingline loans and a sublimit of $5.0 million for the issuance of letters of credit. Revolving loans drawn under the Multicurrency Facility Agreement and denominated in U.S. Dollars accrue interest at the London Interbank Offered Rate, or LIBOR, plus an applicable margin which may range from 2.75% to 4.00%, while swingline loans drawn under the Multicurrency Facility Agreement accrue interest at the alternate base rate. The applicable margin is determined by reference to the capitalization ratio calculated as of the last day of the most recent fiscal quarter. The applicable interest rate for overdue amounts increases by an additional 2.00%. The fee for unused commitments is 1.25% per annum. We are subject to certain covenants and other obligations under the Multicurrency Facility Agreement, which include, among others:
● the maintenance of a capitalization ratio not to exceed 60% at the end of each fiscal quarter;
● the maintenance of a minimum consolidated interest coverage ratio, for any period of four consecutive fiscal quarters, of 1.5 to 1.0 beginning on September 30, 2017 and increasing periodically thereafter;
● the maintenance of a minimum collateral to debt ratio of 3.0 to 1.0 at the end of each fiscal quarter;
● the maintenance of a minimum collateral to commitments ratio of 2.0 to 1.0 at the end of each fiscal quarter;
● the maintenance of a minimum consolidated adjusted EBITDA, at the end of each fiscal quarter, of $20.0 million for the twelve-month period ended September 30, 2016, and for each twelve-month period thereafter through the fiscal quarter ending June 30, 2017;
● the maintenance of a minimum liquidity amount of $35.0 million (as determined under the Multicurrency Facility Agreement) at the end of each fiscal quarter;
● the delivery of a monthly information packet to the agent;
● the delivery of an appraised value for each of the collateral vessels to the agent in each fiscal quarter;
● the mandatory prepayment of any loans outstanding if, at the end of a fiscal quarter, we have cash, on a consolidated basis, in excess of $35.0 million;
● a prohibition against drawing loans under the Multicurrency Facility Agreement for the purpose of funding payments on our platform supply vessel, or PSV, delivered by Simek in January 2017;
● the limitation of the amount of cash we may invest for certain capital expenditures, acquisitions, joint ventures, dividends and share repurchases;
● the limitation of acquisitions, mergers, consolidations, joint ventures, changes of business, changes of ownership, indebtedness and asset sales, subject to certain exceptions; and
● the prohibition of liens on certain of our assets, subject to certain exceptions.
We had unamortized fees paid to the arrangers, the agent and the security trustee totaling $2.5 million at December 31, 2016, which fees were amortized into interest cost on a straight-line basis over the life of the Multicurrency Facility Agreement.
The Multicurrency Facility Agreement is secured by 24 vessels owned by the Borrower. The collateral that secures the loans under the Multicurrency Facility Agreement may also secure all of the Borrower’s obligations under any hedging agreements between the Borrower and any lender or other hedge counterparty to the Multicurrency Facility Agreement.
We unconditionally guaranteed all existing and future indebtedness and liabilities of the Borrower arising under the Multicurrency Facility Agreement and other related loan documents. Such guarantee may also cover obligations of the Borrower arising under any hedging arrangements. At December 31, 2016 we had $49.0 million borrowed and outstanding under the Multicurrency Facility Agreement and we were in compliance with all the covenants under the Multicurrency Facility Agreement. The unused borrowing capacity under the Multicurrency Facility Agreement at December 31, 2016, after giving effect to standby letters of credit, was $35.8 million. The weighted average interest rate on our outstanding borrowings under the Multicurrency Facility Agreement was 4.62%.
On March 8, 2017, we entered into an agreement with the agent under our Multicurrency Facility Agreement that prohibits us from requesting any additional loans under the Multicurrency Facility Agreement without the prior written consent of the agent (acting upon the instruction of all the lenders following unanimous consent). In this agreement, the lenders agreed to extend additional revolving loans in the aggregate principal amount of $10.0 million subject to certain conditions precedent, including payment by us of certain fees and retainers of a financial advisor and counsel for the agent, and the lenders agreed to waive any default or event of default (no such default or event of default having been admitted by us) arising by virtue of a borrowing request submitted previously by us, which request was deemed to be withdrawn pursuant to the agreement. The lenders funded loans in such amount on March 8, 2017. In addition, we are obligated to provide the agent certain information including a revised budget, a revised forecast and weekly financial information, in each case by specified deadlines, and to keep the agent and the lenders informed of negotiations and discussions with holders of our indebtedness. The lenders agreed that between the date of the agreement through March 14, 2017, no lender shall, in its capacity as lender, exercise any right of set off, combination of accounts or similar remedy in relation to the cash of the obligors under the Multicurrency Facility Agreement in respect of any amounts that are outstanding or may become outstanding under the Multicurrency Facility Agreement.
On March 14, 2017, we entered into a support agreement, or Support Agreement, with the agent under the Multicurrency Facility Agreement in which the lenders agreed to waive the existing or anticipated defaults or events of default under the Multicurrency Facility Agreement listed in the Support Agreement and forbear from exercising rights or remedies under the related finance documents as a result therefrom, for a limited support period. The Support Agreement, and the waiver and forbearance provided for therein, terminates upon the earliest to occur of certain termination events described therein or April 14, 2017.
Norwegian Facility Agreement
We are party to a senior secured revolving credit facility, or the Norwegian Facility Agreement, among GulfMark Offshore, Inc., as guarantor, one of our indirect wholly-owned subsidiaries, GulfMark Rederi AS, as the borrower, which we refer to as the Norwegian Borrower, and DNB Bank ASA, a Norwegian bank, as lead arranger and lender, which we refer to as the Norwegian Lender. The Norwegian Facility Agreement has a scheduled maturity date of September 30, 2019 and commits the Norwegian Lender to provide loans of up to an aggregate principal amount of 600.0 million NOK (or approximately $69.4 million at December 31, 2016) at any one time outstanding, subject to certain terms and conditions. Loans under the Norwegian Facility Agreement accrue interest at the Norwegian Interbank Offered Rate, or NIBOR, or, if the loan is denominated in U.S. Dollars, LIBOR, plus an applicable margin which may range from 2.50% to 4.00%, depending on the interest coverage ratio. During the continuance of an event of default, upon notice by the agent under the Norwegian Facility Agreement, the applicable interest rate increases by an additional 2.00%. The fee for unused commitments is 1.25% per annum. We are subject to certain covenants and other obligations under the Norwegian Facility Agreement, which include, among other things:
● the maintenance of a capitalization ratio not to exceed 60% at the end of each fiscal quarter;
● the maintenance of a minimum consolidated interest coverage ratio, for any period of four consecutive fiscal quarters, of 1.5 to 1.0, beginning at the end of our third fiscal quarter of 2017 and increasing periodically thereafter;
● the maintenance of a minimum collateral to debt ratio, as defined, of 3.0 to 1.0 at the end of each fiscal quarter;
● the maintenance of a minimum collateral to commitments ratio, as defined, of 2.0 to 1.0 at the end of each fiscal quarter;
● the maintenance of a minimum consolidated adjusted EBITDA as of the end of each fiscal quarter of $20.0 million for the twelve-month period ended September 30, 2016, and for each twelve-month period thereafter through the fiscal quarter ending June 30, 2017;
● the maintenance of a minimum liquidity amount of $35.0 million at the end of each fiscal quarter;
● the mandatory prepayment of any loans outstanding if, at the end of a fiscal quarter, we have cash, on a consolidated basis, in excess of $35.0 million;
● the mandatory prepayment of any loans outstanding if, at any time, the fleet market value of the vessels securing the Norwegian Facility Agreement is less than 300% of the aggregate outstanding unpaid loans (unless we elect to provide additional security acceptable to the agent in its sole discretion);
● the limitation of mergers, consolidations, divestitures, restructurings and changes of business, subject to certain exceptions;
● the prohibition of liens on certain of our vessels, subject to certain exceptions; and
● the requirement that we remain listed on the New York Stock Exchange or another recognized stock exchange.
We had unamortized fees paid to the arrangers, the agent and the security trustee totaling $1.2 million at December 31, 2016, which fees are being amortized into interest cost on a straight-line basis over the life of the Norwegian Facility Agreement.
The Norwegian Facility Agreement is secured by seven vessels owned by our subsidiary GulfMark UK Ltd. and by four vessels of the Norwegian Borrower and our additional North Sea PSV which was delivered in January 2017. The collateral that secures the loans under the Norwegian Facility Agreement may also secure all of the Norwegian Borrower’s obligations under any hedging agreements between the Norwegian Borrower and the Norwegian Lender or other hedge counterparty to the Norwegian Facility Agreement.
We unconditionally guaranteed all existing and future indebtedness and liabilities of the Norwegian Borrower arising under the Norwegian Facility Agreement and other related loan documents. Such guarantee may also cover obligations of the Norwegian Borrower arising under any hedging arrangements described above. At December 31, 2016, we had $11.2 million borrowed and outstanding under the Norwegian Facility Agreement and we were in compliance with all the covenants under the Norwegian Facility Agreement. The unused borrowing capacity under the Norwegian Facility Agreement at December 31, 2016 was $58.2 million.
At December 31, 2016, the weighted average interest rate on our outstanding borrowings under the Norwegian Facility Agreement was 4.38%.
(7) INCOME TAXES
The majority of our non-U.S. based operations are subject to foreign tax systems that provide significant incentives to qualified shipping activities. Our U.K. and Norway based vessels are taxed under “tonnage tax” regimes. Our qualified Singapore based vessels are exempt from Singapore taxation through December 2017 with extensions available in certain circumstances beyond 2017. The qualified Singapore vessels are also subject to specific qualification requirements which if not met could jeopardize our qualified status in Singapore. The tonnage tax regimes provide for a tax based on the net tonnage weight of a qualified vessel. These beneficial foreign tax structures continued to result in our earnings incurring significantly lower taxes than those that would apply under the U.S. statutory tax rates or if we were not a qualified shipping company in those foreign jurisdictions.
Should our operational structure change or should the laws that created these shipping tax regimes change, we could be required to provide for taxes at rates much higher than those currently reflected in our financial statements. Additionally, if our pre-tax earnings in higher tax jurisdictions increase, there could be a significant increase in our annual effective tax rate. Any such increase could cause volatility in the comparisons of our effective tax rate from period to period.
U.S. foreign tax credits can be carried forward for ten years. We have $33.5 million of such foreign tax credit carryforwards that begin to expire in 2017. As of December 31, 2016, we had an $21.8 million of valuation allowance for these credits. We have considered estimated future taxable income in the relevant tax jurisdictions to utilize these tax credits and have considered what we believe to be ongoing prudent and feasible tax planning strategies in assessing the need for the valuation allowance. This information is based on estimates and assumptions including projected taxable income. If these estimates and related assumptions change in the future, or if we determine that we would not be able to realize other deferred tax assets in the future, an adjustment to the valuation allowance would be recorded in the period such determination was made.
For the year ended December 31, 2016, we increased by $2.9 million the U.S. federal income tax provision for the amount of employee stock-based compensation less than book cost. This increase reduces a long term deferred tax asset for the decrease to our federal income tax net operating loss. In the future, we are able to recognize this tax benefit only to the extent that it reduces our income taxes payable as a current year deduction or through utilization of prior years' net operating losses.
Income (loss) before income taxes attributable to domestic and foreign operations was (in thousands):
|
Year Ended December 31, |
||||||||||||
|
2016 |
2015 |
2014 |
||||||||||
|
U.S. |
$ | (133,572 | ) | $ | (198,175 | ) | $ | 1,189 | ||||
|
Foreign |
(108,865 | ) | (22,693 | ) | 70,456 | |||||||
| $ | (242,437 | ) | $ | (220,868 | ) | $ | 71,645 | |||||
The components of our tax provision (benefit) attributable to income before income taxes are as follows for the year ended December 31, (in thousands):
|
2016 |
2015 |
2014 |
||||||||||||||||||||||||||||||||||||||||||||||
|
Current |
Deferred |
Other (a) |
Total |
Current |
Deferred |
Other (a) |
Total |
Current |
Deferred |
Other (a) |
Total |
|||||||||||||||||||||||||||||||||||||
|
U.S & State |
$ | - | $ | (36,442 | ) | $ | (6 | ) | $ | (36,448 | ) | $ | (69 | ) | $ | (3,270 | ) | $ | 39 | $ | (3,300 | ) | $ | 464 | $ | 80 | $ | 1,627 | $ | 2,171 | ||||||||||||||||||
|
Foreign |
1,419 | (2,014 | ) | (2,415 | ) | (3,010 | ) | 1,130 | (553 | ) | (2,910 | ) | (2,333 | ) | 5,544 | (146 | ) | 1,701 | 7,099 | |||||||||||||||||||||||||||||
| $ | 1,419 | $ | (38,456 | ) | $ | (2,421 | ) | $ | (39,458 | ) | $ | 1,061 | $ | (3,823 | ) | $ | (2,871 | ) | $ | (5,633 | ) | $ | 6,008 | $ | (66 | ) | $ | 3,328 | $ | 9,270 | ||||||||||||||||||
(a) Includes income tax effects determined under a more likely than not, or greater than 50% probability, threshold and the book deferred tax effect related to intercompany asset sales.
The mix of our operations within various taxing jurisdictions affects our overall tax provision. The difference between the provision at the statutory U.S. federal tax rate and the tax provision attributable to income before income taxes in the accompanying consolidated statements of operations is as follows:
|
2016 |
2015 |
2014 |
||||||||||
|
U.S. federal statutory income tax rate |
(35.0 |
)% |
(35.0 |
)% |
35.0 |
% | ||||||
|
Effect of foreign operations |
14.5 | 2.5 | (25.2 | ) | ||||||||
|
US state income taxes net of Federal benefit |
(1.1 | ) | (1.7 | ) | 1.4 | |||||||
|
Foreign earnings repatriation |
6.7 | 34.4 | - | |||||||||
|
U.S. foreign tax credit |
(2.7 | ) | (7.8 | ) | - | |||||||
|
Valuation allowance |
1.8 | 5.1 | 0.5 | |||||||||
|
Other |
(0.5 | ) | (0.1 | ) | 1.2 | |||||||
|
Total |
(16.3 |
)% |
(2.6 |
)% |
12.9 |
% | ||||||
Deferred income taxes reflect the impact of temporary differences between the amount of assets and liabilities for financial reporting purposes and such amounts as measured by tax laws and regulations. The components of the net deferred tax assets and liabilities at December 31, 2016 and 2015 were as follows:
|
December 31, |
||||||||
|
2016 |
2015 |
|||||||
|
(In thousands) |
||||||||
|
Deferred tax assets |
||||||||
|
Net operating loss carryforwards |
$ | 60,772 | $ | 49,900 | ||||
|
Items currently not deductible for tax purposes |
21,445 | 20,753 | ||||||
|
Foreign and other tax credit carryforwards |
34,131 | 27,450 | ||||||
| 116,348 | 98,103 | |||||||
|
Less valuation allowance |
(33,037 | ) | (23,742 | ) | ||||
|
Net deferred tax assets |
$ | 83,311 | $ | 74,361 | ||||
|
Deferred tax liabilities |
||||||||
|
Depreciation |
$ | (91,105 | ) | $ | (121,525 | ) | ||
|
Other |
(48,922 | ) | (50,889 | ) | ||||
|
Total deferred tax liabilities |
$ | (140,027 | ) | $ | (172,414 | ) | ||
|
Net deferred tax liability |
$ | (56,716 | ) | $ | (98,053 | ) | ||
The change in the total valuation allowance for the year ended December 31, 2016 from December 31, 2015 was an increase of $9.3 million. As of December 31, 2016, we had net operating loss carryforwards, or NOLs, for income tax purposes totaling $153.2 million in the U.S., $4.4 million in Mexico, $0.4 million in the U.K., $22.6 million in Brazil, and $6.8 million in Norway that are, subject to certain limitations, available to offset future taxable income. We have sufficient deferred tax liability reversals for depreciation and the remaining repatriation of foreign earnings that we expect to fully utilize the U.S. NOLs. The U.S. NOLs will begin to expire beginning in 2023. It is more likely than not that the Norway NOLs and the Brazilian NOLs will not be utilized and a full valuation allowance has been established for such NOLs. Based on future expected U.S. taxable income, as of December 31, 2016, we have recorded $21.8 million of valuation allowance against U.S. foreign tax credits.
Deferred income tax assets and liabilities based on classification as current, or short-term, and long-term are included in our balance sheet as follows:
|
December 31, |
||||||||
|
2016 |
2015 |
|||||||
|
(In thousands) |
||||||||
|
Prepaid expenses and other current assets |
$ | 1,379 | $ | 1,386 | ||||
|
Total tax assets |
1,379 | 1,386 | ||||||
|
Deferred tax liabilities |
58,094 | 99,439 | ||||||
|
Total tax liabilities |
$ | 58,094 | $ | 99,439 | ||||
During 2015, we determined to repatriate all future foreign earnings and $200.0 million of prior earnings of certain of our non-U.S. subsidiaries, thereby reducing our total permanently reinvested earnings. During 2016, we determined to repatriate an additional $40.0 million of prior earnings of certain of our non-U.S. subsidiaries. The increase to our foreign repatriation strategy resulted in a non-cash tax charge in 2016 of approximately $14.0 million. We have not provided for U.S. deferred taxes on the remaining permanently reinvested earnings of approximately $565.3 million at December 31, 2016. If those earnings were repatriated, the incremental U.S. tax would be approximately 35% based on current tax law. In addition, as of December 31, 2016, we had approximately $8.6 million of cash held by our foreign subsidiaries which would be subject to U.S. tax upon repatriation.
Based on a more likely than not, or greater than 50% probability, recognition threshold and criteria for measurement of a tax position taken or expected to be taken in a tax return, we evaluate and record in certain circumstances an income tax liability for uncertain income tax positions. Numerous factors contribute to our evaluation and estimation of our tax positions and related tax liabilities and/or benefits, which may be adjusted periodically and may ultimately be resolved differently than we anticipate. We also consider existing accounting guidance on de-recognition, measurement, classification, interest and penalties, accounting in interim periods, disclosure and transition. Accordingly, we continue to recognize income tax related penalties and interest in our provision for income taxes and, to the extent applicable, in the corresponding balance sheet presentations for accrued income tax assets and liabilities, including any amounts for uncertain tax positions included in other income taxes payable in the consolidated balance sheets and which total $21.1 million at December 31, 2016, $24.7 million at December 31, 2015 and $24.7 million at December 31, 2014. In addition, the deferred tax asset was reduced by a $3.3 million unrecognized tax benefit for an uncertain tax position.
A reconciliation of the beginning and ending balances of the total amounts of gross unrecognized tax benefits is as follows:
|
2016 |
2015 |
2014 |
||||||||||
| (in thousands) | ||||||||||||
|
Unrecognized tax benefits balance at January 1, |
$ | 10,899 | $ | 10,659 | $ | 10,352 | ||||||
|
Gross increases for tax positions taken in prior years |
240 | 346 | 375 | |||||||||
|
Gross decreases for tax positions taken in prior years |
(152 | ) | (89 | ) | (68 | ) | ||||||
|
Other |
(1,813 | ) | (17 | ) | - | |||||||
|
Unrecognized tax benefits balance at December 31, |
$ | 9,174 | $ | 10,899 | $ | 10,659 | ||||||
We accrue interest and penalties related to unrecognized tax benefits in our provision for income taxes. At December 31, 2016, we had accrued interest and penalties related to unrecognized tax benefits of $11.9 million. The amount of interest and penalties recognized in our tax provision for the year ended December 31, 2016 was $1.0 million. The unrecognized tax benefits if recognized would affect the effective tax rate.
As of December 31, 2016, we may be subject to examination in the U.S. for years after 2002 and in seven major foreign tax jurisdictions with open years from 2002 to 2014.
(8) COMMITMENTS AND CONTINGENCIES
At December 31, 2016, we had long-term operating leases for office space, automobiles, temporary residences, and office equipment. Aggregate operating lease expense for the years ended December 31, 2016, 2015 and 2014 was $2.5 million, $2.8 million, and $3.0 million, respectively. Future minimum rental commitments under these leases are as follows (in thousands):
|
Year |
Minimum Rental Commitments |
|||
|
2017 |
$ | 1,495 | ||
|
2018 |
1,330 | |||
|
2019 |
1,232 | |||
|
2020 |
1,137 | |||
|
2021 |
365 | |||
|
Thereafter |
2,582 | |||
|
Total |
$ | 8,141 | ||
We execute letters of credit, performance bonds and other guarantees in the normal course of business that ensure our performance or payments to third parties. The aggregate notional value of these instruments was $1.2 million at December 31, 2016 and $1.8 million at December 31, 2015. In the past, no significant claims have been made against these financial instruments. We believe the likelihood of demand for payment under these instruments is remote and expect no material cash outlays to occur from these instruments.
We have contingent liabilities and future claims for which we have made estimates of the amount of the eventual cost to liquidate these liabilities or claims. These liabilities and claims may involve threatened or actual litigation where damages have not been specifically quantified but we have made an assessment of our exposure and recorded a provision in our accounts for the expected loss. We intend to defend these matters vigorously; however, litigation is inherently unpredictable, and the ultimate outcome or effect of such lawsuits and actions cannot be predicted with certainty. As a result, there can be no assurance as to the ultimate outcome of these lawsuits. Any claims against us, whether meritorious or not, could cause us to incur costs and expenses, require significant amounts of management time and result in the diversion of significant operations resources. Other claims or liabilities, including those related to taxes in foreign jurisdictions, may be estimated based on our experience in these matters and, where appropriate, the advice of outside counsel or other outside experts. Upon the ultimate resolution of the uncertainties surrounding our estimates of contingent liabilities and future claims, our future reported financial results will be impacted by the difference, if any, between our estimates and the actual amounts paid to settle the liabilities. In addition to estimates related to litigation and tax liabilities, other examples of liabilities requiring estimates of future exposure include contingencies arising out of acquisitions and divestitures. We determine our contingent liabilities based on the most recent information available to us at the time of such determination regarding the nature of the exposure. Such exposures may change from period to period based upon updated relevant facts and circumstances, which can cause the estimates to change. In the recent past, our estimates for contingent liabilities have been sufficient to cover the actual amount of our exposure. We do not believe that the outcome of these matters will have a material adverse effect on our business, financial condition, or results of operations.
|
(9) |
EQUITY INCENTIVE PLANS |
Stock Options, Restricted Stock and Stock Option Plans
In June 2010, the stockholders approved the GulfMark Offshore, Inc. 2010 Omnibus Equity Incentive Plan, or 2010 plan. A total of 1,000,000 shares of common stock were reserved for issuance of stock options, stock appreciation rights, restricted stock, stock units and performance cash awards under this plan. During the restricted period, the recipient has the right to vote on the restricted shares and receive dividends on the unvested restricted shares. Dividends are accrued on these unvested restricted shares and ultimately paid only if the awards vest.
In June 2011, the stockholders approved the GulfMark Offshore, Inc. 2011 Non-Employee Director Plan, or 2011 Director Plan, that replaced our 1997 Incentive Equity Plan. The 2011 Director Plan replaced the GulfMark Offshore, Inc. 2005 Non-Employee Director Plan. The terms of our 2011 Director Plan provide that each non-employee director will receive an annual grant of Class A common stock awards. The non-employee director may also be granted an annual stock option to purchase up to 6,000 shares of Class A common stock. The exercise price of options granted under the 2011 Director Plan is fixed at the fair market value of the Class A common stock on the date of grant. The maximum number of shares authorized under the 2011 Director Plan is 150,000.
In June 2014, the stockholders approved the GulfMark Offshore, Inc. 2014 Omnibus Equity Incentive Plan, or 2014 plan. The 2014 plan replaced the 2010 plan. We amended the 2014 plan in 2015 and 2016, primarily to authorize the issuance of more shares under it. Under the 2016 amendment of the 2014 plan a total of 1,000,000 additional shares of Class A common stock were reserved for issuance of stock options, stock appreciation rights, restricted stock, stock units and performance cash awards under this plan. During the restricted period, the recipient has the right to vote on the restricted shares and receive dividends on the unvested restricted shares. Dividends are accrued on these unvested restricted shares and ultimately paid only if the awards vest.
Restricted stock is subject to forfeiture restrictions and cannot be sold, transferred, or disposed of during the restriction period. The holders of restricted stock have the same rights as any stockholder with respect to such shares, including the right to vote and to receive dividends, except that any dividends attributable to restricted stock are accumulated and paid when the underlying stock vests. Restricted stock vests over three years.
A summary of the unvested restricted Class A common stock awarded pursuant to our incentive equity plans as of December 31, 2016 and changes during 2016 are presented below:
|
Shares |
Weighted Average Grant Date Fair Value |
|||||||
|
Nonvested at December 31, 2015 |
546,524 | $ | 27.05 | |||||
|
Granted |
1,000,485 | 3.54 | ||||||
|
Vested |
(255,851 | ) | 21.80 | |||||
|
Forfeited |
(52,436 | ) | 8.90 | |||||
|
Nonvested at December 31, 2016 |
1,238,722 | 9.91 | ||||||
|
2016 |
2015 |
2014 |
||||||||||
|
Weighted average grant date fair value of restricted stock awards granted |
$ | 3.54 | $ | 13.09 | $ | 44.49 | ||||||
|
Fair value of restricted stock vested (in millions) |
$ | 5.6 | $ | 8.1 | $ | 5.9 | ||||||
Stock options granted to purchase our shares have an exercise price equal to, or greater than, the fair market value of our Class A common stock on the date of grant. These stock options vest over three years from the date of grant and terminate at the earlier of the date of exercise or seven years from the date of grant. The fair value of stock option awards is determined using the Black-Scholes option-pricing model. The expected life of an option is estimated based on historical exercise behavior. Volatility assumptions are estimated based on the average of historical volatility over the previous three years measured from the grant date. Risk-free interest rates are based on U.S. Government Zero Coupon Bonds with a maturity corresponding to the Safe Harbor term. The dividend yield is based on the previous four quarters to the date of grant divided by the average stock price for the previous 200 days. Expected forfeiture rates are estimated based on historical forfeiture experience. We used the following weighted-average assumptions to estimate the fair value of stock options granted during 2015 and 2014. We did not grant any options in 2016.
|
2015 |
2014 |
|||||||
|
Expected option life - years |
4.5 | 4.5 | ||||||
|
Volatility |
41.05 | % | 40.36 | % | ||||
|
Risk-free interest rate |
1.30 | % | 1.55 | % | ||||
|
Dividend yield |
0 | % | 2.10 | % | ||||
The following table summarizes the stock option activity of our stock incentive plans in the indicated periods:
|
2016 |
2015 |
2014 |
||||||||||||||||||||||
|
Weighted |
Weighted |
Weighted |
||||||||||||||||||||||
|
Average |
Average |
Average |
||||||||||||||||||||||
|
Exercise |
Exercise |
Exercise |
||||||||||||||||||||||
|
Shares |
Price |
Shares |
Price |
Shares |
Price |
|||||||||||||||||||
|
Outstanding at beginning of year |
222,019 | $ | 27.01 | 140,293 | $ | 41.68 | 112,054 | $ | 41.02 | |||||||||||||||
|
Granted |
- | - | 165,879 | 12.45 | 36,394 | 44.19 | ||||||||||||||||||
|
Forfeitures |
(10,000 | ) | 12.55 | (84,153 | ) | 26.89 | (8,155 | ) | 42.55 | |||||||||||||||
|
Exercised |
- | - | - | - | - | - | ||||||||||||||||||
|
Outstanding at end of year |
212,019 | $ | 27.69 | 222,019 | $ | 27.01 | 140,293 | $ | 41.68 | |||||||||||||||
|
Exercisable shares and weighted average exercise price |
128,532 | $ | 33.83 | 57,859 | $ | 42.05 | 37,351 | $ | 41.02 | |||||||||||||||
|
Shares available for future grants at December 31: |
||||||||||||||||||||||||
|
2011 Director Plan |
54,537 | 78,582 | 93,772 | |||||||||||||||||||||
|
2010 Plan |
- | - | 378,374 | |||||||||||||||||||||
|
2014 Plan |
360,438 | 982,548 | - | |||||||||||||||||||||
|
Outstanding |
Exercisable |
||||||||||||||||||||||
|
Weighted |
Weighted |
Weighted |
|||||||||||||||||||||
|
Average |
Average |
Average |
|||||||||||||||||||||
|
Range of Exercise Prices |
Shares |
Exercise Price |
Remaining Life |
Shares |
Exercise Price |
||||||||||||||||||
| $9.19 | - | 46.57 | 212,019 | $ | 27.69 | - | 140,293 | $ | 41.68 | ||||||||||||||
| 212,019 | $ |
27.69 |
140,293 | $ | 41.68 | ||||||||||||||||||
The restrictions related to restricted stock awards terminate at the end of three years from the date of grant and the value of the restricted shares is amortized to expense over that period. Total amortization of stock based compensation related to restricted stock was $4.7 million, $5.9 million and $6.6 million for the years ended December 31, 2016, 2015 and 2014, respectively. Total stock based compensation for stock options was $0.4 million, $0.6 million and $0.5 million at December 31, 2016, 2015 and 2014, respectively. As of December 31, 2016, the total unrecognized compensation expense for unvested restricted stock awards was $4.7 million, and for unexercisable stock options was $0.3 million. This expense is expected to be recorded over a weighted-average period of 1.2 years.
ESPP
We have an employee stock purchase plan, or ESPP, that is available to all of our U.S. employees and certain subsidiaries and is qualified under Section 423 of the Internal Revenue Code. At the end of each fiscal quarter, or Option Period, during the term of the ESPP, the employee contributions are used to acquire shares of our Class A common stock at 85% of the fair market value of the Class A common stock on the first or the last day of the Option Period, whichever is lower. We adopted FASB Accounting Standard Codification, or ASC 718, Stock Compensation, and expense these costs as compensation. Total compensation expense related to the ESPP was $0.2 million, $0.2 million and $0.2 million during the years ended December 31, 2016, 2015 and 2014, respectively. We have authorized the issuance of up to 761,513 shares of Class A common stock through this plan. At December 31, 2016, there were 449,268 shares remaining in reserve for future issuance. See Note 1 “Nature of Operations and Summary of Significant Accounting Policies – Stock-Based Compensation.”
U.K. ESPP
Certain employees of our U.K. subsidiaries participate in a share incentive plan, which is similar to our ESPP but contains certain provisions designed to meet the requirements of the U.K. tax authorities. The shares purchased by our U.K. employees through the share incentive plan are currently issued through our 2010 Omnibus Equity Incentive Plan, and were previously issued under our 1997 Incentive Equity Plan.
Deferred Compensation Plan
We maintain a deferred compensation plan, or DC Plan. Under the DC Plan, a portion of the compensation for certain of our key employees, including officers, and non-employee directors can be deferred for payment after retirement or termination of employment. Under the DC Plan, deferred compensation can be used to purchase our Class A common stock or may be retained by us and earn interest at prime plus 2%. The first 7.5% of compensation deferred must be used to purchase our Class A common stock and may be matched by us. At December 31, 2016, a total of $4.7 million had been deferred into the prime plus 2% portion of the plan, which is included in our consolidated balance sheet in other long-term liabilities.
We have established a “Rabbi” trust to hold the stock portion of benefits under the DC Plan. The funds provided to the trust are invested by a trustee independent of us in our Class A common stock, which is purchased by the trustee on the open market. The assets of the trust are available to satisfy the claims of all general creditors in the event of bankruptcy or insolvency. Accordingly, the common stock held by the trust and our liabilities under the DC Plan are included in the accompanying consolidated balance sheets as treasury stock and deferred compensation expense. Dividend equivalents are paid on the stock units at the same rate as dividends on our common stock and are re-invested as additional stock units based upon the fair market value of a share of our Class A common stock on the date of payment of the dividend.
(10) EMPLOYEE BENEFIT PLANS
401(k)
We offer a 401(k) plan to all of our U.S. employees and provide matching contribution to those employees that participate. The matching contributions paid by us totaled $1.0 million and $2.1 million for the years ended December 31, 2015 and 2014, respectively. In August 2015, we suspended the matching contribution.
Multi-employer Pension Obligation
Certain of our current and former U.K. subsidiaries are participating in a multi-employer retirement fund known as the Merchant Navy Officers Pension Fund, or MNOPF. At December 31, 2016, we had accrued $2.6 million related to this liability, which reflects all obligations assessed on us by the fund’s trustee as of such date. We continue to have employees who participate in the MNOPF and will as a result continue to make routine payments to the fund as those employees accrue additional benefits over time. The status of the fund is calculated by an actuarial firm every three years. The last assessment was completed in March 2015 and resulted in a significantly improved funding position, mainly due to hedging the interest rate and inflation risk, to between 65% and 80%. The reported net deficit of the fund at March 31, 2015 was $7.5 million and, as a result, the MNOPF trustee did not propose to collect any additional deficit contributions related to the new deficit. The amount and timing of additional potential future obligations relating to underfunding depend on a number of factors, but principally on future fund performance and the underlying actuarial assumptions. Our share of the fund’s deficit is dependent on a number of factors including future actuarial valuations, asset performance, the number of participating employers, and the final method used in allocating the required contribution among participating employers. In addition, our obligation could increase if other employers no longer participated in the plan. In the years ended December 31, 2016, 2015 and 2014 we made contributions to the plan of $0.4 million, $0.4 million and $0.7 million, respectively. Our contributions do not make up more than five percent of total contributions to the plan.
In addition, we participate in the Merchant Navy Ratings Pension Fund, or MNRPF, in a capacity similar to our participation in the MNOPF. Prior to 2013, we were not required to contribute to any deficit in the MNRPF. Due to a change in the plan rules, however, we were advised that we would be required to make contributions beginning in 2013. An actuarial valuation was completed as of March 31, 2014 and deficit notices were communicated in the third quarter of 2015. Our share of the deficit was calculated at $2.2 million, of which we paid $1.9 million in October 2015 and $0.3 million in October 2016. During 2016, we accrued amounts in respect of future deficit contributions. As of December 31, 2016, the amount of this accrual was $1.1 million.
Norwegian Pension Plans
The Norwegian benefit pension plans include approximately three of our office employees and 137 seamen and are defined benefit, multiple-employer plans, insured with Nordea Liv. We also instituted a defined contribution plan in 2008 for shore based personnel that existing personnel could elect to participate in while discontinuing any further obligations in the defined benefit plan. All newly hired shore based personnel are required to join the defined contribution plan. Benefits under the defined benefit plans are based primarily on participants’ years of credited service, wage level at age of retirement and the contribution from the Norwegian National Insurance. A December 31, 2016 measurement date is used for the actuarial computation of the defined benefit pension plans. The following tables provide information about changes in the benefit obligation and plan assets and the funded status of the Norwegian defined benefit pension plans (in thousands):
|
2016 |
2015 |
|||||||
|
Change in Benefit Obligation |
||||||||
|
Benefit obligation at beginning of the year |
$ | 6,394 | $ | 8,186 | ||||
|
Benefit periodic cost |
319 | 416 | ||||||
|
Interest cost |
144 | 169 | ||||||
|
Withdrawal |
(377 | ) | (256 | ) | ||||
|
Benefits paid |
(289 | ) | (379 | ) | ||||
|
Actuarial (gain) loss |
(1,117 | ) | (523 | ) | ||||
|
Translation adjustment |
128 | (1,219 | ) | |||||
|
Benefit obligation at year end |
$ | 5,202 | $ | 6,394 | ||||
|
2016 |
2015 |
|||||||
|
Change in Plan Assets |
||||||||
|
Fair value of plan assets at beginning of the year |
$ | 5,466 | $ | 6,159 | ||||
|
Actual return on plan assets |
182 | 185 | ||||||
|
Contributions |
303 | 541 | ||||||
|
Withdrawal |
(237 | ) | (196 | ) | ||||
|
Settlement/curtailment |
82 | - | ||||||
|
Benefits paid |
(297 | ) | (250 | ) | ||||
|
Administrative fee |
(56 | ) | (61 | ) | ||||
|
Actuarial loss |
(63 | ) | 55 | |||||
|
Translation adjustment |
106 | (967 | ) | |||||
|
Fair value of plan assets at end of year |
$ | 5,486 | $ | 5,466 | ||||
|
2016 |
2015 |
|||||||
|
Funded status |
$ | 284 | $ | (928 | ) | |||
Amounts recognized in the balance sheet consist of (in thousands):
| December 31, | ||||||||
|
2016 |
2015 |
|||||||
|
Other liabilities |
$ | 87 | $ | 1,104 | ||||
| Year Ended December 31, | ||||||||
|
2016 |
2015 |
|||||||
|
Components of Net Period Benefit Cost |
||||||||
|
Service cost |
$ | 329 | $ | 416 | ||||
|
Interest cost |
149 | 169 | ||||||
|
Return on plan assets |
(182 | ) | (185 | ) | ||||
|
Payroll tax |
52 | 65 | ||||||
|
Administrative fee |
56 | 61 | ||||||
|
Recognized net actuarial gain |
(381 | ) | (609 | ) | ||||
|
Net periodic benefit cost |
$ | 23 | $ | (83 | ) | |||
The vested benefit obligation is calculated as the actuarial present value of the vested benefits to which employees are currently entitled based on the employees’ expected date of separation or retirement.
|
Weighted-average assumptions |
2016 |
2015 |
||||||
|
Discount rate |
2.6 | % | 2.7 | % | ||||
|
Return on plan assets |
3.6 | % | 2.2 | % | ||||
|
Rate of compensation increase |
2.5 | % | 1.3 | % | ||||
The weighted average assumptions shown above were used for both the determination of net periodic benefit cost and the determination of benefit obligations as of the measurement date. In determining the weighted average assumptions, the overall market performance and specific historical performance of the investments of the Norwegian pension plan were reviewed. The asset allocations at the measurement date were as follows:
|
2016 |
2015 |
Level | |||||||
|
Equity securities |
5% | 7% | 1 | ||||||
|
Property |
10% | 14% | 3 | ||||||
|
Money market |
24% | 22% | 2 | ||||||
|
Held-to-Maturity bonds |
32% | 35% | 2 | ||||||
|
Bonds |
7% | 17% | 1 | ||||||
|
Other |
22% | 5% | 3 | ||||||
|
All asset categories |
100% | 100% | |||||||
The investment strategy focuses on providing a stable return on plan assets using a diversified portfolio of investments.
The projected benefit obligation and the fair value of plan assets for the Norwegian pension plan were approximately $5.6 million and $5.5 million, respectively as of December 31, 2016, $6.4 million and $5.5 million, respectively as of December 31, 2015, and $8.2 million and $6.1 million, respectively, as of December 31, 2014. We expect to contribute approximately $0.6 million to the Norwegian pension plan in 2016. No plan assets are expected to be returned to us in 2016.
The following benefit payments, which reflect expected future service, as appropriate, are expected to be paid (in thousands):
|
Year ended December 31, |
Benefit Payments |
|||
|
2017 |
332 | |||
|
2018 |
342 | |||
|
2019 |
352 | |||
|
2020 |
363 | |||
|
2021 |
374 | |||
|
Total |
$ | 1,763 | ||
(11) STOCKHOLDERS’ EQUITY
Common Stock
We are authorized by our Certificate of Incorporation, as amended, to issue two classes of common stock: Class A and Class B, and authorized 60 million of shares of each class of common stock. Class A shares contain restrictions that, among other things, limit the maximum permitted percentage of outstanding shares of Class A common stock that may be owned or controlled in the aggregate by non-U.S. citizens to a maximum of 22 percent, collectively, or the Maritime Restrictions. Any purported transfer that would result in more than 22 percent of the outstanding shares of Class A common stock being owned (of record or beneficially) or controlled by non-U.S. citizens will be void and ineffective. In the event such transfers are unable to be voided, shares in excess of the maximum permitted percentage are subject to automatic sale by a trustee appointed by us or, if such sale is ineffective, redemption by us. In any event such non-U.S. citizen will not be entitled to any voting, dividend or distribution rights with respect to the excess shares and may be required to disgorge any profits, dividends or distributions received with respect to the excess shares. The Class B shares do not have the Maritime Restrictions noted above. Initially, the shares of Class B common stock may only be issued upon conversion of all of the outstanding and treasury shares of our Class A common stock into shares of Class B common stock automatically following a determination by our Board of Directors that either the U.S. ownership requirements of the applicable U.S. maritime and vessel documentation laws are no longer applicable to us (or have been amended so that the Maritime Restrictions are no longer necessary) or that the elimination of such restrictions is in the best interests of our stockholders. Upon conversion of the outstanding and treasury shares of Class A common stock into outstanding or treasury shares of Class B common stock, as the case may be, such shares of Class A common stock will be canceled, will no longer be outstanding and will not be reissued. There are currently no shares of Class B common stock outstanding.
Common Stock Issuances
During 2016, 165,849 shares were issued, generating approximately $0.4 million in proceeds. The provisions of the ESPP are described above in Note 9 in more detail. During 2015, 101,179 shares were issued through the ESPP, generating approximately $0.7 million in proceeds.
A total of 1,000,485 and 564,205 restricted shares of our Class A common stock were granted to certain officers and key employees in 2016 and 2015, respectively, pursuant to our 2014 plan described above in Note 9, with an aggregate market value of $3.5 million and $7.4 million, respectively, on the grant dates.
Preferred Stock
We are authorized by our Certificate of Incorporation, as amended, to issue up to 2,000,000 shares of preferred stock, $.01 par value per share. No such shares have been issued.
Stock Repurchases
In December 2012, our Board of Directors (or Board) approved a stock repurchase program for up to a total of $100.0 million of our issued and outstanding Class A common stock. Under the program, repurchases can be made from time to time using a variety of methods, which may include open market purchases or purchases through a Rule 10b5-1 trading plan, or in privately negotiated transactions, all in accordance with SEC and other applicable legal requirements. In late 2012 and early 2013, we repurchased 373,619 shares of our Class A common stock for $13.3 million. In 2014, we repurchased 1,883,648 shares of our Class A common stock for $57.7 million. We did not repurchase any of our Class A common stock in 2015 or 2016. Although we did not repurchase any of our Class A common stock pursuant to the stock repurchase program in 2016, we acquired some shares of our Class A common stock in satisfaction of tax withholding obligations in connection with certain payouts under our Deferred Compensation Plan. See “Market for Registrant’s Common Equity, Related Stockholder Matters and Issuer Purchases of Equity Securities – Issuer Repurchases of Equity Securities” included in Part II, Item 5. We were limited under the terms of our Multicurrency Facility Agreement and are limited under our Norwegian Facility Agreement in our ability to make certain payments beyond permitted amounts for share repurchases.
Dividends
Our dividend policy is reviewed by the Board at such times as it deems appropriate in light of operating conditions, dividend restrictions of subsidiaries and investors or lenders, financial requirements, general business conditions and other factors it considers relevant. In each quarter of 2014, we paid a quarterly cash dividend of $0.25 per share of our Class A common stock. In February 2015, the Board suspended dividend payments indefinitely. The Board declared no dividends for the years ended December 31, 2016 or 2015.
Pursuant to the terms of the indenture governing our Senior Notes, as further described in Note 6, we may be restricted from declaring or paying any future dividends. In addition, we were limited under the terms of our Multicurrency Facility Agreement and are limited under our Norwegian Facility Agreement in our ability to make certain payments beyond permitted amounts for dividends, acquisitions or share repurchases.
(12) OPERATING SEGMENT INFORMATION
Business Segments
We operate our business based on geographic locations and maintain three operating segments: the North Sea, Southeast Asia and the Americas. Our chief operating decision-maker regularly reviews financial information about each of these operating segments in deciding how to allocate resources and evaluate performance. The business within each of these geographic regions has similar economic characteristics, services, distribution methods and regulatory concerns. All of the operating segments are considered reportable segments under FASB ASC No. 280, “Segment Reporting.”
Management evaluates segment performance primarily based on operating income. Cash and debt are managed centrally. Because the regions do not manage those items, the gains and losses on foreign currency remeasurements associated with these items are excluded from operating income. Management considers segment operating income to be a good indicator of each segment’s operating performance from its continuing operations, as it represents the results of the ownership interest in operations without regard to financing methods or capital structures. All significant transactions between segments are conducted on an arms-length basis based on prevailing market prices and are accounted for as such.
Operating income and other information regularly provided to our chief operating decision-maker is summarized in the following table (all amounts in thousands):
|
North |
Southeast |
|
||||||||||||||||||
|
Sea |
Asia |
Americas | Other | Total | ||||||||||||||||
|
Year Ended December 31, 2016 |
||||||||||||||||||||
|
Revenue |
$ | 76,759 | $ | 14,069 | $ | 32,891 | $ | - | $ | 123,719 | ||||||||||
|
Direct operating expenses |
45,872 | 11,308 | 25,985 | - | 83,165 | |||||||||||||||
|
Drydock expense |
2,549 | 588 | 1,525 | - | 4,662 | |||||||||||||||
|
General and administrative expense |
6,961 | 5,218 | 6,876 | 18,608 | 37,663 | |||||||||||||||
|
Depreciation and amortization |
24,157 | 8,654 | 22,008 | 3,363 | 58,182 | |||||||||||||||
|
Impairment charge |
1,986 | 50,437 | 110,385 | - | 162,808 | |||||||||||||||
|
Gain on sale of assets and other |
5,920 | 2,648 | (4 | ) | - | 8,564 | ||||||||||||||
|
Operating income (loss) |
$ | (10,686 | ) | $ | (64,784 | ) | $ | (133,884 | ) | $ | (21,971 | ) | $ | (231,325 | ) | |||||
|
Cash and cash equivalents |
$ | 5,436 | $ | 3,008 | $ | 364 | $ | 14 | $ | 8,822 | ||||||||||
|
Long-lived assets(a) |
440,670 | 149,668 | 401,425 | 3,457 | 995,220 | |||||||||||||||
|
Total assets |
465,908 | 158,671 | 424,398 | 4,926 | 1,053,903 | |||||||||||||||
|
Capital expenditures |
12,550 | 90 | 2,751 | 797 | 16,188 | |||||||||||||||
|
Year Ended December 31, 2015 |
||||||||||||||||||||
|
Revenue |
$ | 142,168 | $ | 35,524 | $ | 97,114 | $ | - | $ | 274,806 | ||||||||||
|
Direct operating expenses |
84,474 | 16,483 | 68,880 | - | 169,837 | |||||||||||||||
|
Drydock expense |
4,112 | 4,356 | 6,919 | - | 15,387 | |||||||||||||||
|
General and administrative expense |
9,469 | 4,296 | 9,906 | 23,609 | 47,280 | |||||||||||||||
|
Depreciation and amortization |
28,724 | 10,419 | 29,827 | 3,621 | 72,591 | |||||||||||||||
|
Impairment charge |
22,919 | - | 129,184 | - | 152,103 | |||||||||||||||
|
Gain on sale of assets and other |
1,244 | (59 | ) | (25 | ) | - | 1,160 | |||||||||||||
|
Operating income (loss) |
$ | (8,774 | ) | $ | 29 | $ | (147,577 | ) | $ | (27,230 | ) | $ | (183,552 | ) | ||||||
|
Cash and cash equivalents |
$ | 12,930 | $ | 4,911 | $ | 1,221 | $ | 2,877 | $ | 21,939 | ||||||||||
|
Long-lived assets(a) |
544,904 | 216,477 | 499,083 | 6,022 | 1,266,486 | |||||||||||||||
|
Total assets |
589,934 | 232,356 | 529,654 | 9,308 | 1,361,252 | |||||||||||||||
|
Capital expenditures |
5,992 | 253 | 26,602 | 2,581 | 35,428 | |||||||||||||||
|
Year Ended December 31, 2014 |
||||||||||||||||||||
|
Revenue |
$ | 225,253 | $ | 64,753 | $ | 205,763 | $ | - | $ | 495,769 | ||||||||||
|
Direct operating expenses |
113,140 | 22,831 | 100,273 | - | 236,244 | |||||||||||||||
|
Drydock expense |
9,094 | 4,400 | 11,346 | - | 24,840 | |||||||||||||||
|
General and administrative expense |
17,226 | 5,387 | 12,837 | 27,278 | 62,728 | |||||||||||||||
|
Depreciation and amortization |
32,440 | 11,168 | 28,789 | 2,939 | 75,336 | |||||||||||||||
|
Impairment charge |
8,551 | 444 | - | - | 8,995 | |||||||||||||||
|
Gain on sale of assets and other |
(3,260 | ) | (9,200 | ) | (1,579 | ) | - | (14,039 | ) | |||||||||||
|
Operating income (loss) |
$ | 48,062 | $ | 29,723 | $ | 54,097 | $ | (30,217 | ) | $ | 101,665 | |||||||||
|
Cash and cash equivalents |
$ | 19,345 | $ | 15,126 | $ | 7,959 | $ | 8,355 | $ | 50,785 | ||||||||||
|
Long-lived assets(a)(b) |
627,728 | 226,920 | 638,706 | 7,064 | 1,500,418 | |||||||||||||||
|
Total assets |
725,078 | 263,487 | 700,558 | 27,232 | 1,716,355 | |||||||||||||||
|
Capital expenditures |
109,152 | 459 | 45,403 | 3,412 | 158,426 | |||||||||||||||
(a) Vessels under construction are included in other assets until delivered. Revenue, long-lived assets and capital expenditures presented in the table above are allocated to segments based on the location where the vessel is employed, which in some instances differs from the segment where the vessel is legally owned. In 2016, we had $28.5 million in revenue and $371.6 million in long-lived assets attributed to the United States, our country of domicile. In 2015, we had $73.4 million in revenue and $431.7 million in long-lived assets attributed to the United States. In 2014, we had $152.0 million in revenue and $519.8 million in long-lived assets attributed to the United States.
(b) Goodwill is included in the North Sea segment.
(13) UNAUDITED QUARTERLY FINANCIAL DATA
Summarized quarterly financial data for the two years ended December 31, 2016 and 2015 are as follows:
|
Quarter |
||||||||||||||||
|
First |
Second |
Third |
Fourth |
|||||||||||||
|
(In thousands, except per share amounts) |
||||||||||||||||
|
2016 |
||||||||||||||||
|
Revenues |
$ | 38,794 | $ | 30,487 | $ | 27,821 | $ | 26,617 | ||||||||
|
Operating loss |
(128,256 | ) | (66,338 | ) | (19,766 | ) | (16,965 | ) | ||||||||
|
Net loss |
(91,182 | ) | (47,580 | ) | (24,729 | ) | (39,488 | ) | ||||||||
|
Per share (basic) |
$ | (3.66 | ) | $ | (1.90 | ) | $ | (0.98 | ) | $ | (1.57 | ) | ||||
|
Per share (diluted) |
$ | (3.66 | ) | $ | (1.90 | ) | $ | (0.98 | ) | $ | (1.57 | ) | ||||
|
2015 |
||||||||||||||||
|
Revenues |
$ | 89,092 | $ | 74,461 | $ | 60,668 | $ | 50,585 | ||||||||
|
Operating loss |
(558 | ) | (4,207 | ) | (167,081 | ) | (11,706 | ) | ||||||||
|
Net loss |
(5,126 | ) | (8,245 | ) | (185,226 | ) | (16,638 | ) | ||||||||
|
Per share (basic) |
$ | (0.21 | ) | $ | (0.33 | ) | $ | (7.48 | ) | $ | (0.67 | ) | ||||
|
Per share (diluted) |
$ | (0.21 | ) | $ | (0.33 | ) | $ | (7.48 | ) | $ | (0.67 | ) | ||||
ITEM 9. Changes in and Disagreements with Accountants on Accounting and Financial Disclosure
NONE
ITEM 9A. Controls and Procedures
Disclosure Controls and Procedures
We maintain disclosure controls and procedures that are designed to provide reasonable assurance that information required to be disclosed in our reports under the Exchange Act is recorded, processed, summarized and reported within the time periods specified in the SEC’s rules and forms, and that such information is accumulated and communicated to management, including our Principal Executive Officer and Principal Financial Officer, as appropriate, to allow timely decisions regarding required disclosure. Our management, with the participation of our Principal Executive Officer and Principal Financial Officer, has evaluated the effectiveness of our disclosure controls and procedures as of the end of the fiscal year covered by this Annual Report on Form 10-K. Our Principal Executive Officer and Principal Financial Officer have concluded that, as of the end of the period covered by this Annual Report on Form 10-K, our disclosure controls and procedures were effective at the reasonable assurance level.
Management’s Annual Report on Internal Control over Financial Reporting
Our management is responsible for establishing and maintaining adequate internal control over financial reporting, as defined in Exchange Act Rule 13a-15(f). Our internal control over financial reporting is a process designed under the supervision of our Principal Executive Officer and Principal Financial Officer to provide reasonable assurance regarding the reliability of financial reporting and the preparation of our financial statements for external purposes in accordance with generally accepted accounting principles.
Our management assessed the effectiveness of our internal control over financial reporting at December 31, 2016, and in making this assessment, used the criteria set forth by the Committee of Sponsoring Organizations of the Treadway Commission (COSO) in Internal Control-Integrated Framework (2013). Based on this assessment, management determined that our internal control over financial reporting was effective as of December 31, 2016.
KPMG LLP, our independent registered public accounting firm that audited the consolidated financial statements included in this Annual Report on Form 10-K, has issued a report with respect to our internal control over financial reporting as of December 31, 2016.
Because of its inherent limitations, internal control over financial reporting may not prevent or detect misstatements. Also, projections of any evaluation of effectiveness to future periods are subject to the risk that controls may become inadequate because of changes in conditions, or that the degree of compliance with the policies or procedures may deteriorate.
Changes in Internal Control Over Financial Reporting
There were no changes in our internal control over financial reporting during the quarter ended December 31, 2016 that materially affected, or are reasonably likely to materially affect, our internal control over financial reporting.
ITEM 9B. Other Information
On March 14, 2017, we entered into a support agreement, or the Support Agreement, relating to the Multicurrency Facility Agreement with The Royal Bank of Scotland plc, the agent under the Multicurrency Facility Agreement. Pursuant to the Support Agreement, the agent thereunder agreed to waive the defaults and events of default specified in the Support Agreement and to forbear from exercising any rights or remedies under the Multicurrency Facility Agreement as a result of any such defaults and events of default specified in the Support Agreement until the earlier of April 14, 2017 and the occurrence of any of the early termination events specified in the Support Agreement. The defaults or events of default specified in the Support Agreement include, without limitation:
|
● |
our failure to deliver certain financial information, documentation or notices required under the Multicurrency Facility Agreement; |
|
● |
a breach of certain financial covenants set forth in the Multicurrency Facility Agreement; |
|
● |
failure to file our Form 10-K or any other required SEC filing within the prescribed time frame; |
|
● |
delivery of an audit opinion from our auditors that contains a “going concern” or like qualification or exception; |
|
● |
certain cross-defaults arising as a result of our failure to pay scheduled interest or coupon amounts (which we refer to as a Notes Non-Payment) as required by the indenture governing our Senior Notes or as a result of a default or event of default under the Norwegian Facility Agreement arising as a result of a Notes Non-Payment or the defaults or events of default specified in the Support Agreement; |
|
● |
our entry into negotiations with creditors with a view to rescheduling any indebtedness; and |
|
● |
the occurrence of a material adverse effect. |
The early termination events specified in the Support Agreement include, without limitation:
|
● |
any cash payment by us or our affiliates (including any interest payment) with respect to the Senior Notes other than certain payments to the trustee for the Senior Notes and certain legal and other fees; |
|
● |
a cash payment by us or our affiliates on account of the Norwegian Facility Agreement, subject to certain exceptions including certain scheduled interest payments; |
|
● |
the acceleration or taking of enforcement steps by the requisite lenders under the Norwegian Facility Agreement; |
|
● |
a material breach by us of the Support Agreement or the agreement we entered into with the agent under the Multicurrency Facility Agreement dated March 8, 2017; |
|
● |
any of certain corporate or other actions taken by us or certain of our material subsidiaries to commence a voluntary case under the U.S. Bankruptcy Code, dissolve or appoint a receiver, among other things; |
|
● |
the commencement of an involuntary case against us or certain of our material subsidiaries under the U.S. Bankruptcy Code or similar laws; or |
|
● |
enforcement of any security securing indebtedness for borrowed money over any of our assets or assets of certain of our material subsidiaries. |
PART III
ITEM 10. Directors, Executive Officers and Corporate Governance(1)
ITEM 11. Executive Compensation(1)
ITEM 12. Security Ownership of Certain Beneficial Owners and Management and Related Stockholder Matters(1)
ITEM 13. Certain Relationships and Related Transactions, and Director Independence(1)
ITEM 14. Principal Accounting Fees and Services(1)
(1) The information required by ITEMS 10, 11, 12, 13 and 14 will be included in a definitive proxy statement or an amendment to this Form 10-K to be filed within 120 days of the close of our fiscal year and is hereby incorporated by reference herein.
PART IV
ITEM 15. Exhibits, Financial Statement Schedules
|
(a) |
Exhibits, Financial Statements and Financial Statement Schedules. |
|
(1) |
and (2) Financial Statements and Financial Statement Schedules. |
Consolidated Financial Statements of the Company are included in Part II, Item 8 “Financial Statements and Supplementary Data.” All schedules have been omitted because the required information is not present or not present in an amount sufficient to require submission of the schedule, or because the information required is included in the Consolidated Financial Statements or the notes thereto.
(3) Exhibits
See “Exhibit Index” below which is filed as part of this Annual Report on Form 10-K.
ITEM 16. Form 10-K Summary
NONE
SIGNATURES
Pursuant to the requirements of Section 13 or 15(d) of the Securities Exchange Act of 1934, the Registrant has duly caused this report to be signed on its behalf by the undersigned, hereunto duly authorized.
|
|
|
GulfMark Offshore, Inc. |
| |
|
|
|
|
| |
|
|
By: |
/s/ Quintin V. Kneen |
| |
|
|
|
Quintin V. Kneen |
| |
| Chief Executive Officer, President and Director | ||||
|
|
|
(Principal Executive Officer) |
| |
Date: March 16, 2017
Pursuant to the requirements of the Securities Exchange Act of 1934, this report had been signed below by the following persons on behalf of the Registrant and in the capacities and on the dates indicated:
|
/s/ Quintin V. Kneen |
Chief Executive Officer, President and Director |
March 16, 2017 |
|
Quintin V. Kneen |
(Principal Executive Officer) |
|
|
/s/ James. M. Mitchell |
Executive Vice President and Chief Financial Officer |
March 16, 2017 |
|
James M. Mitchell |
(Principal Financial Officer) |
|
|
/s/ Samuel R. Rubio |
Senior Vice President, Controller and Chief Accounting Officer |
March 16, 2017 |
|
Samuel R. Rubio |
(Principal Accounting Officer) |
|
|
/s/ David J. Butters |
Director |
March 16, 2017 |
|
David J. Butters |
||
|
/s/ Peter I. Bijur |
Director |
March 16, 2017 |
|
Peter I. Bijur |
||
|
/s/ Brian R. Ford |
Director |
March 16, 2017 |
|
Brian R. Ford |
||
|
/s/ Sheldon S. Gordon |
Director |
March 16, 2017 |
|
Sheldon S. Gordon |
||
|
/s/ Steven W. Kohlhagen |
Director |
March 16, 2017 |
|
Steven W. Kohlhagen |
||
| /s/ Rex C. Ross | Director | March 16, 2017 |
|
Rex C. Ross |
||
|
/s/ Charles K. Valutas |
Director |
March 16, 2017 |
| Charles K. Valutas |
EXHIBIT INDEX
|
Exhibit |
Description |
Filed Herewith or Incorporated by Reference from the Following Documents | ||
|
3.1 |
Certificate of Incorporation, as amended |
Exhibit 3.1 to our current report on Form 8-K filed on February 24, 2010 (SEC File No. 001-33607) | ||
|
|
||||
|
3.2 |
Bylaws, as amended |
Exhibit 3.2 to our current report on 8-K filed on February 24, 2010 (SEC File No. 001-33607) | ||
|
|
|
|||
|
4.1 |
Description of GulfMark Offshore, Inc. Common Stock |
Exhibit 4.1 to our current report on Form 8-K filed on February 24, 2010 (SEC File No. 001-33607) | ||
|
|
| |||
|
4.2 |
Form of U.S. Citizen Stock Certificate |
Exhibit 4.2 to our current report on Form 8-K filed on February 24, 2010 (SEC File No. 001-33607) | ||
|
| ||||
|
4.3 |
Form of Non-U.S. Citizen Stock Certificate |
Exhibit 4.3 to our current report on Form 8-K filed on February 24, 2010 (SEC File No. 001-33607) | ||
|
|
| |||
|
4.4 |
Indenture, dated as of March 12, 2012, between GulfMark Offshore, Inc., as issuer, and U.S. Bank National Association, as trustee, including a form of the Company’s 6.375% Senior Notes due 2022 |
Exhibit 4.1 to our current report on Form 8-K filed on March 12, 2012 (SEC File No. 001-33607)
| ||
|
|
||||
|
4.5 |
See Exhibit No. 3.1 for provisions of the Certificate of Incorporation and Exhibit 3.2 for provisions of the Bylaws defining the rights of the holders of Common Stock |
Exhibits 3.1 and 3.2 to our current report on Form 8-K filed on February 24, 2010 (SEC File No. 001-33607) | ||
|
10.1 |
GulfMark Offshore, Inc. 2010 Omnibus Equity Incentive Plan* |
Exhibit A to our Proxy Statement on Form DEF 14A filed on April 30, 2010 (SEC File No. 001-33607) | ||
|
10.2 |
Amendment No. 1 to the GulfMark Offshore, Inc. 2010 Omnibus Equity Incentive Plan* |
Exhibit 10.2 to our current report on Form 8-K filed on June 11, 2010 (SEC File No. 001-33607) | ||
|
10.3 |
Form of Notice of Stock Option Award and Form of Stock Option Agreement (2010 Omnibus Equity Incentive Plan)* |
Exhibit 10.3 to our current report on Form 8-K filed on June 11, 2010 (SEC File No. 001-33607) | ||
|
10.4 |
Form of Notice of Restricted Stock Award and Form of Restricted Stock Agreement (2010 Omnibus Equity Incentive Plan)* |
Exhibit 10.4 to our current report on Form 8-K filed on June 11, 2010 (SEC File No. 001-33607) | ||
|
10.5 |
GulfMark Offshore, Inc. Amended and Restated 2014 Omnibus Equity Incentive Plan* |
Exhibit A attached to our definitive proxy statement on Schedule 14A filed on April 27, 2016 | ||
|
10.6 |
Form of Notice of Stock Option Award and Form of Stock Option Agreement (2014 Omnibus Equity Incentive Plan).* |
Exhibit 10.2 to our current report on Form 8-K filed on June 5, 2014 | ||
|
10.7 |
Form of Notice of Restricted Stock Option Award and Form of Restricted Stock Option Agreement (2014 Omnibus Equity Incentive Plan).* |
Exhibit 10.3 to our current report on Form 8-K filed on June 5, 2014
| ||
|
10.8 |
GulfMark Offshore, Inc. Deferred Compensation Plan * |
Appendix C to our definitive proxy statement filed on April 29, 2011 (SEC File No. 001-33607) | ||
|
10.9 |
GulfMark Offshore, Inc. Amended and Restated 2011 Non-Employee Director Share Incentive Plan * |
Exhibit B attached to our definitive proxy statement on Schedule 14A filed on April 27, 2016 | ||
|
10.10 |
GulfMark Offshore, Inc. Amended and Restated 2011 Employee Stock Purchase Plan* |
Exhibit C attached to our definitive proxy statement on Schedule 14A filed on April 27, 2016 | ||
|
10.11 |
Employment Agreement, dated October 14, 2009, between GulfMark Americas, Inc. and Quintin V. Kneen* |
Exhibit 10.3 to our current report on Form 8-K filed on October 19, 2009 (SEC File No. 001-33607) | ||
|
10.12 |
Employment Agreement, dated May 30, 2013, between James M. Mitchell and GulfMark Offshore, Inc. * |
Exhibit 10.1 to our current report on Form 8-K filed on June 4, 2013 |
|
10.13 |
Change of Control Agreement, dated May 30, 2013, between James M. Mitchell and GulfMark Offshore, Inc. * |
Exhibit 10.2 to our current report on Form 8-K filed on June 4, 2013 | ||
|
10.14 |
GulfMark Offshore, Inc. Severance Benefits Policy, effective as of August 1, 2001* |
Exhibit 10.6 to our current report on Form 8-K filed on October 19, 2009 (SEC File No. 001-33607) | ||
|
10.15 |
Amendment to GulfMark Offshore, Inc. Severance Benefits Policy, effective as of October 13, 2009* |
Exhibit 10.7 to our current report on Form 8-K filed on October 19, 2009 (SEC File No. 001-33607) | ||
|
10.16 |
Form of Indemnification Agreement* |
Exhibit 10.2 to our current report on Form 8-K filed on February 24, 2010 (SEC File No. 001-33607) | ||
|
10.17 |
Letter agreement between Quintin V. Kneen and GulfMark Offshore, Inc. dated March 23, 2015* |
Exhibit 10.1 to our current report on Form 8-K filed on March 26, 2015 | ||
|
10.18 |
Letter agreement between James M. Mitchell and GulfMark Offshore, Inc. dated March 23, 2015* |
Exhibit 10.2 to our current report on Form 8-K filed on March 26, 2015 | ||
|
10.19 |
Letter Agreement, dated October 23, 2015, between David B. Rosenwasser and GulfMark Offshore, Inc.*
|
Exhibit 10.19 to Annual Report on Form 10-K filed on February 29, 2016 | ||
|
10.20 |
$300 Million Multicurrency Facility Agreement, dated September 26, 2014, between GulfMark Americas, Inc., as original borrower, GulfMark Offshore, Inc., as parent and original guarantor, the Royal Bank of Scotland PLC, Wells Fargo Bank, N.A., JPMorgan Chase Bank, N.A., Bank of America, N.A., Suntrust Robinson Humphrey, Inc. and DBS Bank Ltd. as arrangers, and the Royal Bank of Scotland PLC as agent. |
Exhibit 10.1 to our current report on Form 8-K filed on October 2, 2014 | ||
|
10.21 |
Amendment and Restatement Agreement, dated October 23, 2014, between GulfMark Rederi AS, as borrower, the financial institutions listed on Schedule 1 thereto, as lenders, with DNB Bank ASA, as arranger, and DNB Bank ASA, as agent. |
Exhibit 10.1 to our current report on Form 8-K filed on October 29, 2014 | ||
|
10.22 |
NOK 600,000,000 Amended and Restated Multi-Currency Revolving Credit Facility Agreement between GulfMark Rederi AS, DNB Bank ASA and others dated October 23, 2014. |
Exhibit 10.2 to our current report on Form 8-K filed on October 29, 2014 | ||
|
10.23 |
Amendment Agreement, dated February 13, 2015, relating to $300,000,000 Multicurrency Facility Agreement originally dated September 26, 2014 between GulfMark Americas, Inc., as borrower, GulfMark Offshore, Inc., as guarantor, the financial institutions listed in Part 2 of Schedule 1 thereto, as lenders, the arrangers party thereto, and The Royal Bank of Scotland plc, as agent of the finance parties thereto, and as security trustee for the secured parties thereunder. |
Exhibit 10.1 to our current report on Form 8-K filed on February 17, 2015
| ||
|
10.24 |
Second Amendment Agreement, dated July 2, 2015, relating to $300,000,000 Multicurrency Facility Agreement originally dated September 26, 2014 between GulfMark Americas, Inc., as borrower, GulfMark Offshore, Inc., as guarantor, the financial institutions listed in Part 2 of Schedule 1 thereto, as lenders, the arrangers party thereto, and The Royal Bank of Scotland plc, as agent of the finance parties thereto, and as security trustee for the secured parties thereunder. |
Exhibit 10.1 to our current report on Form 8-K filed on July 8, 2015
| ||
|
10.25 |
Third Amendment Agreement, dated December 22, 2015, relating to $300,000,000 Multicurrency Facility Agreement originally dated September 26, 2014 between GulfMark Americas, Inc., as borrower, GulfMark Offshore, Inc., as guarantor, the financial institutions listed in Part 2 of Schedule 1 thereto, as lenders, the arrangers party thereto, and The Royal Bank of Scotland plc, as agent of the finance parties thereto, and as security trustee for the secured parties thereunder. |
Exhibit 10.1 to our current report on Form 8-K filed on December 23, 2015
|
|
10.26 |
Addendum, dated February 13, 2015, to NOK 600,000,000 Multi-Currency Credit Facility Agreement originally dated December 27, 2012, and as amended by an Amendment and Restatement Agreement, dated October 23, 2014, between GulfMark Rederi AS and DNB Bank ASA. |
Exhibit 10.2 to our current report on Form 8-K filed on February 17, 2015 | ||
|
10.27 |
Addendum No. 2, dated July 7, 2015, to NOK 600,000,000 Multi-Currency Credit Facility Agreement, originally dated December 27, 2012, and as amended by an Amendment and Restatement Agreement, dated October 23, 2014, between GulfMark Rederi AS and DNB Bank ASA. |
Exhibit 10.2 to our current report on Form 8-K filed on July 8, 2015 | ||
|
10.28 |
Addendum No. 3, dated January 29, 2016, to NOK 600,000,000 Multi-Currency Revolving Credit Facility Agreement, originally dated December 27, 2012 and amended and restated on October 23, 2014, as amended, between GulfMark Rederi AS and DNB Bank ASA. |
Exhibit 10.1 to our current report on Form 8-K filed on February 4, 2016 | ||
|
10.29 |
Addendum No. 4, dated March 10, 2016, to NOK 600,000,000 Multi-Currency Revolving Credit Facility Agreement, originally dated December 27, 2012 and amended and restated on October 23, 2014, as amended, between GulfMark Rederi AS and DNB Bank ASA. |
Exhibit 10.2 to our quarterly report on Form 10-Q filed on April 26, 2016 | ||
|
10.30 |
Fourth Amendment Agreement, dated March 31, 2016, relating to $100,000,000 Multicurrency Facility Agreement originally dated September 26, 2014, as amended, between GulfMark Americas, Inc., as borrower, GulfMark Offshore, Inc., as guarantor, the financial institutions party thereto as lenders, the arrangers party thereto, and The Royal Bank of Scotland plc, as agent of the finance parties thereto, and as security trustee for the secured parties thereunder. |
Exhibit 10.3 to our quarterly report on Form 10-Q filed on April 26, 2016 | ||
|
10.31 |
Severance Protection Agreement, dated April 6, 2016, by and between GulfMark Offshore, Inc. and Samuel R. Rubio* |
Exhibit 10.1 to our current report on Form 8-K filed on April 11, 2016 | ||
|
10.32 |
Severance Protection Agreement, dated April 6, 2016, by and between GulfMark Offshore, Inc. and David E. Darling* |
Exhibit 10.2 to our quarterly report on Form 10-Q filed on July 27, 2016 | ||
|
10.33 |
Addendum No. 5, dated June 13, 2016, to NOK 600,000,000 Multi-Currency Revolving Credit Facility Agreement, originally dated December 27, 2012 and amended and restated on October 23, 2014, as amended, between GulfMark Rederi AS and DNB Bank ASA. |
Exhibit 10.3 to our quarterly report on Form 10-Q filed on July 27, 2016 | ||
|
10.34 |
Securities Purchase Agreement dated November 23, 2016 by and among GulfMark Offshore, Inc., MFP Partners, L.P. and Franklin Mutual Advisers, LLC. |
Exhibit 10.1 to our current report on Form 8-K filed on November 23, 2016 | ||
|
10.35 |
Voting Agreement dated November 23, 2016 by and among GulfMark Offshore, Inc., Raging Capital Management, LLC and the other parties signatory thereto. |
Exhibit 10.2 to our current report on Form 8-K filed on November 23, 2016 | ||
|
10.36 |
Tender Support Agreement dated November 23, 2016 by and between GulfMark Offshore, Inc. and Raging Capital Management, LLC. |
Exhibit 10.3 to our current report on Form 8-K filed on November 23, 2016 | ||
|
10.37 |
Amendment No. 1 to Securities Purchase Agreement, dated December 15, 2016, by and among GulfMark Offshore, Inc., MFP Partners, L.P. and Franklin Mutual Advisers, LLC. |
Exhibit 10.1 to our current report on Form 8-K filed on December 16, 2016 | ||
|
10.38 |
Agreement dated March 8, 2017 among GulfMark Offshore, Inc., GulfMark Americas, Inc. and The Royal Bank of Scotland plc, as agent for the Lenders |
Exhibit 10.1 to our current report on Form 8-K filed on March 14, 2017 |
|
10.39 |
Support Agreement dated March 14, 2017 among GulfMark Offshore, Inc., GulfMark Americas, Inc. and The Royal Bank of Scotland plc, as agent for the Lenders |
Filed herewith | ||
|
12.1 |
Computation of Ratio of Earnings to Fixed Charges |
Filed herewith | ||
|
21.1 |
Subsidiaries of GulfMark Offshore, Inc. |
Filed herewith | ||
|
23.1 |
Consent of KPMG LLP |
Filed herewith | ||
|
31.1 |
Section 302 Certification for Q.V. Kneen |
Filed herewith | ||
|
31.2 |
Section 302 Certification for J.M. Mitchell |
Filed herewith | ||
|
32.1 |
Section 906 Certification furnished for Q.V. Kneen |
Filed herewith | ||
|
32.2 |
Section 906 Certification furnished for J.M. Mitchell |
Filed herewith | ||
|
101 |
The following materials from GulfMark Offshore, Inc.’s Annual Report on Form 10-K for the year ended December 31, 2016, formatted in XBRL (Extensible Business Reporting Language): (i) Consolidated Balance Sheets, (ii) Consolidated Statements of Operations, (iii) Consolidated Statements of Comprehensive Income, (iv) Consolidated Statements of Stockholders’ Equity, (v) Consolidated Statements of Cash Flows and (vi) Notes to Consolidated Financial Statements, tagged as blocks of text. |
Filed herewith | ||
|
* Management contracts or compensatory plans or arrangements. |
96