Attached files
| file | filename |
|---|---|
| 8-K - FORM 8-K - APARTMENT INVESTMENT & MANAGEMENT CO | d320521d8k.htm |
 1
Analyst Meeting Discussion Materials
March 22, 2012
Exhibit 99.1 |
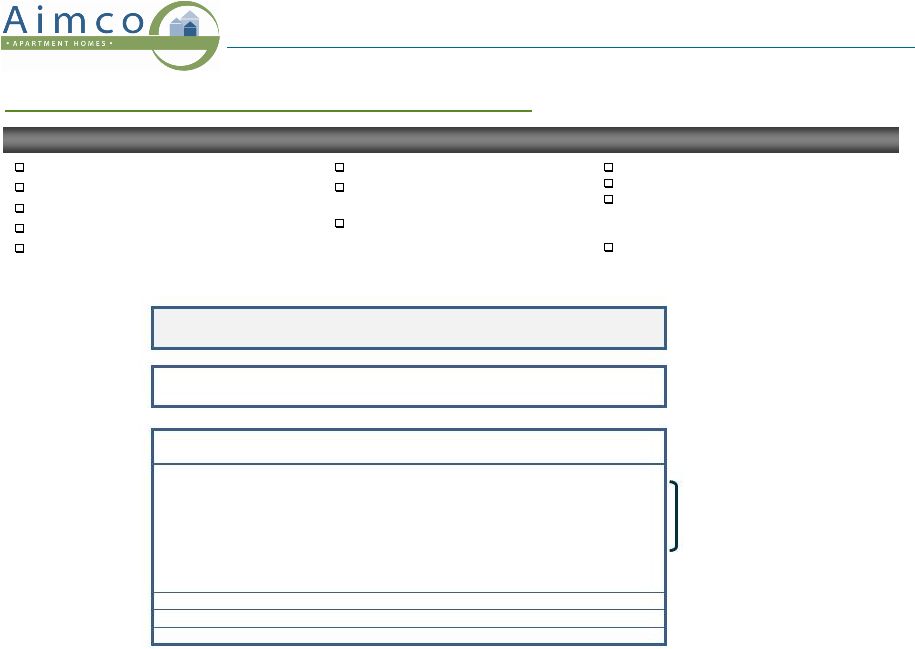
 2
What We Expect
How We Plan to Get There
Operations
A Solid Year Ahead
Conventional
Same-Store
NOI
5.25%
-
7.25%
Affordable
Same-Store
NOI
0.0%
-
1.0%
Total
Same-Store
NOI
4.5%
-
6.25%
Revenue
4.5% -
5.5%: 2.1% “in the bank”
from 2011 and
5.0%+ increase in 2012 lease
rates
Expenses
2.5% -
3.0% due to increases in real estate
taxes & insurance; operating expenses flat
Portfolio
Better Than Ever
Conventional rents
~10% to $1,260 from $1,143 today
Affordable portfolio < 10% of NAV
Conventional
NOI
margin
~1.5%
to
~64%
Conventional
Free
Cash
Flow
margin
(1)
~3%
to
~58%
Dispositions $550 -
$650M
Sell 25+ Conventional properties with average rents
< $700
Sell 60+ Affordable properties with average ownership
of 41%
Acquisitions $220M+ with $160M in partnerships
Redevelopment
Full Speed Ahead
Conventional
redevelopment
$125
-
$150M
Robust
pipeline;
5%
-
6%
of
NAV
under
redevelopment
at
one
time
Eight projects underway in 2012; four in coastal California
and four others in Seattle, Chicago and Philadelphia;
~$400M multi-year investment
Three vacant properties; ~1,220 units returned to service
over next two years; target rents > $2,400
Current returns on un-trended rents > 7%, Free Cash Flow
IRRs > 10%
Balance Sheet
Lower Leverage
(2)
EBITDA:Interest 2.5:1
EBITDA:Interest & Preferred Dividends 2.0:1
Debt:EBITDA 7.5x
Debt & Preferreds:EBITDA 8.7x
Continue to be non-recourse, long-term, fixed rate borrower
Increasing property income
Property debt amortization $83M or ~2% of debt
Refinance maturing debt of $118M or ~2.5% of debt
Opportunistic redemption of high cost preferreds
Business
Simpler
Average
ownership
in
Conventional
properties
to
96%
Sale of third-party asset management business; ~$0.01 per share
of 2011 and 2012 FFO
Average
ownership
in
Affordable
properties
to
74%
Tender or merge 11 partnerships with 19 properties; 7 public
partnerships with average annual administration costs of
~$1M
Earn-in of technology initiatives, scale reductions and
efficiency gains
Earnings & Dividend
Moving Up
FFO of $1.72 -
$1.82 per share
8%
AFFO of $1.17 -
$1.29 per share
21%
Dividend
50%
to
$0.72
per
share
per
year;
~60%
AFFO
payout
Stick to the plan
Aimco 2012 Plan
(1)
Free Cash Flow is defined as property NOI less assumed capital replacement expenditures of $850 per
unit. (2)
Leverage metrics based on annualized projected 4Q 2012 EBITDA. |
 3
Property Operations Strategy
Low turnover strategy contributes to NOI performance
Low turnover strategy:
Customer retention is key to greater
NOI contribution and more predictable
operating results
Aimco’s annual turnover of 48% is
significantly lower than an
apartment industry average of 55%
-
60%
(1)
By maintaining lower than industry
average turnover, Aimco avoids
expensed and capitalized turn
costs, vacancy loss and marketing
expense of $10 -
$12M annually
Renewal lease rates are generally
less volatile and are, on average,
higher than new lease rates
On average, customers choose to rent
an Aimco apartment for 22 months, up
22% from 2007
(2)
Conventional Same-Store Revenue & NOI Growth
2006 -
2012E
100
105
110
115
120
125
130
(2)
2005
2006
2007
2008
2009
2010
2011
2012E
(2)
AIV Revenue
Peer Avg Revenue
AIV NOI
Peer Avg NOI
AIV Revenue
AIV NOI
(1)
Based on information collected by YieldStar.
(2)
Peer group consists of AvalonBay, Camden, Equity Residential, Essex, Home Properties and UDR.
2006 - 2011 averages computed based on individual company results as reported by SNL Financial. 2012E
represents midpoint of company guidance. |
 4
2012 Plan: Property Operations
Property operations are on track for a solid year
What We Expect
How We Plan to Get There
Year-to-Date Progress
Conventional Same-Store NOI
5.25% -
7.25%
Affordable Same-Store NOI
0.0% -
1.0%
Total Same-Store NOI
4.5% -
6.25%
Revenue
4.5% -
5.5%:
2.1% “in the bank”
from 2011
5.0%+ increase in 2012 lease
rates
Expenses
2.5% -
3.0%:
real estate taxes & insurance
operating expenses flat
Lease rates on track
High occupancy
Expenses tracking better than
expected due to mild winter
Jan
Feb
Year-to-Date
New leases
0.3%
1.4%
0.8%
Renewal leases
4.6%
5.5%
5.1%
Blended
2.4%
3.4%
2.9%
Seasonal Acceleration in Lease Rates
90.0%
91.0%
92.0%
93.0%
94.0%
95.0%
96.0%
97.0%
-8.0%
-6.0%
-4.0%
-2.0%
0.0%
2.0%
4.0%
6.0%
8.0%
1Q 2010
2Q 2010
3Q 2010
4Q 2010
1Q 2011
2Q 2011
3Q 2011
4Q 2011
Jan-12
Feb-12
Average Daily Occupancy
New Lease
Renewal
Blended
Conventional Same-Store Rate & Occupancy |
 5
Our target customers are:
Aged 24 -
40
high propensity to rent
College-educated
strongest job and earnings
growth, lowest unemployment
Single
homeownership is a lifestyle choice; not
yet motivated by marriage, children
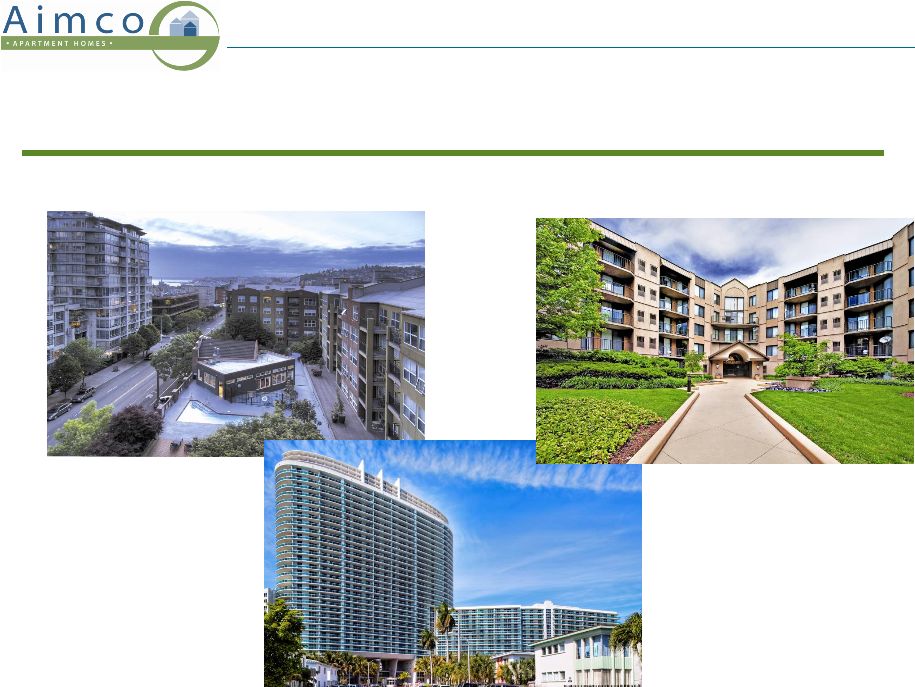
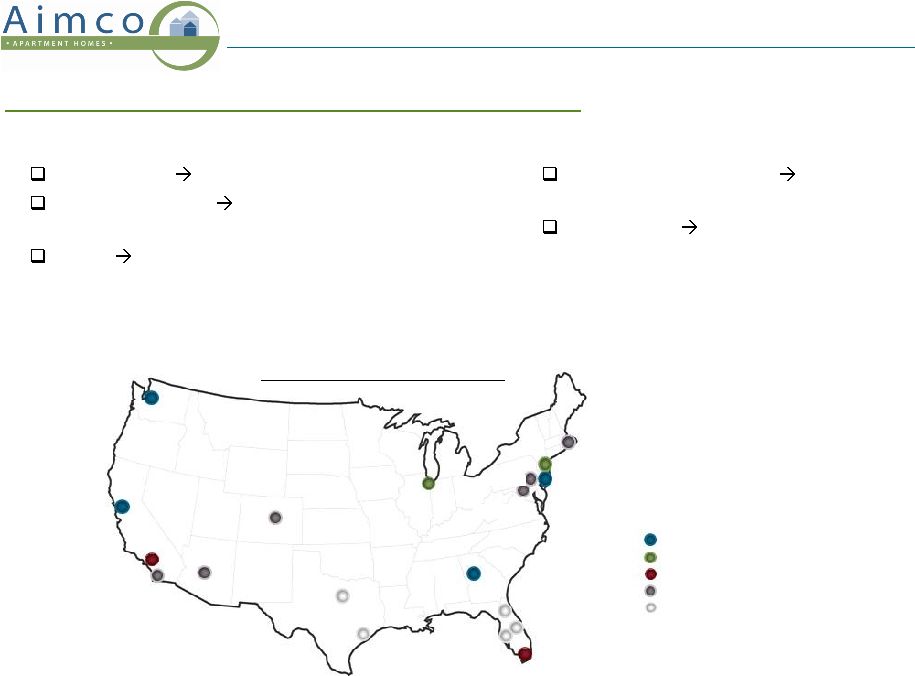
Portfolio Strategy
And they want to live in:
Hub and gateway cities
lifestyle, job
opportunities
Urban areas
proximity to jobs
Portfolio designed around our target customers
Manhattan
Boston
Philadelphia
Suburban NY / NJ
Washington
Greater Los Angeles
Denver
Phoenix
Chicago
Houston
South Florida
Atlanta
Seattle
Bay Area
San Diego
Jacksonville
Orlando
Tampa
Dallas / Ft Worth
Increase capital (redevelopment, acquisitions)
Maintain capital
Decrease capital
Upgrade locations within market
Recycle out
Long-Term Capital Allocation Objectives:
Portfolio increasingly concentrated in the locations where our target customers
want to live Portfolio as of 12/31/2011 |
 6
2012 Plan: Portfolio
What We Expect
How We Plan to Get There
Year-to-Date Progress
Conventional rents
~10% to $1,260 from $1,143
at the end of 2011
Affordable portfolio < 10% of NAV
Conventional
NOI
margin
~1.5%
to
~
64%
Conventional
Free
Cash
Flow
margin
*
~3%
to
~58%
Dispositions $550 -
$650M
Acquisitions $220M+ with $160M in
partnerships
Opportunistic acceleration of 2013 -
2014 planned dispositions of ~$1B
with average rents ~$800 would
increase average rents at year-end
2012 to ~$1,400
Sold four properties with 725 units,
Aimco share of gross proceeds ~$45M
Completed seven public partnership
mergers, acquiring $130M of real estate
Portfolio plan is on track, may accelerate asset sales
AIV Share: $550 -
$650M
Conventional Properties
Portfolio average rents
increase ~5% through sales
of 25+ properties with
average rents
< $700
AIV share of gross
dispositions $500 -
$600M
FCF margin increases at rate
twice that of NOI margin due
to levering effect of capital
replacement spending
Affordable Properties
Sell 60+ properties in which Aimco's average ownership
is ~41%
AIV share of gross dispositions ~$50M
In connection with sale of asset managed portfolio, sell
20+ consolidated NAPICO properties in which Aimco’s
average ownership is ~14%
YE 2012 affordable portfolio:
•
~25 properties to be sold by the end of 2013
•
~65 tax credit redevelopment properties, most to be
liquidated over the next five years as credits are
delivered
Eliminate compliance activities, lower offsite costs
INVESTMENTS
Real Estate: $220M
$130M in seven public
partnerships
$90M in other
partnership tenders and
mergers, and property
purchases
DISPOSITIONS
Total: $345 -
$370M
Redevelopment: $125 -
$150M
Eight projects underway in 2012; four
in coastal California and four others in
Seattle, Chicago and Philadelphia;
~$400M multi-year investment
Three vacant properties; ~1,220 units
returned to service over next two
years; target rents > $2,400
Current returns on un-trended rents
> 7%, Free Cash Flow IRRs > 10%
* Free Cash Flow is defined as property NOI less assumed capital replacement expenditures of $850 per
unit |
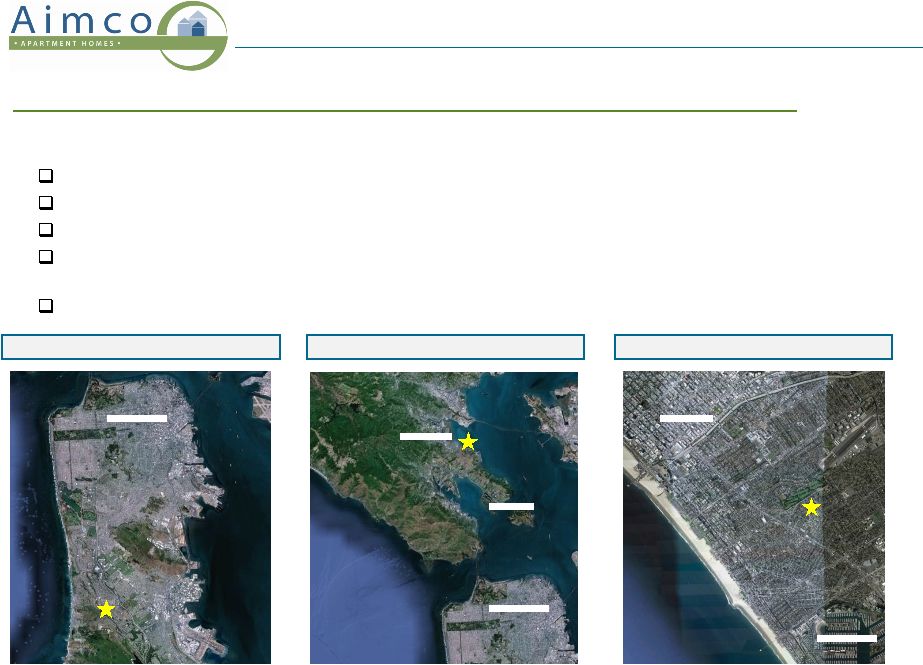 7
Redevelopment Strategy
Pipeline of opportunities to generate higher risk-adjusted returns
Redevelopment philosophy:
Land in quality locations appreciates over time
Older assets in quality locations provide opportunity for redevelopment
Redevelopment is a short-cycle business making it a lower-risk activity
than ground-up development Currently, redevelopment provides higher
risk-adjusted returns than acquisitions, with 2012 projects generating
current returns > 7% with un-trended rents in markets where cap rates average ~4.5%
Aimco’s
portfolio
composition
and
expertise
in
redevelopment
provide
a
pipeline
of
opportunities
Pacific Bay Vistas, San Bruno CA
Madera Vista, Corte Madera CA
Lincoln Place Apartments, Venice CA
San Francisco
Tiburon
Corte Madera
San Francisco
Santa Monica
Marina Del Rey |
 8
2012 Plan: Redevelopment
What We Expect
How We Plan to Get There
Year-to-Date Progress
Conventional
redevelopment
$125
-
$150M
Robust pipeline; up to 5% -
6% of NAV under
redevelopment at one time and future annual
spend of $150 -
$250M
Eight projects underway in 2012 with
~$400M multi-year investment
Three vacant properties; ~1,220 units
returned to service over next two years
Current returns on un-trended rents > 7%,
Free Cash Flow IRRs > 10%
Lincoln Place and Pacific Bay Vistas
are under construction
Palazzo West will start construction
by the end of March
Madera Vista, 2900 on First and
Elm Creek will start construction
during 2Q
The Sterling and Park Towne will
start construction during 4Q
Redevelopment plan is on track
Palazzo West
$17M ($140K/unit)
Lincoln Place
$150M ($185K/unit)
Pacific Bay Vistas
$52M ($170K/unit)
2900 on First
$13M ($95K/unit)
Elm Creek
$10M (~$345K/unit -
new construction)
The Sterling
Final costs TBD
Park Towne
Final costs TBD
Madera Vista
$30M ($240K/unit) |
 9
2012 Redevelopment Disclosure
Example of expanded quarterly disclosure to begin with 1Q 2012 report
Summary of Redevelopment Activity
As of December 31, 2011
(dollars in millions)
(unaudited)
Project
Number of
Units
Total Project
Cost
(1)
Inception-to-
Date
Investment
Construction
Start
Initial
Occupancy
Construction
Complete
Stabilized/
Restabilized
Operations
Pre-
Redevelopment
(2)
Stabilized
(3)
Quarter-End
Physical
Occupancy
Pacific Bay Vistas, San Bruno, CA
308
93.0
$
40.1
$
4Q 2011
3Q 2012
3Q 2013
4Q 2013
n/a
2,200
$
Vacant
(2) Average rents for the quarter preceding redevelopment start.
(3) Rents based on market rents for comparable product for the quarter preceding redevelopment
start. Does not include future market rent growth. Schedule
Average Rents
(1) Total cost of redevelopment project including pre-construction costs, hard construction costs
and capitalized operating costs, property taxes, overhead and interest. Pre-redevelopment basis is net of 4Q 2008 impairment loss of
$5.7 million. Aimco anticipates project to provide ~7% current return on un-trended
rents. |
 10
Balance Sheet Strategy
Balance
sheet
designed
for
safety
Leverage strategy:
Limit entity risk by avoiding recourse debt, of which Aimco has virtually
none Reduce repricing risk by using fixed rate loans and refinancing
nearer-term maturities to lock in current interest rates
Reduce refunding risk by laddering maturities of long-term, non-recourse,
amortizing property loans with little or no near-term maturities and
perpetual preferred stock Hedge against inflation and cap rate expansion by
using long-dated, fixed rate leverage Non
-Recourse Property Debt Maturities
Weighted Average Term to Maturity: 8.2 Years*
2012*
2013
2014
2015
2016
2017
2018
2019
2020
2021
Thereafter
$0
$100
$200
$300
$400
$500
$600
$700
$800
Avg cost: 5.50%
Avg cost: 7.55%
Aimco Leverage
as of 12/31/2011
* As of 12/31/2011 with the exception that 2012 maturities exclude $56M of committed financings and
$69M of refinancing activity occurring during the first quarter 2012. |
 11
2012 Plan: Balance Sheet
What We Expect
*
How We Plan to Get There
Year-to-Date Progress
EBITDA:Interest 2.5:1
EBITDA:Interest & Preferred Dividends 2.0:1
Debt:EBITDA 7.5x
Debt & Preferreds:EBITDA 8.7x
Continue to be non-recourse, long-term, fixed
rate borrower
Increasing property income
Property debt amortization $83M or
~2% of debt
Opportunistic redemption of high cost
preferreds
Property operations plan is on track
Loans are self-amortizing, on track
Refinanced $69M of maturing property debt
year-to-date, leaving $49M to refinance
during 2012
High cost of preferred stock makes
redemption a compelling use of property
sales proceeds
De-levering plan is on track, may accelerate
* 2012 leverage metrics are based on annualized projected 4Q 2012 EBITDA.
Preferred stock available for redemption
600,938
$
7.86%
47,217
$
Amount
($000s)
Coupon
Cost
($000s)
Perpetual Preferred Stock:
Class T
150,000
$
8.00%
12,000
$
Class U
300,000
7.75%
23,250
Class V
64,688
8.00%
5,175
Class Y
86,250
7.88%
6,792
Class Z
21,729
7.00%
1,521
37,000
1.62%
599
Subtotal/weighted avg
659,667
$
7.48%
49,338
$
Preferred Partnership Units
82,515
8.10%
6,680
Total preferred securities
742,182
$
7.55%
56,018
$
Preferred Securities Outstanding
Series A Community Reinvestment Act
Currently
available for
redemption |
  12
Balance Sheet Targets
Targeting lower leverage
Clear path to achieve targets by year-end 2015
(1)
Aimco’s leverage will continue to be comprised of long-term, fixed rate,
amortizing property debt and perpetual preferred securities; however, the amount of property debt and the amount of perpetual preferred
securities may or may not vary from today's proportions, dependent upon future
factors such as the availability and pricing of capital. (2)
Based
on
midpoint
of
Aimco
2012
NOI
growth
guidance
and
Green
Street
Advisors’
2013
-
2015
NOI
growth
estimates
published
in
its
March
6,
2012
“Residential
Sector
Update”.
Redemption of high-cost preferred securities could improve Debt + Preferred /
EBITDA by ~1.0x
Y2011
Y2012
Annualized
4Q EBITDA
Long-Term
Targets
EBITDA/Interest
2.18:1
2.50:1
2.75:1
EBITDA/Interest + Preferred
1.78:1
2.00:1
2.50:1
Debt/EBITDA
8.7x
7.5x
See Note (1)
Debt + Preferred/EBITDA
10.0x
8.7x
< 7.0x
Balance Sheet Metrics
2012 Guidance
8.7x
2012 - 2015 Amortization of property debt
< 0.4 >
2012 - 2015 Property NOI growth
(2)
< 0.9 >
2012 - 2015 Redevelopment earn-in
< 0.3 >
Potential annualized 4Q 2015 result
7.1x
Debt + Preferred / EBITDA
Target: < 7.0x |
 13
Business Strategy
Simple business: own and operate apartments, redevelop some
Business strategy:
Own and operate B+ apartments in desirable markets serving customers with high
and rising incomes
Redevelop properties where returns are > 150 basis points higher
than acquisitions
Eliminate non-core activities, simplify structure and reduce costs:
IN PROCESS
COMPLETED
Reduce number of partnerships
Reduce investment in Affordable
properties
Exit third-party property management
Exit third-party asset management
Exit tax credit redevelopment |
 14
2012 Plan: Business
What We Expect
How We Plan to Get There
Year-to-Date Progress
Reduce number of partnerships
Sale of third-party asset management business;
~$0.01 per share of 2011 and 2012 FFO
Eliminate 7 public partnerships that own
13 properties, saving annual
administration costs of ~$1M
Eliminate 4 private partnerships that own
6 properties
Earn-in of technology initiatives, scale
reductions and efficiency gains
Public partnership mergers complete
Private partnership tenders and
mergers progressing as expected
Earn-in of prior year initiatives is as
expected
Entered into agreement to sell asset
managed portfolio (NAPICO) consisting
of ~12,500 units; closing expected later
this year
Simplification plans are on-track
Amount
%
$
Asset Management and Tax Credit Activities
Non-Recurring Revenues
$6M
-30%
-
$ 2.6M
Non-Recurring Expenses
$3M
Flat
Flat
Offsite Costs
Property Management Expenses
$35M
-15%
-
$ 6.5M
General and Administrative Expenses
$47M
-6%
-
$ 2.9M
$8M
-23%
-
$ 2.5M
$90M
-12%
-
$11.8M
2012 Guidance
Investment Management Expenses,
including non-recurring expenses
Total Offsite Costs
Change vs 2011 |
 15
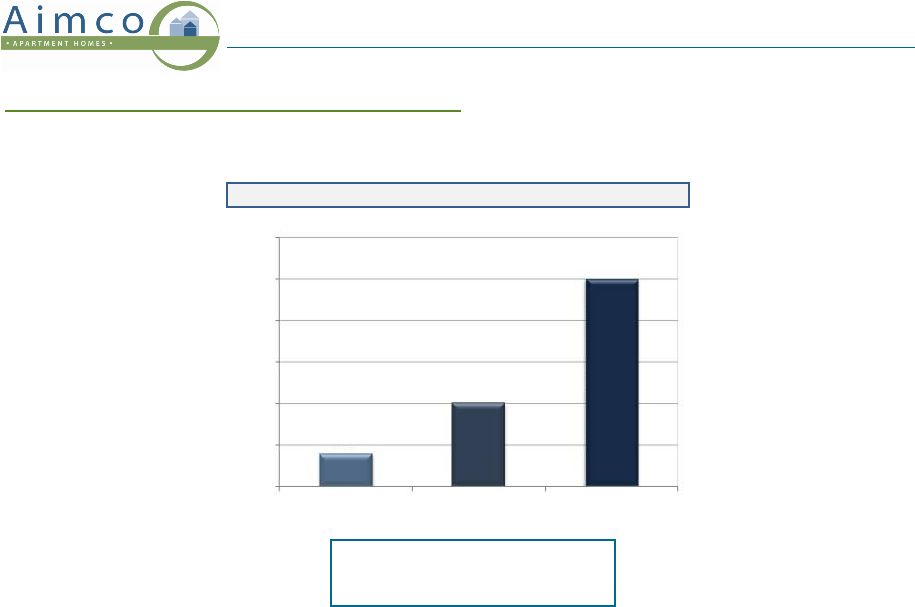
2012 Plan: Earnings & Dividend
Increasing earnings,
higher dividends
FFO
$1.72 -
$1.82
AFFO
$1.17 -
$1.29
Dividend
$0.72, ~ 60% AFFO payout
2012 Guidance
8%
20%
50%
0%
10%
20%
30%
40%
50%
60%
FFO
AFFO
Dividend |
 16
Forward-Looking Statements and Other Information
This presentation contains forward-looking statements within the meaning of the
federal securities laws, including statements regarding projected results
and specifically: projected 2012 operating results, asset sales and
redevelopment investment; projected returns on redevelopment projects
started during 2012; the impact of acquisition, disposition and other
investment activities on portfolio metrics; and projected 2012 leverage ratios.
These forward- looking statements reflect management’s judgment as
of this date, and Aimco assumes no obligation to revise or update them to
reflect future events or circumstances. These forward- looking statements
include certain risks and uncertainties. Readers should carefully review
Aimco’s financial statements and notes thereto, as well as the risk factors
described in Aimco’s Annual Report on Form 10-K for the year ended
December 31, 2011, and the other documents Aimco files from time to time
with the Securities and Exchange Commission. This presentation
does not constitute an offer of securities for sale. |