Attached files
| file | filename |
|---|---|
| 8-K - CURRENT REPORT OF MATERIAL EVENTS OR CORPORATE CHANGES - TIER REIT INC | a12-7569_18k.htm |
Exhibit 99.1
|
|
Behringer Harvard REIT I, Inc. Quarterly Update – Fourth Quarter 2011 1325 G Street, Washington D.C. |
|
|
Forward-Looking Statements This presentation contains forward-looking statements, including discussion and analysis of the financial condition of us and our subsidiaries and other matters. These forward-looking statements are not historical facts but are the intent, belief or current expectations of our management based on their knowledge and understanding of our business and industry. Words such as “may,” “anticipates,” “expects,” “intends,” “plans,” “believes,” “seeks,” “estimates,” “would,” “could,” “should” and variations of these words and similar expressions are intended to identify forward-looking statements. We intend that such forward-looking statements be subject to the safe harbor provisions created by Section 27A of the Securities Act of 1933 and Section 21E of the Securities Exchange Act of 1934. These statements are not guarantees of future performance and are subject to risks, uncertainties and other factors, some of which are beyond our control, are difficult to predict and could cause actual results to differ materially from those expressed or forecasted in the forward-looking statements. Forward-looking statements that were true at the time made may ultimately prove to be incorrect or false. We caution you not to place undue reliance on forward-looking statements, which reflect our management's view only as of the date of this presentation. We undertake no obligation to update or revise forward-looking statements to reflect changed assumptions the occurrence of unanticipated events or changes to future operating results. 2 |
|
|
Forward-Looking Statements Forward-looking statements that were true at the time made may ultimately prove to be incorrect or false. We caution you not to place undue reliance on forward-looking statements, which reflect our management’s view only as of the date of this presentation. We undertake no obligation to update or revise forward-looking statements to reflect changed assumptions, the occurrence of unanticipated events or changes to future operating results. Factors that could cause actual results to differ materially from any forward-looking statements made in the presentation include but are not limited to: market and economic challenges experienced by the U.S. economy or real estate industry as a whole and the local economic conditions in the markets in which our properties are located; our ability to renew expiring leases and lease vacant spaces at favorable rates or at all; the inability of tenants to continue paying their rent obligations due to bankruptcy, insolvency or a general downturn in their business; the availability of cash flow from operating activities to fund distributions and capital expenditures; our ability to raise capital in the future by issuing additional equity or debt securities, selling our assets or otherwise to fund our future capital needs; our level of debt and the terms and limitations imposed on us by our debt agreements; future increases in interest rates; our ability to retain our executive officers and other key personnel of our advisor, our property manager and their affiliates; conflicts of interest arising out of our relationships with our advisor and its affiliates; changes in the level of financial assistance or support provided by our sponsor or its affiliates; unfavorable changes in laws or regulations impacting our business or our assets; and, factors that could affect our ability to qualify as a real estate investment trust. The forward-looking statements should be read in light of these and other risk factors identified in the “Risk Factors” section of our Annual Report on Form 10-K for the year ended December 31, 2011, as filed with the Securities and Exchange Commission. 3 |
|
|
Questions? During the call, please e-mail questions to: bhreit@behringerharvard.com 4 |
|
|
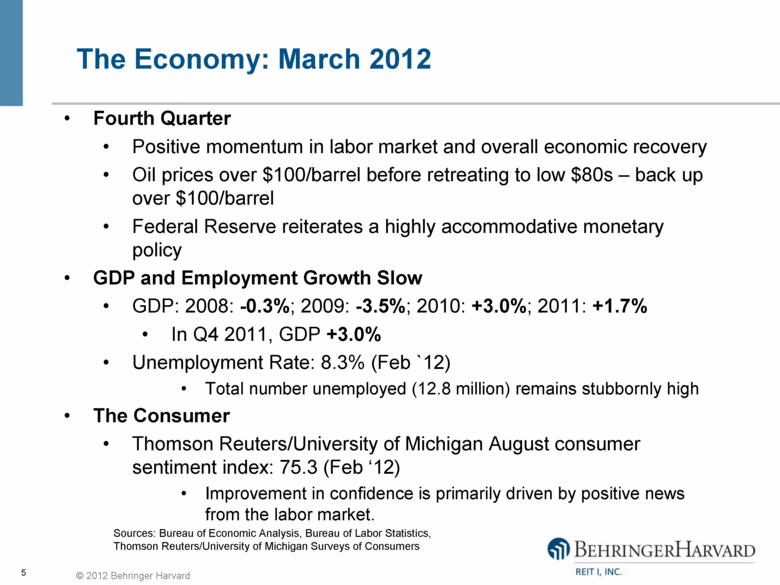
The Economy: March 2012 Fourth Quarter Positive momentum in labor market and overall economic recovery Oil prices over $100/barrel before retreating to low $80s – back up over $100/barrel Federal Reserve reiterates a highly accommodative monetary policy GDP and Employment Growth Slow GDP: 2008: -0.3%; 2009: -3.5%; 2010: +3.0%; 2011: +1.7% In Q4 2011, GDP +3.0% Unemployment Rate: 8.3% (Feb `12) Total number unemployed (12.8 million) remains stubbornly high The Consumer Thomson Reuters/University of Michigan August consumer sentiment index: 75.3 (Feb ‘12) Improvement in confidence is primarily driven by positive news from the labor market. Sources: Bureau of Economic Analysis, Bureau of Labor Statistics, Thomson Reuters/University of Michigan Surveys of Consumers 5 |
|
|
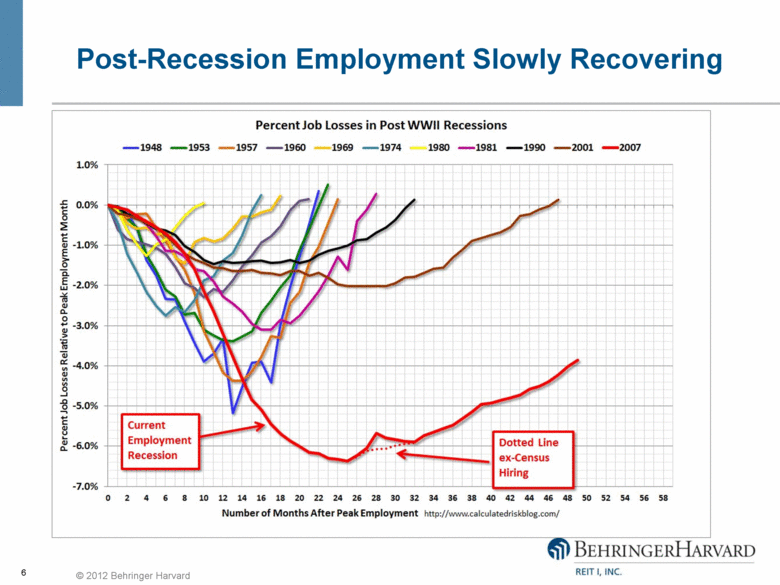
Post-Recession Employment Slowly Recovering 6 |
|
|
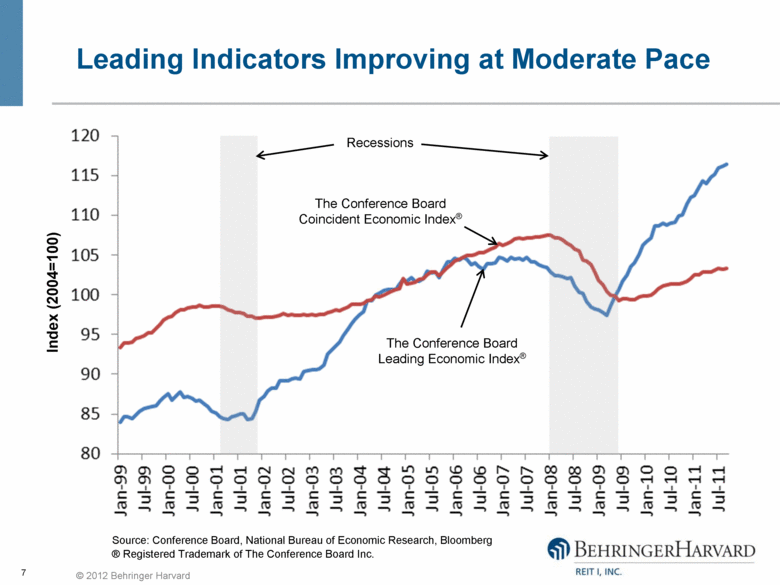
Leading Indicators Improving at Moderate Pace 7 Source: Conference Board, National Bureau of Economic Research, Bloomberg Index (2004=100) Recessions The Conference Board Leading Economic Index® The Conference Board Coincident Economic Index® ® Registered Trademark of The Conference Board Inc. |
|
|
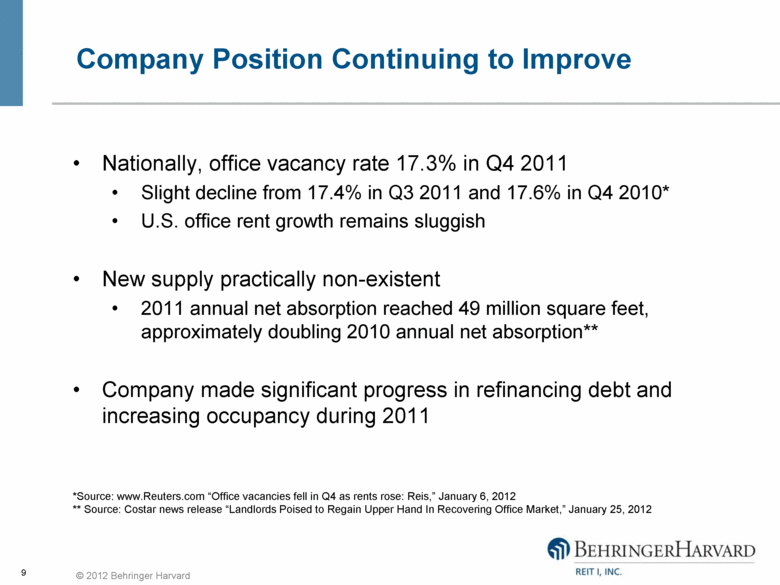
Company Position Continuing to Improve Nationally, office vacancy rate 17.3% in Q4 2011 Slight decline from 17.4% in Q3 2011 and 17.6% in Q4 2010* U.S. office rent growth remains sluggish New supply practically non-existent 2011 annual net absorption reached 49 million square feet, approximately doubling 2010 annual net absorption** Company made significant progress in refinancing debt and increasing occupancy during 2011 9 *Source: www.Reuters.com “Office vacancies fell in Q4 as rents rose: Reis,” January 6, 2012 ** Source: Costar news release “Landlords Poised to Regain Upper Hand In Recovering Office Market,” January 25, 2012 |
|
|
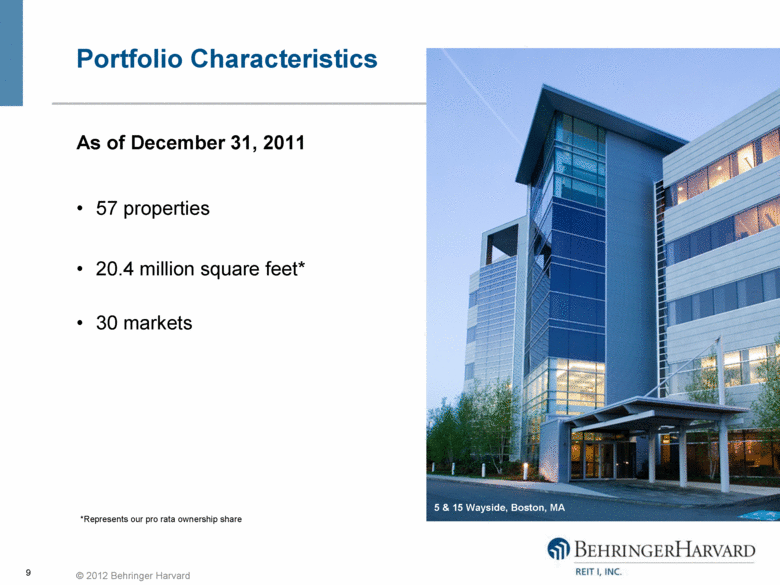
Portfolio Characteristics As of December 31, 2011 57 properties 20.4 million square feet* 30 markets 9 *Represents our pro rata ownership share 5 & 15 Wayside, Boston, MA |
|
|
10 Largest Markets – by Percent of Net Operating Income Properties owned as of December 31, 2011 10 |

|
|
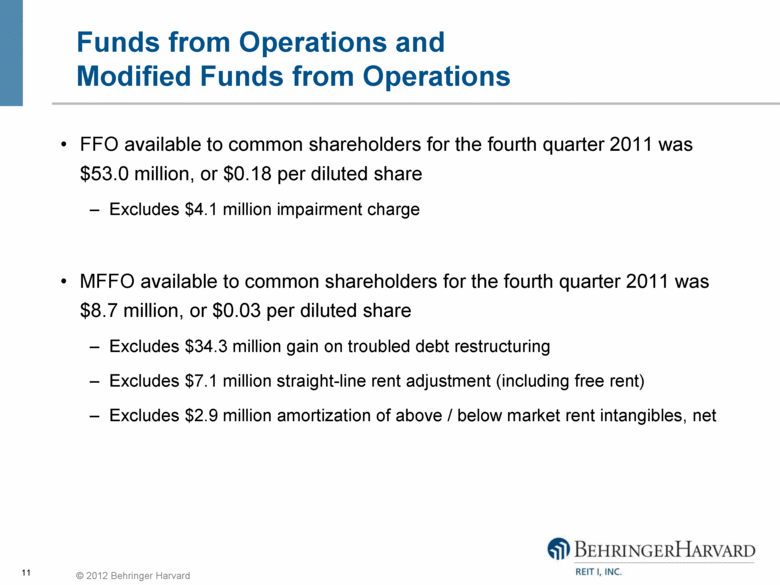
Funds from Operations and Modified Funds from Operations FFO available to common shareholders for the fourth quarter 2011 was $53.0 million, or $0.18 per diluted share Excludes $4.1 million impairment charge MFFO available to common shareholders for the fourth quarter 2011 was $8.7 million, or $0.03 per diluted share Excludes $34.3 million gain on troubled debt restructuring Excludes $7.1 million straight-line rent adjustment (including free rent) Excludes $2.9 million amortization of above / below market rent intangibles, net 11 |
|
|
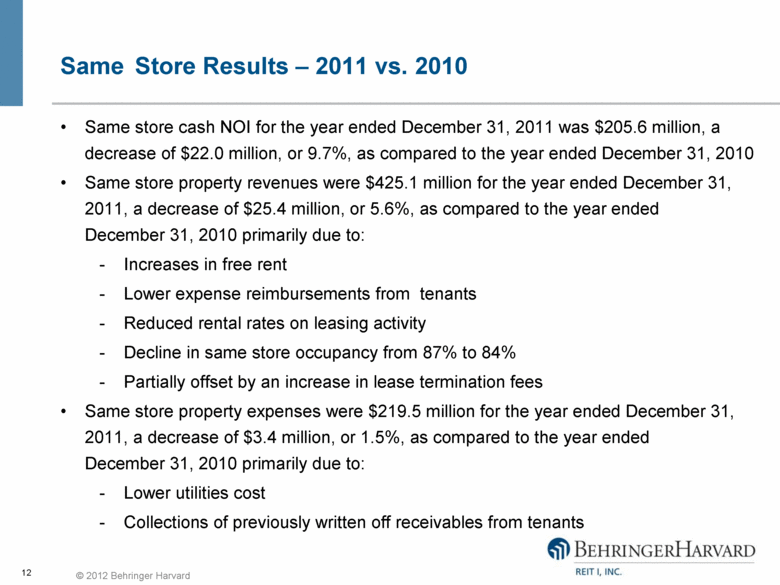
Same Store Results – 2011 vs. 2010 Same store cash NOI for the year ended December 31, 2011 was $205.6 million, a decrease of $22.0 million, or 9.7%, as compared to the year ended December 31, 2010 Same store property revenues were $425.1 million for the year ended December 31, 2011, a decrease of $25.4 million, or 5.6%, as compared to the year ended December 31, 2010 primarily due to: Increases in free rent Lower expense reimbursements from tenants Reduced rental rates on leasing activity Decline in same store occupancy from 87% to 84% Partially offset by an increase in lease termination fees Same store property expenses were $219.5 million for the year ended December 31, 2011, a decrease of $3.4 million, or 1.5%, as compared to the year ended December 31, 2010 primarily due to: Lower utilities cost Collections of previously written off receivables from tenants 12 |
|
|
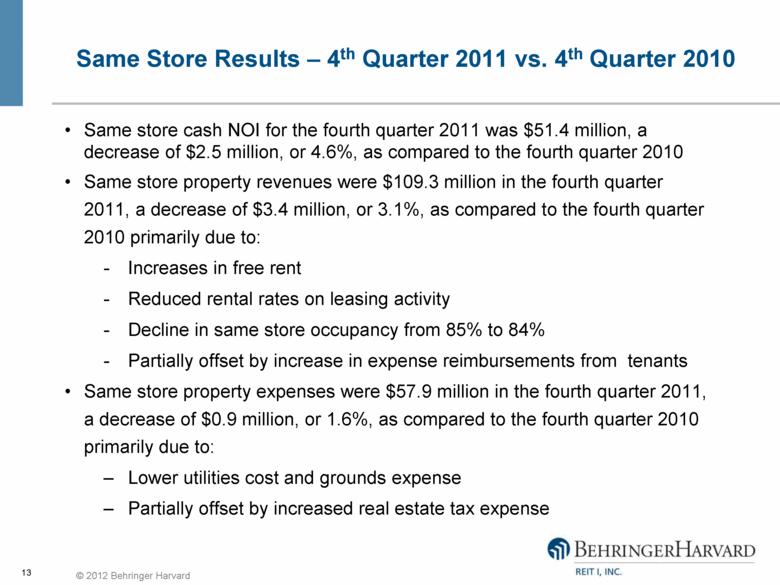
Same store cash NOI for the fourth quarter 2011 was $51.4 million, a decrease of $2.5 million, or 4.6%, as compared to the fourth quarter 2010 Same store property revenues were $109.3 million in the fourth quarter 2011, a decrease of $3.4 million, or 3.1%, as compared to the fourth quarter 2010 primarily due to: Increases in free rent Reduced rental rates on leasing activity Decline in same store occupancy from 85% to 84% Partially offset by increase in expense reimbursements from tenants Same store property expenses were $57.9 million in the fourth quarter 2011, a decrease of $0.9 million, or 1.6%, as compared to the fourth quarter 2010 primarily due to: Lower utilities cost and grounds expense Partially offset by increased real estate tax expense Same Store Results – 4th Quarter 2011 vs. 4th Quarter 2010 13 |
|
|
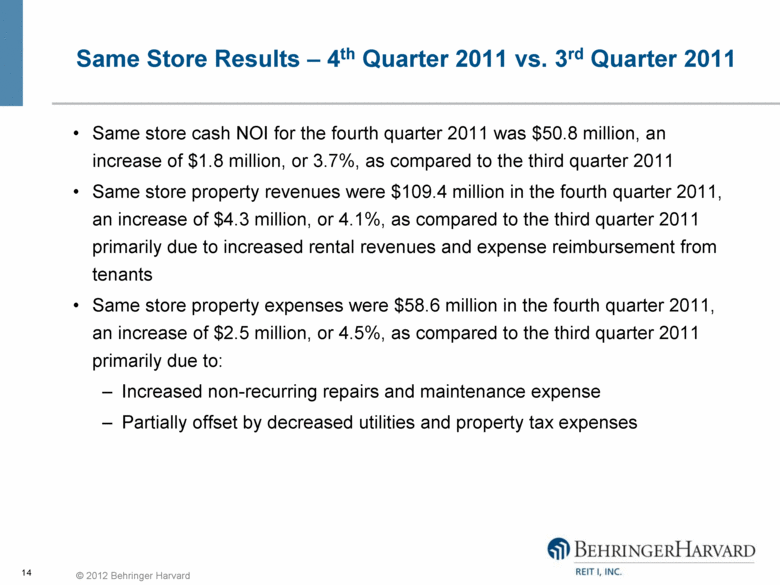
Same store cash NOI for the fourth quarter 2011 was $50.8 million, an increase of $1.8 million, or 3.7%, as compared to the third quarter 2011 Same store property revenues were $109.4 million in the fourth quarter 2011, an increase of $4.3 million, or 4.1%, as compared to the third quarter 2011 primarily due to increased rental revenues and expense reimbursement from tenants Same store property expenses were $58.6 million in the fourth quarter 2011, an increase of $2.5 million, or 4.5%, as compared to the third quarter 2011 primarily due to: Increased non-recurring repairs and maintenance expense Partially offset by decreased utilities and property tax expenses Same Store Results – 4th Quarter 2011 vs. 3rd Quarter 2011 14 |
|
|
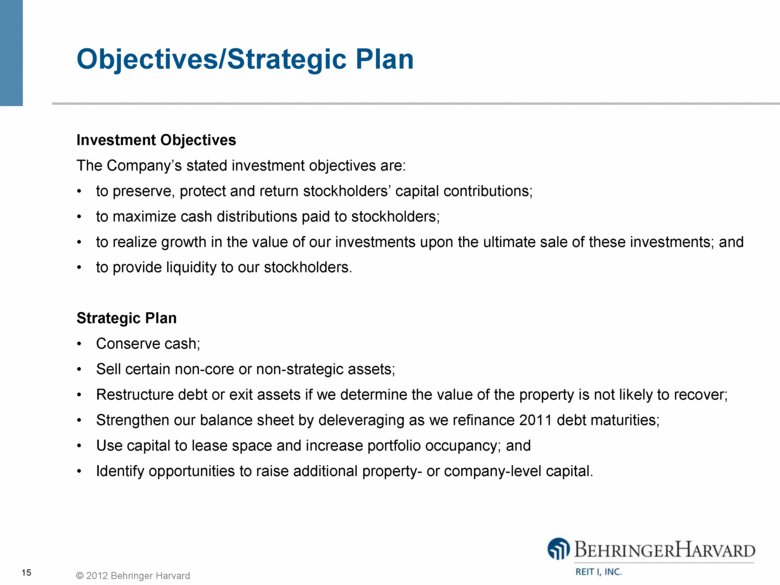
Objectives/Strategic Plan Investment Objectives The Company’s stated investment objectives are: to preserve, protect and return stockholders’ capital contributions; to maximize cash distributions paid to stockholders; to realize growth in the value of our investments upon the ultimate sale of these investments; and to provide liquidity to our stockholders. Strategic Plan Conserve cash; Sell certain non-core or non-strategic assets; Restructure debt or exit assets if we determine the value of the property is not likely to recover; Strengthen our balance sheet by deleveraging as we refinance 2011 debt maturities; Use capital to lease space and increase portfolio occupancy; and Identify opportunities to raise additional property- or company-level capital. 15 |
|
|
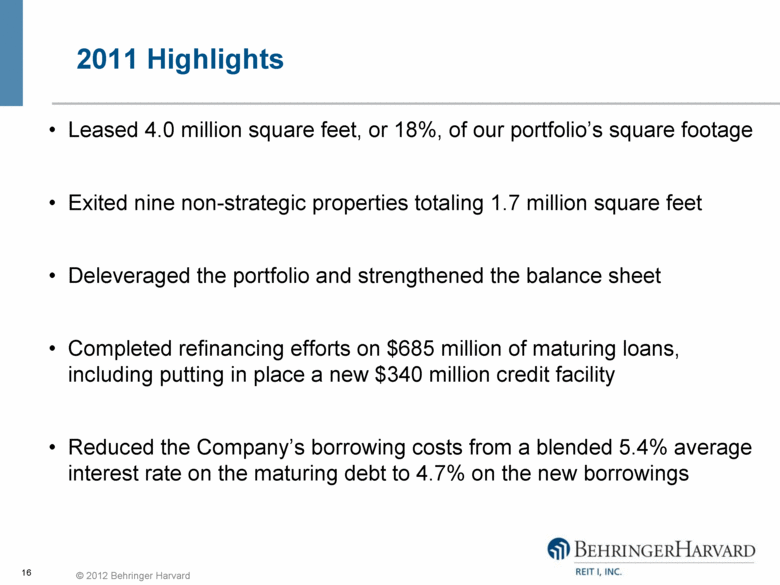
2011 Highlights Leased 4.0 million square feet, or 18%, of our portfolio’s square footage Exited nine non-strategic properties totaling 1.7 million square feet Deleveraged the portfolio and strengthened the balance sheet Completed refinancing efforts on $685 million of maturing loans, including putting in place a new $340 million credit facility Reduced the Company’s borrowing costs from a blended 5.4% average interest rate on the maturing debt to 4.7% on the new borrowings 16 |
|
|
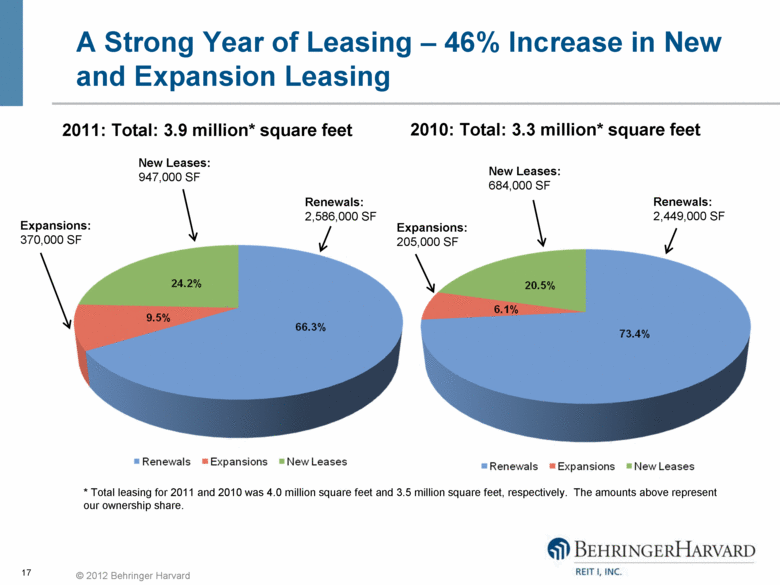
A Strong Year of Leasing – 46% Increase in New and Expansion Leasing 17 New Leases: 947,000 SF Renewals: 2,586,000 SF Expansions: 370,000 SF 2011: Total: 3.9 million* square feet * Total leasing for 2011 and 2010 was 4.0 million square feet and 3.5 million square feet, respectively. The amounts above represent our ownership share. New Leases: 684,000 SF Renewals: 2,449,000 SF Expansions: 205,000 SF 2010: Total: 3.3 million* square feet |
|
|
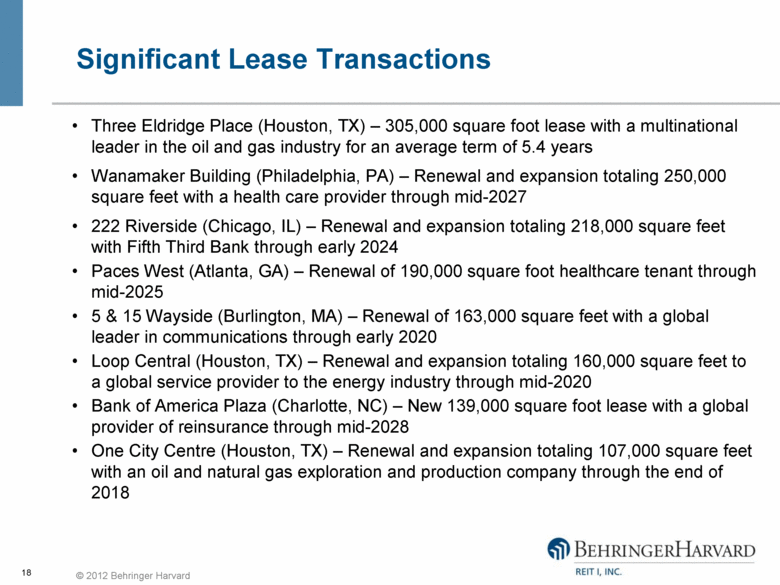
Significant Lease Transactions Three Eldridge Place (Houston, TX) – 305,000 square foot lease with a multinational leader in the oil and gas industry for an average term of 5.4 years Wanamaker Building (Philadelphia, PA) – Renewal and expansion totaling 250,000 square feet with a health care provider through mid-2027 222 Riverside (Chicago, IL) – Renewal and expansion totaling 218,000 square feet with Fifth Third Bank through early 2024 Paces West (Atlanta, GA) – Renewal of 190,000 square foot healthcare tenant through mid-2025 5 & 15 Wayside (Burlington, MA) – Renewal of 163,000 square feet with a global leader in communications through early 2020 Loop Central (Houston, TX) – Renewal and expansion totaling 160,000 square feet to a global service provider to the energy industry through mid-2020 Bank of America Plaza (Charlotte, NC) – New 139,000 square foot lease with a global provider of reinsurance through mid-2028 One City Centre (Houston, TX) – Renewal and expansion totaling 107,000 square feet with an oil and natural gas exploration and production company through the end of 2018 18 |
|
|
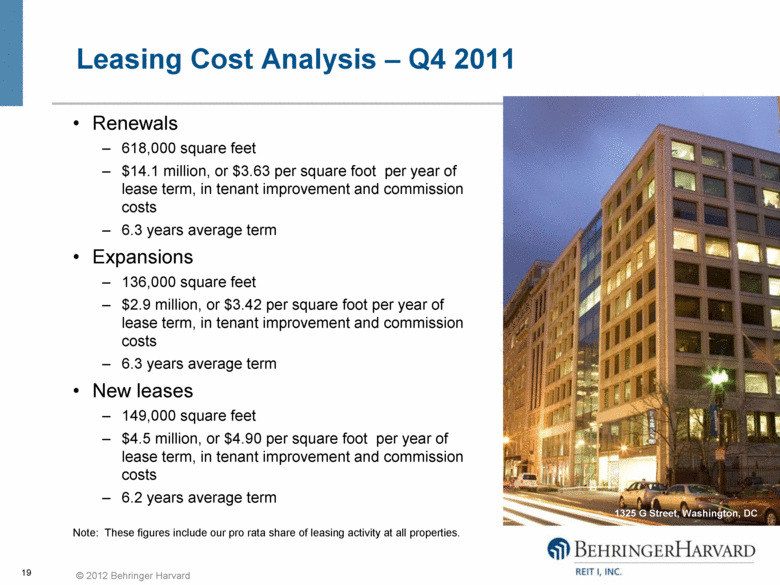
Leasing Cost Analysis – Q4 2011 Renewals 618,000 square feet $14.1 million, or $3.63 per square foot per year of lease term, in tenant improvement and commission costs 6.3 years average term Expansions 136,000 square feet $2.9 million, or $3.42 per square foot per year of lease term, in tenant improvement and commission costs 6.3 years average term New leases 149,000 square feet $4.5 million, or $4.90 per square foot per year of lease term, in tenant improvement and commission costs 6.2 years average term Note: These figures include our pro rata share of leasing activity at all properties. 19 1325 G Street, Washington, DC |
|
|
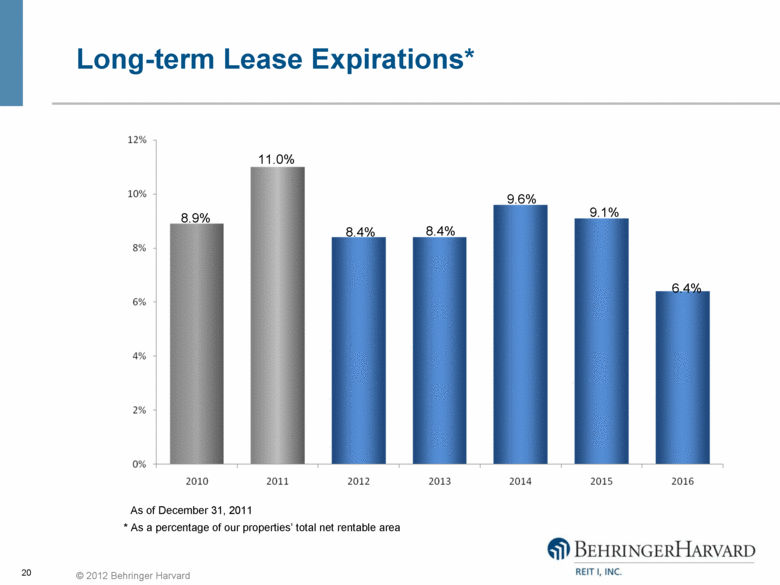
Long-term Lease Expirations* As of December 31, 2011 * As a percentage of our properties’ total net rentable area 20 8.9% 11.0% 8.4% 9.6% 8.4% 9.1% 6.4% 12% 10% 8% 6% 4% 2% 0% 2010 2011 2012 2013 2014 2015 2016 |
|
|
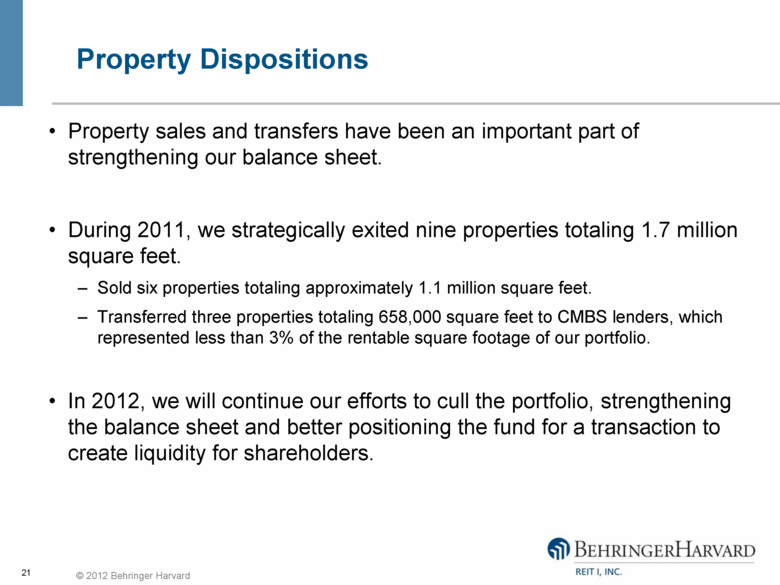
Property Dispositions Property sales and transfers have been an important part of strengthening our balance sheet. During 2011, we strategically exited nine properties totaling 1.7 million square feet. Sold six properties totaling approximately 1.1 million square feet. Transferred three properties totaling 658,000 square feet to CMBS lenders, which represented less than 3% of the rentable square footage of our portfolio. In 2012, we will continue our efforts to cull the portfolio, strengthening the balance sheet and better positioning the fund for a transaction to create liquidity for shareholders. 21 |
|
|
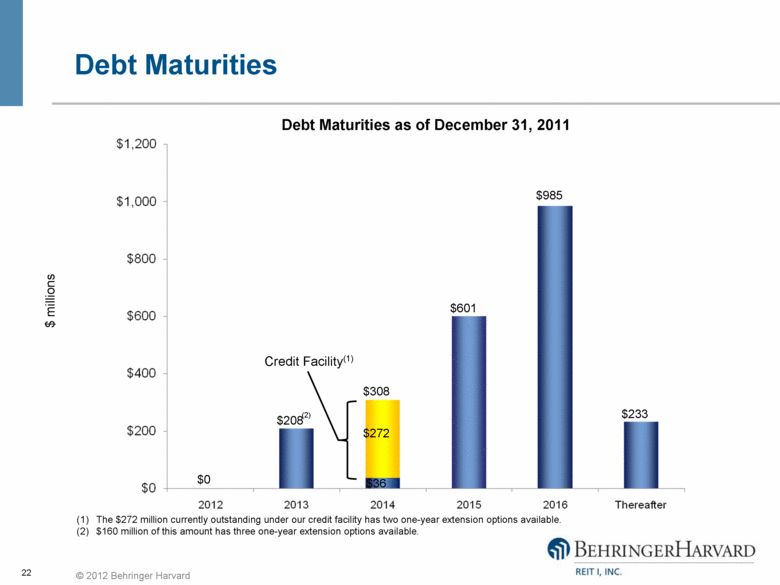
Debt Maturities 22 The $272 million currently outstanding under our credit facility has two one-year extension options available. $160 million of this amount has three one-year extension options available. Debt Maturities as of December 31, 2011 $985 $308 $208 $ millions $233 Credit Facility(1) $601 $272 $36 $0 (2) $1,200 $1,000 $800 $600 $400 $200 $0 2012 2013 2014 2015 2016 Thereafter (1) (2) |
|
|
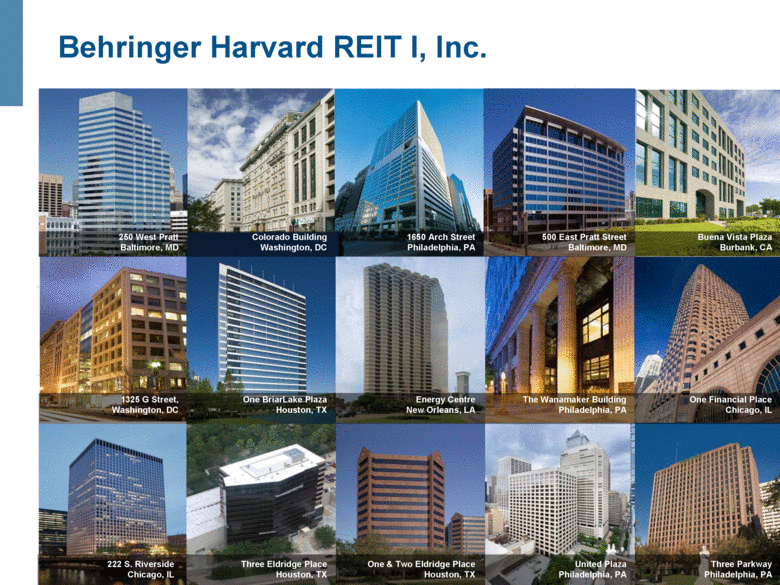
Behringer Harvard REIT I, Inc. 250 West Pratt Baltimore, MD Colorado Building Washington, DC 1650 Arch Street Philadelphia, PA 500 East Pratt Street Baltimore, MD Buena Vista Plaza Burbank, CA 1325 G Street, Washington, DC One BriarLake Plaza Houston, TX The Wanamaker Building Philadelphia, PA One Financial Place Chicago, IL Energy Centre New Orleans, LA 222 S. Riverside Chicago, IL Three Eldridge Place Houston, TX One & Two Eldridge Place Houston, TX United Plaza Philadelphia, PA Three Parkway Philadelphia, PA |
|
|
Questions? During the call, please e-mail questions to: bhreit@behringerharvard.com 24 |

|
|
Playback Information Representatives may log on to DST Vision for a playback of today’s call Shareholders should call toll free (855) 859-2056 and use passcode 25755497 Presentation available on our website at www.behringerharvard.com under the heading ‘SEC Filings’ for the Form 8-K filing made today 25 |