Attached files
| file | filename |
|---|---|
| EX-23.1 - EX-23.1 - INTERMOLECULAR INC | a2207823zex-23_1.htm |
| EX-10.8 - EX-10.8 - INTERMOLECULAR INC | a2207823zex-10_8.htm |
| EX-31.2 - EX-31.2 - INTERMOLECULAR INC | a2207823zex-31_2.htm |
| EX-31.1 - EX-31.1 - INTERMOLECULAR INC | a2207823zex-31_1.htm |
| EX-32.1 - EX-32.1 - INTERMOLECULAR INC | a2207823zex-32_1.htm |
| EX-32.2 - EX-32.2 - INTERMOLECULAR INC | a2207823zex-32_2.htm |
| EX-3.1 - EX-3.1 - INTERMOLECULAR INC | a2207823zex-3_1.htm |
| EX-3.2 - EX-3.2 - INTERMOLECULAR INC | a2207823zex-3_2.htm |
| EX-4.5 - EX-4.5 - INTERMOLECULAR INC | a2207823zex-4_5.htm |
Use these links to rapidly review the document
TABLE OF CONTENTS
ITEM 8. FINANCIAL STATEMENTS AND SUPPLEMENTARY DATA
UNITED STATES
SECURITIES AND EXCHANGE COMMISSION
Washington, D.C. 20549
Form 10-K
| (Mark One) | ||
ý |
ANNUAL REPORT PURSUANT TO SECTION 13 OR 15(d) OF THE SECURITIES EXCHANGE ACT OF 1934 |
|
For the fiscal year ended December 31, 2011 |
||
OR |
||
o |
TRANSITION REPORT PURSUANT TO SECTION 13 OR 15(d) OF THE SECURITIES EXCHANGE ACT OF 1934 |
|
For the transition period from to |
||
Commission file number: 001-35348
Intermolecular, Inc.
(Exact Name of Registrant as Specified in its Charter)
| Delaware (State or Other Jurisdiction of Incorporation or Organization) |
20-1616267 (I.R.S. Employer Identification No.) |
|
3011 N. First Street San Jose, California (Address of Principal Executive Offices) |
95134 (Zip Code) |
(408) 582-5700
(Registrant's Telephone Number, Including Area Code)
Securities registered pursuant to Section 12(b) of the Act:
| Title of Each Class | Name of Each Exchange on Which Registered | |
|---|---|---|
| Common Stock, $0.001 par value | The NASDAQ Global Select Market |
Securities registered pursuant to Section 12(g) of the Act: None
Indicate by check mark if the registrant is a well-known seasoned issuer, as defined in Rule 405 of the Securities Act. Yes o No ý
Indicate by check mark if the registrant is not required to file reports pursuant to Section 13 or Section 15(d) of the Act. Yes o No ý
Indicate by check mark whether the registrant: (1) has filed all reports required to be filed by Section 13 or 15(d) of the Securities Exchange Act of 1934 during the preceding 12 months (or for such shorter period that the registrant was required to file such reports), and (2) has been subject to such filing requirements for the past 90 days. Yes ý No o
Indicate by check mark whether the registrant has submitted electronically and posted on its corporate Web site, if any, every Interactive Data File required to be submitted and posted pursuant to Rule 405 of Regulation S-T during the preceding 12 months (or for such shorter period that the registrant was required to submit and post such files). Yes o No o
Indicate by check mark if disclosure of delinquent filers pursuant to Item 405 of Regulation S-K is not contained herein, and will not be contained, to the best of registrant's knowledge, in definitive proxy or information statements incorporated by reference in Part III of this Form 10-K or any amendment to this Form 10-K. ý
Indicate by check mark whether the registrant is a large accelerated filer, an accelerated filer, a non-accelerated filer, or a smaller reporting company. See the definitions of "large accelerated filer," "accelerated filer" and "smaller reporting company" in Rule 12b-2 of the Exchange Act. (Check one):
| Large accelerated filer o | Accelerated filer o | Non-accelerated filer ý (Do not check if a smaller reporting company) |
Smaller reporting company o |
Indicate by check mark whether the registrant is a shell company (as defined in Rule 12b-2 of the Exchange Act). Yes o No ý
As of December 31, 2011, the aggregate market value of the registrant's common stock, par value $0.001, held by non-affiliates of the registrant was approximately $150 million, based upon the closing sale price of such shares on the NASDAQ Global Select Market on December 30, 2011, which was the last trading day of 2011. The registrant has provided this information as of December 31, 2011 because, as of June 30, 2011, the last business day of the registrant's most recently completed second fiscal quarter, the registrant's common stock was not listed on any exchange or over-the-counter market. For purposes of this disclosure, shares of common stock held by executive officers and directors of the registrant and by each person who owned 10% or more of the outstanding common stock on December 31, 2011 have been excluded because such persons may be deemed to be affiliates of the registrant. This determination of affiliate status is not necessarily a conclusive determination for other purposes.
As of March 15, 2012, the number of outstanding shares of the registrant's common stock, par value $0.001 per share, was 42,277,706.
DOCUMENTS INCORPORATED BY REFERENCE
Portions of the registrant's Definitive Proxy Statement to be filed with the Commission pursuant to Regulation 14A in connection with the registrant's 2012 Annual Meeting of Stockholders, to be filed subsequent to the date hereof, are incorporated by reference into Part III of this Report. Such Definitive Proxy Statement will be filed with the Securities and Exchange Commission not later than 120 days after the conclusion of the registrant's fiscal year ended December 31, 2011. Except with respect to information specifically incorporated by reference in this Form 10-K, the Proxy Statement is not deemed to be filed as part of this Form 10-K.
INTERMOLECULAR, INC.
FORM 10-K FOR THE FISCAL YEAR ENDED DECEMBER 31, 2011
2
SPECIAL NOTE REGARDING FORWARD-LOOKING STATEMENTS
The following discussion and analysis should be read in conjunction with our audited consolidated financial statements and the related notes that appear elsewhere in this Annual Report on Form 10-K. This Annual Report on Form 10-K contains "forward-looking statements" within the meaning of Section 21E of the Securities Exchange Act of 1934, as amended, or the Exchange Act, particularly in Part I, Item 1: "Business," Part I, Item 1A: "Risk Factors" and Part 2, Item 7: "Management's Discussion and Analysis of Financial Condition and Results of Operations." These statements are often identified by the use of words such as "may," "will," "expect," "believe," "anticipate," "intend," "could," "should," "estimate," or "continue," and similar expressions or variations. All statements other than statements of historical fact could be deemed forward-looking, including, but not limited to: any projections of financial information; any statements about historical results that may suggest trends for our business; any statements of the plans, strategies, and objectives of management for future operations; any statements of expectation or belief regarding future events, technology developments, our customers and collaborative development programs (CDPs), expenses, liquidity, cash flow, growth rates or enforceability of our intellectual property rights and related litigation expenses; and any statements of assumptions underlying any of the foregoing. Such forward-looking statements are subject to risks, uncertainties and other factors that could cause actual results and the timing of certain events to differ materially from future results expressed or implied by such forward-looking statements. Accordingly, we caution you not to place undue reliance on these statements. For Intermolecular, particular uncertainties that could affect future results include: our dependence on a limited number of customers; our ability to manage our growth, including an increasing number of employees, customers and CDPs; the length of our sales and development cycles, and our ability to generate material revenue after we have devoted significant resources to developing a project; our ability to evolve existing products, anticipate trends in technology development and introduce new developments in a timely manner in the rapidly changing semiconductor and clean-energy industries; our customers' ability to manufacture, market and sell products that incorporate technology developed through the CDPs; fluctuations in the number and price of products sold by our customers that incorporate technology developed through the CDPs, and the shortening life cycles of those products, in each case impacting our licensing and royalty revenue; our ability to scale our development efforts, our ability to secure new CDPs with new or existing customers and the timing of those CDPs; the degree to which existing CDPs are completed or expanded; our ability to maintain existing commercial terms or enter into new licensing arrangements with our customers once they begin to sell their end products; our ability to make the substantial research and development investments required to stay competitive in our business; our ability to develop our high productivity combinatorial (HPC) platform and expertise to support our future growth plans in adjacent vertical markets such as clean-energy markets; any potential involvement in intellectual property litigation; any potential payments to our customers resulting from our intellectual property indemnification policies and obligations; our reliance on our customers to deliver timely and accurate information to accurately report our financial results from licensing and royalty revenue; our potential need for additional capital to finance our business; any delay in shipments caused by shortages of components incorporated in our customers' products, design errors or other manufacturing problems associated with our customers' products; the highly cyclical nature of and price volatility in the semiconductor industry; the emerging and uncertain nature of the clean-energy industry; potential warranty claims, product recalls and product liability for our HPC tools and for our customers' products that incorporate technology developed through our CDPs; global or regional economic, political and social conditions; and business interruptions such as earthquakes and other natural disasters. For a discussion of some of the factors that could cause actual results to differ materially from our forward-looking statements, see the discussion on risk factors that appear in Part I, Item 1A: "Risk Factors" of this Annual Report on Form 10-K and other risks and uncertainties detailed in this and our other reports and filings with the Securities and Exchange Commission, or SEC. The forward-looking statements in this Annual Report on Form 10-K represent our views as of the date of this Annual Report on Form 10-K. We anticipate that subsequent events and developments will cause our views to change. However, while we may elect to update these forward-looking statements at some point in the future, we have no current intention of doing so except to the extent required by applicable law. You should, therefore, not rely on these forward-looking statements as representing our views as of any date subsequent to the date of this Annual Report on Form 10-K.
3
Overview
We have pioneered a proprietary approach to accelerate research and development, innovation and time-to-market for the semiconductor and clean-energy industries. Through paid collaborative development programs (CDPs) with our customers, we develop proprietary technology and intellectual property (IP) for our customers focused on advanced materials, processes, integration and device architectures. This technology enables our customers to bring optimized, high-volume manufacturing-ready integrated devices to market faster and with less risk than traditional approaches to research and development (R&D). We provide our customers with proprietary technology through various fee arrangements and grant them rights to associated IP, primarily through royalty-bearing licenses. Our proprietary approach is broadly applicable to high-volume integrated device markets, which include the markets for semiconductors, flat glass coatings and glass-based devices, solar cells, light-emitting diodes (LEDs), flat-panel displays, advanced batteries and other energy-efficient technologies.
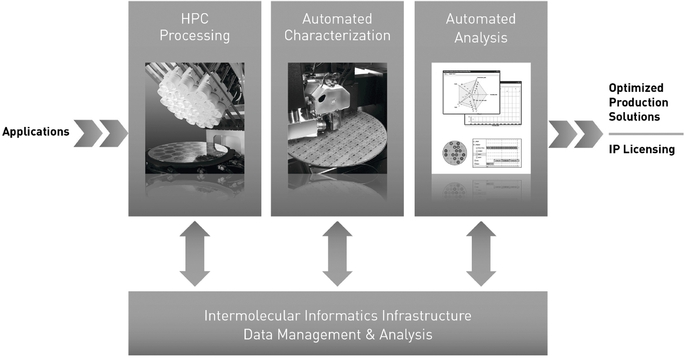
Our approach consists of our proprietary high productivity combinatorial (HPC) platform, coupled with our multi-disciplinary team. Our HPC platform consists of our Tempus HPC processing tools, automated characterization and informatics and analysis software. Our platform is purpose-built for R&D using combinatorial process systems. Combinatorial processing is a methodology for discovery and development that employs parallel and other high-throughput experimentation, which allows R&D experimentation to be performed at speeds up to 100 times faster than traditional methods. Our processing tools allow us to perform up to 192 experiments on a single substrate as compared to traditional methods, which typically allow only a single experiment at a time. Our automated characterization systems and proprietary informatics and analytics match the high throughput of our processing tools. Our multi-disciplinary team of approximately 147 scientists and engineers as of December 31, 2011, of whom approximately 60 have Ph.D.s, designs customized workflows for our customers' specific applications using the HPC platform and applies the workflows in collaboration with our customers. The combination of the HPC platform and our team generates significant competitive advantages for our customers. By accelerating innovation and enabling our customers to commercialize higher-performance and lower-cost integrated devices faster than through traditional methods of R&D, we provide them an opportunity to gain market share and generate higher margins, including through a first-mover advantage.
Our business model aligns our interests with those of our customers as we collaborate to develop differentiated proprietary technology and IP for high-volume integrated devices through collaborative development programs. Customers pay us development services fees during multi-year CDPs, which typically initially last for two years and may range from one to three years. Our customers receive rights to the technology and IP developed during the CDPs, and once our customers commercialize products using this technology and IP, they pay us primarily through royalties. In certain cases, we sell HPC processing tools to our customers who pay a recurring license to operate those tools with our combinatorial processing capabilities. By aligning our interests with those of our customers, we facilitate collaboration and open communication that is more likely to result in innovative, differentiated products and future CDPs with those customers.
We currently target large, high-volume semiconductor and high-growth emerging clean-energy markets, including DRAM, flash memory, complex logic, flat glass coatings and glass-based devices, solar cells, LEDs and other energy-efficient technologies. Within these broad markets, we target customers that have track records of technological innovation, deploy significant resources and are pursuing technical advancements that are critical to their success and strategy. Our customers include ATMI, Elpida Memory, GLOBALFOUNDRIES, Guardian Industries, SanDisk, Taiwan Semiconductor Manufacturing Company (TSMC) and Toshiba. Each of ATMI, Elpida, and GLOBALFOUNDRIES
4
accounted for 10% or more of our revenue for the year ended December 31, 2011, and each of ATMI and Elpida accounted for 10% or more of our revenue for the year ended December 31, 2010. ATMI and Elpida have commenced shipping products incorporating technology developed through our CDPs and pay us licensing and royalty fees. To date, we have received the majority of our revenue from customers in DRAM, flash memory, complex logic and energy-efficient applications in flat glass, and have not yet received a material amount of revenue from customers in solar cells, LEDs and other energy-efficient technologies.
Industry Background
High-volume integrated devices serve large and growing markets, including the markets for semiconductors, flat glass, solar cells, LEDs, flat-panel displays, advanced batteries and other energy-efficient technologies. Success in these markets requires rapid and cost-effective product innovation, fast time-to-market, competitive pricing, production scalability and the ability to achieve specific requirements. These devices are typically manufactured using thin-film deposition of advanced materials through customized processes that create a specific device architecture. It is increasingly necessary to evaluate elements in the periodic table that have previously not been used in high-volume manufacturing to deliver performance and cost improvements, and to develop advanced device structures capable of addressing particular application requirements. These device structures must then be scaled and integrated into cost-effective manufacturing processes to serve high-volume integrated device markets. Traditional R&D approaches are increasingly challenged by the market need to accelerate innovation and time-to-market for the semiconductor and clean-energy industries.
Semiconductor Industry
Since the inception of the semiconductor industry more than 50 years ago, innovation has been continually driven by consumer demands for smaller, higher-performance, more power-efficient and less expensive electronic products. Recently, this innovation has been driven by broad end-market demand for smartphones, PCs, tablet computers, cloud computing, high-definition media, and advanced aerospace and industrial applications. The semiconductor industry is characterized by intense competition, with many semiconductor companies seeking to gain market advantage over competitors by expanding their broad product portfolios, using their deep design and/or process capabilities and leveraging their IP libraries. Increasingly, these companies are relying on combinations of advanced materials, processes, integration and device architectures to compete and differentiate their products.
Historically, the pace of semiconductor innovation has been enabled by device scaling, in which, according to Moore's Law, the number of transistors in a design generally doubles every two years. This increasing density has reduced costs and improved capabilities over time, thereby driving market demand and growth. However, semiconductors are approaching the limitations of device scaling with the current set of materials and manufacturing processes. Consequently, semiconductor manufacturers are turning to advanced materials, processes, integration and new device architectures to enable continued device scaling and to deliver improved product performance and cost competitiveness. The reliance on advanced materials, processes, integration and new device architectures has in turn made advancements in semiconductor technology increasingly complex and expensive. Each new process node requires experimentation with more elements in the periodic table and more material combinations to deliver the desired physical and electrical characteristics for device performance and manufacturability. For example, the broad adoption of copper interconnects enabled the industry to continue device scaling in the microprocessor field, but as this advancement required changes not only in materials, but also in processes, integration and device architectures to achieve high-volume, cost-effective manufacturing, the transition was challenging and slow.
Semiconductor manufacturing companies have used device scaling to shrink transistors and develop new process technology nodes to address customer requirements for lower cost and higher performance
5
integrated circuits (ICs). However, advanced R&D and new fabrication facility costs have increased significantly over time, especially as the use of advanced materials and processes have become increasingly important to the development and introduction of the latest generation process technology nodes. The greater expertise and higher costs required to explore advanced materials, processes, integration and new device architectures have led to increased specialization among materials, capital equipment, semiconductor manufacturing and IC design companies. However, this specialization has left gaps in the industry knowledge base with respect to the complexities of the interaction between materials science, process technology, device integration and the scale-up to high-volume IC production.
To succeed in the market and deliver an appropriate financial return, semiconductor companies are under intense pressure to rapidly develop optimized ICs and efficiently scale them to cost-effective production. Using advanced semiconductor materials, processes, integration and new device architectures requires intensive, time-consuming experimentation because advanced materials are not well understood and accurate, robust models do not exist. As a result, semiconductor companies must increasingly rely on time and resource-intensive, empirical R&D to develop innovative solutions and enable manufacturability at lower costs.
Clean-Energy Industry
The emerging clean-energy markets also depend on improvements in advanced materials, processes, integration and new device architectures. Clean-energy markets, which include the markets for flat glass coatings and glass-based devices, solar cells, LEDs, advanced batteries and other energy-efficient technologies, remain in early stages of technological evolution. Companies in the fast-evolving clean-energy markets are in the early stages of understanding materials, processes, integration, device architectures and manufacturing methodologies. As a result, those companies that successfully develop relevant, scalable proprietary materials and device technologies will likely have a competitive advantage over their peers in both time-to-market and price.
Decreasing prices, government policies and social awareness are driving growth in the clean-energy markets and certain sectors have entered high-volume production. Reduced prices and improved performance relative to traditional alternatives generally catalyze widespread adoption of new technologies. For example, LEDs, for the general illumination market, are currently more expensive to purchase than incandescent and fluorescent lighting. To increase penetration of the general lighting market, price reductions and improvements in performance, such as brightness, color and form factor will be critical. New advanced materials, improved process technologies and new device architectures will enable larger wafer sizes, less costly substrate materials, higher-volume production and improved yields for lower-cost and higher-performing LEDs.
Because of the early stages of technology development in the clean-energy markets, there are significant opportunities for cost savings and potential competitive advantage. Market participants who resolve the price-performance challenges ahead of their competitors through advanced materials, processes, integration and new device architectures may greatly accelerate market adoption and establish themselves as market leaders. These opportunities amplify the importance of empirical R&D to develop low-cost, high-performance solutions in these early-stage markets.
Current Challenges with Innovation in High-Volume Integrated Device Markets
Advanced materials and device integration are driving forces behind technology advancement in the high-volume integrated device markets. In addition, innovation in these markets and control of the resulting IP are critical to enable competitive differentiation. However, the existing approach used to explore new materials, processes, integration and device architectures is complex, time-consuming and requires empirical R&D.
6
Traditionally, device manufacturers have conducted R&D using expensive high-volume manufacturing tools that are not specifically built for that purpose. Production tools typically can only run one process at a time, which leads to limited cycles of learning. Furthermore, using tools deployed in a production environment for R&D requires reserving tool time on high-volume manufacturing lines to evaluate each experiment, resulting in substantial opportunity costs for existing product manufacturing. High-volume manufacturing environments are also not conducive to R&D because these environments require stability to minimize risk and to reduce contamination that the research-based introduction of new materials, tools or processes may cause. Additionally, high-volume manufacturing is conducted by operators focused on repetitive, mistake-free processing, not on many cycles of trial and error. In addition to some of the challenges above, certain clean-energy device manufacturers use laboratory-scale tools for R&D, which do not address the scale-up requirements critical to high-volume manufacturing. These factors combine to increase development risks due to long learning cycles, limited data sets, narrow exploration capabilities and slow time-to-market.
Successful R&D programs require flexibility around experimentation and the introduction of new materials, chemicals, processes and tools to derive the most efficient high-volume integrated device solutions. Furthermore, we believe they are best administered by scientists and engineers with experience across various disciplines of equipment, materials, device architectures and processes to conduct successful experiments and derive optimized solutions.
The following existing approaches have been used to complement internal R&D, but each has specific limitations:
- •
- Equipment
suppliers. Equipment suppliers provide solutions that are not tailored to specific customer applications. Additionally, they provide
high-volume manufacturing solutions that are not purpose-built for researching the interaction of advanced materials, processes, integration and device architectures.
- •
- Industry
consortia. Industry consortia provide solutions that offer no competitive differentiation because the customer must share the IP with
all consortium participants, including competitors.
- •
- Alliance
partnerships. Alliance partnerships impose limitations on the overall outcome, as they are typically structured to find generic
solutions rather than the solutions for a particular application. Additionally, these generic solutions are offered to a small set of competitors and are not customer-specific or application-specific.
- •
- University
research. University research provides theoretical solutions requiring additional work and time to commercialize, since this work
typically does not address manufacturing or commercialization challenges.
- •
- Third-party IP licensing. Third-party IP licensing is primarily used for defensive purposes or market access. Those who cross-license IP do not receive a solution that is specific to the customer, manufacturing process or application, and the received solution is not differentiated from what their competitors receive through the same license.
7
Substantially improved methodologies are required to generate the learning cycles necessary to accelerate innovation, improve product development and ensure manufacturing scalability of high-volume integrated devices. Further, companies require new ways to develop proprietary technology and obtain IP rights to support competitive advantage for their new products.
Our Solution
We have pioneered a proprietary approach to accelerate research and development, innovation and time-to-market for the semiconductor and clean-energy industries. Using our approach, we develop technology and IP rights focused on advanced materials, processes, integration and device architectures in collaboration with our customers. This technology enables our customers to bring optimized, high-volume manufacturing-ready integrated devices to market faster and with less risk than traditional approaches to R&D. Our proprietary HPC platform consists of our Tempus HPC processing tools, automated characterization and informatics and analysis software. Our HPC platform increases R&D productivity because it is purpose-built for R&D and utilizes advanced combinatorial processing systems, which allow for experiments to be performed at speeds up to 100 times faster than traditional methods. We provide our customers with proprietary technology through various fee arrangements and grant them rights to IP developed during the collaboration, primarily through royalty-bearing licenses. Our multi-disciplinary team of approximately 147 scientists and engineers as of December 31, 2011, of whom approximately 60 have Ph.D.s, designs customized workflows for our customers' specific applications using our HPC platform and applies the workflows in collaboration with our customers to develop proprietary technology for them.
The key elements of our HPC platform include the following:
- •
- Tempus HPC
processing. We use our Tempus HPC processing tools to rapidly process different experiments consisting of various combinations of
materials, processing parameters, sequencing and device structures. We are able to perform up to 192 experiments on a single substrate, as compared to traditional methods, which typically allow only a
single experiment at a time.
- •
- Automated
characterization. We use automated characterization systems to characterize the substrates processed by our Tempus HPC processing tools,
thereby rapidly generating experimental data while matching our processing throughput.
- •
- Informatics and analysis software. We use our informatics and analysis software to automate experiment generation, characterization, data analysis and reporting, in each case while matching our processing throughput, and to create an aggregated and searchable database of information that includes the experimental results we generate.
8
The following graphic illustrates how these elements combine to form our HPC platform:
Benefits to Our Customers
Our business model aligns our interests with those of our customers as we collaborate to develop optimized, manufacturing-ready IP for high-volume integrated devices. We provide our customers with proprietary technology through various fee arrangements and grant them rights to IP developed during our CDPs, primarily through royalty-bearing licenses. Our differentiated platform solution and approach to collaborative engagements are designed to deliver the following significant benefits to our customers:
- •
- Accelerated time-to-market with better,
lower-cost products. Faster processing of experiments, throughput-matched characterization and real-time data
management and analysis allow additional learning cycles and broader exploration of materials and process solution combinations. In highly competitive markets, the resulting speed to market with
improved, lower-cost products enables our customers to gain market share and improve profitability.
- •
- Development of application and manufacturing-ready IP tailored to our
customers' specifications. When we engage in a CDP with our customers, we use our HPC platform and customized workflows to develop
IP-protected, proprietary technology that is tailored to our customers' applications and ready for high-volume manufacturing. We provide our customers rights to the IP for
their applications primarily through royalty-bearing licenses.
- •
- Increased R&D productivity and reduced technology risk. Using our combinatorial processes, we narrow the potential combinations of advanced materials, processes and device architecture solutions through a series of increasingly rigorous screening stages to guide the selection of solutions that meet device performance requirements and that are cost-efficient and ready for high-volume manufacturing. The combinatorial process of screening and evaluating these solutions and their manufacturability mitigates our customers' technology risk earlier in the development cycle.
9
Strengths
We have pioneered, developed and patented a proprietary platform and methodology for accelerating R&D in the semiconductor and clean-energy markets. Our strengths include:
- •
- Proprietary and patented HPC
platform. Our HPC platform employs proprietary and patented combinatorial methods to parallel process up to 192 experiments on a single
substrate as compared to traditional methods, which typically allow only a single experiment at a time. As of December 31, 2011, we owned or had exclusive rights within our field of use to 730
U.S. patents and patent applications (some of which also have foreign counterparts), which provide us with a competitive advantage in the use of combinatorial methods and systems in our target
markets.
- •
- Flexible technology platform configurable for and extendable to
multiple markets. Our HPC platform can be configured for many applications and extended to address the broad set of integrated device
markets. Because of the similarities in materials deposition, manufacturing processes and device integration complexities across markets, our platform allows us to create customized workflows and
support innovation across multiple markets.
- •
- Seasoned engineering team with multi-disciplinary
expertise. We have assembled a multi-disciplinary team of approximately147 scientists and engineers, of whom approximately 60 have
Ph.D.s, with expertise across various disciplines, fields and technologies, including engineering, materials science, process development and integration, equipment, device process technologies and
device integration.
- •
- Collaborative customer engagements leading to IP generation and
strategic alignment. Our business model aligns our financial interests with those of our customers, to whom we grant rights to
proprietary technology and IP developed during our collaborations. Customers pay us development service and HPC platform subscription fees during multi-year CDPs. As they commercialize
products incorporating technology developed through the CDPs, our customers then pay licensing fees and/or royalties, including fixed fees and fees based on percentages of revenue and/or fee per
product. In certain cases, we sell HPC processing tools to our customers and receive recurring license fees. This alignment of interests facilitates collaboration and open communication that improves
development efficiencies and is more likely to result in innovative, differentiated products, which in turn creates a cycle of success that leads to future CDPs with those customers.
- •
- Attractive business model with contracted CDP revenue and recurring high-margin royalties. Our multi-year CDPs generate predictable CDP and services revenue from our customers. Our CDPs also establish the terms upon which we will receive licensing and royalty revenue from the sale of our customers' products that incorporate technology developed through our CDPs. These royalty arrangements create a business model with attractive margins and a high degree of near-term visibility. We expect to generate more revenue through royalty-based licenses as more of our customers commercialize and ramp production of products incorporating technology developed through the CDPs.
Our Strategy
Our mission is to drive our customers' success by transforming R&D and accelerating innovation in markets that derive competitive advantage from the interaction of materials science, processes, integration and device architecture. To accomplish this, we:
- •
- Target large, high-volume semiconductor markets. We target large, high-volume semiconductor markets, including DRAM, flash memory and complex logic. Success in these markets requires semiconductor companies to consistently remain at the leading edge of cost and performance,
10
- •
- Target large, high-growth, emerging clean-energy
markets. We target large, high growth, emerging clean-energy markets, including the markets for flat glass coatings and glass-based
devices, thin film and crystalline solar cells, LEDs, advanced batteries and other energy-efficient technologies. We believe we can deliver significant improvements in cost, performance and
manufacturability in these markets with our HPC platform.
- •
- Engage with existing and potential market leaders in our target
markets. We enter into CDPs with companies that are well-positioned to lead their markets. We engage with customers that
have track records of technological innovation, deploy significant resources and are pursuing advancements that are critical to their success and strategy.
- •
- Create proprietary IP with our
customers. We develop differentiated, IP-protected technologies with our customers, and we grant them rights to these
technologies and IP, primarily through royalty-bearing licenses. We structure our customer engagements so that our business interests align with their market success.
- •
- Enhance our HPC platform and multi-disciplinary
team. We continue to develop, broaden and protect our processing, characterization, data analysis and workflow capabilities. To enhance
our existing platform, we will expand our existing multi-disciplinary team by continuing to recruit personnel with broad skill sets.
- •
- Explore and develop new technologies in high-volume integrated devices. We will continue to explore and internally develop new technologies and expertise to serve future customers in our targeted markets, including, in particular, clean energy. We will focus these efforts in markets which are in the early stages of development to speed innovation, capture value and facilitate success for customers.
which demands innovation around materials science, processes, integration and device architectures.
Our Platform
HPC Workflows
We begin the development and discovery process by working with our customers to define the specific requirements a new solution should have to meet the needs of a given application. Generally, these criteria are well beyond the performance attributes of currently available solution sets. We then apply the components of our HPC platform to develop and discover solution sets that match these criteria.
Once an experiment is processed, the data sets of each experiment are stored in a secure database and analyzed for desired properties. As with processing, our clean room labs include a broad array of characterization and metrology instruments and software to evaluate different properties under a wide variety of process conditions. These properties include physical, electrical, mechanical, thermal, chemical, and optical properties. In general, we are able to design, process and characterize tens to hundreds of experiments in a single day.
To reach the point of commercialization or transfer to our customers' manufacturing process qualification, a solution set must progress through an extensive series of screening stages. Below is an
11
illustration of the screening process of the HPC platform for use in evaluating materials, unit processes, and process sequences.
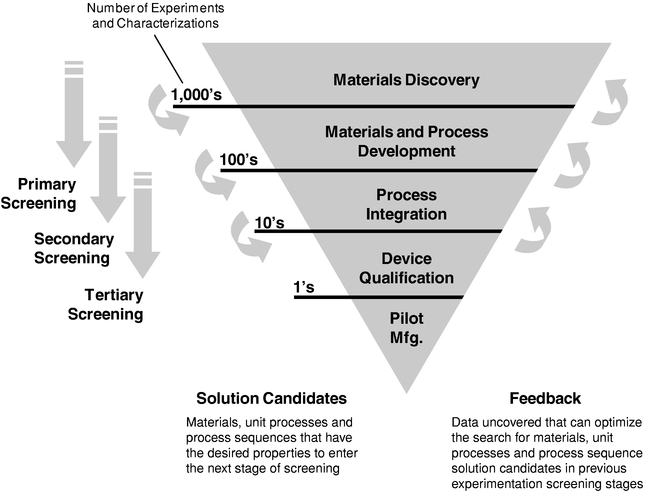
- •
- Primary Screening. Primary screening incorporates and
focuses on materials discovery. Materials are screened for certain properties to select possible candidates for a next level of screening. In the initial primary screening there may be thousands of
candidates that are subsequently reduced to hundreds of candidates.
- •
- Secondary Screening. Solution candidate materials from
primary screening are advanced to secondary screening processes that will examine materials and unit process development. In this secondary screening, processes and integration may be additionally
considered to narrow the candidates from hundreds of candidates to tens of candidates.
- •
- Tertiary Screening. Solution candidate materials and
process conditions that continue to meet or exceed the defined criteria through the secondary screening stage are then either transferred to our customer or processed internally for additional
characterization and scale up. These candidates are then characterized on a larger scale, and correlation of the desired process is developed to allow the transfer of the developed technology in a
manufacturing scale process.
- •
- Manufacturing and Commercialization. Once a candidate has passed this development scale analysis, it is ready for commercialization and the customer will decide whether to commercialize the developed technology.
Secondary screening begins while primary screening is still ongoing, and while we are still generating additional primary screening candidates. Tertiary screening begins once we have identified a
12
reasonable set of options from secondary screening, and while we are still generating additional secondary screening candidates. As these stages overlap, there may be feedback from later stages that is then incorporated back into an earlier stage to further optimize the selection of materials, unit processes and process sequences.
Wet Processing Tools
We offer a series of wet processing tools which apply HPC methods to fluids-based applications such as cleans, deposition and wet etch, self-assembly, and surface treatment processes. These tools, which can be used alone or in combination, include:
- •
- Tempus F-10. A stand-alone system used for
primary screening through the automatic creation of formulations, especially those involving powders and viscous liquids.
- •
- Tempus F-20. A stand-alone system for
materials and process screening, which is used for library creation as well as processing of wafer coupons. This product can be used for primary or secondary screening, depending on the reactor block
design and the substrate type.
- •
- Tempus F-30. A stand-alone system for integration and tertiary scale up screening, which is used to scale up the most promising results from primary and secondary screening to full-size patterned wafers (200 or 300mm).
Dry Processing Tools
In addition, we offer dry processing tools which apply HPC methods to vapor-based applications. Each of these tools can be used in primary, secondary and tertiary screening. These tools, which can be used alone or in combination, include:
- •
- Tempus P-30-HPC-Physical Vapor Deposition
(PVD). A 300mm chamber with the ability to use up to four PVD sources and three optional deposition methods (including DC, RF and pulse
DC) on a vast range of film thicknesses and/or compositions and/or film stacks within each site-isolated region of a substrate.
- •
- Tempus A-30-HPC-Atomic Layer Deposition
(ALD). A 300mm chamber capable of site isolation of both metal and dielectric films across quadrants of the wafer, with the ability to
introduce variation of film thickness and/or composition and/or film stacks within each quadrant.
- •
- Tempus AP-30. A configurable platform with multiple A-30 or P-30 chambers and common support modules to facilitate both ALD and PVD for rapid screening of thin-film metal alloys, dielectrics and multilayer stacks. Processes can be scaled to facilitate high-volume manufacturing.
Automated Characterization
Immediately after processing substrates on our Tempus HPC processing tools, we use automated and customized characterization instruments to rapidly generate physical and electrical data from the experiments. The aggregated data is automatically loaded into our informatics data warehouse. As with processing, our clean room labs include a broad array of characterization and metrology instruments and software to evaluate different properties under a wide variety of process conditions. Our characterization instruments match the throughput of our processing tools to maximize experimental learning cycles.
13
Informatics Software, Analysis and Services
Our informatics software has the ability to automate the capture, entry and storage of HPC processing and automated characterization and metrology data and then to evaluate, summarize and securely distribute in real time this data to the appropriate parties. Additionally, we use our informatics software to leverage experiments processed and characterized in the past for a customer to increase the speed and effectiveness of the engagement. The key components of our informatics software include:
- •
- Workflow management software. Manages the design and
process of experiments, metrology and collection of data and summarizes aggregated data to the various working teams in the form of status reports; provides our customers with real-time
access to results of our experiments and analysis;
- •
- Analysis and reporting software. Provides data and
analysis tools to evaluate process distributions, correlate electrical distributions, map defectivity distributions, perform spectral analysis and facilitate interactive creation of summary reporting;
- •
- Security and collaboration management software. Provides
secure communication between geographically dispersed working teams, ensures the security of created documentation and presentations, manages the minutes for meetings, provides programs and project
plans to coordinate working teams, shares summary reports across the working team and provides reviews of finished processes and status of ongoing processes; and
- •
- Integration services. Facilitate collaboration between our tools and the customer's process and metrology tools, automate the recipe loading, automate data collection and leverage software to customize reports.
Our Technology
Embedded throughout our hardware and software, our technology is based upon the parallel and/or rapid serial experimentation capabilities of combinatorial methods. High-productivity combinatorial methods generally refer to techniques that vary materials, unit processes, process, and device integration sequences across multiple regions of one or more substrates, the output of which can then be evaluated in parallel. Our informatics software and analytical methods characterize and analyze these combinations of materials, unit processes, process, and device integration sequences for the most promising solutions in a structured, automated and throughput-matched fashion. The relationship between materials, processes, integration and device output are established earlier in the development process, so that performance and manufacturability considerations are taken into account from the outset, instead of late in the R&D process.
Although our approach is unique in the semiconductor and clean-energy industries, combinatorial technology has been widely used in other industries, especially where new materials function as primary enablers of product innovation. Examples include the pharmaceutical, biotechnology, and energy sectors, where combinatorial techniques have been accelerating development since the early 1990s.
We are able to deploy and benefit from our proprietary combinatorial methods because of our multi-disciplinary team of approximately 147 scientists and engineers as of December 31, 2011, of
14
whom approximately 60 have Ph.D.s. Our team has expertise in a wide range of disciplines, fields and technologies, including the following:
Disciplines
|
Applications | Equipment (Hardware & Process) |
Devices (Processes and Integration) |
|||
|---|---|---|---|---|---|---|
| Chemistry Physics Materials science Engineering • Chemical • Electrical • Mechanical • Software • Controls • Systems |
Equipment development •
Systems engineering • Semiconductor tools • Flat panel display tools • Software Design, qualification, manufacturing • Modeling / TCAD • Development / integration • Yield management • Statistical methods • Test structures • Inspection, review & characterization • Electrical test |
Deposition • ALD • PVD • PECVD • CVD (metals/dielectrics) • ECD / electroless • CBD / curtain coating • MOCVD Lithography/Etch Wet processing Laser annealing Rapid Thermal Annealing Defect detection • CBD / curtain coating • CBD / curtain coating contrast |
Process, equipment, integration • DRAM / Non-Volatile Memory • Microprocessors • Solar cells (CIGS, thin film Si,
cSi) • Low e glass
coatings • LED • Flash • Emerging Memories Process technologies • Selenization / absorber formation • Shallow trench isolation gapfill • High-k / metal gate • Contact & advanced silicide • Advanced Cu—interconnect (Cu,
Al) • Advanced packaging • Nitride Epitaxy • Transparent Conductive Oxide • Oxidation • Nitridation • Rapid Thermal Processing DRAM Flash Emerging Memories |
Our Collaborative Development Programs
Our CDPs allow our customers to collaborate with our multi-disciplinary team on specific technical problems. We establish processes and procedures to protect our customers' confidential information during these CDPs. Our CDP work is primarily carried out at our facility in close collaboration with our customers. In addition, we support device qualification for pilot manufacturing at our customers' manufacturing and development sites. Customer teams and our teams collaborate on development of new materials, unit processes, process modules and integration sequences, and qualify the supply chain for high-volume manufacturing. Our multi-disciplinary team can rapidly adapt our Tempus HPC platform to meet customer requirements and develop and optimize device and product technologies to ensure success with customer programs.
We typically initiate new customer engagements with smaller, customer-paid programs called micro-CDPs. Our micro-CDPs precede the full CDP. These are smaller programs that require significantly less investment from our team but allow us to demonstrate the capabilities of our HPC platform to a customer without requiring a customer to commit to a multi-year agreement. We use
15
these micro-CDPs to demonstrate the capabilities and value of our HPC platform to these new customers, with the objective of engaging with these customers in a full CDP.
Our CDPs are designed to result in the development of proprietary technology and IP for new devices, manufacturing process technology and materials, which we license to our customers for use in volume production. We provide our customers with proprietary technology through various fee arrangements and grant them rights to associated IP primarily through royalty-bearing licenses.
In the early stages of developing our business, we structured engagements with customers to allow us to continue to grow while also giving customers an opportunity to invest in our business and success. We do not expect to continue to provide our customers and partners with opportunities to invest in our company in the future, independent of their ability to do so in the open market.
Our Customers
Our customers include semiconductor device, semiconductor materials and equipment and clean-energy market leaders, including ATMI, Elpida, GLOBALFOUNDRIES, Guardian, SanDisk, Toshiba and TSMC. Typically, our customers engage in CDPs with our team leveraging our HPC platform to develop and commercialize high-volume integrated devices using collaboratively developed technology. To date, ATMI and Elpida have already successfully developed products through their CDPs and we have granted them rights to the associated technology and IP rights through royalty-bearing licenses. Successes in our initial CDPs have led to expanded relationships and follow-on programs with existing customers for new products and applications.
The majority of our revenue in 2011 comes from ATMI, Elpida, GLOBALFOUNDRIES, SanDisk and Toshiba, which represented a combined 83% of our total revenue during the year ended December 31, 2011, compared with 72% and 88% of our revenue coming from two customers, ATMI and Eplida, during the years ended December 31, 2010 and 2009, respectively. We believe that the revenue concentration associated with these customers will likely decline as our other customers begin to transition technology developed through CDPs into licensing and royalty revenue and as we continue to enter into new CDPs with new and existing customers in the semiconductor and clean-energy markets. In addition, revenue from Elpida may decline as a result of Elpida's February 2012 filing for protection under the Corporate Reorganization Act in Japan. For example, as part of any restructuring under this Act our CDP services may be reduced or even eliminated, and Elpida may either voluntarily or involuntarily reduce or eliminate payments owed to us or shipments of products that include our licensed technology.
Intellectual Property
Our success depends in large part on our IP. We have patented and continue to seek patent protection for combinatorial methods and systems included in our HPC platform. We have also patented and continue to seek patent protection of innovations that result from applying our HPC platform to design, develop and manufacture ICs, solar cells, glass coatings and glass-based devices, LEDs and thin films for electronics, optical and energy applications (Fields). As of December 31, 2011, we owned 404 U.S. patents and patent applications (some of which also have foreign counterparts), of which 224 are related to the HPC platform and 180 are related to innovations in the Fields. We also have a license to approximately 326 U.S. patents and patent applications granted to us by Symyx Technologies, Inc. (Symyx), a wholly-owned subsidiary of Accelrys, Inc., that exclusively provides us the right to use combinatorial methods and systems in the Fields.
As of December 31, 2011, we owned 75 patents and 149 patent applications related to our HPC platform in the United States, and 38 patents and 49 patent applications in other jurisdictions. The expiration dates of these patent rights range from October 2014 to December 2031. We continue to file patent applications to seek protection for further advancements of our HPC platform. We own all
16
rights to such patents and generally do not grant licenses to third parties under these patents other than in connection with the use of our HPC platform. Our patents and patent applications cover the following aspects of the HPC platform:
- •
- Combinatorial systems and methods related to fluids-based processing;
- •
- Combinatorial systems and methods related to vacuum-based processes, including deposition and etch;
- •
- Systems and methods for site-isolated processing;
- •
- Combinatorial systems and methods related to high-volume manufacturing; and
- •
- Processing techniques using combinatorial and non-combinatorial methods.
We also have and seek patent protection for innovations developed using our HPC Platform (applications IP). Such innovations cover advancements in new materials, processes, process conditions, process sequences and device architectures in applications such as semiconductor memory, semiconductor complex logic, glass coatings and glass-based devices, solar cells and LEDs. As of December 31, 2011, we owned 28 patents and 152 patent applications in the U.S. covering applications IP, as well as 1 patent and 27 patent applications in other countries. We may develop applications IP either on our own or in collaboration with our customers through CDPs.
In most cases, we maintain an ownership interest in the applications IP that results from CDPs and we grant licenses under this applications IP to the CDP customer. Such licenses generally allow the CDP customer to have exclusivity for a limited term in a particular field. We keep the right to grant licenses under the CDP patents outside that field. Furthermore, if the CDP customer elects to not extend the term of exclusivity beyond the limited term, we have the right to grant licenses to third parties within the field. If required we assign separate teams for each CDP, maintain separate databases of experimental data and limit access to such databases only to the specific team that assists the CDP customer.
We may also develop applications IP internally where we believe such IP may have broad applicability in the relevant market. We are able to leverage this IP to begin CDPs with new customers. In addition, our ability to own the applications IP in these situations allows us to leverage learning and patent protection across industries and applications while providing our existing customers with the IP rights they desire to gain competitive advantage in their fields for the markets they serve.
Sales and Marketing
We sell and market our solutions worldwide through our own sales force by developing direct relationships with our customers. We have sales personnel located in Japan, Taiwan, Europe and the United States, including account managers, who are responsible for specific customer accounts, and product marketing personnel, who provide business development support and application and workflow platform expertise. We often base customer support personnel at or near the offices of our major customers to improve our level of service and expand our sales.
Our business development and product marketing group focuses on our strategy, platform and technology roadmap, new platform introduction process, demand assessment and competitive analysis. The group coordinates new application evaluation and development both internally with our engineering teams and externally with new and existing customers. We intend to increase our sales and marketing efforts and further expand our business development and product marketing organization.
17
Manufacturing
We manufacture our HPC tools through partnerships with experienced contract manufacturers that manufacture and assemble sub assemblies incorporating our designs. We believe that our third party manufacturers have adequate sources and supplies of the raw materials needed to manufacture our products. We believe that partnering with contract manufacturers provides us with access to the most current facilities and processes without significant capital outlay on our part, allowing us to focus our resources on R&D, product design and collaboration program support. Although we have historically relied on a small number of contract manufacturers for the manufacture and assembly of a majority of our workflow platforms, we have relationships with a variety of contract manufacturers and are not dependent on any single contract manufacturer.
Research and Development
We conduct R&D activities for CDPs and for internal research and development on both workflow platform development and application R&D. As of December 31, 2011, we employed a research and development team of 178 full-time employees. This R&D team includes many experienced semiconductor engineers with advanced degrees from leading universities around the world and managers with experience from leading chip manufacturers, solar PV companies and equipment suppliers. We believe these R&D professionals on our team have enabled us to develop our HPC platform, support customer CDPs, implement our technology roadmap rapidly and provide us with the foundation for our technology advancement in the future.
Our customer-sponsored R&D expenses included in cost of revenue were $23.8 million in 2011, $16.9 million in 2010 and $8.8 million in 2009, which represented approximately 44%, 40% and 33%, respectively, of our revenue in those years.
We devote a substantial portion of our resources to engineering next generation platforms by integrating future generations of technology and developing a standardized software and informatics platform. We work closely with multiple vendors during the development of new workflows or workflow modifications for use in our future platforms. We work with our software and component vendors to establish integration standards. To that end, we are developing scalable software architectures that will allow us to integrate new processes requested by our customers to further expand the opportunities with new and existing customers, accelerate time-to-market, and allow our workflow platforms to operate with adjacent vertical technologies such as clean-energy markets. Our internal R&D expenses were $19.3 million, $13.9 million and $11.0 million for the fiscal years ended December 31, 2011, 2010 and 2009, respectively, which represented approximately 36%, 33% and 41%, respectively, of our revenue in those years.
Competition
The principal capabilities required to be competitive in our market include technical expertise, processes and integration capabilities, diversity of platform offerings, development speed and performance, quality and reliability of field engineers, depth of collaboration with customers and technical support. We believe we compete favorably with respect to these factors because of the breadth of capabilities of our HPC platform, the depth of multi-disciplinary expertise of our internal research team and external engineering teams who collaborate with customers and our use of combinatorial processing and throughput matched characterization and analysis. These differentiating factors allow us to explore more comprehensive solution sets and provide faster solutions to our customers. We are not aware of any companies that currently compete or have to date competed with us in the use of combinatorial methods in research and development applications; however, we do believe that we compete for the R&D resources of our customers with equipment suppliers, industry consortia, alliance partnership, university research and third-party IP licensing. In addition, many of our
18
customers design, develop, manufacture and market solutions based on their own unique device architectures and develop their own intellectual property in-house.
A portion of our revenue is generated from the sales of end products by our customers, and our competitive position therefore is dependent on their competitive positions. The markets for our customers' products that incorporate technology developed through our CDPs are intensely competitive and characterized by rapid technological change. These changes result in frequent product introductions, short product development cycles and increased product capabilities typically representing significant price and performance improvements.
Environmental Regulation
We are subject to various foreign, federal, state and local environmental laws and regulations governing, among other matters, emissions and discharges of hazardous materials into the air and water, the use, generation, storage, handling, transportation and disposal of, and exposure to, hazardous materials and wastes, remediation of contamination and employee health and safety. In addition, under certain of these environmental laws, liability can be joint and several and without regard to comparative fault. Our operations involve the use of hazardous materials and produce hazardous waste, and we could become liable for any injury or contamination that could arise due to such use or disposal of these materials. Failure to comply with environmental laws and regulations or to obtain or maintain required environmental permits could result in the imposition of substantial civil and criminal fines and sanctions, could require operational changes or limits or the installation of costly equipment or otherwise lead to third party claims. Future environmental laws and regulations, stricter enforcement of existing laws and regulations, or the discovery of previously unknown contamination or violations of such laws and regulations could require us to incur costs, or become the basis for new or increased liabilities or subject us to fines or other sanctions.
Employees
As of December 31, 2011, we had a total of 212 full-time employees, consisting of 178 people engaged in CDPs and R&D activities and 34 people in sales and marketing, legal and general and administrative roles. None of our employees are represented by a labor union, and we consider our employee relations to be good.
Our CDPs are labor-intensive, and as we engage in additional CDPs, we will need to hire enough highly-skilled engineers and other technical staff to support the CDPs. We evaluate our hiring needs on a project by project basis, taking into account current and anticipated CDP timelines and lifecycles. We believe our location in San Jose, California provides us with access to a large population of highly-skilled engineers who will be able to meet the technical requirements of our new CDPs.
Initial Public Offering
On November 23, 2011, we closed our sale of 5,681,796 shares of common stock as part of our initial public offering at an offering price of $10.00 per share, resulting in net proceeds to us of approximately $47.8 million, after deducting underwriting discounts, commissions and offering expenses paid or reimbursed by us, which includes a $1.4 million reimbursement paid to Symyx in connection with the Symyx asset purchase transaction. For further information regarding our initial public offering, see "Item 5. Market for Registrant's Common Equity, Related Stockholder Matters and Issuer Repurchase of Equity Securities—Use of Proceeds from Registered Securities."
19
Financial Information about Segments and Geographic Areas
We derive a significant portion of our revenue from customers in foreign countries, particularly those based in Japan. Revenue generated from customers in Japan accounted for 28%, 29% and 30% of total revenue for the years ended December 31, 2011, 2010 and 2009, respectively. We expect that a significant portion of our total future revenue will continue to be derived from companies based in Japan and other foreign countries.
For geographic information, see Note 12 to our consolidated financial statements included in this Annual Report on Form 10-K. We report as a single reporting segment.
Customer and Collaborative Agreements
The descriptions below contain only a summary of the material terms of the agreements as of December 31, 2011 and do not purport to be complete. These descriptions are qualified in their entirety by reference to the respective agreements.
Collaborative Development Program Agreement with GLOBALFOUNDRIES (GF)
In June 2011, we entered into a CDP agreement with GF to develop and improve certain semiconductor products.
Under the agreement, we will provide development services to GF and grant GF non-exclusive use of our proprietary HPC platform (which includes a subscription to the platform and a license to the associated software) for the purpose of developing and improving certain semiconductor products.
Each party will own the rights arising out of the CDP created by its inventors ("GF CDP IP"). We agreed that we would not grant a license under our rights in the GF CDP IP to any third party outside a certain field without the prior written consent of GF.
GF has agreed to pay us (i) royalties on sales of products that incorporate the GF CDP IP, (ii) fees for providing development services to GF, (iii) subscription and license fees for use of the HPC platform, and (iv) certain pre-approved expenses and material costs. GF may grant sublicenses to use the GF CDP IP to third parties, but must share with us the royalties it receives from certain third party sublicenses. We also granted GF an option to purchase certain HPC processing tools.
We are required to supply a certain number of full-time employees or contractors dedicated to supporting the development activities under the CDP.
The initial period for development activities and use of the HPC platform is three years, and will automatically renew for additional one-year periods unless either party elects to terminate. The initial term of the agreement is five years from the date of the last sale of a product that incorporates GF CDP IP.
Collaborative Development Program Agreement with Toshiba and SanDisk
In March 2010, we entered into a CDP agreement with Toshiba and SanDisk to develop certain memory technologies and related materials.
Under the agreement, we will provide development services to Toshiba and SanDisk and grant Toshiba and SanDisk non-exclusive use of our proprietary HPC platform (which includes a subscription to the platform and a license to the associated software).
Toshiba and SanDisk will own the rights to the technology and IP arising out of the CDP that is based on Toshiba or SanDisk background technology or that is solely developed by Toshiba or SanDisk. We will own the rights to the technology and IP arising out of the CDP that is solely developed by us and that is based on our background technology. Jointly developed technology and IP arising out of the
20
CDP that is based on our background technology will be jointly owned. Patent rights based on technology solely developed by us that is based on Toshiba or SanDisk background technology will be jointly owned.
We granted Toshiba and SanDisk an exclusive license under our rights in the technology and IP arising out of the CDP (Toshiba-SanDisk CDP IP) during the term of the CDP. After the conclusion of the CDP term, Toshiba and SanDisk each shall have the option (i) to continue to maintain an exclusive license to certain or all of the Toshiba-SanDisk CDP IP, (ii) to convert the exclusive license to non-exclusive, or (iii) to terminate the exclusive license.
Toshiba and SanDisk have agreed to pay us (i) volume-based royalties on sales of products that incorporate the Toshiba-SanDisk CDP IP subject to certain minimum and maximum levels, (ii) fees for providing development services to Toshiba and SanDisk, (iii) subscription and license fees for use of the HPC platform, and (iv) certain pre-approved expenses and material costs. Toshiba or SanDisk may request that we grant to other third parties a royalty-bearing license to the Toshiba-SanDisk CDP IP.
The initial period for the development activities is two years, and may be extended for up to two additional one-year periods. The obligations of Toshiba and SanDisk to pay royalties under the licenses granted by us shall continue for the duration of such licenses.
Advanced Memory Development Program Agreement with Elpida Memory, Inc. (Elpida)
In May 2008, we entered into an Advanced Memory Development Program Agreement with Elpida relating to a CDP to develop and improve certain advanced memory products. The Elpida agreement was supplemented and/or amended in August 2008, January 2009, May 2009 and July 2010.
Under the agreement, we will provide development services to Elpida and grant Elpida non-exclusive use of our proprietary HPC platform (which includes a subscription to the platform and a license to the associated software) for the purpose of developing and improving certain advanced memory products.
We own the rights for certain technology and IP arising out of the CDP (our CDP IP). Elpida owns the rights for certain other technology and IP arising out of the CDP (Elpida CDP IP). All other technology and IP arising out of the CDP will be jointly owned by Elpida and us (joint CDP IP). We have also granted Elpida an exclusive license to use our CDP IP and the joint CDP IP in certain fields during the term of the agreement.
Elpida has agreed to pay us (i) royalties on sales of products that incorporate our technology, our CDP IP, Elpida CDP IP or joint CDP IP subject to certain minimum and maximum levels; (ii) fees for providing development services to Elpida, (iii) subscription and license fees for use of the HPC platform, and (iv) certain pre-approved expenses and material costs.
The current period for development activities and use of the HPC platform is through April 1, 2013, after which the exclusive license converts to a non-exclusive license unless Elpida meets certain minimum quarterly sales thresholds from high-volume manufacturing of royalty-bearing products. In addition, as part of any restructuring of Elpida under the Corporate Reorganization Act in Japan, our development period may terminate sooner and the exclusive license may be converted to a non-exclusive license. Elpida's obligation to pay royalties under the licenses granted by us shall continue for the duration of such licenses.
ATMI Engagement
In November 2006, we entered into an alliance agreement with ATMI to develop advanced materials for semiconductor products under one or more individual CDPs as agreed between the parties from time to time. Each CDP would provide payments from ATMI to us (i) for providing
21
development services to ATMI, (ii) for subscription and license fees for use of the HPC platform, and (iii) for certain pre-approved expenses and material costs. ATMI owns any technology and IP that it independently creates during the alliance agreement. We own the technology and IP we independently create. Unless modified by the terms of a CDP, we also own the Alliance Technology arising out of the CDP and the HPC technology. The initial term of the alliance activities is ten years.
The parties have had one CDP under the alliance agreement. Under that CDP, ATMI owns any technology and IP that it independently creates during the alliance agreement, as well as any materials manufacturing technology and associated IP rights that are created during the course of the alliance agreement (the Alliance Materials Manufacturing Technology). We own the technology and IP we independently create and, other than the Alliance Materials Manufacturing Technology, any other technology and IP that is created during the course of the alliance agreement (the Alliance IP). We granted to ATMI a limited, field-restricted, exclusive license to use the Alliance IP, with the right to sublicense, and ATMI has agreed to pay us royalties or share revenues on the sales or licenses of ATMI products that incorporate the Alliance IP. We retained the right to be the sole licensor of any Alliance IP to any IC manufacturers or original equipment manufacturers.
In July 2007, we entered into a Wets Workflow Purchase Agreement with ATMI, which was extended through amendments in December 2007, December 2008, March 2009, August 2010, March 2011 and October 2011 (as amended, the ATMI Wets Workflow Agreement), pursuant to which we agreed to sell to ATMI certain HPC processing tools and license informatics software related to liquid or fluids-based materials (wets) used in semiconductor processing and manufacturing (collectively, the wets workflow). The wets workflow may only be used at certain designated sites and solely for the purpose of developing and commercializing materials, wets processing processes, products and materials manufacturing technologies in a certain field. ATMI is obligated to pay us royalties on products that incorporate any material identified, first synthesized, or discovered through use of any wets workflow (the ATMI products). During the term of the agreement, we have agreed not to enter into any joint marketing, sales or development agreements in certain fields with certain competitors of ATMI. During the term of the agreement and subject to economic terms, we also agreed not to ship certain elements of the wets workflow and certain other proprietary HPC processing tools to certain ATMI competitors for use in certain defined fields. We have agreed to evaluate ATMI materials for CDPs between us and integrated device manufacturers for an IC or solar application. We have agreed to recommend ATMI materials to our customers in these CDPs, provided that the ATMI materials are timely available, meet our customer's requirements and are cost competitive. If we identify an opportunity for ATMI and us to work in a joint development program or if ATMI introduces us to such an opportunity with an integrated device manufacturer, we and ATMI will enter into good faith negotiations to agree on an economic arrangement, unless ATMI does not have HPC-related resources available to contribute to such an opportunity. In addition, we agreed to introduce one of ATMI's workflows to one of our other customers in exchange for ATMI committing to providing its support to such customer. We are required to supply a certain number of full-time employees or contractors dedicated to supporting ATMI's use of the wets workflow. The agreement will continue in effect as long as any license granted under any applicable purchase order under the agreement remains in effect, which will be at least through December 15, 2014.
In December 2008, we entered into a Dry Workflow Purchase Agreement with ATMI, which was extended thru amendments in August 2010, March 2011 and October 2011 (as amended, the ATMI Dry Workflow Agreement), pursuant to which we agreed to sell to ATMI certain HPC processing tools and license informatics software related to vapor-based applications (dry) used in semiconductor processing and manufacturing (collectively, the dry workflow). For sales of compounds or materials (or composition of compounds or materials) identified, first synthesized, or discovered in whole or in part through the use of the dry workflow, and any derivative thereof (the ATMI dry products), ATMI would pay us a royalty on these ATMI dry products. We are required to supply a certain number of full-time
22
employees or contractors dedicated to supporting ATMI's use of the dry workflow. In addition, we will provide support from October 2011 to August 2012 to a customer of ATMI who will be utilizing the dry workflow ATMI purchased from us. The agreement will continue in effect as long as any license granted under any applicable purchase order under the agreement remains in effect, which will be at least through December 31, 2013.
Symyx Asset Purchase
In March 2005, we entered into a Collaborative Development and License Agreement with Symyx Technologies, Inc. (Symyx). In addition, in December 2005, we entered into an Alliance Agreement (Symyx Alliance Agreement) with Symyx, and we amended the Symyx Alliance Agreement in August 2006, June 2007, August 2007, November 2007 and September 2009. Under the Symyx agreements, Symyx granted us, and we agreed to pay Symyx royalties for, a license to certain high-throughput combinatorial patents held or licensed by them and related software to design, develop and manufacture integrated circuits, photovoltaic cells, glass coatings, light emitting diodes, organic light-emitting diodes and thin films for electronics, optical and energy applications. During the years ended December 31, 2011, 2010 and 2009, we recorded $2.1 million, $2.0 million and $1.2 million in cost of revenue, respectively, and had accrued liabilities due to Symyx of $517,000, $795,000 and $502,000 as of December 31, 2011, 2010 and 2009, respectively.
On July 28, 2011, we entered into an agreement with Symyx, pursuant to which we agreed to use commercially reasonable efforts to allow Symyx to sell in the initial public offering of our common stock a total of 3,968,204 shares of common stock held by them, and Symyx agreed to sell such shares in the offering, transfer to us all the patents held by them that relate to combinatorial processing and terminate our future royalty obligations under the Symyx agreements to the extent they would have accrued after December 31, 2011. We completed this asset purchase in connection with the closing of our initial public offering in November 2011. In connection with this transaction, we also issued Symyx a secured promissory note in a principal amount equal to $27.3 million with a term of 24 months and an interest rate equal to 4%. The note is payable in an amount equal to the greater of $500,000 per quarter or the amount of accrued interest, with a balloon payment at maturity, if applicable. The note is also pre-payable by us at any time without penalty or premium, and is secured by tangible personal property, excluding intellectual property. In addition, we reimbursed Symyx for 50% of the underwriting discounts and commissions payable by them in connection with the sale of their common stock in the offering, which amount was equal to approximately $1.4 million.
Corporate and Available Information
We were originally incorporated as The BEP Group, Inc. in Delaware in June 2004. In November 2004, we changed our name to Intermolecular, Inc. We are headquartered in San Jose, California.
Our internet address is www.intermolecular.com. Information included on our website is not part of this Form 10-K. We make available free of charge on our website our annual reports on Form 10-K, quarterly reports on Form 10-Q, current reports on Form 8-K, and all amendments to those reports as soon as reasonably practicable after such material is electronically filed with or furnished to the SEC. In addition, copies of our annual reports are available free of charge upon written request. The SEC also maintains an Internet site that contains reports, proxy and information statements, and other information regarding issuers that file electronically with the SEC. The address of that site is www.sec.gov.
23
You should carefully consider the risks described below together with the other information set forth in this Annual Report on Form 10-K, which could materially affect our business, financial condition or future results. The risks described below are not the only risks facing our company. Risks and uncertainties not currently known to us or that we currently deem to be immaterial also may materially adversely affect our business, financial condition and/or operating results.
Risks Related to Our Financial Condition and Business
We have a limited operating history, which makes it difficult for investors to evaluate our current business and future prospects.
We were incorporated in June 2004 and do not have a long history of operating results on which you can base your evaluation of our business. We are still proving our business model, and we have not yet demonstrated our ability to generate significant revenue, particularly licensing and royalty revenue. As a result, it may be difficult for analysts and investors to evaluate our future prospects. If we do not generate significant licensing and royalty revenue, we may never be profitable. Furthermore, because of our limited operating history and because the semiconductor and clean-energy industries are rapidly evolving, we have limited experience in analyzing and understanding the trends that may emerge and affect our business. If we are unable to obtain significant licensing and royalty revenue from products that incorporate technology developed through our collaborative development programs (CDPs), we will have expended a significant amount of time and resources without obtaining the benefits we anticipated, and our financial condition and results of operations would be materially and adversely affected.
Our operating results may fluctuate from quarter to quarter, which may make it difficult to predict our future performance and may result in volatility in the market price of our common stock if we fail to meet the expectations of public market analysts and investors in these periods.
Our revenue, expenses and operating results have fluctuated, and may in the future fluctuate significantly from quarter to quarter due to a number of factors, many of which are outside our control. Factors that may contribute to these fluctuations include the following, as well as other factors described elsewhere in this annual report on Form 10-K:
- •
- our dependence on a limited number of customers;
- •
- our ability to manage our growth, including an increasing number of employees, customers and CDPs;
- •
- the length of our sales and development cycles, and our ability to generate material revenue after we have devoted
significant resources to developing a project;
- •
- our ability to evolve existing products, anticipate trends in technology development and introduce new developments in a
timely manner in the rapidly changing semiconductor and clean-energy industries;
- •
- our customers' ability to manufacture, market and sell products that incorporate technology developed through the CDPs, or
the financial stability of any of our customers;
- •
- fluctuations in the number and price of products sold by our customers that incorporate technology developed through the
CDPs, and the shortening life cycles of those products, in each case impacting our licensing and royalty revenue;
- •
- our ability to scale our development efforts, our ability to secure new CDPs with new or existing customers and the timing of those CDPs;
24
- •
- the degree to which existing CDPs are completed or expanded;
- •
- one-time, non-cash charges to revenue associated with the vesting of contingent warrants issued to
two of our customers that are currently outstanding;
- •
- our ability to maintain existing commercial terms or enter into new licensing arrangements with our customers once they
begin to sell their end products;
- •
- our ability to make the substantial research and development (R&D) investments required to stay competitive in our
business;
- •
- our ability to develop our high productivity combinatorial (HPC) platform and expertise to support our future growth plans
in adjacent vertical markets such as clean-energy markets;
- •
- any potential involvement in intellectual property litigation;
- •
- any potential payments to our customers resulting from our intellectual property indemnification policies and obligations;
- •
- our reliance on our customers to deliver timely and accurate information to accurately report our financial results from
licensing and royalty revenue;
- •
- our potential need for additional capital to finance our business;
- •
- any delay in shipments caused by shortages of components incorporated in our customers' products, design errors or other
manufacturing problems associated with our customers' products;
- •
- the highly cyclical nature of and price volatility in the semiconductor industry;
- •
- the emerging and uncertain nature of the clean-energy industry;
- •
- potential warranty claims, product recalls and product liability for our HPC tools and for our customers' products that
incorporate technology developed through our CDPs;
- •
- global or regional economic, political and social conditions; and
- •
- business interruptions such as earthquakes and other natural disasters.
Due to these factors and other risks discussed in this section, you should not rely on quarter-to-quarter comparisons to predict our future performance. Our revenue mix may also vary from quarter to quarter as we enter into new CDPs and related customer arrangements, existing CDPs are completed or expanded and licensing and royalty arrangements take effect. Unfavorable changes in any of these factors may adversely affect our business and operating results. Additionally, our common stock could be subject to significant price volatility should our actual or projected revenue or earnings fail to meet the expectations of the investment community. Furthermore, stocks of high technology companies are subject to extreme price and volume fluctuations that are often unrelated or disproportionate to the operating performance of those companies.
We have incurred operating losses since our inception and may not be able to achieve or maintain profitability.
We have generated net losses each year since our inception, including $30.0 million, $1.8 million and $5.3 million for the years ended December 31, 2011, 2010 and 2009, respectively. Our accumulated deficit as of December 31, 2011 was $100.5 million. We will need to significantly increase revenue to achieve profitability and we may not achieve or subsequently maintain profitability if our revenue increases more slowly than we expect or not at all.
25
Our ability to achieve our objectives and achieve or maintain the profitability of our business will depend, in large part, on potential customers accepting our HPC platform and methodology as effective tools in the development of new products; and on our success in helping our customers develop products that are successful in the marketplace. Historically, semiconductor companies have conducted R&D activities internally using traditional research methods. In order for us to achieve our business objectives, we must convince these companies that our technology and capabilities justify collaborating with us on their basic R&D programs. We must also convince potential customers in the clean-energy industry that our HPC platform and approach are useful tools in an emerging industry. We cannot assure you we will achieve the levels of customer acceptance necessary for us to maintain and grow a profitable business. In addition, our profitability and success are dependent, in part, upon the receipt of royalties on the sale of products by our key customers, and we have no ability to control the timing of such products' introduction or their success or failure in the marketplace. Our ability to achieve profitability also depends upon many other factors, including many that are beyond our control. These factors include, without limitation:
- •
- changes in the demand for our products and services;
- •
- the introduction of competitive technologies;
- •
- our ability to engage with new customers that would use our technology and expertise to further develop and commercialize
their products;
- •
- our ability to enter into CDPs with customers who are or become market leaders;
- •
- the competitiveness and financial strength of our existing and potential customers;
- •
- changes in the R&D budgets of our customers and potential customers;
- •
- our ability to develop our technology for and secure customers in the clean-energy industry; and
- •
- our participation in the development of products that our customers choose to commercialize that generate a substantial stream of licensing and royalty revenue for us.
In addition, we expect to continue to incur significant expenses or revenue adjustments in connection with, among other things:
- •
- increased R&D spending, including expansion of our R&D teams and workflow platforms;
- •
- expansion of our sales and marketing efforts;
- •
- additional non-cash charges relating to amortization of intangibles and deferred stock compensation; and
- •
- one-time, non-cash charges to revenue associated with the vesting of contingent warrants issued to two of our customers that are currently outstanding.
We cannot assure you we will achieve the levels of customer acceptance necessary for us to maintain and grow a profitable business, or that any of these other factors will be satisfactory. Also, we cannot assure you that customers, even those that accept our HPC platform as a valid tool for R&D, will be satisfied with the integrated devices developed through our CDPs or will be able to successfully commercialize end products incorporating the developed technology. Failure to achieve the necessary customer acceptance or extend or add current or new customer relationships, as well as difficulty with any of these other factors would adversely affect our revenue and profitability and our financial condition and results of operations would be materially and adversely affected.
26
We depend on a limited number of customers, which have historically been in the semiconductor industry, and a loss of any of them would adversely affect our business and operating results.
Our customer base is highly concentrated. Revenue has historically come from a few customers, and we expect that revenue from a small number of customers will continue to account for a high percentage of our revenue for the foreseeable future. Due to the concentrated nature of manufacturers in the DRAM, flash memory and complex logic markets, our revenue is and may continue to be concentrated among and reliant upon key high-volume customers. For example, our five largest customers in the year ended December 31, 2011, all of which are in the semiconductor industry, accounted for 83% of our revenue, and our two largest customers for the years ended December 31, 2011 and 2010, both of which are in the semiconductor industry, accounted for 47% and 72% of our revenue, respectively. Our largest customer accounted for 29% and 52% of our revenue in each of these periods, respectively. The loss of any of these customers or a decrease in the manufacturing or sales volumes of their products, or their failure to pay amounts due to us or renew or extend their existing relationships with us, and the related impact on our future anticipated licensing and royalty revenue, would materially and adversely affect our business, financial condition or results of operations, and we may not be able to replace the business from these customers. In particular, Elpida recently filed for protection under the Corporate Reorganization Act in Japan, and our revenue from Elpida may decline as a result. For example, as part of any restructuring under this Act, our CDP services revenue may be reduced or even eliminated, and Elpida may either voluntarily or involuntarily reduce or eliminate payments owed to us or shipments of products that include our licensed technology. The use of our technology in their current product shipments generates a license fee for us, and may include a royalty when additional developed technology is incorporated in future Elpida products. Any adjustment in the amount of CDP services fees, license fees or royalties that Elpida would owe us pursuant to our agreement with them could be reduced or eliminated as a result of the restructuring or changes in their shipments and product development. If any of these were to occur our revenue would decline, and our financial condition and results of operations would be materially and adversely affected. During the year ended December 31, 2011 we recognized $9.9 million in revenue from Elpida and as of December 31, 2011 had outstanding accounts receivable in the amount of $0.2 million and backlog in the amount of $17.8 million, of which $8.8 million is to be recognized during 2012 with the balance to be recognized in periods beyond 2012. In addition, this type of loss could cause significant fluctuations in our results of operations because our expenses are fixed in the short term and our sales and development cycle to obtain new customers is long.
Our rapid growth has presented significant challenges to our management and administrative systems and resources, and we may experience difficulties managing our growth, which could adversely affect our business and operating results.
We will need to continue to grow in all operational areas and to successfully integrate and support our existing and new employees, which may make it difficult to implement our business strategy in the time frame we anticipate, if at all. Our business has grown rapidly, and we expect this growth to continue as we expand our R&D capacity for current and additional CDPs. For example, we had 212 full-time employees as of December 31, 2011 and 107 employees at the end of 2008. The rapid expansion of our business and addition of new personnel has placed a strain on our management, operational systems and facilities and may continue to do so. To effectively manage our operations and growth as well as our obligations as a public company, we must continue to expend funds to enhance our operational, financial and management controls, reporting systems and procedures and to attract and retain sufficient numbers of talented employees. If we are unable to expand our R&D capacity and implement improvements to our control systems efficiently and quickly, or if we encounter deficiencies
27
in existing systems and controls, then we will not be able to successfully grow our business as planned. Our future operating results will also depend on our management's ability to:
- •
- implement and improve our sales, marketing and customer support programs and our R&D efforts;
- •
- enhance our operational and financial control systems;
- •
- expand, train and manage our employee base;
- •
- integrate any acquired businesses; and
- •
- effectively address new issues related to our growth as they arise.
We may not manage our expansion successfully, which could adversely affect our business, financial condition or results of operations.
Our business prospects and future growth depend on royalties, which may be difficult to structure and enforce.
We believe that our royalty-bearing licenses with our customers lay the framework for ongoing royalty revenue from our customers' products that incorporate technology developed through our CDPs with these customers, and that this revenue stream will increase as revenue from products developed using our platform increases. We are dependent upon our ability to structure, negotiate and enforce agreements for the determination and payment of royalties. Unless we adequately demonstrate the value of our platform to our potential customers we may face resistance to structuring royalty arrangements in the future that are acceptable to us, or our customers may not agree to enter into royalty-bearing licenses with us at all. If we are unable to maintain the royalty-bearing license aspect of our business model, our operating results would suffer and we may not achieve profitability.
Our sales cycles are long, and we commit significant resources to a project before we have any commitment that a potential customer may agree to use our platform or service. One or more failures to enter into a CDP after we have devoted significant resources to a project could adversely affect our business and operating results.
Our sales efforts require us to educate our potential customers about the benefits of our solutions, which often requires significant time and expense, including a significant amount of our senior management's time and effort. Our sales cycles to date have typically ranged from 9 to 24 months and may be even longer in the future. Furthermore, we need to target those individuals within a customer's organization who have overall responsibility for the profitability of their products. These individuals tend to be senior management or executive officers. We may face difficulty identifying and establishing contact with these individuals. In addition, our customers' technology and product pipeline are highly confidential and they may choose to withhold certain information from us during the sales cycle to protect their own proprietary technology. Our ability to implement our HPC platform and methodology is heavily dependent upon the information provided to us by our customers. If our customers reveal the complexities of their specifications after we enter into a CDP with them, that complexity may cause delays unanticipated at the time we entered into the program. During our sales cycles, we incur significant expenses and, in many cases, may begin to build, configure or expand new systems, develop software and design workflows to meet our customers' requirements prior to obtaining contractual commitments, without any assurance of resulting revenue. Where a potential customer engagement requires a new dedicated HPC platform, we may invest in new HPC capacity ahead of a customer commitment. Our HPC platform build, configuration and customization cycles to date have ranged from three to nine months and may be even longer in the future. Investment of time and expense in a particular customer engagement that does not ultimately result in material revenue will adversely affect
28
our revenue and results of operations. Other factors impacting sales and the length of our sales and development cycles include, but are not limited to, the following:
- •
- the complexity and cost of our HPC platform and difficulties we may encounter in meeting individual customer
specifications and commitments;
- •
- our ability to build, configure or expand new systems, develop software and design workflows to meet our customers'
requirements;
- •
- the limited number of customers that are appropriate sales targets for our platform and that are willing to enter into
licensing agreements with us;
- •
- our customers' budgetary constraints and internal review procedures that must be completed to begin collaboration with us;
and
- •
- the cultural transition required for a customer's internal R&D team to embrace us as a collaborative partner.
The semiconductor industry is rapidly changing and an inability to evolve existing products in a timely manner, anticipate trends in technology development and introduce new technologies could adversely affect our business and operating results.
We must continually devote significant engineering resources to keep up with the rapidly evolving technologies, materials and equipment used in semiconductor design and manufacturing processes. These innovations are inherently complex and require long development cycles. The semiconductor industry is subject to a number of evolving trends, including:
- •
- the growing varieties of semiconductor architecture, applications and processes;
- •
- differing market growth rates and capital requirements for different applications, such as flash memory, DRAM, logic and
foundry, and the resulting effect on customers' spending patterns and on our ability to compete in these market segments;
- •
- the importance of growing market positions in larger market segments;
- •
- the increasing consolidation of semiconductor manufacturing towards foundries and large scale manufacturers and subsequent
concentration of research and innovation in manufacturing process development; and
- •
- the cost, technical complexity and timing of a proposed industry transition from 300mm to 450mm wafers.
These and other changes could have a material impact on our business. Not only do we need the technical expertise to implement the changes necessary to keep our technologies current, but we also rely heavily on the judgment of our management and advisors to anticipate future market trends. Our customers expect us to stay ahead of the technology curve in their sectors and expect that the technology developed through our CDPs will help them develop new products that keep pace with or push the limits of technological innovation. If we are not able to accurately predict industry changes, or if we are unable to apply our HPC platform to our customers' needs on a timely basis, our existing solutions will be rendered obsolete and we may lose customers. If we do not keep pace with technology, our existing and potential customers may choose to develop their own solutions internally as an alternative to ours, and we could lose market share to competitors, which could adversely affect our operating results.
29
The clean-energy industry is in a very early stage of development, and we may not earn significant revenue from our initiatives in this industry for an extended period, if ever.
Most sectors of the clean-energy industry are in the very early stages of development. Many of the associated technologies have not yet achieved commercial viability in comparison to available alternatives, and may never achieve market adoption. Many of the associated technologies will require substantial investments of capital to achieve scale, which may not be available on attractive terms, if at all. Companies within the clean-energy industry may also be hesitant to enter into CDPs with us given our recent entry into the clean-energy industry. Certain technologies may depend on government subsidies to be commercially viable, and those subsidies may not be available from federal and state governments facing increasing financial constraints. If sectors of the clean-energy industry take an extended period to achieve market acceptance and to garner significant revenue, we may not earn material revenue from our initiatives in this area until such time, if ever. Furthermore, it may be difficult for us to predict which clean-energy companies may become market leaders, and we may invest time and resources in collaborations with companies who are ultimately unsuccessful in the clean-energy industry, which could adversely affect our operating results.
If a project to which we have devoted technology and significant resources fails to produce any measurable success or value to our customers in the form of differentiated technology and intellectual property, we may not earn licensing and royalty revenue sufficient to recover the upfront costs and cash invested in the CDP, which could adversely affect our results of operations.
In some cases, the revenue we receive from our customers during the development stage is not sufficient for us to fully recover our costs and cash invested in HPC platforms dedicated to customer engagement, and our business model relies on licensing and royalty revenue based on the sales by our customers in the end-markets of products incorporating the technology developed through our CDPs. Our CDPs involve complex R&D, and our ability to develop the differentiated technology and intellectual property sought by our customers is inherently uncertain and difficult to predict. In addition, there are a limited number of CDPs to which we can commit our resources at any given time. If a project to which we have devoted technology and significant resources fails to produce any measurable success or value to our customers in the form of differentiated technology and intellectual property that they may use in their products, we may not receive meaningful amounts of, or any, licensing and royalty revenue. In this case, we may not recover the upfront costs and cash invested in the CDP, which could adversely affect our results of operations. In addition, even if we successfully develop differentiated technology and intellectual property through a CDP that our customer is able to commercialize, there may be a significant delay before we receive any licensing or royalty revenue due to the complexities inherent in production and manufacturing in our target markets.
A decline in sales in the end markets for products incorporating technology developed through our CDPs could adversely affect our business and results of operations.
Our success is tied to our customers' ability to successfully commercialize the products that incorporate technology developed through our CDPs. The markets for our customers' products are intensely competitive and are characterized by rapid technological change. These changes result in frequent product introductions, short product life cycles and increased product capabilities. Competition is based on a variety of factors including price, performance, product quality, software availability, marketing and distribution capability, customer support, name recognition and financial strength. Products incorporating the technology developed through our CDPs may not achieve market success or may become obsolete. We cannot assure you that our customers will dedicate the resources necessary to promote and commercialize products developed through our CDPs, successfully execute their business strategies for such products, be able to manufacture such products in quantities sufficient to meet demand or cost-effectively manufacture products at high volume. Our customers are not
30
contractually obliged to manufacture, distribute or sell any products incorporating our CDP-developed technology. Our customers may develop internally or in collaboration with others technology that they might utilize instead of technology developed through our CDPs. Any of these factors, as well as more general market or industry issues, could result in a decline in sales of the products incorporating our technology, which would result in a decrease in any associated licensing and royalty revenue or the failure of any licensing and royalty revenue to materialize at all, and could adversely affect our business and results of operations. Any failure of a customer to achieve market success for products developed through our CDPs could also negatively affect such customer's willingness to work with us on other collaborations and could more generally harm our reputation and business prospects.
If we are unable to scale our development services and secure new CDPs, our growth prospects would be limited and our business and operating results could be adversely affected.
Our customers require a significant amount of individualized attention as well as dedicated lab space for CDPs. We have limited space and internal capacity, both in terms of personnel as well as capital equipment resources, to meet these types of demands for our customers. In addition, because of the significant confidentiality concerns associated with the projects and products we work on and the restrictions on resource and information sharing we have implemented in response, we are not able to fully capitalize upon economies of scale. If the demand for our services and products exceeds our capacity to meet such demand, we may be required to turn down potential opportunities, which would cause us to lose potential revenue, and our potential customers may take their business to a competitor or decide to develop or expand internal R&D capabilities. If we are unable to scale our development services to meet demand, our growth may be hindered and our business and operating results could be adversely affected.
We may not be successful in maintaining and managing CDPs, which would adversely affect our ability to develop successful products and our financial condition and operating results.
CDPs are complex and time-consuming to implement and they may require substantial resources to maintain. We may not be successful in all of our collaboration efforts and may fail to achieve the technological innovations sought by our customers in a reasonable amount of time or at all. When we collaborate with a customer, we rely to some degree on the efforts and resources of that customer. Our customers may not devote sufficient resources to collaborations or may otherwise fail in the aspects of the collaboration for which they are responsible. Disagreements over the implementation and management of the program may occur, which could lead to material delays and/or a failure to achieve the successful development of technology through the CDP. If we fail to achieve successful collaborations, or if our customers are dissatisfied with the results of or the way we design and manage a CDP, our operating results and financial condition would be materially and adversely affected.
Our strategy includes conducting proprietary R&D efforts in collaboration with and on behalf of multiple customers. Failure to adequately protect against potential conflicts of interest and breaches of confidentiality would harm our reputation and our relationships with our customers, and our business prospects and operating results would be adversely affected. Moreover, some potential customers may hesitate to grant us access to their proprietary information, which could impair our ability to provide value for such customers.
Our strategy includes conducting proprietary R&D efforts in collaboration with and on behalf of customers who in some cases may have overlapping interests and technologies. We seek to structure our collaborative agreements and business practices to minimize any potential conflicts and the possibility of any breaches of confidentiality. We may need access to some of our customers' proprietary information, and they may be reluctant to share it with us because of the risk of a potential conflict between us and/or our customers and other potential customers and the risk of a breach of confidentiality. Our failure to do so could result in our inability to attract new customers or retain
31
existing customers, or lead to our having incomplete information with respect to existing customers that could impair our ability to fully address the customers' needs and demonstrate the value of our technology to the customers. Even if we make significant efforts to isolate each development activity, we may fail to meet the contractual confidentiality commitments as to one or more customers. Moreover, even if we meet these commitments, conflicts between a customer and us, or between or among customers, could nevertheless arise. In either event, we may become involved in a dispute with our customers regarding the solutions developed during the collaboration or the rights to these solutions, including possible litigation. Disputes of this nature could harm the relationship between us and our customers, and could adversely affect our ability to enter into new CDPs and cause our revenue and operating results to decline.
Our financial obligation to Symyx Technologies, Inc. could adversely affect our financial health and our ability to raise additional capital to fund our operations and limit our ability to react to changes in the economy or our industry.
In connection with an agreement for the purchase of intellectual property and the termination of our royalty obligations under an existing license agreement, we issued a promissory note in the principal amount of $27.3 million to Symyx Technologies, Inc. (Symyx), a wholly-owned subsidiary of Accelrys, Inc., upon the consummation of our initial public offering. The promissory note has a term of 24 months, an interest rate equal to 4% and is payable in an amount equal to the lesser of the principal amount and the greater of $500,000 per quarter or the amount of accrued interest, with a balloon payment at maturity if applicable. The promissory note is secured by all of our tangible personal property, excluding intellectual property.
Our obligations under the promissory note require us to dedicate a substantial portion of our cash flow from operations to payments on interest and principal of the promissory note at or prior to maturity, thus reducing the availability of our cash flow to fund working capital, capital expenditures, research and development efforts, execution of our business strategy and other general corporate purposes. Such limitations increase our vulnerability to adverse general economic and industry conditions and limit our flexibility in planning for, or reacting to, changes in the economy, our industry and new opportunities that may arise. In addition, our obligations under the promissory note and the security interests granted in favor of Symyx may make it more difficult for us to borrow funds in the future to fund working capital, capital expenditures and other purposes, which could materially and adversely affect our business, financial conditions and results of operations.
We may be unable to make the substantial R&D investments required to remain competitive in our business.
The semiconductor and clean-energy industries require substantial investment in R&D to develop and bring to market new and enhanced technologies and products. To remain competitive, we anticipate that we will need to maintain or increase our levels of R&D expenditures to keep pace with the development efforts of our customers. We expect R&D expenses to increase in absolute dollars for the foreseeable future, due to the increasing complexity and number of solutions we plan to develop both for our customers and internally, the expansion of our customer base and any associated increase in upfront R&D costs. In addition, the ultimate success of products incorporating our technology will depend in part on significant continued investment in R&D by our customers. We do not know whether we or our customers will have sufficient resources to maintain or increase the level of investment in R&D required to remain competitive. In addition, we cannot assure you that the technologies, products and applications on which we and our customers have focused our R&D expenditures will become commercially successful. If we are required to invest significantly greater resources than anticipated in our R&D efforts without a corresponding increase in revenue, our operating results could be materially and adversely affected.
32
If we are unable to develop our platform and expertise to support our future growth plans, our business and operating results could be adversely affected.
We intend to further develop and broaden our HPC platform, including our software and informatics capabilities, to address a wider range of markets and customers for multiple applications within semiconductors, flat glass, solar cells, light emitting diodes (LEDs), flat-panel displays, advanced batteries and other energy-efficient technologies. However, we have limited expertise and experience in certain of these fields, and if we are unable to develop our platform and expertise to support these fields our business growth might be limited, and our business and operating results could be adversely affected.
If we lose one or more of our key personnel without obtaining adequate replacements in a timely manner or if we are unable to retain and recruit skilled personnel, our operations could become disrupted and the growth of our business could be delayed or restricted.
Our success depends, in large part, on the continued contributions of our senior management team, in particular, the services of Mr. David Lazovsky, our President and Chief Executive Officer, and Dr. Tony Chiang, our Chief Technology Officer. If we lose the services of Mr. Lazovsky or Dr. Chiang, it could slow the execution of our business plan, hinder our development processes and impair our sales efforts, and searching for a replacement could divert our other senior management's time and increase our operating expenses. In addition, our customers could become concerned about our future operations, which could harm our reputation.
None of our senior management is bound by written employment contracts to remain with us for a specified period. The loss of any of our senior management could harm our ability to implement our business strategy and respond to the rapidly changing market conditions in which we operate. Upon hiring or promotion, new senior management personnel must spend a significant amount of time learning our technology, business model and management systems and their new roles, in addition to performing their regular duties. Accordingly, until new senior personnel become familiar with our technology, business model and systems or with their new roles, we may experience some disruption to our ongoing operations. Moreover, the loss of a member of our senior management or our professional staff would require the remaining management to divert attention to seeking a replacement.
Our future success and competitiveness depends on our ability to retain and motivate our unique team of highly skilled scientists and engineers, who have expertise across various disciplines, fields and technologies, including engineering, materials science, process development and integration, equipment, device process technologies and device integration. In addition, as we grow, we will have to continue to retain, attract and motivate qualified and talented personnel, including our scientists and engineers, management, sales and marketing and legal and finance personnel. Because our CDPs are customer-specific and project-specific and last for a significant period of time, the loss of key scientists or engineers or other personnel could have an adverse effect on a particular development program and on our ability to deliver results to a customer in a timely manner or at all. We do not know whether we will be able to retain all of these employees as we continue to pursue our business strategy. Competition for personnel is intense in the semiconductor and clean-energy industries.
We may encounter difficulties in hiring qualified scientists and engineers because there is a limited pool of scientists and engineers with the specialized expertise required to understand and implement our platform in conjunction with our customers. Further, we may have difficulty in obtaining visas permitting entry for some of our employees who are foreign nationals into the United States, and delays in obtaining visas permitting entry into other key countries for several of our key personnel, which could disrupt our ability to strategically locate our personnel. The loss of the services of key employees or our inability to retain, attract and motivate qualified scientists and engineers could have a material adverse effect on our business, financial condition and results of operations.
33
We may be unable to effectively protect our intellectual property, which would negatively affect our ability to compete.
We depend on our proprietary HPC platform for our success and ability to compete. If others are able to reproduce our technology, our business will suffer significantly unless we can prevent them from competing with us. As of December 31, 2011, we owned 404 U.S. patents and patent applications (some of which also have foreign counterparts), which we believe protect our rights in our HPC platform. While we continue to file patent applications to seek protection for the further evolution of our HPC platform, patent laws provide only limited protection. We cannot assure you that all maintenance fees have been paid or that all filings have been made with the appropriate regulatory or governmental authorities with respect to any IP registered or applied for outside of the U.S. that we purchase. Also, patent protection in foreign countries may be limited or unavailable where we need this type of protection. A more detailed description of how we protect our IP is set forth in Part I, Item 1: "Business—Intellectual Property".
The patent positions of technology companies, including ours, are often uncertain and involve complex legal and factual questions. We will be able to protect our proprietary rights from unauthorized use by third parties only to the extent that our proprietary technologies are covered by valid and enforceable patents or are effectively maintained as trade secrets. We apply for patents covering our HPC platform and further advancements of our HPC platform as we deem appropriate. However, we may not obtain patents on all inventions for which we seek patents, and any patents we obtain may be challenged (both before and after any such patents issue) and may be narrowed in scope or extinguished as a result of these challenges. Additional uncertainty may result from the recent and potential future passage of patent reform legislation by the United States Congress, legal precedent as handed down by the United States Federal Circuit and Supreme Court as they determine legal issues concerning the scope and construction of patent claims and inconsistent interpretation of patent laws by the lower courts. For these reasons, among others, our existing patents and any future patents we obtain may not be sufficiently broad to prevent others from practicing our technologies or from developing similar or superior products. In that case, our revenue and operating results could decline.
Our strategy includes obtaining patent protection for technology developed in collaboration with our customers. A portion of our revenue from our customers derives from the licenses granted to our customers under these patents. If we are unable to obtain this type of protection, we would not be able to enforce exclusive rights to the technologies in question, and our revenue and operating results could decline.
We have developed in the past, and may develop in the future, patented technology with U.S. federal government funding. When new technologies are developed with U.S. government funding, the government obtains certain rights in any resulting patents, including a nonexclusive license authorizing the government to use the invention for non-commercial purposes. These rights may permit the government to disclose our confidential information to third parties and to exercise "march-in" rights to use or allow third parties to use our patented technology. The government can exercise its march-in rights if it determines that action is necessary because we fail to achieve practical application of the U.S. government-funded technology, because action is necessary to alleviate health or safety needs, to meet requirements of federal regulations, or to give preference to U.S. industry. In addition, U.S. government-funded technology may be subject to restrictions on transfer to foreign entities, and some U.S. government-funded data may be subject to public disclosure under the Freedom of Information Act.
Many of our customers and competitors have significant operations outside the United States. Foreign laws may not afford us sufficient protections for our intellectual property, however, and we may not always seek patent protection outside the United States. We believe that our success depends, in part, upon our ability to obtain international protection for our IP. However, the laws of some
34
foreign countries may not be as comprehensive as those of the United States and may not be sufficient to protect our proprietary rights abroad. Accordingly, our international competitors could obtain foreign patent protection for, and market overseas, products and technologies for which we are seeking patent protection in the United States.
Confidentiality agreements with employees and others may not adequately prevent disclosures of trade secrets and other proprietary information.
We rely in part on trade secret protection to protect our confidential and proprietary information and processes. However, trade secrets are difficult to protect. We have taken measures to protect our trade secrets and proprietary information, but these measures may not be effective. We require new employees and consultants to execute confidentiality agreements upon the commencement of an employment or consulting arrangement with us. These agreements generally require that all confidential information developed by the individual or made known to the individual by us during the course of the individual's relationship with us be kept confidential and not disclosed to third parties. These agreements also generally provide that inventions conceived by the individual in the course of rendering services to us shall be our exclusive property. Nevertheless, employees, collaborators or consultants may still disclose or misuse our confidential information, and we may not be able to meaningfully protect our trade secrets. In addition, others may independently develop substantially equivalent information or techniques or otherwise lawfully gain access to our trade secrets, and thereafter communicate this information to others without maintaining its confidentiality. Costly and time-consuming litigation could be necessary to enforce and determine the scope of our proprietary rights, and failure to obtain or maintain trade secret protection could adversely affect our competitive business position.
Significant litigation over intellectual property in the industry may cause us to become involved in costly and lengthy litigation, which could subject us to liability, require us to stop licensing our developed technology or force us to develop new technology.
Whether or not patents are granted to us, litigation may be necessary to enforce our IP rights, to defend against a claim of infringement of IP rights of others or to determine the validity and scope of the proprietary rights of others. Because infringement is a fact-intensive inquiry, and because patent applications in the United States and many foreign jurisdictions are typically not published until eighteen months after filing (or, in some cases, are not published until they issue as patents), we cannot be certain that we do not now, and will not in the future, infringe a third party's patent rights. We may also become party to claims by our customers to IP rights developed by us in connection with a CDP. If our customers become involved in disputes with third parties over allegations that our customers' practice of our IP rights infringes the IP rights of such third parties, it may also become necessary for us to become involved in such disputes.
Any claim, even if without merit, could be time consuming to defend, result in costly litigation, or require us to enter into licensing agreements, resulting in unexpected operating costs. Moreover, our opponents in any litigation may have significantly more resources with which to defend against or assert claims in the litigation. A successful claim of infringement against us in connection with the use of our technologies could force us to stop using our technologies that incorporate the infringed IP; pay substantial monetary damages or royalties; grant cross-licenses to third parties relating to our own IP; obtain a license from the owner of the infringed IP, which may not be available to us on acceptable terms or at all; or re-engineer our platform or products to avoid further IP infringement, which may be technically impossible or commercially infeasible. The occurrence of any of these eventualities could adversely affect our business. Even if we are successful in defending such a claim, litigation could also divert our resources, including our managerial and engineering resources. Any infringement claim or other litigation against or by us could have a material negative effect on our business.
35
Our intellectual property indemnification policies and obligations may adversely impact our business and operating results.
Any assertion by a third party asserting ownership or other rights to technology developed through our CDPs could result in our customers becoming the target of litigation and we may be bound to indemnify our customers under the terms of our license agreements. These obligations could result in substantial expenses to us, which could have a material adverse effect on our business, financial condition and results of operations. In addition to the time and expense required for us to satisfy our support and indemnification obligations to our customers, any litigation could severely disrupt or shut down the business of our customers, which in turn could damage our relations with them and have a material adverse effect on our reputation, business, financial condition and results of operations.
We will need to rely on our customers to deliver timely and accurate information to accurately report our financial results from licensing and royalty revenue in the time frame and manner required by law.
We will need to receive timely, accurate and complete information from our customers to accurately report our financial results on a timely basis. Licensing and royalty revenue we may receive in the future may be based on the revenue from the sale of our customers' products that incorporate technology developed through our CDPs, and we will need to rely on our customers to provide us with complete and accurate information regarding revenue and payments owed to us on a timely basis. If the information that we receive is not accurate, we may not receive the full amount of revenue that we are entitled to under these arrangements on a timely basis, which could result in adjustments to our financial results in a future period. Although we typically have audit rights with these parties, performing this type of audit could be harmful to our collaborative relationships, expensive and time-consuming and may not be sufficient to reveal any discrepancies in a timeframe consistent with our reporting requirements.
We may need additional capital in the future to finance our business.
Our future capital requirements may be substantial, particularly as we continue to develop our business and expand our collaborative development efforts. Although we believe that, based on our current level of operations and anticipated growth, our existing cash, cash equivalents and marketable securities, combined with the net proceeds from our initial public offering, will provide adequate funds for ongoing operations, planned capital expenditures and working capital requirements for at least the next 12 months, we may need additional capital if our current plans and assumptions change. Our need for additional capital will depend on many factors, including our rate of revenue growth, our expansion of our sales and marketing activities and overhead expenses, the timing and extent of our spending to support our R&D efforts and our ability to expand CDPs in the semiconductor industry, whether we are successful in obtaining payments from customers, the financial stability of our customers, whether we can enter into additional collaborations in our target industries, the progress and scope of collaborative R&D projects performed by us and our customers, the effect of any acquisitions of other businesses or technologies that we may make in the future, the filing, prosecution and enforcement of patent claims, how much we need to develop or enhance our solutions or HPC platform and any necessary responses to competitive pressures.
If our capital resources are insufficient to meet our capital requirements, and our revenue is insufficient to support any of these activities, then we will have to raise additional funds. If future financings involve the issuance of equity securities, our then-existing stockholders would suffer dilution. If we raise future debt financing, we may be subject to restrictive covenants that limit our ability to conduct our business. We may not be able to raise sufficient funds on terms that are favorable to us, if at all. If we fail to raise sufficient funds and continue to incur losses, our ability to fund our operations, take advantage of strategic opportunities, develop products or technologies or otherwise respond to competitive pressures could be significantly limited. If this happens, we may be forced to delay or
36
terminate R&D programs, curtail or cease operations, obtain funds through collaborative and licensing arrangements that may require us to relinquish commercial rights, or grant licenses on terms that are not favorable to us. If adequate funds are not available, we may not be able to successfully execute our business plan or continue our business.
Failure of suppliers to timely deliver sufficient quantities of the components, materials or software used in our collaborations, may result in delays or other disruptions in executing our CDPs, which could adversely affect our business and operating results.
We have historically relied on a small number of contract manufacturing companies for the manufacture and assembly of a majority of our HPC tools. While we are not dependent on any single contract manufacturing company, key parts of our tools are currently available only from a limited number of sources. In addition, components of our capital equipment are available from only a few suppliers. If supplies from these vendors are delayed or interrupted for any reason, we may not be able to get equipment or components for our tools or our own research efforts in a timely fashion or in sufficient quantities or under acceptable terms, if at all. Even though alternative sources of supply would be available, it could be time-consuming and expensive for us to qualify new vendors and work with them to integrate our designs into the tools they manufacture for us. In addition, we depend upon our vendors to provide components of appropriate quality and reliability. Consequently, if supplies from these vendors were delayed or interrupted for any reason, it could materially and adversely affect our business.
Our business strategy requires us to evaluate, integrate and develop elements of our customers' value chains, including development and manufacturing processes. Our ability to evaluate these effectively may sometimes depend on the cooperation from our customers' materials suppliers and equipment manufacturers as well as access to their data and tools. If these third parties do not cooperate with us or provide us access to the necessary materials, tools or equipment we may not be able to deliver effective solutions to our customers, which would adversely affect our business and results of operations.
We have to evaluate multiple elements of our customers' value chains to help them test and develop end products that meet their specifications, including the materials, tools and equipment used by them during the manufacturing process. Our ability to evaluate a customer's value chain effectively may sometimes depend on cooperation from such customer's materials suppliers and equipment manufacturers and on access to their data and tools. Our evaluation of the materials and equipment in the value chain must be unbiased to maintain credibility with our customers, and our evaluation sometimes results in recommendations that our customers change materials, tools or equipment. Our recommendations may negatively impact our relationships with materials and tool providers and equipment manufacturers. Tensions in our relationships with these providers and manufacturers may cause these parties to limit or deny our access to their newest materials and equipment, which would in turn limit our ability to complete our development activities with our customers or control the quality of the combinatorial methods applied to their development efforts, which would adversely affect our business and operations.
If we cannot compete successfully in our industry, our results of operations and financial condition would be adversely affected.
Competition in our market may intensify in the future, which could slow our ability to grow or execute our strategy and could lead to increased pricing pressure, negatively impacting our revenue. Our current and potential customers may choose to develop their own combinatorial development methods internally, particularly if we are slow in deploying our solutions or improving them to meet market needs. We currently face indirect competition from the internal R&D groups at integrated circuit (IC) companies, particularly those of our customers who work with us to develop knowledge of
37
combinatorial methods and who may then use our methods independently. Our customers do not license our technology exclusively, and several of them also design, develop, manufacture and market semiconductor projects based on their own or other architectures and develop their own intellectual property internally. They often compete with each other and with us in various applications. Our customers are generally much larger and have significantly greater resources than us. Even if we are successful in an engagement, a customer may not decide to implement our solutions, or could develop their own solutions that do not include the IP we generated, which would result in reduced royalty revenue. We also face indirect competition from university collaborations, consortia and alliance partnerships. In addition, there may be other providers of high-throughput empirical solutions for the design of and R&D relating to integrated devices of which we are not aware and there may be new entrants to the industry in the future, particularly if acceptance of these solutions grows. In addition, we believe that the demand for solutions that address the need for better integration between the design and manufacturing processes may encourage direct competitors to enter into our market. Other potential competitors include fabrication facilities that may decide to offer solutions competitive with ours as part of their value proposition to their customers. If these potential competitors change the pricing environment or are able to attract industry partners or customers faster than we can, we may not be able to grow and execute our strategy as quickly or at all.
The semiconductor industry is highly cyclical, subject to price volatility, difficult to predict and subject to significant downturns.
Currently, the substantial majority of our revenue is dependent upon the overall condition of the semiconductor industry, especially in light of the licensing component of our revenue. The semiconductor industry is highly cyclical and subject to rapid technological change and has been subject to significant economic downturns at various times, such as the recent economic downturn, characterized by diminished product demand, accelerated erosion of average selling prices and production overcapacity. The semiconductor industry also periodically experiences increased demand and production capacity constraints. In addition, the semiconductor industry has historically experienced price volatility. As a result, we may experience significant fluctuations in operating results due to general semiconductor industry conditions and overall economic conditions.
The semiconductor industry has experienced significant challenges as a result of tightening of credit markets, turmoil in the financial markets, and weakened global economy. There may also be sudden changes in our customers' manufacturing capacity requirements and spending, which depend in part on capacity utilization, demand for our customers' IC products by consumers, inventory levels relative to demand, and access to affordable capital. For example, pressures in the DRAM sector have caused financial difficulties for our customer, Elpida. In addition, the semiconductor industry has experienced significant consolidation in the past and may continue to see high levels of consolidation in the future. If any of our customers are acquired, the acquiror may not continue to engage in a CDP with us. Alternatively, our customers may opt to acquire companies or technologies that decrease their need for our services or otherwise divert their R&D resources. As a result of these and other potential changes, the timing and length of any cycles can be difficult to predict. Further, uncertainty about future global economic conditions and any effect on the semiconductor industry could make it challenging for us to forecast our operating results, make business decisions and identify the risks that may affect our business, financial condition and results of operations. If we are not able to timely and appropriately adapt to changes resulting from the difficult macroeconomic environment, our business, financial condition and results of operations may be significantly negatively affected.
38
A substantial portion of our revenue is derived from business arrangements with related parties, and such arrangements could create conflicts of interest that could adversely affect our business and results of operations.
Some of our customers and other business partners hold a significant stake in our capital stock. Related party transactions disclosed in our financial statements accounted for $21.0 million and $26.0 million, or 39.0% and 61.0%, of our revenue for the years ended December 31, 2011 and 2010, respectively. ATMI, which beneficially owned approximately 9.1% of our capital stock as of December 31, 2011, accounted for $15.8 million and $22.1 million, or 29.3% and 51.8%, of our revenue for years ended December 31, 2011 and 2010, respectively. For more information about these transactions, see Note 11 to our consolidated financial statements in this Annual Report on Form 10-K. We have also entered into CDPs with GLOBALFOUNDRIES, whose majority stockholder, Advanced Technology Investment Company, LLC, beneficially owned approximately 3.8% of our capital stock as of December 31, 2011, and SanDisk Corporation and Toshiba Corporation, which collectively hold warrants exercisable for an aggregate of 822,368 shares of our common stock.
We believe that the transactions and agreements that we have entered into with related parties are on terms that are at least as favorable as could reasonably have been obtained at such time from third parties. However, these relationships could create, or appear to create, potential conflicts of interest when our board of directors is faced with decisions that could have different implications for us and our related parties or their affiliates. In addition, conflicts of interest may arise between us and our related parties and their affiliates. The appearance of conflicts, even if such conflicts do not materialize, might adversely affect the public's perception of us, as well as our relationship with other companies and our ability to enter into new relationships in the future, including new CDPs with competitors of such related parties, which could have a material adverse effect on our ability to do business.
We are subject to warranty claims, product recalls and product liability.
We may, from time to time, be subject to warranty or product liability claims for our HPC tools that may in the future lead to expenses as we compensate affected customers for costs incurred related to product quality issues. Although we maintain product liability insurance, such insurance is subject to significant deductibles and there is no guarantee that such insurance will be available or adequate to protect against all such claims. Alternatively, we may elect to self-insure with respect to certain matters. We may incur costs and expenses in the event of any recall of a HPC tool sold to our customers. We may incur replacement costs, contract damage claims from our customers and reputational harm. Costs or payments made in connection with warranty and product liability claims and product recalls could materially affect our financial condition and results of operations.
Compliance with environmental, health and safety laws and regulations could increase costs or cause us to incur substantial liabilities.
We are subject to various foreign, federal, state and local environmental laws and regulations governing, among other matters, emissions and discharges of hazardous materials into the air and water, the use, generation, storage, handling, transportation and disposal of, and exposure to, hazardous materials and wastes, remediation of contamination and employee health and safety. In addition, under certain of these environmental laws, liability can be joint and several and without regard to comparative fault. Our operations involve the use of hazardous materials and produce hazardous waste, and we could become liable for any injury or contamination that could arise due to such use or disposal of these materials. Failure to comply with environmental laws and regulations could result in the imposition of substantial civil and criminal fines and sanctions, could require operational changes or limits or the installation of costly equipment or otherwise lead to third party claims. Future environmental laws and regulations, stricter enforcement of existing laws and regulations, or the discovery of previously unknown contamination or violations of such laws and regulations could require us to incur costs or become the basis for new or increased liabilities, which could impair our operations and adversely affect our business and results of operations.
39
Acquisitions may harm our business and operating results, cause us to incur debt or assume contingent liabilities or dilute our shareholders.
We have made and may in the future make strategic investments or acquisitions where there is an opportunity to expand the potential applications and reach of our HPC platform. Exploring and implementing any investments or acquisitions may place strain upon our ability to manage our future growth and may divert management attention from our core development and licensing business. There are also other risks associated with this strategy. We cannot assure you that we will be able to make investments or acquire businesses on satisfactory terms, that any business acquired by us or in which we invest will be integrated successfully into our operations or be able to operate profitably, or that we will be able to realize any expected synergies or benefits from such investments or acquisitions. Our relative inexperience in effecting such transactions heightens these risks. In addition, to finance any acquisitions or investments, we may utilize our existing funds, or might need to raise additional funds through public or private equity or debt financings. Prolonged tightening of the financial markets may impact our ability to obtain financing to fund future acquisitions and we could be forced to obtain financing on less than favorable terms. Additionally, equity financings may result in dilution to our stockholders. We cannot predict the number, timing or size of investments or acquisitions, or the effect that any such transactions might have on our operating results.
Global or regional economic, political and social conditions could adversely affect our business and operating results.
We operate in multiple jurisdictions throughout the world and are subject to foreign business, political and economic risks. In particular, we are subject to risks arising from adverse changes in global economic conditions. Global economic uncertainties in the key markets of many of our customers may cause our customers to delay or reduce technology purchases and investments. The impact of this on us is difficult to predict, but if businesses defer licensing our technology, require fewer CDPs or development tools, or if consumers defer purchases of new products that incorporate technology developed through our CDPs, our revenue could decline. A decline in revenue would have an adverse effect on our results of operations and our financial condition.
In addition, some of our largest customers are located outside of the United States, primarily in Asia, which further exposes us to foreign risks. Also, a substantial portion of the consumer products market that serves as the end-market for the products we help our customers to develop is located in Asia. As a result, our operations are subject to substantial influence by political and economic conditions as well as natural disasters in Asia such as the 2011 earthquake and tsunami in Japan. Reduced end user demand as well as disruptions to the supply chain for our customers resulting from these or other events could lead to a reduction in our revenue and an adverse impact on our financial condition.
We are also subject to general geopolitical risks in connection with international operations, such as political, social and economic instability, terrorism, interference with information or communication of networks or systems, potential hostilities, changes in diplomatic and trade relationships, and disease outbreaks, and any disruptive effect these events would have on our business operations. Although to date we have not experienced any material adverse effect on our operations as a result of these types of regulatory, geopolitical, and other factors, we cannot assure investors that these factors will not have a material adverse effect on our business, financial condition, and operating results or require us to modify our current business practices. Inconsistencies among, and unexpected changes in, a wide variety of foreign laws and regulatory environments with which we are not familiar, including, among other issues, with respect to employees, protection of our intellectual property, and a wide variety of operational regulations and trade and export controls under domestic, foreign, and international law may also have unexpected, adverse impacts on our operations and financial condition.
40
In the future, exchange rate fluctuations could affect our revenue, which could adversely affect our business and operating results.
Our licensing and royalty revenue is derived from sales of our customers' products that incorporate technology developed through our CDPs. To the extent that sales for these customer products are denominated in a foreign currency, an increase in the value of the U.S. dollar relative to such foreign currencies could adversely affect our licensing and royalty revenue irrespective of the volume of such products sold, which could adversely affect our business and operating results.
In addition, we derive a significant portion of our revenue from customers in foreign countries, particularly those based in Japan. Revenue generated from customers in Japan accounted for 28%, 29% and 30% of total revenue for the years ended December 31, 2011, 2010 and 2009, respectively. We expect that a significant portion of our total future revenue will continue to be derived from companies based in Japan and other foreign countries. If the U.S. dollar increases in value relative to the currencies in any of these countries, the cost of our CDPs, which have historically been billed in U.S. dollars, will be more expensive to existing and potential customers in those countries, which could adversely affect our ability to generate new or expand existing CDPs.
Business interruptions could delay us in the process of developing our products and could disrupt our sales.
Our headquarters are located in the San Francisco Bay Area near known earthquake fault zones and are vulnerable to significant damage from earthquakes. We are also vulnerable to other types of natural disasters and other events that could disrupt our operations, such as terrorist acts and other events beyond our control. We do not carry insurance for earthquakes and we may not carry sufficient business interruption insurance to compensate us for losses that may occur. Any losses or damages we incur could have a material adverse effect on our cash flows and success as an overall business.
Our ability to use our net operating loss carryforwards to offset future taxable income, and our ability to use our tax credit carryforwards, may be subject to certain limitations.
In general, a corporation that undergoes an "ownership change" under Section 382 of the Internal Revenue Code is subject to limitations on its ability to utilize its pre-change net operating loss carryforwards (NOLs) to offset future taxable income and its ability to utilize tax credit carryforwards. As of December 31, 2011, we reported U.S. federal NOLs of approximately $26.7 million. In general, an "ownership change" occurs if the aggregate stock ownership of certain stockholders (generally, 5% shareholders, applying certain aggregation and look-through rules) increases by more than 50 percentage points over such stockholders' lowest percentage ownership during the testing period (generally, three years). We have not determined whether an ownership change has occurred in the past. If we have experienced an ownership change in the past, our ability to utilize NOLs and tax credit carryforwards could be limited. Furthermore, future changes in our stock ownership, such as certain stock issuances and transfers between stockholders, some of which changes are outside of our control, could result in ownership changes under Section 382 of the Internal Revenue Code. For these reasons, we may not be able to utilize a material portion of our NOLs and tax credit carryforwards, even if we attain profitability.
Risks Related to Ownership of Our Common Stock
Our stock price may be volatile, which may cause the value of our common stock to decline and subject us to securities class action litigation.
The market price of our common stock could be subject to significant fluctuations. Market prices for securities of early stage companies have historically been particularly volatile. These fluctuations could be in response to, among other things, the factors described in this "Risk Factors" section or
41
elsewhere in this annual report on Form 10-K, or other factors, some of which are beyond our control, such as:
- •
- fluctuations in our financial results or outlook or those of our customers or of companies perceived to be similar to us;
- •
- changes in estimates of our financial results or recommendations by securities analysts;
- •
- changes in market valuations of similar companies;
- •
- changes in our capital structure, such as future issuances of securities or the incurrence of debt;
- •
- announcements by us or our competitors of significant contracts, acquisitions or strategic alliances;
- •
- litigation involving us, our general industry or both;
- •
- additions or departures of key personnel;
- •
- regulatory developments in the U.S., countries in Asia, and/or other foreign countries;
- •
- investors' general perception of us; and
- •
- changes in general economic, industry and market conditions.
Furthermore, the stock markets have experienced price and volume fluctuations that have affected, and continue to affect, the market prices of equity securities of many companies. These fluctuations often have been unrelated or disproportionate to the operating performance of those companies. These broad market fluctuations, as well as general economic, political and market conditions, such as recessions, interest rate changes and international currency fluctuations, may negatively affect the market price of our common stock.
In the past, many companies that have experienced volatility in the market price of their stock have become subject to securities class action litigation. We may be the target of this type of litigation in the future. Securities litigation against us could result in substantial costs and divert our management's attention from other business concerns, which could seriously harm our business.
We have incurred and will continue to incur increased costs and demands upon management as a result of complying with the laws and regulations affecting public companies, which could harm our results of operations.
As a public company, we have incurred and will continue to incur significant accounting, legal and other expenses that we did not incur as a private company, including costs associated with public company reporting requirements. We have incurred and will continue to incur costs associated with corporate governance requirements, including requirements under Section 404 and other provisions of the Sarbanes-Oxley Act, as well as rules implemented by the Securities Exchange Commission, or SEC, and the exchange on which we list our common stock. The expenses incurred by public companies for reporting and corporate governance purposes have increased dramatically in recent years. We expect these rules and regulations to substantially increase our financial and legal compliance costs. In addition, these rules and regulations are subject to change from time to time, and we may incur additional financial and legal compliance costs as we seek to understand and comply with changes in these rules and regulations. We also expect these rules and regulations to make it more difficult and expensive for us to maintain director and officer liability insurance, and we may be required to accept reduced policy limits and coverage or incur substantially higher costs to obtain the same or similar coverage previously available. As a result, it may be more difficult for us to attract and retain qualified individuals to serve on our board of directors or as our executive officers.
42
If we experience material weaknesses or otherwise fail to maintain an effective system of internal controls in the future, we may not be able to accurately report our financial condition or results of operations, which may adversely affect investor confidence in our company and, as a result, the value of our common stock.
As a public company, we will be required, under Section 404 of the Sarbanes-Oxley Act, to furnish a report by management on, among other things, the effectiveness of our internal control over financial reporting for the fiscal year ending December 31, 2012. This assessment will need to include disclosure of any material weaknesses identified by our management in our internal control over financial reporting, as well as an opinion from our independent registered public accounting firm on the effectiveness of our internal control over financial reporting. A material weakness is a control deficiency or combination of control deficiencies that results in more than a remote likelihood that a material misstatement of annual or interim financial statements will not be prevented or detected.
We are in the early stages of the costly and challenging process of hiring personnel and compiling the system and processing documentation necessary to perform the evaluation needed to comply with Section 404. We may not be able to complete our evaluation, testing and any required remediation in a timely fashion. During the evaluation and testing process, if we identify one or more material weaknesses in our internal control over financial reporting, we will be unable to assert that our internal controls are effective. We cannot assure you that there will not be material weaknesses and significant deficiencies in our internal controls in the future. If we are unable to conclude that our internal control over financial reporting is effective, or if our independent registered public accounting firm were to issue an adverse opinion on the effectiveness of our internal control over financial reporting, we could lose investor confidence in the accuracy and completeness of our financial reports, which would cause the price of our common stock to decline.
We have not completed a testing cycle under Section 404 of the Sarbanes-Oxley Act and cannot assure you that we will be able to implement and maintain an effective internal control over financial reporting in the future. Any failure to maintain such controls could severely inhibit our ability to accurately report our financial condition or results of operations.
The concentration of our capital stock ownership by our executive officers, directors and 5% stockholders will limit your ability to influence corporate matters.
Our executive officers, directors, current five percent or greater stockholders and entities affiliated with them together beneficially owned approximately 70.1% of our common stock outstanding as of December 31, 2011. Entities affiliated with Redpoint Ventures, entities affiliated with CMEA Ventures and entities affiliated with U.S. Venture Partners beneficially owned approximately 18.0%, 18.1% and 12.7% of our common stock outstanding as of December 31, 2011. This significant concentration of share ownership may adversely affect the trading price for our common stock because investors often perceive disadvantages in owning stock in companies with concentrated stock ownership. Also, these stockholders, acting together, will be able to influence our management and affairs and matters requiring stockholder approval, including the election of directors and the approval of significant corporate transactions, such as mergers, consolidations or the sale of substantially all of our assets. Consequently, this concentration of ownership may have the effect of delaying or preventing a change of control, including a merger, consolidation or other business combination involving us, or discouraging a potential acquirer from making a tender offer or otherwise attempting to obtain control, even if that change of control would benefit our other stockholders.
43
A significant portion of our total outstanding shares may be sold into the public market in the near future, which could cause the market price of our common stock to drop significantly, even if our business is doing well.
If our existing stockholders sell, or if the market believes our existing stockholders will sell, substantial amounts of our common stock in the public market, the market price of our common stock could decline significantly. As of December 31, 2011, we had 42,218,906 shares of common stock outstanding. Of these shares, 32,568,906 shares are currently restricted from transfer as a result of contractual lock-up and/or market standoff agreements entered into in connection with our initial public offering. The lock-up restrictions are scheduled to terminate on May 15, 2012, subject to extension in certain cases for up to 34 additional days under certain circumstances where we announce or pre-announce earnings or a material event occurs within approximately 17 days prior to, or approximately 16 days after, the termination of the lock-up period. In addition, the underwriters of our initial public offering may, in their sole discretion and at any time without notice, release all or any portion of the securities subject to the lock-up restrictions. Once released, these shares will generally become eligible for sale, subject in some cases to the volume limitations and other restrictions of Rule 144 and Rule 701 promulgated under the Securities Act of 1933, as amended, or the Securities Act, and upon the lapse of our right of repurchase with respect to any unvested shares.
In addition, as of December 31, 2011, the holders of 26,492,877 shares of our common stock are entitled to certain rights with respect to the registration of such shares under the Securities Act, subject to the lock-up restrictions described above. If we register such shares of common stock following the expiration of the lock-up restrictions, these stockholders could sell those shares in the public market without being subject to the volume and other restrictions of Rule 144 and Rule 701.
In the meantime, as a result of our relatively small public float, our common stock is less liquid than the common stock of companies with broader public ownership, and the trading prices for our common stock may be more volatile than generally may be the case for more widely-held common stock. Among other things, trading of a relatively small volume of our common stock may have a greater impact on the trading price of our common stock than would be the case if our public float were larger.
We also registered approximately 12.6 million shares of our common stock subject to outstanding stock options and reserved for issuance under our equity plans. These shares can be freely sold in the public market upon issuance, subject to vesting restrictions and the lock-up restrictions described above.
If securities or industry analysts do not publish or cease publishing research or reports about us, our business or our market, or if they change their recommendations regarding our stock adversely, our stock price and trading volume could decline.
The trading market for our common stock will be influenced by the research and reports that industry or securities analysts may publish about us, our business, our market or our competitors. If any of the analysts who may cover us change their recommendation regarding our stock adversely, or provide more favorable relative recommendations about our competitors, our stock price would likely decline. If any analyst who may cover us were to cease coverage of our company or fail to regularly publish reports on us, we could lose visibility in the financial markets, which in turn could cause our stock price or trading volume to decline.
Anti-takeover provisions contained in our certificate of incorporation and bylaws, as well as provisions of Delaware law, could impair a takeover attempt.
Our amended and restated certificate of incorporation and our amended and restated bylaws contain provisions that could delay or prevent a change in control of our company. These provisions
44
could also make it more difficult for stockholders to elect directors and take other corporate actions. These provisions include:
- •
- staggered board of directors;
- •
- authorizing the board to issue, without stockholder approval, preferred stock with rights senior to those of our common
stock;
- •
- authorizing the board to amend our bylaws and to fill board vacancies until the next annual meeting of the stockholders;
- •
- prohibiting stockholder action by written consent;
- •
- limiting the liability of, and providing indemnification to, our directors and officers;
- •
- eliminating the ability of our stockholders to call special meetings; and
- •
- requiring advance notification of stockholder nominations and proposals.
Section 203 of the Delaware General Corporation Law prohibits, subject to some exceptions, "business combinations" between a Delaware corporation and an "interested stockholder," which is generally defined as a stockholder who becomes a beneficial owner of 15% or more of a Delaware corporation's voting stock, for a three-year period following the date that the stockholder became an interested stockholder.
These and other provisions in our amended and restated certificate of incorporation and our amended and restated bylaws could discourage potential takeover attempts, reduce the price that investors might be willing to pay in the future for shares of our common stock and result in the market price of our common stock being lower than it would be without these provisions.
ITEM 1B. UNRESOLVED STAFF COMMENTS
None.
Facilities
Our facilities currently consist of an aggregate of approximately 146,000 square feet of office, research and development clean room space in San Jose, California, pursuant to a lease that expires in 2015. For our CDP engagements, as of December 31, 2011, we were using approximately 56% of the capacity of our clean room space in San Jose. We have historically expanded and invested in our facilities to support the growth of our CDPs and we expect to be able to continue to do so on commercially reasonable terms as we engage in new CDPs in the future. We have no reason to believe that additional space that we may need in the future will not be available on commercially reasonable terms.
From time to time, we may become involved in other legal proceedings and claims arising in the ordinary course of our business. We are not currently a party to any legal proceedings the outcome of which, if determined adversely to us, we believe would individually or in the aggregate have a material adverse effect on our business, operating results, financial condition or cash flows.
ITEM 4. MINE SAFETY DISCLOSURES
Not applicable.
45
ITEM 5. MARKET FOR REGISTRANT'S COMMON EQUITY, RELATED STOCKHOLDER MATTERS AND ISSUER REPURCHASE OF EQUITY SECURITIES
Market Information for Common Stock
Our common stock has been listed on The NASDAQ Global Select Market, or NASDAQ, under the symbol "IMI" since our initial public offering on November 18, 2011. The following table sets forth on a per share basis, for the periods indicated, the low and high sale prices of our common stock as reported by NASDAQ.
| |
Low | High | |||||
|---|---|---|---|---|---|---|---|
Fiscal Year Ended December 31, 2011 |
|||||||
Fourth Quarter (beginning November 18, 2011) |
$ | 8.00 | $ | 10.01 | |||
As of March 15, 2012, there were approximately 105 holders of record of our common stock. In addition, a substantially greater number of stockholders may be "street name" or beneficial holders, whose shares are held of record by banks, brokers and other financial institutions.
Dividend Policy
We have never declared or paid any cash dividends on our common stock. We currently intend to retain any future earnings for use in the operation and expansion of our business, and currently do not plan to declare or pay any dividends on shares of our common stock in the foreseeable future. Subject to the foregoing, the payment of cash dividends in the future, if any, will be at the discretion of our board of directors and will depend upon a number of factors, including our earnings, capital requirements, requirements under the Delaware General Corporation Law, restrictions and covenants pursuant to any credit facilities we may enter into, our overall financial condition and any other factors deemed relevant by our board of directors.
Performance Graph
The following graph compares our total common stock return with the total return for (i) the NASDAQ Composite Index (^IXIC) and (ii) Philadelphia Stock Exchange Semiconductor Index (SOX) for the period from November 18, 2011 (the date our common stock commenced trading on the NASDAQ) through December 31, 2011. The figures represented below assume an investment of $100 in our common stock at the closing price of $9.50 on November 18, 2011 and in the NASDAQ Composite Index and Philadelphia Stock Exchange Semiconductor Index on November 18, 2011 and the reinvestment of dividends into shares of common stock. The comparisons in the table are required by the SEC and are not intended to forecast or be indicative of possible future performance of our common stock. This graph shall not be deemed "soliciting material" or to be "filed" for purposes of Section 18 of the Exchange Act or otherwise subject to the liabilities under that Section, and shall not
46
be deemed to be incorporated by reference into any of our filings under the Securities Act or the Exchange Act.
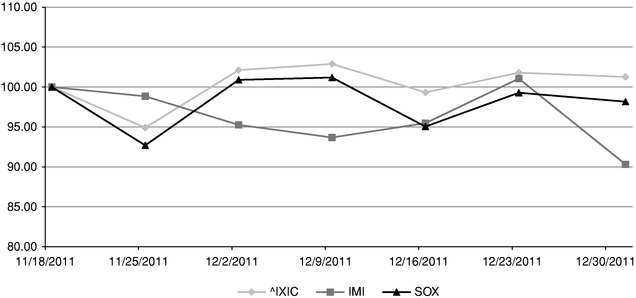
Use of Proceeds from Registered Securities
On November 17, 2011, the Securities and Exchange Commission (SEC) declared effective our registration statement on Form S-1 (File No. 333-175877), as amended, filed in connection with the initial public offering of our common stock. Pursuant to the registration statement, we registered the offer and sale of 9,650,000 shares of our common stock with an aggregate offering price of $96.5 million. We issued and sold 5,681,796 shares of our common stock at a public offering price of $10.00 per share for an aggregate offering price of approximately $56.8 million, before deducting underwriters' discounts and commissions and offering expenses. Symyx Technologies, Inc. sold 3,968,204 shares of our common stock at a public offering price of $10.00 per share for an aggregate offering price of approximately $39.7 million, before deducting underwriters' discounts and commissions and estimated offering expenses. The offering did not terminate until after the sale of all of the shares covered by the registration statement. The managing underwriters of the offering were Morgan Stanley & Co. LLC, J.P. Morgan Securities LLC, Barclays Capital Inc., Pacific Crest Securities LLC and Needham & Company, LLC. After deducting underwriting discounts, commissions and offering expenses paid or payable by us of approximately $7.6 million, our net proceeds from the offering were approximately $49.2 million. No payments were made by us to directors, officers or persons owning ten percent or more of our common stock or to their associates, or to our affiliates, other than payments in the ordinary course of business to officers for salaries and to non-employee directors as compensation for board or board committee service.
There has been no material change in the planned use of proceeds from our initial public offering as described in our final prospectus filed with the SEC on November 18, 2011 pursuant to Rule 424(b). In connection with an agreement for the purchase of intellectual property and the termination of our royalty obligations under an existing license agreement, we issued a promissory note in the principal amount of $27.3 million to Symyx Technologies, Inc. (Symyx), a wholly-owned subsidiary of Accelrys, Inc., upon the consummation of our initial public offering. The promissory note has a term of 24 months, an interest rate equal to 4% and is payable in an amount equal to the lesser of the principal amount and the greater of $500,000 per quarter or the amount of accrued interest, with a balloon payment at maturity if applicable. The promissory note is secured by all of our tangible personal property, but excluding intellectual property. We also agreed to reimburse Symyx for 50% of
47
their underwriting discounts and commissions from the sale of their shares in our initial public offering, which amount was equal to $1.4 million. A portion of the net proceeds of our initial public offering will be used to make payments of scheduled interest and payment of principal on the promissory at any time at or prior to maturity. From November 17, 2011, the date on which the SEC declared effective the registration statement on Form S-1 for our initial public offering, through December 31, 2011, we used a portion of the net proceeds of our initial public offering to pay Symyx $1.4 million in satisfaction of our agreement to reimburse Symyx for 50% of their underwriter discounts and commissions. We have invested the remainder of funds received in short and intermediate-term, interest-bearing obligations, investment-grade instruments, or guaranteed obligations of the U.S. government.
Recent Sales of Unregistered Securities
From January 1, 2011 through December 31, 2011, we sold and issued the following unregistered securities:
- 1.
- On
March 4, 2011, we issued and sold an aggregate of 3,610,873 shares of our Series E preferred stock at a price of $4.15412 per share, for
aggregate gross consideration of $14,999,999.78, to seven accredited investors. After taking into account the 1-for-2 reverse stock split effected on November 15, 2011,
these shares of Series E preferred stock converted into 1,805,435 shares of common stock upon the consummation of our initial public offering on November 23, 2011.
- 2.
- On
June 1, 2011, we issued a warrant to purchase 411,000 shares of our common stock at an exercise price of $8.30824 per share to Advanced Technology
Investment Company LLC or an aggregate of $3,414,686.64. The warrant was exercised in full by its holder in connection with the consummation of our initial public offering on
November 23, 2011.
- 3.
- On
June 14, 2011, we issued and sold an aggregate of 2,407,249 shares of our Series E preferred stock at a price of $4.15412 per share, for
aggregate gross consideration of $10,000,001.21, to one accredited investor. After taking into account the 1-for-2 reverse stock split effected on November 15, 2011,
these shares of Series E preferred stock converted into 1,203,624 shares of common stock upon the consummation of our initial public offering on November 23, 2011.
- 4.
- On
August 25, 2011, we issued a warrant to purchase 2,500 shares of our common stock at an exercise price of $0.20 per share to The Enterprise
Network. The warrant was exercised in full by its holder in connection with the consummation of our initial public offering on November 23, 2011.
- 5.
- Between
January 1, 2011 and December 31, 2011, we granted stock options to purchase 1,393,999 shares of our common stock at exercise prices
ranging from $6.20 to $11.96 per share to a total of 143 employees, consultants and directors under our 2004 Equity Incentive Plan.
- 6.
- Between
January 1, 2011 and December 31, 2011, we granted stock options to purchase 138,750 shares of our common stock at an exercise price of
$10.00 per share to a total of 19 employees under our 2011 Incentive Award Plan.
- 7.
- Between January 1, 2011 and December 31, 2011, we issued and sold an aggregate of 320,944 shares of our common stock to employees and consultants at prices ranging from $0.02 to $2.66 per share pursuant to the exercise of options granted under our 2004 Equity Incentive Plan.
48
The issuances of securities described above in paragraphs 1 - 4 were exempt from registration under the Securities Act of 1933, as amended, in reliance on Section 4(2) of the Securities Act of 1933, as amended, and Regulation D promulgated thereunder, as transactions by an issuer not involving any public offering. The purchasers of the securities in these transactions represented that they were accredited investors and that they were acquiring the securities for investment only and not with a view toward the public sale or distribution thereof. Such purchasers received written disclosures that the securities had not been registered under the Securities Act of 1933, as amended, and that any resale must be made pursuant to a registration statement or an available exemption from registration. All purchasers either received adequate financial statement or non-financial statement information about us or had adequate access, through their relationship with us, to financial statement or non-financial statement information about us. The sale of these securities was made without general solicitation or advertising.
The issuances of securities described above in paragraphs 5 - 7 were exempt from registration under the Securities Act of 1933, as amended, in reliance on Rule 701, Section 4(2) and Regulation S of the Securities Act of 1933, as amended, pursuant to compensatory benefit plans or agreements approved by the board of directors.
All certificates representing the securities issued in these transactions included appropriate legends setting forth that the securities had not been offered or sold pursuant to a registration statement and describing the applicable restrictions on transfer of the securities. There were no underwriters employed in connection with any of the transactions described above.
49
ITEM 6. SELECTED FINANCIAL DATA
The following selected consolidated financial data should be read together with our consolidated financial statements and accompanying notes and "Management's Discussion and Analysis of Financial Condition and Results of Operations" appearing elsewhere in this Form 10-K. The selected consolidated financial data in this section is not intended to replace our consolidated financial statements and the accompanying notes. Our historical results are not necessarily indicative of our future results.
We derived the consolidated statements of operations data for 2011, 2010 and 2009 and the consolidated balance sheets data as of December 31, 2011 and 2010 from our audited consolidated financial statements appearing elsewhere in this filing. The consolidated statements of operations data for 2008 and 2007 and the consolidated balance sheets data as of December 31, 2009, 2008 and 2007 have been derived from our audited consolidated financial statements not included in this filing. The data should be read in conjunction with the consolidated financial statements, related notes, and other financial information included herein.
| |
Years Ended December 31, | |||||||||||||||
|---|---|---|---|---|---|---|---|---|---|---|---|---|---|---|---|---|
| |
2011 | 2010 | 2009 | 2008 | 2007 | |||||||||||
| |
(in thousands, except share and per share amounts) |
|||||||||||||||
Consolidated Statement of Operations Data: |
||||||||||||||||
Revenue: |
||||||||||||||||
CDP and services revenue |
$ | 36,733 | $ | 27,705 | $ | 14,182 | $ | 14,647 | $ | 8,594 | ||||||
Product revenue |
2,717 | 6,959 | 9,065 | 6,206 | — | |||||||||||
Licensing and royalty revenue |
14,380 | 8,010 | 3,663 | 2,276 | — | |||||||||||
Total revenue |
53,830 | 42,674 | 26,910 | 23,129 | 8,594 | |||||||||||
Cost of revenue |
25,469 |
20,926 |
13,018 |
12,625 |
4,873 |
|||||||||||
Gross profit |
28,361 | 21,748 | 13,892 | 10,504 | 3,721 | |||||||||||
Operating expenses: |
||||||||||||||||
Research and development |
19,260 | 13,917 | 10,983 | 11,849 | 9,415 | |||||||||||
Sales and marketing |
4,285 | 4,074 | 3,211 | 3,849 | 1,541 | |||||||||||
General and administrative |
8,534 | 5,761 | 4,867 | 4,300 | 3,837 | |||||||||||
Total operating expenses |
32,079 | 23,752 | 19,061 | 19,998 | 14,793 | |||||||||||
Loss from operations |
(3,718 | ) | (2,004 | ) | (5,169 | ) | (9,494 | ) | (11,072 | ) | ||||||
Other income (expense): |
||||||||||||||||
Interest income (expense), net |
(87 | ) | 43 | (6 | ) | 174 | 850 | |||||||||
Other income (expense), net |
(26,167 | ) | 202 | (62 | ) | 6 | — | |||||||||
Total other income (expense), net |
(26,254 | ) | 245 | (68 | ) | 180 | 850 | |||||||||
Loss before provision for income taxes |
(29,972 | ) | (1,759 | ) | (5,237 | ) | (9,314 | ) | (10,222 | ) | ||||||
Provision for income taxes |
43 | 19 | 17 | 186 | 1 | |||||||||||
Net loss |
(30,015 | ) | (1,778 | ) | (5,254 | ) | (9,500 | ) | (10,223 | ) | ||||||
Accretion on redeemable convertible preferred stock |
(8,660 | ) | (14,162 | ) | (9,170 | ) | (5,436 | ) | (4,168 | ) | ||||||
Net loss attributable to common stockholders |
$ | (38,675 | ) | $ | (15,940 | ) | $ | (14,424 | ) | $ | (14,936 | ) | $ | (14,391 | ) | |
Net loss per share of common stock, basic and diluted |
$ | (3.99 | ) | $ | (2.86 | ) | $ | (2.62 | ) | $ | (2.97 | ) | $ | (3.17 | ) | |
Weighted-average number of shares used in computing net loss per share of common stock, basic and diluted |
9,698,880 | 5,567,286 | 5,511,889 | 5,024,118 | 4,542,762 | |||||||||||
Other Data: |
||||||||||||||||
Adjusted EBITDA (unaudited) |
$ | 6,367 | $ | 4,589 | $ | 272 | $ | (5,062 | ) | $ | (7,737 | ) | ||||
Adjusted earnings (unaudited) |
$ | (842 | ) | $ | (358 | ) | $ | (4,131 | ) | $ | (8,504 | ) | $ | (8,956 | ) | |
50
| |
Years Ended December 31, | |||||||||||||||
|---|---|---|---|---|---|---|---|---|---|---|---|---|---|---|---|---|
| |
2011 | 2010 | 2009 | 2008 | 2007 | |||||||||||
| |
(in thousands) |
|||||||||||||||
Consolidated Balance Sheet Data: |
||||||||||||||||
Cash, cash equivalents and short-term investments |
$ | 81,002 | $ | 23,064 | $ | 32,620 | $ | 40,902 | $ | 26,744 | ||||||
Working capital |
74,665 | 4,825 | 16,389 | 26,663 | 18,552 | |||||||||||
Total assets |
127,814 | 55,571 | 54,469 | 62,190 | 40,877 | |||||||||||
Long-term debt, including current portion |
27,318 | — | — | 4,445 | 3,194 | |||||||||||
Preferred stock warrant liability |
— | 215 | 159 | — | — | |||||||||||
Redeemable convertible preferred stock |
— | 55,633 | 55,633 | 55,633 | 35,738 | |||||||||||
Accumulated accretion of redeemable convertible preferred stock to redemption values |
— | 34,426 | 20,264 | 11,094 | 5,658 | |||||||||||
Total stockholders' equity (deficit) |
80,173 | (64,356 | ) | (49,889 | ) | (36,579 | ) | (22,706 | ) | |||||||
Non-GAAP Financial Measure
We believe that the use of adjusted EBITDA and adjusted earnings, both non-GAAP financial measures, are helpful for an investor in determining whether to invest in our common stock. We include both adjusted EBITDA and adjusted earnings in this Annual Report on Form 10-K because (i) we seek to manage our business to consistent levels of adjusted EBITDA and adjusted earnings, (ii) these measures are a key basis upon which our management assesses our operating performance, (iii) they are primary metrics investors use in evaluating companies' performance in our industry and (iv) they are factors in the evaluation of the performance of our management in determining compensation. We define adjusted EBITDA as net income (loss) less interest, provision for income taxes, depreciation and amortization expense, non-cash revenue adjustments as a result of common stock warrants issued to customers, derivative mark-to-market adjustments and stock-based compensation expense. We define adjusted earnings as net income (loss) less non-cash revenue adjustments as a result of common stock warrants issued to customers, derivative mark-to-market adjustments and stock-based compensation expense.
We use adjusted EBITDA as a key performance measure because we believe it facilitates operating performance comparisons from period to period by excluding potential differences caused by variations in capital structures, tax positions (such as the impact of changes in effective tax rates or fluctuations in permanent differences or discrete quarterly items), the impact of depreciation and amortization expense, the non-cash impact of common stock warrants issued to customers and the impact of stock-based compensation expense.
We believe adjusted EBITDA and similar measures are widely used by investors, securities analysts, ratings agencies and other interested parties in our industry as a measure of financial performance and debt-service capabilities. Our use of adjusted EBITDA has limitations as an analytical tool, and you should not consider it in isolation or as a substitute for analysis of our results as reported under GAAP. Some of these limitations are:
- •
- Adjusted EBITDA does not reflect our cash expenditures for capital equipment or other contractual commitments;
- •
- Although depreciation and amortization are non-cash charges, the assets being depreciated and amortized may
have to be replaced in the future, and adjusted EBITDA does not reflect cash capital expenditure requirements for such replacements;
- •
- Adjusted EBITDA does not reflect changes in, or cash requirements for, our working capital needs;
51
- •
- Adjusted EBITDA does not reflect the significant interest expense or the cash requirements necessary to service interest
or principal payments on our indebtedness;
- •
- Adjusted EBITDA does not reflect certain tax payments that may represent a reduction in cash available to us; and
- •
- Other companies, including companies in our industry, may calculate adjusted EBITDA measures differently, which reduces their usefulness as a comparative measure.
We also believe adjusted earnings and similar measures are also widely used by investors, securities analysts, ratings agencies and other interested parties in our industry as a measure of financial performance and debt-service capabilities. Our use of adjusted earnings has limitations as an analytical tool, and you should not consider it in isolation or as a substitute for analysis of our results as reported under GAAP. Some of these limitations are:
- •
- Adjusted earnings do not reflect our cash expenditures for capital equipment or other contractual commitments;
- •
- Adjusted earnings do not reflect changes in, or cash requirements for, our working capital needs; and
- •
- Other companies, including companies in our industry, may calculate adjusted earnings measures differently, which reduces their usefulness as a comparative measure.
Because of these limitations, adjusted EBITDA and adjusted earnings should not be considered as a measure of discretionary cash available to us to invest in the growth of our business. When evaluating our performance, you should consider adjusted EBITDA and our adjusted earnings alongside other financial performance measures, including our net loss and other GAAP results.
The following tables present a reconciliation of adjusted EBITDA and our adjusted earnings to our net loss, the most comparable GAAP measure, for each of the periods indicated:
| |
Years Ended December 31, | |||||||||||||||
|---|---|---|---|---|---|---|---|---|---|---|---|---|---|---|---|---|
Adjusted EBITDA:
|
2011 | 2010 | 2009 | 2008 | 2007 | |||||||||||
| |
(in thousands) |
|||||||||||||||
Net loss |
$ | (30,015 | ) | $ | (1,778 | ) | $ | (5,254 | ) | $ | (9,500 | ) | $ | (10,223 | ) | |
Non-GAAP adjustments: |
||||||||||||||||
Revenue(1) |
312 | — | — | — | 519 | |||||||||||
Interest, net |
641 | 13 | 48 | (94 | ) | (850 | ) | |||||||||
Provision for taxes |
43 | 19 | 17 | 186 | 1 | |||||||||||
Depreciation and amortization |
7,079 | 4,971 | 4,380 | 3,430 | 2,105 | |||||||||||
Mark-to-market derivative liability |
25,865 | — | — | — | — | |||||||||||
Stock-based compensation expense(2) |
2,442 | 1,364 | 1,081 | 916 | 711 | |||||||||||
Adjusted EBITDA |
$ | 6,367 | $ | 4,589 | $ | 272 | $ | (5,062 | ) | $ | (7,737 | ) | ||||
52
| |
Years Ended December 31, | |||||||||||||||
|---|---|---|---|---|---|---|---|---|---|---|---|---|---|---|---|---|
Adjusted Earnings
|
2011 | 2010 | 2009 | 2008 | 2007 | |||||||||||
| |
(in thousands) |
|||||||||||||||
Net loss |
$ | (30,015 | ) | $ | (1,778 | ) | $ | (5,254 | ) | $ | (9,500 | ) | $ | (10,223 | ) | |
Non-GAAP adjustments: |
||||||||||||||||
Revenue(1) |
312 | — | — | — | 519 | |||||||||||
Interest expense (preferred stock warrant mark-to-market) |
554 | 56 | 42 | 80 | 37 | |||||||||||
Mark-to-market derivative liability |
25,865 | — | — | — | — | |||||||||||
Stock-based compensation expense(2) |
2,442 | 1,364 | 1,081 | 916 | 711 | |||||||||||
Adjusted earnings |
$ | (842 | ) | $ | (358 | ) | $ | (4,131 | ) | $ | (8,504 | ) | $ | (8,956 | ) | |
- (1)
- Reduction
in revenue as a result of common stock warrants issued in connection with a customer agreement
- (2)
- Includes stock-based compensation as follows:
| |
Years Ended December 31, | |||||||||||||||
|---|---|---|---|---|---|---|---|---|---|---|---|---|---|---|---|---|
| |
2011 | 2010 | 2009 | 2008 | 2007 | |||||||||||
| |
(in thousands) |
|||||||||||||||
Cost of revenues |
$ | 622 | 285 | $ | 134 | $ | 71 | $ | 81 | |||||||
Research and development |
462 | 204 | 222 | 170 | 192 | |||||||||||
Sales and marketing |
770 | 422 | 378 | 408 | 256 | |||||||||||
General and administrative |
588 | 453 | 347 | 267 | 182 | |||||||||||
Total stock-based compensation |
$ | 2,442 | 1,364 | $ | 1,081 | $ | 916 | $ | 711 | |||||||
53
ITEM 7. MANAGEMENT'S DISCUSSION AND ANALYSIS OF FINANCIAL CONDITION AND RESULTS OF OPERATIONS
The following discussion and analysis should be read in conjunction with our audited consolidated financial statements and the related notes that appear elsewhere in this Annual Report on Form 10-K. This Annual Report on Form 10-K contains "forward-looking statements" within the meaning of Section 21E of the Securities Exchange Act of 1934, as amended, or the Exchange Act. These statements are often identified by the use of words such as "may," "will," "expect," "believe," "anticipate," "intend," "could," "should," "estimate," or "continue," and similar expressions or variations. Such forward-looking statements are subject to risks, uncertainties and other factors that could cause actual results and the timing of certain events to differ materially from future results expressed or implied by such forward-looking statements. Factors that could cause or contribute to such differences include, but are not limited to, those discussed in the section titled "Risk Factors," set forth in Part I, Item 1A of this Annual Report on Form 10-K and elsewhere in this report. The forward-looking statements in this Annual Report on Form 10-K represent our views as of the date of this Annual Report on Form 10-K. We anticipate that subsequent events and developments will cause our views to change. However, while we may elect to update these forward-looking statements at some point in the future, we have no current intention of doing so except to the extent required by applicable law. You should, therefore, not rely on these forward-looking statements as representing our views as of any date subsequent to the date of this Annual Report on Form 10-K.
Overview
We have pioneered a proprietary approach to accelerate research and development, innovation and time-to-market for the semiconductor and clean-energy industries. Using our approach, we develop technology and intellectual property (IP) focused on advanced materials, processes, integration and device architectures in collaboration with our customers. This technology enables our customers to bring optimized, high-volume manufacturing-ready integrated devices to market faster and with less risk than traditional approaches to research and development (R&D). We provide our customers with proprietary technology through various fee arrangements and grant them rights to associated IP, primarily through royalty-bearing licenses. Our proprietary approach is broadly applicable to high-volume integrated device markets, which include semiconductors, flat glass coatings and glass-based devices, solar cells, light-emitting diodes (LEDs), flat-panel displays, advanced batteries and other energy-efficient technologies.
We currently target large, high-volume semiconductor and high-growth emerging clean-energy markets, including DRAM, flash memory, complex logic, flat glass, solar cells, LEDs and energy-efficient technologies. Within these broad markets, we target customers that have track records of technological innovation, deploy significant resources and are pursuing technical advancements that are critical to their success and strategy, including ATMI, Elpida Memory, GLOBALFOUNDRIES, Guardian Industries, SanDisk, Taiwan Semiconductor Manufacturing Company (TSMC) and Toshiba. ATMI and Elpida have commenced shipping products incorporating technology developed through our collaborative development programs (CDPs) and pay us licensing and royalty fees. To date, we have received the majority of our revenue from customers in DRAM, flash memory, complex logic and energy-efficient applications in flat glass coatings and glass-based devices, and have not yet received a material amount of revenue from customers in solar cells, LEDs and other energy-efficient technologies.
We were founded in 2004 and are headquartered in San Jose, California. Our total revenue increased to $53.8 million for the year ended December 31, 2011 from $42.7 million for the year ended December 31, 2010. Our backlog as of December 31, 2011 was $85.6 million, of which $47.2 million is scheduled to be recognized as revenue during 2012, and $38.4 million is scheduled to be recognized as revenue in future periods beyond 2012. Our adjusted EBITDA for the year ended December 31, 2011 was $6.4 million. Our net loss increased to $30.0 million for the year ended December 31, 2011 from $1.8 million from the year ended December 31, 2010. Our net loss in 2011 included a mark-to-market
54
related charge recorded in other income (expense), net in the amount of $25.9 million related to our purchase of our intellectual property from Symyx. Since inception, we have incurred net losses leading to an accumulated deficit of $100.5 million as of December 31, 2011. During February 2012, one of our significant customers, Elpida, filed for protection under the Corporate Reorganization Act in Japan, and our revenue from Elpida may decline as a result. For example, as part of any restructuring under this Act, our CDP services revenue may be reduced or even eliminated, and Elpida may either voluntarily or involuntarily reduce or eliminate payments owed to us or shipments of products that include our licensed technology. As of December 31, 2011 we had $17.8 million in backlog from Elpida, of which $8.8 million is to be recognized during 2012 with the balance to be recognized in periods beyond 2012.
How We Generate Revenue
Our business model aligns our interests with those of our customers as we collaborate to develop proprietary technology and IP for high-volume integrated devices through CDPs. As such, our customer engagement process generates revenue in three ways: CDP and services revenue; product revenue; and licensing and royalty revenue. CDPs are our primary engagement model with customers and are structured to result in licensing and royalty revenue. When we initially engage with a customer, we generate revenue from micro-CDPs, CDPs and licensing of our HPC platform. When technology developed through CDPs is incorporated in our customers' commercialized products, we generate licensing and royalty revenue. In certain cases, we sell HPC processing tools to our customers who pay a recurring license fee to operate those tools with our combinatorial processing capabilities.
| |
Years Ended December 31, | |||||||||
|---|---|---|---|---|---|---|---|---|---|---|
| |
2011 | 2010 | 2009 | |||||||
| |
(in thousands) |
|||||||||
Revenue: |
||||||||||
CDP and services revenue |
$ | 36,733 | $ | 27,705 | $ | 14,182 | ||||
Product revenue |
2,717 | 6,959 | 9,065 | |||||||
Licensing and royalty revenue |
14,380 | 8,010 | 3,663 | |||||||
Total revenue |
$ | 53,830 | $ | 42,674 | $ | 26,910 | ||||
- •
- CDP and services revenue. CDP revenue includes payments
for full time equivalent (FTE) employees, milestone payments, subscription payments for dedicated and shared workflow tools used in the CDP, reimbursed payments for consumables and outside services
from third parties. Individual CDPs typically range from one to three years. Services revenue outside of CDPs is substantially comprised of support and maintenance fees and extended warranty
agreements.
- •
- Product revenue. Product revenue consists of sales of our
workflow hardware and embedded software. In support of our business strategy, we selectively sell our proprietary tools to increase opportunities for CDPs and licensing fees and royalties.
Historically, we have not sold a significant number of our workflow products and we do not anticipate selling a significant number in the future. As our other revenue streams increase we expect our
product revenue to decrease as a percentage of our overall revenue. Product sales that originated prior to January 1, 2011 are generally recognized on a straight-line basis over the
maintenance period once delivery has occurred (title and risk of loss have passed to the customer), and customer acceptance, if required, has been achieved.
- •
- Licensing and royalty revenue. Licensing and royalty revenue consists of licensing fees and royalties for granting our customers rights to our proprietary technology and IP. Specifically, this includes licensing the HPC capabilities of our workflows, licensing our informatics and analysis software and licensing fees and royalties on products commercialized by our customers that incorporate technology developed through our CDPs. In the last three years, licensing and
55
royalty revenue has been the fastest growing element of our revenue. Over the long term, we expect licensing and royalty revenue to be an increasing and significant component of our revenue.
Our revenue growth has been primarily driven by the adoption of our collaboration model and HPC platform leading to both new CDPs and the ramp of licensing and royalty revenue from products commercialized by our customers that incorporate technology developed through our CDPs. Successful CDPs result in the commercialization of products whereby we receive licensing fees and royalties over the course of the respective product cycles. Certain of our semiconductor customers have already commenced shipping products incorporating technology developed through our CDPs, which generate associated licensing and royalty revenue. Our revenue mix may vary from quarter to quarter as we enter into new CDPs and related customer arrangements, existing CDPs are completed or expanded and licensing and royalty arrangements generate revenue.
Prior to entering into a new CDP, we negotiate licensing fees and royalty rates for technology to be developed in CDPs. The fees and rates are negotiated with each customer on the basis of multiple factors including the size of the servable market of the technology to be developed, the value contribution of the technology to the customer's product, and the anticipated overall margin structure of the customer's product. Licensing fees and royalty rates are set for each CDP-developed technology. While royalty rates vary, when working with device manufacturers, we typically target 1-2% of their projected end-product revenue for each CDP-developed technology. When working with suppliers to device manufacturers, we typically target higher royalty rates depending on the anticipated value contribution of the technology to their product. Licensing fees and royalty rates are structured in a variety of ways including fixed quarterly fees, percentage of revenue and fee per product.
Our proprietary platform was initially created to address critical development challenges in the semiconductor industry and we began generating revenue in 2006. The applicability of our platform to address similar challenges in adjacent vertical markets such as clean-energy markets has created, and we believe will continue to create, new market opportunities for us. We began generating revenue from customers in the clean-energy industry during the year ended December 31, 2010, and continued to generate revenue from customers in the clean-energy industry in 2011. We believe collaborating with companies in the clean-energy industry will accelerate the long-term growth of our business. The following table sets forth our revenue by customer end market:
| |
Years Ended December 31, | |||||||||
|---|---|---|---|---|---|---|---|---|---|---|
| |
2011 | 2010 | 2009 | |||||||
| |
(in thousands) |
|||||||||
Semiconductor |
$ | 49,655 | $ | 40,678 | $ | 26,910 | ||||
Clean energy |
4,175 | 1,996 | — | |||||||
Total |
$ | 53,830 | $ | 42,674 | $ | 26,910 | ||||
Key Financial Metrics
We monitor the key financial metrics set forth below to help us evaluate growth trends, establish budgets, measure the effectiveness of our sales and marketing efforts, manage our human resources and assess operational efficiencies.
Revenue growth and mix. We monitor revenue from CDPs for existing and new customers, applications and the resulting licensing fees and royalties. As our customer engagements progress, we expect licensing and royalty revenue to be an increasing and significant component of our revenue. We are broadening our development and sales efforts by expanding CDPs in the semiconductor industry resulting from the adoption of our HPC platform for technology development and engaging in CDPs with companies in the clean-energy industry as we believe this will accelerate the future growth of our business.
56
Backlog. We monitor our backlog as it represents the aggregate value of contracted business not yet recognized. Our backlog consists of future revenue that our customers are contractually committed to pay in our CDPs and guaranteed licensing and royalty revenue for our developed technology and intellectual property. Our backlog as of December 31, 2011 was $85.6 million, of which $47.2 million is scheduled to be recognized as revenue during 2012, and $38.4 million is scheduled to be recognized as revenue in future periods beyond 2012.
Adjusted EBITDA. We monitor our adjusted EBITDA to measure the profitability of our business. We use adjusted EBITDA as a key performance measure because we believe it facilitates operating performance comparisons from period to period by excluding potential differences caused by variations in capital structures, tax positions (such as the impact of changes in effective tax rates or fluctuations in permanent differences or discrete quarterly items), the impact of depreciation and amortization expense, the non-cash impact of the mark-to-market of our derivative liability as a result of the Symyx asset purchase transaction and common stock warrants issued to customers and the impact of stock-based compensation expense. See "Selected Consolidated Financial Data—Non-GAAP Financial Measure" for a reconciliation of adjusted EBITDA to our net income (loss), the most comparable GAAP measure.
Adjusted earnings. We monitor our adjusted earnings to measure the profitability of our business. We use adjusted earnings as a performance measure because we believe it facilitates operating performance comparisons from period to period by excluding potential differences caused by variations in capital structures, the non-cash impact of the mark-to-market of our derivative liability as a result of the Symyx asset purchase transaction and common stock warrants issued to customers and the impact of stock-based compensation expense. See "Selected Consolidated Financial Data—Non-GAAP Financial Measure" for a reconciliation of our adjusted earnings to our net income (loss), the most comparable GAAP measure.
Factors Affecting our Performance
Reliance on our customers' success. Our success is tied to our customers' ability to successfully commercialize the products that incorporate technology developed through CDPs. We believe that we significantly improve our customers' ability to succeed in their end markets, but if they are unable to do so, the longer-term licensing and royalty revenue that we expect may be delayed or may not materialize. We attempt to manage this risk by carefully selecting projects and only participating in opportunities that we deem to have significant potential for long-term success.
Exposure to semiconductor memory and solar power end markets. Our performance is linked to the end markets in which our customers operate. Certain of these markets, such as the semiconductor memory markets and the solar panel market, have historically shown significant price volatility as a result of imbalances in supply and demand. As such, these markets have been traditionally challenging for participants. We attempt to manage this end market risk by participating in multiple end markets and by selecting customers that we believe will be successful in those markets.
Revenue mix and royalty rates. Our revenue from CDPs and product sales vary from contract to contract depending on the customer's requirements and the scope of the collaboration. The gross profit from CDPs and product sales may vary based on the size and scope of the contract. Our royalty rates vary from contract to contract depending on multiple factors, including the industry, the scope of our collaboration, and the degree to which our IP is central to the development of a given product. Individual royalty opportunities vary depending on the end market size and the duration of the specific end product life cycle. The gross profit from licensing and royalty revenue may vary based on the size and scope of the contract. We target an average gross margin contribution that is consistent across the industries and end markets we serve.
57
Long sales cycles. Our sales cycles are long, and we commit significant resources to and incur significant expenses for a project before a potential customer commits to use our HPC platform or CDPs. To be successful, we must establish contact with potential customers, often with senior management or executive officers, and educate them about the benefits of our HPC platform. Our sales cycles to date have typically ranged from 9 to 24 months and may be even longer in the future. Investment of time and resources in a particular customer engagement that does not ultimately result in material revenue will adversely affect our revenue and results of operations.
Customer concentration. Due to the concentrated nature of manufacturers in the DRAM, flash memory and complex logic markets, our revenue is and may continue to be concentrated to key high-volume customers. For example, our five largest customers in the year ended December 31, 2011, all of which are in the semiconductor industry, accounted for 83% of our revenue. We believe there is an opportunity to expand our engagements with these customers into new applications over time. In addition, because our platform is broadly applicable to semiconductors, flat glass, solar cells, LEDs, flat-panel displays, advanced batteries and other energy-efficient technologies, we believe we have significant opportunities to engage with a broad range of customers.
Related Party Transactions. Some of our customers and other business partners hold a significant stake in our capital stock. Related party transactions disclosed in our financial statements accounted for $21.0 million and $26.0 million, or 39.0% and 61.0%, respectively, of our revenue for the years ended December 31, 2011 and 2010. ATMI, which beneficially owns approximately 9.1% of our capital stock as of December 31, 2011, accounted for $15.8 million and $22.1 million, or 29.3% and 51.8%, respectively, of our revenue for the years ended December 31, 2011 and 2010. We believe that the transactions and agreements that we have entered into with related parties are on terms that are at least as favorable as could reasonably have been obtained at such time from third parties. However, these relationships could create, or appear to create, potential conflicts of interest when our board of directors is faced with decisions that could have different implications for us and our related parties or their affiliates. In addition, conflicts of interest may arise between us and our related parties and their affiliates. The appearance of conflicts, even if such conflicts do not materialize, might adversely affect the public's perception of us, as well as our relationship with other companies and our ability to enter into new relationships in the future, including new CDPs with competitors of such related parties, which could have a material adverse effect on our ability to do business.
Warrants Issued in Connection with a CDP
In March 2010, in connection with a CDP, we issued contingent warrants to two customers to purchase an aggregate of up to 822,368 shares of our common stock at a cash exercise price of $6.08288 per share. The exercise price was equal to the price of the then-most recent sale of preferred stock. These warrants become exercisable for four months after an election by the holders to license technology developed through the associated CDP. If either of the customers elect to license this technology, we will record a one-time, non-cash charge based on the fair value of these warrants as measured on the date of election against any revenue derived from these agreements. The fair value will be determined using the Black-Scholes option pricing model and may be significant. This election is available to the customers initially through May 2012, but the election period may be extended for up to an additional two years if the customers extend the CDP.
In June 2011, in connection with a CDP, we issued a fully vested and exercisable warrant to a customer to purchase 411,000 shares of our common stock at a cash exercise price of $8.30824 per share. The exercise price was equal to the price of the then-most recent sale of preferred stock. This warrant was fully exercised in connection with our initial public offering in November 2011. The fair value of the warrant as measured on the date of grant using the Black-Scholes options pricing model was $312,000 and was recognized as a reduction of revenue derived from the agreement during the year ended December 31, 2011.
58
Cost of Revenue and Operating Expenses
Cost of Revenue
The following table sets forth our cost of revenue by revenue category:
| |
Years Ended December 31, | |||||||||
|---|---|---|---|---|---|---|---|---|---|---|
| |
2011 | 2010 | 2009 | |||||||
| |
(in thousands) |
|||||||||
Cost of revenues: |
||||||||||
Cost of CDP and services revenue |
$ | 23,761 | 16,855 | $ | 8,849 | |||||
Cost of product revenue |
953 | 3,665 | 3,972 | |||||||
Cost of licensing and royalty revenue |
755 | 406 | 197 | |||||||
Total cost of revenues |
$ | 25,469 | 20,926 | $ | 13,018 | |||||
Our cost of revenue is variable and depends on the product mix and type of revenue earned in each period relating to our customer programs. As customers commercialize products that incorporate technology developed through our CDPs, we expect our cost of revenue to decrease as a percentage of total revenue as licensing and royalty revenue become an increasing component of our revenue. As a result of the Symyx asset purchase transaction the amortization of acquired patents is being recorded in cost of revenue.
- •
- Cost of CDP and services revenue. Our cost of CDP and
services revenue is primarily comprised of salaries and other personnel-related expenses (including stock-based compensation) for our collaborative research and development scientists, engineers and
development fab process operations employees. Additionally, our cost of revenue includes costs of wafers, targets, materials, program-related supplies and depreciation of equipment used in CDPs.
- •
- Cost of product revenue. Our cost of product revenue
primarily includes our cost of products sold. Our cost of product revenue will fluctuate based on the type of product and configuration sold. Historically, we have not sold a significant number of our
workflow products and we do not anticipate selling a significant number in the future. Our cost of product revenue is recognized in a similar manner as the corresponding product revenue and is
generally recognized on a straight-line basis over the maintenance period for product sales that originated prior to January 1, 2011. The variability in cost of product revenue as a
percentage of revenue is related to the quantity and configuration of products sold during the period and the corresponding maintenance period that product revenue and cost of product revenue is being
recognized.
- •
- Cost of licensing and royalty revenue. Our cost of licensing and royalty revenue includes license fees paid to Symyx. As part of the completion of the Symyx asset purchase transaction in November 2011 in connection with our initial public offering, we will no longer have an obligation to pay licensing fees to Symyx for any period on or after January 1, 2012.
Research and Development
Our R&D expenses consist of costs incurred for development and continuous improvement of our HPC platform, expansion of software capabilities and application research and development that are not associated with customer programs. R&D costs include personnel-related expenses (including stock-based compensation expenses), for our technical staff as well as consultant costs, parts and prototypes, wafers, chemicals, supply costs, facilities costs, utilities costs related to laboratories and offices occupied by technical staff, depreciation on equipment used by technical staff, and outside services, such as machining and third-party R&D costs. Overhead costs that are not allocated to a customer program are recognized as expenses within R&D. We expect our R&D expenses will continue to increase for the foreseeable future as we continue to devote substantial internal resources to develop and improve our HPC platform and extend the applicability of our platform to a broader set of applications within the industries we serve.
59
Sales and Marketing
Our sales and marketing expenses consist primarily of personnel-related costs (including stock-based compensation) for our sales and marketing employees, as well as payments of commissions to our sales employees, facility costs and professional expenses. Professional expenses consist of external website and marketing communication consulting costs and market research. We expect that our sales and marketing expenses will continue to increase for the foreseeable future as we increase the number of our sales and marketing employees to support the growth in our business and as we incur external marketing communication costs.
General and Administrative
General and administrative expenses consist primarily of personnel-related costs (including stock-based compensation) as well as professional services and facilities costs related to our executive, finance, legal, human resources, management information systems and information technology functions. Professional services consist of outside accounting, information technology, consulting and legal costs.
Following the consummation of this offering, we expect to incur significant additional accounting and legal costs related to compliance with rules and regulations enacted by the Securities and Exchange Commission, including the additional costs of achieving and maintaining compliance with Section 404 of the Sarbanes-Oxley Act, as well as additional insurance, investor relations and other costs associated with being a public company. In addition to these expenses, we expect that our general and administrative expenses will continue to increase for the foreseeable future.
Interest Income (Expense), net
Interest income, net represents interest earned on our cash, cash equivalents and short-term investments. We expect interest income will vary each reporting period depending on our average investment balances during the period and market interest rates.
Interest expense consists of interest accrued or paid on lines of credit outstanding. We expect interest expense to increase in 2012 as a result of our issuance of the 2-year, $27.3 million promissory note to Symyx in connection with the closing of the Symyx asset purchase transaction that closed in November 2011.
Other Income (Expense), net
Other income consists of municipal economic development grant proceeds received during the year ended December 31, 2010. Other income (expense), net also consists of the change in fair value of our preferred stock warrants and derivative liability and other income. Prior to the exercise of the preferred stock warrant we issued in connection with a line of credit, we had classified the warrant as a liability and remeasured it to fair value at each balance sheet date with the corresponding gain or loss from the adjustment recorded as other income (expense), net. Following the exercise of the warrant in connection with our initial public offering in November 2011, the warrant will no longer be remeasured at each balance sheet date. In connection with entering into the Symyx asset purchase transaction we recorded a derivative liability representing the value of the guaranteed return to Symyx and reimbursement of 50% of the underwriting discounts and commissions payable in connection with our initial public offering. We adjusted the fair value of the derivative liability to market value at each balance sheet date with the final remeasurement occurring upon the consummation of our initial public offering that closed in November 2011 with the change in the market value of the derivative liability recorded in other income (expense), net.
60
Provision for Income Taxes
We are subject to taxes in the United States as well as other tax jurisdictions or countries in which we conduct business. Earnings from our non-U.S. activities are subject to local country income tax and may be subject to current U.S. income tax. To date, we have incurred net losses and have not recorded any U.S. federal income tax benefits as these losses have been offset by valuation allowances. As of December 31, 2011, we had net operating loss carryforwards for federal and state income tax purposes of approximately $26.7 million and $29.9 million, respectively, to offset future taxable income. In addition, we had $3.5 million in U.S. federal R&D credit and $3.5 million in California R&D credit carryforwards to offset future income tax liabilities. Our ability to use our net operating loss carryforwards to offset future taxable income and our ability to use our tax credit carryforwards to offset future income tax liabilities may be subject to certain limitations arising from "ownership changes" within the meaning of Section 382 of the Internal Revenue Code.
Critical Accounting Policies and Estimates
Our consolidated financial statements have been prepared in conformity with generally accepted accounting principles in the United States and include our accounts and the accounts of our wholly-owned subsidiaries. The preparation of our consolidated financial statements requires our management to make estimates, assumptions and judgments that affect the reported amounts of assets and liabilities and disclosures for contingent assets and liabilities as of the date of the financial statements, and the reported amounts of revenue and expenses during the applicable periods. Management bases its estimates, assumptions and judgments on historical experience and on various other factors that are believed to be reasonable under the circumstances. Different assumptions and judgments would change the estimates used in the preparation of our consolidated financial statements which, in turn, could change the results from those reported. Our management evaluates its estimates, assumptions and judgments on an ongoing basis.
The critical accounting policies requiring estimates, assumptions and judgments that we believe have the most significant impact on our consolidated financial statements are described below.
Revenue Recognition
We generate revenue from three principal sources: CDPs and other services, which also includes other R&D services and product maintenance and support; product sales; and technology licensing and royalty fees. It is possible for our customers to work with us across multiple areas of our business, and certain of our customer arrangements involve the delivery or performance of multiple products, services or licenses. For example, product sale arrangements include product maintenance and support, and CDPs and other R&D services include licensing of technology and may also include sales of products. When there are multiple elements of deliverables in a contract entered into or modified on or prior to December 31, 2010, we identify all deliverables and allocate revenue among all of the undelivered elements, which might include CDP and other services revenue, product revenue and licensing and royalty revenue, based on objective and reliable evidence of fair value for any such element. In the event that vendor-specific objective evidence does not exist, revenue will be recognized over the term of the agreement and will be allocated among the deliverables based on the relative stated invoice price for the elements. In an arrangement that includes software that is more than incidental to the products or services as a whole, we recognize revenue from the software and software-related elements, as well as any non-software deliverable(s) for which a software deliverable is essential to its functionality, in accordance with the authoritative guidance on software revenue recognition. For transactions originating during 2011 see "Adoption of new accounting standard for revenue recognition."
CDP and services revenue. We enter into CDPs with customers under which we conduct R&D activities jointly with the customer. These agreements specify minimum levels of research effort
61
required to be performed by us. Payments received under the agreements are not refundable if the research effort is not successful. Historically, we have not provided any refunds under these arrangements.
We retain rights to certain elements of technology developed during the course of performance, which the customer has an option to license in the future under the terms defined in the agreement. We typically recognize revenue from these arrangements on a time and materials basis. Most arrangements with customers have fixed monthly fees and requirements to provide regular reporting of R&D activities performed. Payments received prior to performance are deferred and recognized as revenue when earned over future performance periods.
Product maintenance and support services revenue is included in CDP and services revenue. These services entitle customers to receive product updates and enhancements or technical support and maintenance, depending on the offering. The related revenue is recognized ratably over the period the services are delivered. We do not have vendor-specific objective evidence of selling price for our product maintenance and support services.
Product revenue. We recognize revenue from the sale of products generally on a straight line basis over the maintenance period once delivery has occurred (title and risk of loss have passed to the customer), and customer acceptance, if required, has been achieved. We have determined that the software included with its equipment products is more than incidental to the product as a whole. We do not have vendor-specific objective evidence of selling price for our products.
Licensing and royalty revenue. We recognize revenue for licenses to IP when earned pursuant to the terms of the agreements. Time-based license revenue is recognized ratably over the license term. License and royalty revenue that becomes triggered by specific customer actions, such as exercise of a license option or by sales volume, is recognized when they occur based on royalty reports or other information received from the licensee, generally one quarter in arrears. Minimum and prepaid royalties and license fees are recognized ratably over the related periods.
Adoption of new accounting standard for revenue recognition. In October 2009, the Financial Accounting Standards Board (FASB) issued a new accounting standard which excludes from the scope of software revenue guidance the revenue arrangements which include tangible products that contain software components and non-software components that function together to deliver the tangible product's essential functionality. At the same time, the FASB also issued another accounting standard which changes the requirements for establishing separate units of accounting in a multiple-element arrangement and requires the allocation of arrangement consideration to each deliverable to be based on its relative selling price. The new standards are effective prospectively for revenue arrangements entered into or materially modified in fiscal years beginning on or after June 15, 2010. We adopted the new standards commencing on January 1, 2011 and therefore applied such standards against all arrangements entered into or modified on or after January 1, 2011. The adoption did not have a material impact on our consolidated financial condition, operating revenue, results of operations or cash flows for the year ended December 31, 2011 as there were no multiple-element arrangements that included the sale of products that originated and had performance obligations during the period. The adoption of this standard may impact future revenue recognition for multiple-element arrangements where product maintenance and support and time-based licenses are the only undelivered elements. The impact of adopting these provisions will result in more product revenue recognized in earlier periods than would otherwise have been the case prior to adoption, as we allocate revenue using the relative selling price method as opposed to recognizing all revenue from the arrangement ratably over the longer of the product maintenance and support term or license period.
62
Stock-Based Compensation
We recognize compensation costs related to stock options and shares of restricted stock granted to employees based on the estimated fair value of the awards on the date of grant, net of estimated forfeitures. We estimate the grant date fair value, and the resulting stock-based compensation expense, using the Black-Scholes option-pricing model. The grant date fair value of the stock-based awards is generally recognized on a straight-line basis over the requisite service period, which is generally the vesting period of the respective awards.
The fair value of the awards granted are calculated using the Black-Scholes option valuation model, which requires the use of highly subjective and complex assumptions which determine the fair value of share-based awards, including the expected term and the price volatility of the underlying stock. These assumptions include:
Expected Term. The expected term represents the period that the stock-based awards are expected to be outstanding. For option grants that are considered to be "plain vanilla," we used the simplified method to determine the expected term as provided by the SEC. The simplified method calculates the expected term as the average of the time-to-vesting and the contractual life of the options.
Expected Volatility. The expected volatility is derived from historical volatilities of several unrelated, publicly listed peer companies over a period approximately equal to the expected term of the award because we have limited information on the volatility of our common stock since we have no trading history. When making the selections of our industry peer companies to be used in the volatility calculation, we considered the size, operational and economic similarities to our principal business operations.
Expected Dividend Rate. The expected dividend rate was assumed to be zero as we have never paid dividends and have no current plans to do so.
Risk-Free Interest Rate. The risk-free interest rate is based on the U.S. Treasury yield in effect at the time of grant for zero coupon U.S. Treasury notes with maturities approximately equal to the expected term of the awards.
In addition to the assumptions used in the Black-Scholes option-pricing model, we must also estimate a forfeiture rate to calculate the stock-based compensation for our awards. Our forfeiture rate is based on an analysis of our actual forfeitures. We will continue to evaluate the appropriateness of the forfeiture rate based on actual forfeiture experience, analysis of employee turnover and other factors. Quarterly changes in the estimated forfeiture rate can have a significant impact on our stock-based compensation expense as the cumulative effect of adjusting the rate is recognized in the period the forfeiture estimate is changed. If a revised forfeiture rate is higher than the previously estimated forfeiture rate, an adjustment is made that will result in a decrease to the stock-based compensation expense recognized in the financial statements. If a revised forfeiture rate is lower than the previously estimated forfeiture rate, an adjustment is made that will result in an increase to the stock-based compensation expense recognized in the financial statements.
We will continue to use judgment in evaluating the expected volatility, expected terms and forfeiture rates utilized for our stock-based compensation calculations on a prospective basis. As we continue to accumulate additional data related to our common stock and stock option exercises, we may have refinements to the estimates of our expected volatility, expected terms and forfeiture rates, which could materially impact our future stock-based compensation expense.
In valuing our common stock equity grants prior to our initial public offering in November 2011, we determined a business enterprise value of our company by taking a weighted combination of the enterprise values calculated under two valuation approaches, an income approach and a market
63
approach. The income approach estimates the present value of future estimated cash flows, based upon forecasted revenue and costs. These future cash flows are discounted to their present values using a discount rate which is derived from an analysis of the cost of capital of comparable publicly traded companies in the same industry or similar lines of business as of each valuation date and is adjusted to reflect the risks inherent in the projected cash flows. The market approach estimates the fair value of a company by applying market multiples of comparable publicly traded companies in the same industry or similar lines of business which are based on key metrics implied by the enterprise values or acquisition values of the comparable publicly traded companies. The results of the income approach and the market approach were then weighted evenly to determine the fair value of our business. This fair value was then allocated to each of our classes of stock according to assumptions made by our board of directors regarding the likelihood of various liquidity events and an analysis of the rights and preferences of our various securities.
As of December 31, 2011 we had $5.8 million of unrecognized stock-based compensation expense, net of estimated forfeitures, that is expected to be recognized over a weighted average period of 3.1 years. In future periods, our stock-based compensation expense is expected to increase as a result of our existing unrecognized stock-based compensation to be recognized as these awards vest and as we issue additional stock-based awards to attract and retain employees.
The intrinsic value of all outstanding options as of December 31, 2011 was $50.5 million based on the $8.58 per share closing sale price for our common stock on December 30, 2011, which was the last trading day of 2011.
Results of Operations
Comparison of the Years Ended December 31, 2011 and 2010
| |
Years Ended December 31, | |
|
||||||||||
|---|---|---|---|---|---|---|---|---|---|---|---|---|---|
| |
2011 | 2010 | $ Change | % Change | |||||||||
| |
|
(in thousands) |
|
|
|||||||||
Revenue: |
|||||||||||||
CDP and services revenue |
$ | 36,733 | $ | 27,705 | $ | 9,028 | 33 | % | |||||
Product revenue |
2,717 | 6,959 | (4,242 | ) | (61) | % | |||||||
Licensing and royalty revenue |
14,380 | 8,010 | 6,370 | 80 | % | ||||||||
Total revenue |
53,830 | 42,674 | 11,156 | 26 | % | ||||||||
Cost of revenue |
25,469 | 20,926 | 4,543 | 22 | % | ||||||||
Gross profit |
28,361 | 21,748 | 6,613 | 30 | % | ||||||||
Operating expenses: |
|||||||||||||
Research and development |
19,260 | 13,917 | 5,343 | 38 | % | ||||||||
Sales and marketing |
4,285 | 4,074 | 211 | 5 | % | ||||||||
General and administrative |
8,534 | 5,761 | 2,773 | 48 | % | ||||||||
Total operating expenses |
32,079 | 23,752 | 8,327 | 35 | % | ||||||||
Loss from operations |
(3,718 | ) | (2,004 | ) | (1,714 | ) | 86 | % | |||||
Other income (expense): |
|||||||||||||
Interest income (expense), net |
(87 | ) | 43 | (130 | ) | ||||||||
Other income (expense), net |
(26,167 | ) | 202 | (26,369 | ) | ||||||||
Total other income (expense), net |
(26,254 | ) | 245 | (26,499 | ) | ||||||||
Loss before provision for income taxes |
(29,972 | ) | (1,759 | ) | (28,213 | ) | |||||||
Provision for income taxes |
43 | 19 | 24 | ||||||||||
Net loss |
$ | (30,015 | ) | $ | (1,778 | ) | $ | (28,237 | ) | ||||
64
Revenue
Our revenue increased by $11.2 million, or 26%, to $53.8 million during the year ended December 31, 2011 from $42.7 million during the year ended December 31, 2010. This increase was due to increases in CDP and services revenue and licensing and royalty revenue of $15.4 million which were partially offset by decreases in product revenue of $4.2 million.
CDP and services revenue increased by $9.0 million, or 33%, to $36.7 million during the year ended December 31, 2011 from $27.7 million during the year ended December 31, 2010. This increase was primarily attributable to $6.3 million in revenue derived from new customer engagements, combined with $6.3 million from the expansion of existing customer engagements, offset by a $3.6 million decrease in revenue from the scheduled completion of CDPs. Of the new customer engagements, $5.7 million in revenue was derived from one new CDP.
Product revenue decreased by $4.2 million, or 61%, to $2.7 million during the year ended December 31, 2011 from $7.0 million during the year ended December 31, 2010. The decrease in product revenue is due to differences in both the type of product sold during each period as well as the length of the corresponding maintenance periods for the respective products for which the revenue was recognized. We have not had any product sales of our workflow hardware that were initiated during 2011.
Licensing and royalty revenue increased by $6.4 million, or 80%, to $14.4 million during the year ended December 31, 2011 from $8.0 million during the year ended December 31, 2010. This increase was primarily attributable to an increase in sales of products subject to licensing fees and royalties, including minimum license fees as guaranteed by customer contracts.
The following table presents revenue by geographic region (based on invoiced locations) during the twelve months ended December 31, 2011 and 2010 in dollars (in thousands) and as a percentage of revenue for the periods presented:
| |
Years Ended December 31, | ||||||||||||
|---|---|---|---|---|---|---|---|---|---|---|---|---|---|
| |
2011 | 2010 | |||||||||||
| |
Revenues | % of Revenues | Revenues | % of Revenues | |||||||||
| |
(in thousands) |
|
(in thousands) |
|
|||||||||
United States |
$ | 35,573 | 66 | % | $ | 29,526 | 69 | % | |||||
Japan |
15,148 | 28 | % | 12,449 | 29 | % | |||||||
Taiwan |
2,934 | 5 | % | 489 | 1 | % | |||||||
Europe |
175 | 1 | % | 210 | 1 | % | |||||||
Total |
$ | 53,830 | 100 | % | $ | 42,674 | 100 | % | |||||
Cost of Revenue
Cost of revenue increased by $4.5 million, or 22%, to $25.5 million during the year ended December 31, 2011 from $20.9 million during the year ended December 31, 2010. This change is directly attributable to the increased CDP and services revenue we recognized from our new and ongoing customer engagements, which resulted in a $6.9 million increase in direct labor, materials and other costs associated with these programs. Additionally, cost of licensing and royalty revenue increased by $0.3 million directly attributable to increased licensing and royalty revenue. This increase was partially offset by a $2.7 million decrease in cost of product revenue associated with the decrease in product revenue recognized during the period.
Cost of revenue as a percentage of revenue decreased slightly from the prior year from 49% during the year ended December 31, 2010 to 47% in 2011. To the extent we are successful in growing
65
our revenue and increasing licensing and royalty revenue as a percentage of revenue we expect our cost of revenue as a percentage of total revenue to decline.
Research and Development
R&D expenses increased by $5.3 million, or 38%, to $19.3 million during the year ended December 31, 2011 from $13.9 million during the year ended December 31, 2010. The change is primarily attributable to $2.4 million in higher personnel costs as a result of increased headcount, $0.6 million increase in facility and occupancy-related costs due to clean room expansion, $1.8 million increase in depreciation expense, and $0.5 million in consulting and professional service fees.
Sales and Marketing
Sales and marketing expenses increased by $0.2 million, or 5%, to $4.3 million during the year ended December 31, 2011 from $4.1 million during the year ended December 31, 2010. The change is primarily due to higher consulting and personnel costs related to increased stock-based compensation expense during the year ended December 31, 2011.
General and Administrative
General and administrative expenses increased by $2.8 million, or 48%, to $8.5 million during the year ended December 31, 2011 from $5.8 million during the year ended December 31, 2010. The increase is primarily attributable to $1.3 million in higher professional fees associated with legal and accounting services, $1.2 million in higher personnel costs as a result of increased headcount, and $0.3 million in increased facility expenses.
Loss from Operations
Our operating loss increased by $1.7 million, to an operating loss of $3.8 million during the year ended December 31, 2011 from an operating loss of $2.0 million during the year ended December 31, 2010. To the extent we are successful in growing our revenue and increasing licensing and royalty revenue as a percentage of our total revenue, and if our expenses increase at a slower rate than our revenue, we expect that our net loss will decrease in the future. Our operating expenses increased by $8.3 million to $32.1 million during the year ended December 31, 2011 from $23.8 million during the year ended December 31, 2010. We expect our operating expenses to continue to increase as we expand and invest in our business, making investments in both personnel and capital resources leading to increased depreciation expense.
Interest Income (Expense), net
Interest income, net decreased by $130,000 to $(87,000) during the year ended December 31, 2011 from $43,000 during the year ended December 31, 2010. The decrease was primarily attributable to interest expense associated with the note payable to Symyx.
Other Income (Expense), net
Other income (expense), net decreased by $26.4 million to an expense of $26.2 million during the year ended December 31, 2011 from income of $0.2 million during the year ended December 31, 2010. This decrease was due to a charge for the mark-to-market change in the valuation of the Symyx purchase right derivative that was finalized as part of the closing of the Symyx asset purchase transaction that closed in November 2011 in connection with the completion of our initial public offering. Included in the mark-to-market change in value is the reimbursement of 50% of Symyx's underwriting discounts and commissions in connection with the sale of their common stock in our initial public offering, which amount was equal to approximately $1.4 million.
66
Provision for Income Taxes
Provision for income taxes as of December 31, 2011 and 2010 consisted of income taxes on our foreign entities and were not significant during either period.
Net Loss
Our net loss increased by $28.2 million, to a net loss of $30.0 million during the year ended December 31, 2011 from a net loss of $1.8 million during the year ended December 31, 2010. The increase in net loss from our operating loss during the year ended December 31, 2011 was primarily attributable to the mark-to-market change in the valuation of the Symyx purchase right derivative that resulted in an expense of $25.9 million.
Comparison of the Years Ended December 31, 2010 and 2009
| |
Years Ended December 31, | |
|
||||||||||
|---|---|---|---|---|---|---|---|---|---|---|---|---|---|
| |
2010 | 2009 | $ Change | % Change | |||||||||
| |
|
(in thousands) |
|
|
|||||||||
Revenues: |
|||||||||||||
CDP and services revenue |
$ | 27,705 | $ | 14,182 | $ | 13,523 | 95 | % | |||||
Product revenue |
6,959 | 9,065 | (2,106 | ) | (23) | % | |||||||
Licensing and royalty revenue |
8,010 | 3,663 | 4,347 | 119 | % | ||||||||
Total revenues |
42,674 | 26,910 | 15,764 | 59 | % | ||||||||
Cost of revenues |
20,926 | 13,018 | 7,908 | 61 | % | ||||||||
Gross profit |
21,748 | 13,892 | 7,856 | 57 | % | ||||||||
Operating expenses: |
|||||||||||||
Research and development |
13,917 | 10,983 | 2,934 | 27 | % | ||||||||
Sales and marketing |
4,074 | 3,211 | 863 | 27 | % | ||||||||
General and administrative |
5,761 | 4,867 | 894 | 18 | % | ||||||||
Total operating expenses |
23,752 | 19,061 | 4,691 | 25 | % | ||||||||
Loss from operations |
(2,004 | ) | (5,169 | ) | 3,165 | ||||||||
Other income (expense): |
|||||||||||||
Interest income (expense), net |
43 | (6 | ) | 49 | |||||||||
Other income (expense), net |
202 | (62 | ) | 264 | |||||||||
Total other income (expense), net |
245 | (68 | ) | 313 | |||||||||
Loss before provision for income taxes |
(1,759 | ) | (5,237 | ) | 3,478 | ||||||||
Provision for income taxes |
19 | 17 | 2 | ||||||||||
Net loss |
$ | (1,778 | ) | $ | (5,254 | ) | $ | 3,476 | |||||
Revenue
Our revenue increased by $15.8 million, or 59%, to $42.7 million during the year ended December 31, 2010 from $26.9 million during the year ended December 31, 2009, primarily due to increases in revenue from CDPs and licensing arrangements partially offset by reductions in revenue from product revenue.
CDP and services revenue increased by $13.5 million, or 95%, to $27.7 million during the year ended December 31, 2010 from $14.2 million during the year ended December 31, 2009. This change is attributable to $10.2 million in revenue derived from three customer engagements, including one for a customer in the clean-energy industry, that commenced during the year ended December 31, 2010. The
67
remaining $3.3 million increase is due to the net effect of expansions of existing CDPs, partially offset by reductions from the scheduled completion of two CDPs.
Product revenue decreased by $2.1 million, or 23%, to $7.0 million during the year ended December 31, 2010 from $9.1 million during the year ended December 31, 2009. This decrease is primarily attributable to the recognition of revenue during the year ended December 31, 2009 from four workflow platform sales as compared to recognition of revenue during the year ended December 31, 2010 from two workflow platform sales.
Licensing and royalty revenue increased by $4.3 million, or 119%, to $8.0 million during the year ended December 31, 2010 from $3.7 million during the year ended December 31, 2009. This change is primarily attributable to a $2.5 million increase in licensing fees and royalties from commercialized products and a $1.8 million increase in licensing fees from licenses to the HPC capabilities of our workflows and other technology.
Revenue to customers in the various geographic regions remained relatively unchanged. The following table presents revenue by geographic region (based on invoiced locations) during the years ended December 31, 2010 and 2009 in dollars and as a percentage of revenue for the periods presented:
| |
Years Ended December 31, | ||||||||||||
|---|---|---|---|---|---|---|---|---|---|---|---|---|---|
| |
2010 | 2009 | |||||||||||
| |
Revenue | % of Revenue |
Revenue | % of Revenue |
|||||||||
| |
(in thousands) |
|
(in thousands) |
|
|||||||||
United States |
$ | 29,526 | 70 | % | $ | 18,894 | 70 | % | |||||
Japan |
12,449 | 29 | % | 7,906 | 30 | % | |||||||
Taiwan |
489 | 1 | % | — | 0 | % | |||||||
Europe |
210 | 0 | % | 110 | 0 | % | |||||||
Total |
$ | 42,674 | 100 | % | $ | 26,910 | 100 | % | |||||
Cost of Revenue
Cost of revenue increased by $7.9 million, or 61%, to $20.9 million during the year ended December 31, 2010 from $13.0 million during the year ended December 31, 2009. This change is directly attributable to the increased CDP and services revenue during the year ended December 31, 2010 that we recognized from our new and ongoing CDPs, which resulted in a $8.0 million increase in direct labor, materials and other costs associated with these programs, including an increase in licensing fees payable to Symyx in the amount of $0.9 million. Additionally, cost of licensing and royalty revenue increased by $0.2 million directly attributable to increased licensing and royalty revenue. These increases were partially offset by a $0.3 million decrease in direct workflow platform costs due to fewer workflow platform sales during the year ended December 31, 2010.
Cost of revenue as a percentage of revenue remained consistent with the prior year and was 49% and 48% during the years ended December 31, 2010 and 2009, respectively. To the extent we are successful in growing our revenue and increasing licensing and royalty revenue as a percentage of revenue we expect our cost of revenue as a percentage of total revenue to decline.
Research and Development
R&D expenses increased by $2.9 million, or 27%, to $13.9 million during the year ended December 31, 2010 from $11.0 million during the year ended December 31, 2009. The change is attributable to $2.1 million in higher personnel costs as a result of increased headcount, a $1.6 million increase in facility and occupancy-related costs due to clean room expansion, $0.8 million in parts costs
68
for internal R&D projects and $0.3 million of higher consulting and professional service fees. These increases were partially offset by a decrease in R&D expenses due to an increase in the use of equipment for CDPs resulting in an increase in the allocation of expenses to cost of revenue during the year ended December 31, 2010 as compared to the year ended December 31, 2009.
Sales and Marketing
Sales and marketing expenses increased by $0.9 million, or 27%, to $4.1 million during the year ended December 31, 2010 from $3.2 million during the year ended December 31, 2009. The change is primarily attributable to $0.5 million in higher personnel costs related to commissions earned on 2010 bookings and collections combined with $0.2 million in higher travel, entertainment and marketing expenses attributable to increased sales and marketing efforts during the year ended December 31, 2010.
General and Administrative
General and administrative expenses increased by $0.9 million, or 18%, to $5.8 million during the year ended December 31, 2010 from $4.9 million during the year ended December 31, 2009. The increase is primarily attributable to $0.5 million in higher personnel costs as a result of increased headcount, $0.2 million in higher professional fees, $0.1 million in higher facility and occupancy-related costs and $0.1 million in higher travel and entertainment costs.
Interest Income (Expense), net
Interest income, net changed by $49,000 to income of $43,000 during the year ended December 31, 2010 from an expense of $6,000 during the year ended December 31, 2009. The change is due primarily to the $0.1 million reduction in interest expense during the year ended December 31, 2010 due to the repayment of our obligations under our amended loan and security agreement which were partially offset by $44,000 of interest income earned on our cash, cash equivalents and short-term investments.
Loss from Operations
Our operating loss decreased by $3.2 million, to an operating loss of $2.0 million during the year ended December 31, 2010 from an operating loss of $5.2 million during the year ended December 31, 2009. The decrease in operating loss is related to increased revenue and the composition of that revenue. The increase in licensing and royalty revenue as a percentage of our total revenue and the increase in our operating expenses growing at a slower rate than revenue have resulted in a decrease in our operating loss.
Other Income (Expense), net
Other income (expense) increased by $0.3 million to income of $0.2 million during the year ended December 31, 2010 from an expense of $0.1 million during the year ended December 31, 2009. The change was directly attributable to municipal economic development grant proceeds we received during the year ended December 31, 2010.
Provision for Income Taxes
The income tax provision for the year ended December 31, 2010 was $19,000 compared to $17,000 for the year ended December 31, 2009. Both amounts consisted of income taxes on our foreign entities and were not significant in either period.
69
Net Loss
Our net loss decreased by $3.5 million, to a net loss of $1.8 million during the year ended December 31, 2010 from a net loss of $5.3 million during the year ended December 31, 2009. The decrease in net loss from our operating loss during the year ended December 31, 2010 was primarily attributed to municipal economic development grant proceeds and interest income we received during the year.
Comparison of the Years Ended December 31, 2008 and 2009
| |
Years Ended December 31, | |
|
||||||||||
|---|---|---|---|---|---|---|---|---|---|---|---|---|---|
| |
2009 | 2008 | $ Change | % Change | |||||||||
| |
|
(in thousands) |
|
|
|||||||||
Revenues: |
|||||||||||||
CDP and services revenue |
$ | 14,182 | $ | 14,647 | $ | (465 | ) | (3 | )% | ||||
Product revenue |
9,065 | 6,206 | 2,859 | 46 | % | ||||||||
Licensing and royalty revenue |
3,663 | 2,276 | 1,387 | 61 | % | ||||||||
Total revenues |
26,910 | 23,129 | 3,781 | 16 | % | ||||||||
Cost of revenues |
13,018 | 12,625 | 393 | 3 | % | ||||||||
Gross profit |
13,892 | 10,504 | 3,388 | 32 | % | ||||||||
Operating expenses: |
|||||||||||||
Research and development |
10,983 | 11,849 | (866 | ) | (7 | )% | |||||||
Sales and marketing |
3,211 | 3,849 | (638 | ) | (17 | )% | |||||||
General and administrative |
4,867 | 4,300 | 567 | 13 | % | ||||||||
Total operating expenses |
19,061 | 19,998 | (937 | ) | (5 | )% | |||||||
Loss from operations |
(5,169 | ) | (9,494 | ) | 4,325 | ||||||||
Other income (expense): |
|||||||||||||
Interest income (expense), net |
(6 | ) | 174 | (180 | ) | ||||||||
Other income (expense), net |
(62 | ) | 6 | (68 | ) | ||||||||
Total other income (expense), net |
(68 | ) | 180 | (248 | ) | ||||||||
Loss before provision for income taxes |
(5,237 | ) | (9,314 | ) | 4,077 | ||||||||
Provision for income taxes |
17 | 186 | (169 | ) | |||||||||
Net loss |
$ | (5,254 | ) | $ | (9,500 | ) | $ | 4,246 | |||||
Revenue
Our revenue increased by $3.8 million, or 16%, to $26.9 million during the year ended December 31, 2009 from $23.1 million during the year ended December 31, 2008 primarily due to increases in product revenue and licensing and royalty revenue offset by a reduction in revenue from ongoing CDPs.
CDP and services revenue decreased by $0.5 million, or 3%, to $14.2 million during the year ended December 31, 2009 from $14.6 million during the year ended December 31, 2008. The change is primarily due to a decrease in revenue of $4.0 million from the scheduled completion of CDPs, offset by a $3.5 million increase in revenue from the expansion of existing CDPs.
Product revenue increased by $2.9 million, or 46%, to $9.1 million during the year ended December 31, 2009 from $6.2 million during the year ended December 31, 2008. The increase in revenue during the year ended December 31, 2009 is primarily attributable to the recognition of revenue during the year ended December 31, 2008 from two workflow platform sales as compared to
70
the recognition of revenue during the year ended December 31, 2009 from two previous and two additional workflow platform sales.
Licensing and royalty revenue increased by $1.4 million, or 61%, to $3.7 million during the year ended December 31, 2009 from $2.3 million during the year ended December 31, 2008. This change is primarily attributable to a $0.5 million increase in licensing and royalty fees from commercialized products and a $0.9 million increase in licensing fees from licenses to the HPC capabilities of our workflows.
Revenue from customers in the various geographic regions (based on invoiced locations) remained relatively unchanged. The following table presents revenue by geographic region during the years ended December 31, 2008 and 2009 in dollars and as a percentage of revenue for the periods presented:
| |
Years Ended December 31, | ||||||||||||
|---|---|---|---|---|---|---|---|---|---|---|---|---|---|
| |
2009 | 2008 | |||||||||||
| |
Revenue | % of Revenue |
Revenue | % of Revenue |
|||||||||
| |
(in thousands) |
|
(in thousands) |
|
|||||||||
United States |
$ | 18,894 | 70 | % | $ | 16,522 | 72 | % | |||||
Japan |
7,906 | 30 | % | 6,267 | 27 | % | |||||||
Taiwan |
— | 0 | % | 90 | 0 | % | |||||||
Europe |
110 | 0 | % | 250 | 1 | % | |||||||
Total |
$ | 26,910 | 100 | % | $ | 23,129 | 100 | % | |||||
Cost of Revenue
Cost of revenue increased by $0.4 million, or 3%, to $13.0 million during the year ended December 31, 2009 from $12.6 million during the year ended December 31, 2008. The increase is directly attributable to the increase in product revenue during the year ended December 31, 2009, which resulted in a $0.6 million increase in direct workflow platform costs, including an increase in licensing fees payable to Symyx in the amount of $0.1 million. Additionally, cost of licensing and royalty revenue increased by $0.1 million directly attributable to increased licensing and royalty revenue. These increases were partially offset by a $0.3 million reduction in direct labor, materials and other costs associated with our ongoing CDPs due to the reduction in services revenue during the year ended December 31, 2009.
Research and Development
R&D expenses decreased by $0.9 million, or 7%, to $11.0 million during the year ended December 31, 2009 from $11.8 million during the year ended December 31, 2008. The decrease is attributable to a $1.1 million decrease in personnel costs, $0.7 million reduction in parts costs for internal R&D programs and $0.3 million reduction in consulting and professional service fees due to R&D personnel being used for ongoing CDPs during the year ended December 31, 2009 as compared to being used during the year ended December 31, 2008 for internal R&D projects. These decreases were partially offset by an increase in facility and occupancy-related expenses and an increase in R&D expenses due to a reduction in the use of equipment for CDPs resulting in a decrease in the allocation of expenses to cost of revenue during the year ended December 31, 2009 as compared to the year ended December 31, 2008.
Sales and Marketing
Sales and marketing expenses decreased by $0.6 million, or 17%, to $3.2 million during the year ended December 31, 2009 from $3.8 million during the year ended December 31, 2008. The decrease is
71
attributable to a $0.3 million decrease in personnel costs related to staff turnover and reduced commission expense and $0.3 million decrease in travel, entertainment and marketing expenses.
General and Administrative
General and administrative expenses increased by $0.6 million, or 13%, to $4.9 million during the year ended December 31, 2009 from $4.3 million during the year ended December 31, 2008. The increase is attributable to $0.3 million in higher facility and occupancy-related costs, $0.2 million in higher personnel costs due to changes in headcount and $0.1 million in higher consulting and professional services costs.
Interest Income (Expense), net
Interest income, net decreased by $0.2 million to an expense of $6,000 during the year ended December 31, 2009 from $0.2 million during the year ended December 31, 2008. The change is attributable to a $0.5 million reduction in interest income combined with a $0.3 million reduction in interest expense. The decrease in interest income is attributable to lower average cash, cash equivalents and short-term investments on hand during the year ended December 31, 2009 compared to the year ended December 31, 2008 as we used the proceeds received from our Series D convertible preferred stock financing during the year ended December 31, 2008 for capital expenditures and principal repayments on our debt obligations during the year ended December 31, 2009. The decrease in interest expense is attributable to the repayment of our obligations under our amended loan and security agreement in February 2009.
Loss from Operations
Our operating loss decreased by $4.3 million, to an operating loss of $5.2 million during the year ended December 31, 2009 from an operating loss of $9.5 million during the year ended December 31, 2008. The decrease in operating loss is related to increased product and licensing and royalty revenue. The increase in revenue combined with the overall decline in operating expense has resulted in a decrease in our operating loss during the year ended December 31, 2009.
Other Income (Expense), net
Other income (expense) decreased by $0.1 million to an expense of $0.1 million during the year ended December 31, 2009 from income of $6,000 during the year ended December 31, 2008. The change is not significant.
Provision for Income Taxes
The tax provision for the year ended December 31, 2009 of $17,000 consisted of $13,000 in foreign income taxes on our foreign entities and $4,000 in state income taxes. The tax provision for the year ended December 31, 2008 of $186,000 consisted of $11,000 in income taxes on our foreign entities and $175,000 in state income taxes.
Net Loss
Our net loss was essentially the same as our loss from operations for the years ended December 31, 2009 and December 31, 2008.
Quarterly Results of Operations
You should read the following tables presenting our quarterly results of operations in conjunction with the consolidated financial statements and related notes contained elsewhere in this Annual Report
72
on Form 10-K. We have prepared the unaudited information on the same basis as our audited consolidated financial statements. Please note that our operating results for any quarter are not necessarily indicative of results for any future quarters or for a full year. Our unaudited quarterly results of operations for the eight quarters ended December 31, 2011 were as follows (in thousands, except share and per share amounts):
| |
Three Months Ended | ||||||||||||||||||||||||
|---|---|---|---|---|---|---|---|---|---|---|---|---|---|---|---|---|---|---|---|---|---|---|---|---|---|
| |
December 31, 2011 |
September 30, 2011 |
June 30, 2011 |
March 31, 2011 |
December 31, 2010 |
September 30, 2010 |
June 30, 2010 |
March 31, 2010 |
|||||||||||||||||
| |
(unaudited) |
||||||||||||||||||||||||
Revenue: |
|||||||||||||||||||||||||
CDP and services revenue |
$ | 10,564 | 10,349 | $ | 8,027 | $ | 7,793 | $ | 9,713 | $ | 8,186 | $ | 7,257 | $ | 2,549 | ||||||||||
Product revenue |
679 | 678 | 682 | 678 | 2,024 | 1,635 | 1,635 | 1,665 | |||||||||||||||||
Licensing and royalty revenue |
3,889 | 3,847 | 3,427 | 3,217 | 2,427 | 2,197 | 1,797 | 1,589 | |||||||||||||||||
Total revenue |
15,132 | 14,874 | 12,136 | 11,688 | 14,164 | 12,018 | 10,689 | 5,803 | |||||||||||||||||
Cost of revenue |
7,470 | 6,676 | 5,807 | 5,516 | 6,938 | 5,236 | 5,117 | 3,635 | |||||||||||||||||
Gross profit |
7,662 | 8,198 | 6,329 | 6,172 | 7,226 | 6,782 | 5,572 | 2,168 | |||||||||||||||||
Operating expenses: |
|||||||||||||||||||||||||
Research and development |
4,659 | 5,113 | 4,969 | 4,519 | 3,700 | 3,864 | 3,280 | 3,073 | |||||||||||||||||
Sales and marketing |
1,056 | 1,249 | 1,075 | 905 | 1,018 | 1,130 | 1,030 | 896 | |||||||||||||||||
General and administrative |
2,378 | 2,231 | 2,126 | 1,799 | 1,511 | 1,373 | 1,271 | 1,606 | |||||||||||||||||
Total operating expenses |
8,093 | 8,593 | 8,170 | 7,223 | 6,229 | 6,367 | 5,581 | 5,575 | |||||||||||||||||
Income (loss) from operations |
(431 | ) | (395 | ) | (1,841 | ) | (1,051 | ) | 997 | 415 | (9 | ) | (3,407 | ) | |||||||||||
Other income (expense): |
|||||||||||||||||||||||||
Interest income (expense), net |
(103 | ) | 6 | 6 | 4 | 6 | 20 | 6 | 11 | ||||||||||||||||
Other income (expense), net |
(24,993 | ) | (839 | ) | (157 | ) | (178 | ) | 131 | 16 | 59 | (4 | ) | ||||||||||||
Total other income (expense), net |
(25,096 | ) | (833 | ) | (151 | ) | (174 | ) | 137 | 36 | 65 | 7 | |||||||||||||
Income (loss) before provision for income taxes |
(25,527 | ) | (1,228 | ) | (1,992 | ) | (1,225 | ) | 1,134 | 451 | 56 | (3,400 | ) | ||||||||||||
Provision for income taxes |
24 | 6 | 12 | 1 | 11 | 6 | 2 | — | |||||||||||||||||
Net income (loss) |
(25,551 | ) | (1,234 | ) | (2,004 | ) | (1,226 | ) | 1,123 | 445 | 54 | (3,400 | ) | ||||||||||||
Accretion on redeemable convertible preferred stock |
— | (1,565 | ) | (3,054 | ) | (4,041 | ) | (4,118 | ) | (3,704 | ) | (3,336 | ) | (3,004 | ) | ||||||||||
Net loss attributable to common stockholders |
$ | (25,551 | ) | $ | (2,799 | ) | $ | (5,058 | ) | $ | (5,267 | ) | $ | (2,995 | ) | $ | (3,259 | ) | $ | (3,282 | ) | $ | (6,404 | ) | |
Net loss per share of common stock, basic and diluted |
$ | (1.19 | ) | $ | (0.49 | ) | $ | (0.89 | ) | $ | (0.93 | ) | $ | (0.54 | ) | $ | (0.59 | ) | $ | (0.59 | ) | $ | (1.15 | ) | |
Shares used in computing net loss per share of common stock, basic and diluted |
21,519,116 | 5,750,979 | 5,663,213 | 5,633,192 | 5,583,451 | 5,569,898 | 5,568,804 | 5,546,560 | |||||||||||||||||
Liquidity and Capital Resources
Prior to our initial public offering in November 2011, we substantially satisfied our capital and liquidity needs through private placements of redeemable convertible preferred stock and, to a lesser extent, cash flow from operations. As of December 31, 2011, we had $81.0 million of cash and cash equivalents and $74.7 million of net working capital. During the year ended December 31, 2011, we closed a private placement of our Series E redeemable convertible preferred stock for $24.9 million in net proceeds and completed our initial public offering which provided us with aggregate net proceeds of $49.2 million. In connection with the consummation of our initial public offering in November 2011, we also received $6.4 million in proceeds from the exercise of common stock warrants. As of December 31, 2011, we had debt outstanding of $27.3 million as a result of the completion of the Symyx asset purchase transaction.
73
To date, we have incurred significant losses. During the years ended December 31, 2011, 2010 and 2009, we incurred net losses of $30.0 million, $1.8 million and $5.3 million. As of December 31, 2011, our accumulated deficit was $100.5 million.
We believe that we have the financial resources needed to meet business requirements for the next 12 months. Our future capital requirements will depend on many factors, including our rate of revenue growth, our expansion of our sales and marketing activities and overhead expenses, the timing and extent of our spending to support our R&D efforts and our ability to expand CDPs in the semiconductor industry, whether we are successful in obtaining payments from customers, the financial stability of our customers, whether we can enter into additional collaborations in our target industries, the progress and scope of collaborative R&D projects performed by us and our customers, the effect of any acquisitions of other businesses or technologies that we may make in the future, the filing, prosecution and enforcement of patent claims, how much we need to develop or enhance our solutions or HPC platform and any necessary responses to competitive pressures. To the extent that existing cash and cash equivalents and cash from operations are insufficient to fund our operations, we may need to raise additional funds through public or private equity or debt financing. We may also seek to invest in or acquire complementary businesses, applications or technologies, any of which could also require us to seek additional equity or debt financing. Additional funds may not be available on terms favorable to us or at all. We maintain almost all of our cash in the United States and therefore are not subject to restrictions or tax obligations as we access the cash.
During February 2012, one of our significant customers, Elpida, filed for protection under the Corporate Reorganization Act in Japan. Our revenue from Elpida may decline as a result. For example, as part of any restructuring under this Act, our CDP services may be reduced or even eliminated, and Elpida may either voluntarily or involuntarily reduce or eliminate payments owed to us or shipments of products that include our licensed technology. The use of our technology in their current product shipments generates a license fee for us, and may include a royalty when additional developed technology is incorporated in future Elpida products. Any adjustment in the amount of CDP services fees, license fees or royalties that Elpida would owe us pursuant to our agreement with them could be reduced or eliminated as a result of changes in their shipments and product development. If any of these were to occur our revenue would decline, and our financial condition and results of operations would be materially and adversely affected. During the year ended December 31, 2011 we recognized $9.9 million in revenue from Elpida and as of December 31, 2011 had outstanding accounts receivable in the amount of $0.2 million and backlog in the amount of $17.8 million, of which $8.8 million is to be recognized during 2012 with the balance to be recognized in periods beyond 2012.
Cash Flows
The following summary of our cash flows for the periods indicated has been derived from our consolidated financial statements included elsewhere in this filing:
| |
Years Ended December 31, | |||||||||
|---|---|---|---|---|---|---|---|---|---|---|
| |
2011 | 2010 | 2009 | |||||||
| |
(in thousands) |
|||||||||
Net cash (used in) provided by operating activities |
$ | (8,156 | ) | $ | 1,175 | $ | 1,088 | |||
Net cash (used in) provided by investing activities |
$ | (13,468 | ) | $ | 924 | $ | (16,708 | ) | ||
Net cash provided by (used in) financing activities |
$ | 79,562 | $ | 109 | $ | (4,426 | ) | |||
Cash Flows from Operating Activities
We experienced negative cash flows from operating activities during the year ended December 31, 2011, and experienced positive cash flows from operating activities during each of the years ended
74
December 31, 2010 and 2009, which included the receipt of advance payments from CDPs, product sales and licensing and royalty fees.
Net cash used in operating activities during the year ended December 31, 2011 of $8.2 million was primarily attributable to our net loss of $30.0 million and non-cash charges of $24.5 million due to our derivative liability as a result of the consummation of the Symyx asset purchase transaction, $7.1 million of depreciation and amortization, and $2.4 million in stock-based compensation. The net decline in cash flow from our operating assets and liabilities of $13.1 million was primarily as a result of an $8.3 million reduction in deferred revenue related to timing of customer prepayments, $2.7 million in prepaid and other assets, and $7.0 million in accounts receivable, offset by an increase in accrued and other liabilities of $5.4 million. The decline in deferred revenue is primarily related to the earn out of customer prepayments for licensing and royalty related revenues. During 2008, we received a customer prepayment for minimum royalties to be earned during the years 2009 through 2012 in the amount of $10 million. As of December 31, 2011, $2.5 million remained in deferred revenue that will be recognized as revenue during 2012 and then starting in 2013 all royalty revenues from this customer will be based on volume. In the event 2012 volume exceeds the minimum royalty amount, we will recognize revenue and be paid additional royalties in excess of prepaid minimum royalties.
As of December 31, 2011 we had $11.9 million in deferred revenue for which we have already received payment, of which $11.2 million will be recognized in revenue during 2012 and $0.7 million will be recognized as revenue during 2013.
Net cash provided by operating activities during the year ended December 31, 2010 of $1.2 million reflects the net loss of $1.8 million and non-cash charges of $5.0 million for depreciation and amortization and $1.4 million for stock-based compensation. The net change in our operating assets and liabilities of $(3.4) million was primarily a result of a $0.8 million increase in inventory, a $2.9 million increase in accounts receivable and a $4.5 million decrease in deferred revenue which were partially offset by a $3.3 million increase in accounts payable and accrued expenses.
Net cash provided by operating activities during the year ended December 31, 2009 of $1.1 million reflects the net loss of $5.3 million and non-cash charges of $4.4 million for depreciation and amortization and $1.1 million for stock-based compensation. The net change in our operating assets and liabilities of $0.8 million was primarily the result of a $0.5 million decrease in deferred revenue which was partially offset by $1.6 million in our prepaid expenses and other assets, inventory and accounts receivable balances.
Cash Flows from Investing Activities
Our investing activities consist primarily of purchases and sales of short-term investments, capital expenditures to purchase property and equipment and our investments in intangible assets relating to our patents and trademarks. In the future, we expect we will continue to make significant capital expenditures to support our expanding operations and incur costs to protect our investment in our developed technology and IP.
During the year ended December 31, 2011, cash used in investing activities was $13.5 million as a result of $12.8 million in capital expenditures and $0.8 million in capitalized patent and trademark costs, offset by a $0.2 million decrease in restricted cash.
During the year ended December 31, 2010, cash provided by investing activities of $0.9 million was primarily attributable to the $11.8 million in net proceeds received from the sale of our investments which were partially offset by $10.5 million of capital expenditures and $0.3 million in capitalized intangible asset costs. These capital expenditures were incurred as a result of us relocating our operations during the year ended December 31, 2010 to a new facility to support our expanding operations, as well as to prepare for new business programs requiring additional equipment.
75
During the year ended December 31, 2009, cash used in investing activities of $16.7 million was due to $11.8 million for the purchase of investments, $4.8 million in capital expenditures relating to the acquisition of lab equipment and machinery and $0.1 million in capitalized intangible asset costs.
Cash Flows from Financing Activities
To date, we have financed our operations primarily with proceeds from the sale of our redeemable convertible preferred stock and proceeds received from our initial public offering.
During the year ended December 31, 2011, cash provided by financing activities was $79.6 million, primarily as a result of the receipt of $49.2 million in net proceeds from our initial public offering in November 2011 and $24.9 million in net proceeds from the sale of our Series E redeemable convertible preferred stock in March and June 2011. In addition, we received $6.4 million in proceeds from the exercise of common stock warrants and $0.5 million in proceeds from the exercise of common stock options. Funds received from financing activities were offset by a onetime payment of selling stockholder offering costs of $1.4 million in connection with obligations under the Symyx asset purchase transaction.
During the year ended December 31, 2010, cash provided by financing activities was $0.1 million which consisted of proceeds received from the exercise of stock options.
During the year ended December 31, 2009, cash used in financing activities was $4.4 million, primarily as a result of us paying off our outstanding loan balances under our amended loan and security agreement.
Contractual Obligations and Commitments
The following summarizes our contractual obligations as of December 31, 2011:
| |
Payments Due by Period | |||||||||||||||
|---|---|---|---|---|---|---|---|---|---|---|---|---|---|---|---|---|
| |
Total | Less Than One Year |
1 - 3 Years | 3 - 5 Years | More Than 5 Years |
|||||||||||
| |
(in thousands) |
|||||||||||||||
Operating lease obligations |
$ | 5,665 | $ | 1,573 | $ | 4,092 | $ | — | $ | — | ||||||
Note payable |
27,318 | 804 | 26,514 | — | — | |||||||||||
Contractual interest payments on note payable |
2,132 | 1,196 | 936 | — | — | |||||||||||
Purchase obligations(1) |
2,232 | 2,232 | — | — | — | |||||||||||
Total |
$ | 37,347 | $ | 5,805 | $ | 31,542 | $ | — | $ | — | ||||||
- (1)
- Purchase obligations consist of firm non-cancelable agreements to purchase property and equipment and inventory related items.
Operating lease agreements represent our obligations to make payments under our non-cancelable lease agreements for our facility in San Jose, California. During the year ended December 31, 2011, we made regular lease payments of $1.6 million under the operating lease agreements.
In connection with the consummation of the Symyx asset purchase transaction, which occurred in connection with the consummation of our initial public offering, we issued a promissory note payable to Symyx. The note has a principal amount equal to $27.3 million and a term of 24 months and an interest rate of 4% and is payable in amounts equal to the greater of $500,000 per quarter or the amount of accrued interest, with a balloon payment at maturity, if applicable. See Part I, Item 1: "Business—Symyx Asset Purchase" for further details about this transaction.
76
Off-Balance Sheet Arrangements
As of December 31, 2011, we did not have any relationships with unconsolidated entities or financial partnerships, such as entities often referred to as structured finance or special purpose entities, which would have been established for the purpose of facilitating off-balance sheet arrangements or other contractually narrow or limited purposes.
Recent Accounting Pronouncements
See Note 1 of the Notes to Consolidated Financial Statements included in this Form 10-K for recent accounting pronouncements that could have an effect on us.
77
ITEM 7A. QUANTITATIVE AND QUALITATIVE DISCLOSURES ABOUT MARKET RISK
We are exposed to market risks in the ordinary course of our business. Market risk represents the risk of loss that may impact our financial position due to adverse changes in financial market prices and rates. Our market risk exposure is primarily a result of fluctuations in interest rates and foreign currency exchange rates. We do not hold or issue financial instruments for trading purposes.
Interest Rate Sensitivity
Our exposure to market risk for changes in interest rates relates primarily to our investment portfolio and our outstanding debt obligations. Our cash, cash equivalents and investment accounts as of December 31, 2011 total $81.0 million, consisting primarily of cash, money market funds and certificates of deposit with maturities of less than three months from the date of purchase. Our primary exposure to market risk is interest income sensitivity, which is affected by changes in the general level of the interest rates in the United States. However, because of the short-term nature of the instruments in our portfolio, a sudden change in market interest rates would not be expected to have a material impact on our consolidated financial condition or our results of operation.
In connection with the consummation of the Symyx asset purchase transaction, which occurred in connection with the completion of our initial public offering, we issued a promissory note payable to Symyx. The note has a principal amount equal to $27.3 million and a term of 24 months and a fixed interest rate of 4% and is payable in amounts equal to the greater of $500,000 per quarter or the amount of accrued interest, with a balloon payment at maturity, if applicable. The interest rate on our debt is fixed, however, in the event we enter into other long-term debt arrangements, we could be subject to fluctuations in interest rates which could have a material impact on our future financial condition and results of operation.
Foreign Currency Exchange Risk
As we expand internationally, our consolidated results of operations and cash flows will become increasingly subject to fluctuations due to changes in foreign currency exchange rates. Our revenue is denominated in U.S. dollars. Our expenses are generally denominated in the currencies in which our operations are located, which is primarily in the United States, with an insignificant portion of expenses incurred in our wholly-owned subsidiaries in Hong Kong and Japan and our wholly-owned branch in Taiwan in their local currencies. The effect of a hypothetical 10% change in foreign currency exchanges rates applicable to our business would not have a material impact on our consolidated financial statements. To date, we have not entered into any material foreign currency hedging contracts although we may do so in the future.
78
ITEM 8. FINANCIAL STATEMENTS AND SUPPLEMENTARY DATA
INDEX TO CONSOLIDATED FINANCIAL STATEMENTS
79
Report of Independent Registered Public Accounting Firm
The
Board of Directors
Intermolecular, Inc.:
We have audited the accompanying consolidated balance sheets of Intermolecular, Inc. and subsidiaries (the Company) as of December 31, 2011 and 2010, and the related consolidated statements of operations, redeemable convertible preferred stock and of stockholders' equity (deficit), and cash flows for each of the years in the three-year period ended December 31, 2011. These consolidated financial statements are the responsibility of the Company's management. Our responsibility is to express an opinion on these consolidated financial statements based on our audits.
We conducted our audits in accordance with the Public Company Accounting Oversight Board (United States). Those standards require that we plan and perform the audit to obtain reasonable assurance about whether the financial statements are free of material misstatement. An audit includes examining, on a test basis, evidence supporting the amounts and disclosures in the financial statements, assessing the accounting principles used and significant estimates made by management, as well as evaluating the overall financial statement presentation. We believe that our audits provide a reasonable basis for our opinion.
In our opinion, the consolidated financial statements referred to above present fairly, in all material respects, the financial position of Intermolecular, Inc. and subsidiaries as of December 31, 2011 and 2010 and the results of their operations and their cash flows for each of the years in the three-year period ended December 31, 2011, in conformity with U.S. generally accepted accounting principles.
/s/ KPMG LLP
Santa
Clara, California
March 15, 2012
80
INTERMOLECULAR, INC. AND SUBSIDIARIES
Consolidated Balance Sheets
(In thousands, except share and per share data)
| |
December 31, 2011 |
December 31, 2010 |
|||||
|---|---|---|---|---|---|---|---|
ASSETS |
|||||||
Current assets: |
|||||||
Cash and cash equivalents |
$ | 81,002 | $ | 23,064 | |||
Accounts receivable, net of allowance for doubtful accounts of zero as of December 31, 2011 and 2010 |
10,227 | 3,296 | |||||
Accounts receivable, due from related parties |
935 | 836 | |||||
Prepaid expenses and other current assets |
1,763 | 1,868 | |||||
Total current assets |
93,927 | 29,064 | |||||
Inventory |
2,532 |
2,189 |
|||||
Property and equipment, net |
25,128 | 21,728 | |||||
Intangible assets, net |
6,067 | 2,238 | |||||
Other assets |
160 | 352 | |||||
Total assets |
$ | 127,814 | $ | 55,571 | |||
LIABILITIES, REDEEMABLE CONVERTIBLE PREFERRED STOCK AND STOCKHOLDERS' EQUITY (DEFICIT) |
|||||||
Current liabilities: |
|||||||
Accounts payable |
$ | 1,079 | $ | 2,806 | |||
Accrued payable, due to related parties |
— | 795 | |||||
Accrued liabilities |
3,759 | 2,720 | |||||
Accrued compensation and employee benefits |
2,452 | 2,243 | |||||
Deferred revenue, current portion |
1,575 | 5,233 | |||||
Related party deferred revenue, current portion |
9,593 | 10,227 | |||||
Preferred stock warrant liability |
— | 215 | |||||
Note payable, current portion |
804 | — | |||||
Total current liabilities |
19,262 | 24,239 | |||||
Deferred revenue, net of current portion |
— | 1,470 | |||||
Related party deferred revenue, net of current portion |
716 | 3,216 | |||||
Deferred rent, net of current portion |
1,004 | 808 | |||||
Note payable, net of current portion |
26,514 | — | |||||
Other long-term liabilities |
145 | 135 | |||||
Total liabilities |
47,641 | 29,868 | |||||
Commitments and contingencies (note 5) |
|||||||
Redeemable convertible preferred stock, par value $0.001 per share—5,000,000 and 56,000,000 shares authorized as of December 31, 2011 and 2010, respectively; 0 and 52,443,325 shares issued and outstanding as of December 31, 2011 and 2010, respectively; liquidation preference of $0 and $55,975 as of December 31, 2011 and 2010, respectively |
— |
55,633 |
|||||
Accumulated accretion of redeemable convertible preferred stock to redemption values |
— | 34,426 | |||||
Total redeemable convertible preferred stock |
— | 90,059 | |||||
Stockholders' equity (deficit): |
|||||||
Common stock, par value $0.001 per share—200,000,000 and 105,000,000 shares authorized as of December 31, 2011 and 2010, respectively; 42,218,906 and 5,619,716 shares issued and outstanding |
42 | 6 | |||||
Additional paid-in capital |
180,680 | — | |||||
Accumulated deficit |
(100,549 | ) | (64,362 | ) | |||
Total stockholders' equity (deficit) |
80,173 | (64,356 | ) | ||||
Total liabilities, redeemable convertible preferred stock and stockholders' equity (deficit) |
$ | 127,814 | $ | 55,571 | |||
See accompanying notes to consolidated financial statements.
81
INTERMOLECULAR, INC. AND SUBSIDIARIES
Consolidated Statements of Operations
(In thousands, except share and per share data)
| |
Years Ended December 31, | |||||||||
|---|---|---|---|---|---|---|---|---|---|---|
| |
2011 | 2010 | 2009 | |||||||
Revenue: |
||||||||||
Collaborative development program and services revenue |
$ | 36,733 | $ | 27,705 | $ | 14,182 | ||||
Product revenue |
2,717 | 6,959 | 9,065 | |||||||
Licensing and royalty revenue |
14,380 | 8,010 | 3,663 | |||||||
Total revenue |
53,830 | 42,674 | 26,910 | |||||||
Cost of revenue: |
||||||||||
Cost of collaborative development program and services revenue |
23,761 | 16,855 | 8,849 | |||||||
Cost of product revenue |
953 | 3,665 | 3,972 | |||||||
Cost of licensing and royalty revenue |
755 | 406 | 197 | |||||||
Total cost of revenue |
25,469 | 20,926 | 13,018 | |||||||
Gross profit |
28,361 | 21,748 | 13,892 | |||||||
Operating expenses: |
||||||||||
Research and development |
19,260 | 13,917 | 10,983 | |||||||
Sales and marketing |
4,285 | 4,074 | 3,211 | |||||||
General and administrative |
8,534 | 5,761 | 4,867 | |||||||
Total operating expenses |
32,079 | 23,752 | 19,061 | |||||||
Loss from operations |
(3,718 | ) | (2,004 | ) | (5,169 | ) | ||||
Other income (expense): |
||||||||||
Interest income (expense), net |
(87 | ) | 43 | (6 | ) | |||||
Other income (expense), net |
(26,167 | ) | 202 | (62 | ) | |||||
Total other income (expense), net |
(26,254 | ) | 245 | (68 | ) | |||||
Loss before provision for income taxes |
(29,972 |
) |
(1,759 |
) |
(5,237 |
) |
||||
Provision for income taxes |
43 | 19 | 17 | |||||||
Net loss |
(30,015 | ) | (1,778 | ) | (5,254 | ) | ||||
Accretion on redeemable convertible preferred stock |
(8,660 | ) | (14,162 | ) | (9,170 | ) | ||||
Net loss attributable to common stockholders |
$ | (38,675 | ) | $ | (15,940 | ) | $ | (14,424 | ) | |
Net loss per share of common stock, basic and diluted |
$ | (3.99 | ) | $ | (2.86 | ) | $ | (2.62 | ) | |
Weighted-average number of shares used in computing net loss per share of common stock, basic and diluted |
9,698,880 | 5,567,286 | 5,511,889 | |||||||
Related Party Transactions
The Consolidated Statements of Operations shown above include the following related party transactions:
| |
Years Ended December 31, | |||||||||
|---|---|---|---|---|---|---|---|---|---|---|
| |
2011 | 2010 | 2009 | |||||||
Revenue: |
||||||||||
Collaborative development program and services revenue |
$ | 11,294 | $ | 13,382 | $ | 3,263 | ||||
Product revenue |
11 | 6,047 | 9,065 | |||||||
Licensing and royalty revenue |
9,688 | 6,584 | 3,663 | |||||||
Total revenue |
$ | 20,993 | $ | 26,013 | $ | 15,991 | ||||
Cost of Revenue: |
||||||||||
Cost of collaborative development program and services revenue |
1,075 | 1,250 | 597 | |||||||
Cost of product revenue |
119 | 322 | 429 | |||||||
Cost of licensing and royalty revenue |
635 | 406 | 197 | |||||||
Total cost of revenue |
$ | 1,829 | $ | 1,978 | $ | 1,223 | ||||
See accompanying notes to consolidated financial statements.
82
INTERMOLECULAR, INC. AND SUBSIDIARIES
Consolidated Statements of Redeemable Convertible Preferred Stock and of Stockholders' Equity (Deficit)
(In thousands, except share data)
| |
|
|
Stockholders' Equity (Deficit) | |||||||||||||||||||
|---|---|---|---|---|---|---|---|---|---|---|---|---|---|---|---|---|---|---|---|---|---|---|
| |
Redeemable Convertible Preferred Stock |
|||||||||||||||||||||
| |
Common stock | |
|
|
||||||||||||||||||
| |
Additional paid-in capital |
Accumulated deficit |
Total stockholders' equity (deficit) |
|||||||||||||||||||
| |
Shares | Amount | Shares | Amount | ||||||||||||||||||
Balances as of December 31, 2008 |
52,443,325 | $ | 66,740 | 5,503,376 | $ | 6 | $ | — | $ | (36,585 | ) | $ | (36,579 | ) | ||||||||
Issuance of common stock from option exercises |
— | — | 29,425 | — | 33 | — | 33 | |||||||||||||||
Issuance cost increase of Series D redeemable convertible preferred stock increase to $103 |
— | (13 | ) | — | — | — | — | — | ||||||||||||||
Stock-based compensation |
— | — | — | — | 1,081 | — | 1,081 | |||||||||||||||
Accretion of preferred stock to redemption amount |
— | 9,170 | — | — | (1,114 | ) | (8,056 | ) | (9,170 | ) | ||||||||||||
Net loss |
— | — | — | — | — | (5,254 | ) | (5,254 | ) | |||||||||||||
Balances as of December 31, 2009 |
52,443,325 | 75,897 | 5,532,801 | 6 | — | (49,895 | ) | (49,889 | ) | |||||||||||||
Issuance of common stock from option exercises |
— | — | 86,915 | — | 109 | — | 109 | |||||||||||||||
Stock-based compensation |
— | — | — | — | 1,364 | — | 1,364 | |||||||||||||||
Accretion of preferred stock to redemption amount |
— | 14,162 | — | — | (1,473 | ) | (12,689 | ) | (14,162 | ) | ||||||||||||
Net loss |
— | — | — | — | — | (1,778 | ) | (1,778 | ) | |||||||||||||
Balances as of December 31, 2010 |
52,443,325 | 90,059 | 5,619,716 | 6 | — | (64,362 | ) | (64,356 | ) | |||||||||||||
Issuance of Series E redeemable convertible preferred stock (net of issuance costs of $118) |
6,018,122 | 24,882 | — | — | — | — | — | |||||||||||||||
Conversion of preferred stock into common stock at a conversion rate of 1-for-2 |
(58,461,447 | ) | (123,601 | ) | 29,230,708 | 29 | 123,572 | — | 123,601 | |||||||||||||
Proceeds from initial public offering, net of expenses |
— | — | 5,681,796 | 6 | 49,211 | — | 49,217 | |||||||||||||||
Reclassification of preferred stock warrant liability to APIC upon IPO |
— | — | — | — | 769 | — | 769 | |||||||||||||||
Issuance of common stock from option exercises |
— | — | 368,194 | — | 446 | — | 446 | |||||||||||||||
Stock-based compensation |
— | — | — | — | 2,413 | — | 2,413 | |||||||||||||||
Issuance of common stock warrants |
— | — | — | — | 341 | — | 341 | |||||||||||||||
Exercise of warrants |
— | — | 1,313,492 | 1 | 6,375 | — | 6,376 | |||||||||||||||
Non cash issuance of common stock for services |
— | — | 5,000 | — | 41 | — | 41 | |||||||||||||||
Accretion of preferred stock to redemption amount |
— | 8,660 | — | — | (2,488 | ) | (6,172 | ) | (8,660 | ) | ||||||||||||
Net loss |
— | — | — | — | — | (30,015 | ) | (30,015 | ) | |||||||||||||
Balances as of December 31, 2011 |
— | $ | — | 42,218,906 | $ | 42 | $ | 180,680 | $ | (100,549 | ) | $ | 80,173 | |||||||||
See accompanying notes to consolidated financial statements.
83
INTERMOLECULAR, INC. AND SUBSIDIARIES
Consolidated Statements of Cash Flows
(In thousands)
| |
Years Ended December 31, | |||||||||
|---|---|---|---|---|---|---|---|---|---|---|
| |
2011 | 2010 | 2009 | |||||||
Cash flows from operating activities: |
||||||||||
Net loss |
$ |
(30,015 |
) |
$ |
(1,778 |
) |
$ |
(5,254 |
) |
|
Adjustments to reconcile net loss to net cash provided by (used in) operating activities: |
||||||||||
Depreciation and amortization |
7,079 | 4,971 | 4,380 | |||||||
Stock-based compensation |
2,442 | 1,364 | 1,081 | |||||||
Revaluation of preferred stock warrant liability |
554 | 56 | 42 | |||||||
Revaluation of derivative liability |
24,476 | — | — | |||||||
Common stock warrant charge (contra revenue) |
312 | — | — | |||||||
Loss on disposal of property and equipment |
65 | — | — | |||||||
Changes in operating assets and liabilities: |
||||||||||
Prepaid expenses and other assets |
(2,677 | ) | 1,523 | 279 | ||||||
Inventory |
(343 | ) | (810 | ) | 778 | |||||
Accounts receivable |
(7,030 | ) | (2,943 | ) | 567 | |||||
Accounts payable |
(203 | ) | 1,000 | (561 | ) | |||||
Accrued and other liabilities |
5,446 | 2,274 | 293 | |||||||
Deferred revenue |
(5,128 | ) | 4,827 | 476 | ||||||
Related party deferred revenue |
(3,134 | ) | (9,309 | ) | (993 | ) | ||||
Net cash provided by (used in) operating activities |
(8,156 | ) | 1,175 | 1,088 | ||||||
Cash flows from investing activities: |
||||||||||
Purchase of short-term investments |
(750 | ) | — | (11,764 | ) | |||||
Redemption of short-term investments |
750 | 11,764 | — | |||||||
Purchase of property and equipment |
(12,806 | ) | (10,517 | ) | (4,810 | ) | ||||
Purchased and capitalized intangible assets |
(835 | ) | (323 | ) | (134 | ) | ||||
Decrease in restricted cash |
173 | — | — | |||||||
Net cash (used in) provided by investing activities |
(13,468 | ) | 924 | (16,708 | ) | |||||
Cash flows from financing activities: |
||||||||||
Payment of long-term debt |
— | — | (4,446 | ) | ||||||
Payment of selling stockholder offering costs |
(1,389 | ) | — | — | ||||||
Proceeds from exercise of common stock options |
476 | 109 | 33 | |||||||
Proceeds from exercise of common stock warrants |
6,376 | — | — | |||||||
Proceeds from initial public offering, net of expenses |
49,217 | — | — | |||||||
Proceeds from issuance of redeemable convertible preferred stock, net of issuance costs |
24,882 | — | (13 | ) | ||||||
Net cash provided by (used in) financing activities |
79,562 | 109 | (4,426 | ) | ||||||
Net increase (decrease) in cash and cash equivalents |
57,938 | 2,208 | (20,046 | ) | ||||||
Cash and cash equivalents at beginning of period |
23,064 |
20,856 |
40,902 |
|||||||
Cash and cash equivalents at end of period |
$ | 81,002 | $ | 23,064 | $ | 20,856 | ||||
Supplemental disclosure of cash flow information: |
||||||||||
Cash paid for interest |
$ | — | $ | — | $ | 113 | ||||
Cash paid for income taxes, net of refunds received |
$ | 20 | $ | (73 | ) | $ | 279 | |||
Noncash investing and financing activities |
||||||||||
Accretion of redeemable convertible preferred stock |
$ | 8,660 | $ | 14,162 | $ | 9,170 | ||||
Contract intangible obtained under a derivative liability |
$ | 2,842 | $ | — | $ | — | ||||
Issuance of debt in connection with derivative liability |
$ | 27,318 | $ | — | $ | — | ||||
See accompanying notes to consolidated financial statements.
84
INTERMOLECULAR, INC. AND SUBSIDIARIES
Notes to Consolidated Financial Statements
1. The Company and Summary of Significant Accounting Policies
Business
Intermolecular, Inc. and subsidiaries (the Company) is headquartered in San Jose, California and has wholly-owned subsidiaries in Hong Kong and Japan and a wholly-owned branch in Taiwan.
The Company develops and applies high productivity combinatorial research and development technologies to accelerate research and development, innovation and time to market for the semiconductor and clean-energy industries. The Company creates high productivity combinational systems and methods, which allow the Company to perform collaborative research and development services, sell high productivity combinatorial systems, and license intellectual property to customers.
The Company's consolidated financial statements have been prepared on a going-concern basis, which contemplates the realization of assets and the settlement of liabilities and commitments in the normal course of business. Since inception, the Company has incurred net losses and has accumulated a deficit of $100.5 million and $64.4 million as of December 31, 2011 and 2010, respectively.
Basis of Presentation
The Company's consolidated financial statements have been prepared in conformity with accounting principles generally accepted in the United States of America (GAAP) and include the accounts of the Company and its consolidated subsidiaries. All intercompany transactions and balances have been eliminated during consolidation. Certain prior-year balances have been reclassified to conform to current financial statement presentation.
Initial Public Offering
On November 23, 2011, the Company completed an initial public offering of its common stock in which the Company sold and issued 5,681,796 shares of its common stock and a selling stockholder sold 3,968,204 shares of the Company's common stock, in each case at a public offering price of $10.00 per share. The Company raised a total of $56.8 million in gross proceeds from the initial public offering, or approximately $49.2 million in net proceeds after deducting underwriting discounts and commissions of $4.0 million and other offering costs of approximately $3.6 million.
Stock Split
On October 26, 2011, the board of directors approved an amended and restated certificate of incorporation that was filed on November 15, 2011, which effected a 1-for-2 reverse stock split of our issued and outstanding shares of common stock. The par value of the common stock was not adjusted as a result of the reverse stock split. All issued and outstanding shares of common stock, warrants for common stock, and per share amounts contained in the Company's financial statements have been retroactively adjusted to reflect this reverse stock split for all periods presented.
On November 21, 2011, in connection with the Company's initial public offering, all outstanding redeemable convertible preferred stock were automatically converted to shares of common stock at a conversion rate of 1-for-2 and the Company filed an amended and restated certificate of incorporation on November 23, 2011 effecting the conversion.
85
INTERMOLECULAR, INC. AND SUBSIDIARIES
Notes to Consolidated Financial Statements (Continued)
1. The Company and Summary of Significant Accounting Policies (Continued)
Use of Estimates
The preparation of the accompanying consolidated financial statements in conformity with GAAP requires management to make estimates and assumptions about future events. These estimates and the underlying assumptions affect the amounts of assets and liabilities reported, disclosures about contingent assets and liabilities, and reported amounts of revenue and expenses. Such estimates include the valuations of accounts receivable, inventories, intangible assets, debt, capital stock and warrants and assumptions used in the calculation of income taxes and stock-based compensation, among others. These estimates and assumptions are based on management's best estimates and judgment. Management evaluates its estimates and assumptions on an ongoing basis using historical experience and other factors and adjusts such estimates and assumptions when facts and circumstances dictate. As future events and their effects cannot be determined with precision, actual results could differ significantly from these estimates.
Concentration of Credit Risk
Financial instruments that potentially subject the Company to concentration of credit risk consist of cash, cash equivalents and short-term investments. The Company's cash, cash equivalents and short-term investments consist of demand deposits, money market accounts and certificates of deposit maintained with high quality financial institutions.
Cash and Cash Equivalents
The Company considers all highly liquid investments purchased with a maturity of three months or less to be cash equivalents. The Company's cash equivalents are comprised of money market funds and are maintained with high quality financial institutions.
Restricted Cash
In connection with a lease transaction, the Company has restricted cash pledged as collateral representing a security deposit required by the lease agreement for its headquarters. Restricted cash as of December 31, 2011 and 2010 was $0 and $173,000, respectively.
Inventory
Inventories are stated at the lower of cost or market value, with cost determined on an average cost basis. Inventories consist only of raw materials. Inventories in excess of salable amounts and spare parts inventories that are considered obsolete are recorded as a cost in the period in which they occur. The Company did not experience any significant inventory impairments during the three-year-period ended December 31, 2011.
Property and Equipment
Property and equipment are stated at cost less accumulated depreciation and amortization. Depreciation of equipment is recognized on a straight-line basis over the estimated useful lives of the equipment, generally ranging from three to five years. Leasehold improvements are amortized over the shorter of the lease term or the estimated useful life of the assets. Maintenance and repairs that do not extend the life of or improve an asset are expensed in the period incurred.
86
INTERMOLECULAR, INC. AND SUBSIDIARIES
Notes to Consolidated Financial Statements (Continued)
1. The Company and Summary of Significant Accounting Policies (Continued)
Intangible Assets
Intangible assets consist of issued and pending patents and trademarks as a result of third-party legal fees incurred in the patent and trademark application processes and patents acquired in connection with the Symyx asset purchase transaction disclosed in note 5. Intangible assets with finite lives are amortized on a straight-line basis over their useful lives, while intangible assets without finite lives are not amortized. Upon the issuance of pending patent and trademark applications, the period of benefit will be determined. Patents, upon issuance, have a maximum life of 20 years from their application filing date. Trademarks, upon issuance, have an indefinite life and will not be amortized.
Impairment of Long-Lived Assets
The Company evaluates its long-lived assets, which consist of property and equipment and intangible assets, for indicators of possible impairment when events or changes in circumstances indicate the carrying amount of an asset may not be recoverable. Impairment exists if the carrying amounts of such assets exceed the estimates of future net undiscounted cash flows expected to be generated by such assets. Should impairment exist, the impairment loss would be measured based on the excess carrying value of the asset over the estimated fair value of the asset. As of December 31, 2011 and 2010, the Company has not recorded an impairment on any of its long-lived assets.
Revenue Recognition
The Company derives its revenue from three principal sources: collaborative development programs and other services; product sales; and technology licensing and royalty fees. Revenue is recognized when all of the following criteria are met:
- •
- Persuasive evidence of an arrangement exists;
- •
- Delivery has occurred;
- •
- The vendor's fee is fixed or determinable; and
- •
- Collectability of the fee is probable.
Persuasive evidence of the arrangement represents a written contract signed by both the Company and the customer, or a customer purchase order. The Company assesses whether a price is fixed or determinable by, among other things, reviewing contractual terms and conditions related to payment terms. The Company assesses collectability based on factors such as the customer's creditworthiness and past collection history, if applicable. If collection is not probable, revenue recognition is deferred until receipt of payment.
Collaborative development programs and other services—The Company enters into collaborative development programs and other research and development service agreements with customers under which the Company conducts research and development activities jointly with the customer. The agreements specify minimum levels of research effort required to be performed by the Company. Payments received under the agreements are not refundable if the research effort is not successful. The Company retains rights to certain elements of technology developed in the course of its performance, which the customer has an option to license in the future under the terms defined in the agreement. Most arrangements with customers have fixed monthly fees and requirements to provide regular
87
INTERMOLECULAR, INC. AND SUBSIDIARIES
Notes to Consolidated Financial Statements (Continued)
1. The Company and Summary of Significant Accounting Policies (Continued)
reporting of research and development activities performed and revenue is recognized in a manner consistent with the fixed monthly fee. Payments received prior to performance are deferred and recognized as revenue when earned over future performance periods.
The Company considers arrangements that include specifically identified, dedicated equipment to contain a lease provision, as these arrangements convey the right to the customer to use specific equipment and provide the ability to the customer to direct the use of the equipment as well as control more than a minor amount of the output of the equipment. To date the Company has determined these arrangements to contain operating leases, with a lease term that corresponds to the term of the CDP arrangement. The amount of revenue allocated for the lease element is based on its relative fair value, but the impact of the allocation does not change the amount of revenue recognized for the total arrangement as the lease term is consistent with the CDP term.
Future minimum operating lease payments associated with CDP arrangements that contain operating leases were $11.3 million and $5.2 million as of December 31, 2011 and 2010, respectively.
Product maintenance and support services—Included in collaborative development programs and other services revenue, these services entitle customers to receive product updates and enhancements or technical support and maintenance, depending on the offering. The related revenue is recognized ratably over the period the services are delivered.
Product revenue—The Company recognizes revenue from the sale of products once delivery has occurred (title and risk of loss have passed to the customer), and customer acceptance, if required, has been achieved. The Company has determined that the software included with its equipment products is more than incidental to the product as a whole.
Licensing and royalty revenue—The Company recognizes revenue for licenses to intellectual property when earned pursuant to the terms of the agreements. Time-based license revenue is recognized ratably over the license term. Licensing and royalty revenue that becomes triggered by specific customer actions, such as exercise of a license option or by sales volume, is recognized when it occurs based on royalty reports or other information received from the licensee. Minimum and prepaid royalties and license fees are recognized ratably over the related periods.
Multiple-element arrangements—Certain of the Company's customer arrangements involve the delivery or performance of multiple products, services or licenses. Product sale arrangements include product maintenance and support. Collaborative development programs and other research and development services include licenses of technology and may also include sales of products.
The Company evaluates whether a delivered element has value to the customer without the remaining undelivered elements by determining whether the delivered element could be sold by the Company, or resold by the customer, on a stand- alone basis. The Company concluded that all of its products and services deliverables have value to the customers on a stand-alone basis, as all these deliverables have been or could be sold and used by customers on a stand-alone basis. Intellectual property license arrangements have value on a stand-alone basis if the customer could purchase and use them without the remaining elements of the arrangement. For transactions entered into prior to January 1, 2011, the Company assesses whether there is objective and reliable evidence of fair values of all undelivered elements. Fair values of such elements are determined by reference to the Company-specific objective evidence, such as pricing of these elements when sold separately, substantive renewal
88
INTERMOLECULAR, INC. AND SUBSIDIARIES
Notes to Consolidated Financial Statements (Continued)
1. The Company and Summary of Significant Accounting Policies (Continued)
prices for product maintenance and support and time-based licenses, or other available evidence. If the fair value of any undelivered elements in a multiple-element arrangement cannot be objectively determined, revenue is deferred until all elements are delivered, or until fair value can objectively be determined for any remaining undelivered elements. However, in situations where the undelivered elements are software-related hardware elements, the Company will recognize revenue under a proportional performance model when fair value for the hardware elements is not available, if the undelivered hardware elements are substantially similar products. If product maintenance and support and time-based licenses are the only undelivered elements without objective and reliable evidence of fair value, all revenue from the arrangement is amortized over the longer of the product maintenance and support term or license period. For purposes of classification in the consolidated statements of operations, revenue is allocated between collaborative development programs and services revenue, product revenue and licensing and royalty revenue based on objective and reliable evidence of fair value for any elements for which it exists or based on the relative stated invoice amount for elements for which objective and reliable evidence of fair value does not exist.
In 2009, the Financial Accounting Standards Board (FASB) issued ASU 2009-13 Revenue Recognition (Topic 605): Multiple-Deliverable Revenue Arrangements—a consensus of the FASB Emerging Issues Task Force (ASU 2009-13) and ASU 2009-14 Software (Topic 985): Certain Revenue Arrangements That Include Software Elements—a consensus of the FASB Emerging Issues Task Force (ASU 2009-14). ASU 2009-13 and 14 are amendments to the accounting standards for revenue recognition to remove tangible products containing software components and nonsoftware components that function together to deliver the product's essential functionality from the scope of industry- specific software revenue recognition guidance, and also:
- •
- provide updated guidance on whether multiple deliverables exist, how the deliverables in an arrangement should be
separated, and how the consideration should be allocated;
- •
- require an entity to allocate revenue in an arrangement using estimated selling prices (ESP) of deliverables if the
Company does not have vendor- specific objective evidence of selling price (VSOE) or third-party evidence of selling price (TPE); and
- •
- eliminate the use of the residual method and require an entity to allocate revenue using the relative selling price method.
For all transactions entered into after December 31, 2010, the Company recognizes revenue using estimated selling prices of the delivered goods and services based on a hierarchy of methods contained in ASU 2009-13. The Company uses VSOE for determination of estimated selling price of elements in each arrangement if available, and since third-party evidence is not available for those elements where vendor-specific objective evidence of selling price cannot be determined, the Company evaluates factors to determine its ESP for all other elements. In multiple-element arrangements where hardware and software are sold as part of the solution, revenue is allocated to the hardware and software as a group using the relative selling prices of each of the deliverables in the arrangement based upon the aforementioned selling price hierarchy.
The adoption of ASU 2009-13 and 14 did not have a material impact on the Company's consolidated financial condition, operating revenue, results of operations or cash flows for the year ended December 31, 2011 as there were no multiple-element arrangements that included the sale of products originating during the period. The adoption of this standard may impact future revenue
89
INTERMOLECULAR, INC. AND SUBSIDIARIES
Notes to Consolidated Financial Statements (Continued)
1. The Company and Summary of Significant Accounting Policies (Continued)
recognition for multiple-element product arrangements where product maintenance and support and time-based licenses are the only undelivered elements. The impact of adopting these provisions will result in more product revenue being recognized in earlier periods as the Company allocates revenue using the relative selling price method as opposed to recognizing all revenue from the arrangement ratably over the longer of the product maintenance and support term or license period.
Deferred Revenue
Deferred revenue represents amounts collected from customers for which the related revenue has not been recognized, because one or more of the revenue recognition criteria have not been met. The current portion of deferred revenue represents the amount that is expected to be recognized as revenue within one year from the balance sheet date.
Accounts Receivable and Allowance for Doubtful Accounts
Trade accounts receivable are recorded at invoiced amounts, which include unbilled contractually obligated amounts, net of allowances for doubtful accounts if applicable, and do not bear interest.
The allowance for doubtful accounts is based on the Company's assessment of the collectability of its customer accounts. The Company reviews the allowance by considering certain factors such as historical experience, industry data, credit quality, age of balances and current economic conditions that may affect a customers' ability to pay. The Company determined that an allowance for doubtful accounts was not required as of December 31, 2011 and 2010 and did not recognize any charges to bad debt during the years ended December 31, 2011 and 2010.
90
INTERMOLECULAR, INC. AND SUBSIDIARIES
Notes to Consolidated Financial Statements (Continued)
1. The Company and Summary of Significant Accounting Policies (Continued)
Concentration of Revenue and Accounts Receivable
Significant customers are those that represent more than 10% of the Company's total revenue or accounts receivable. For each significant customer, including related parties, revenue as a percentage of total revenue and accounts receivable as a percentage of total accounts receivable are as follows:
| |
Revenue | Accounts Receivable |
||||||||||||||
|---|---|---|---|---|---|---|---|---|---|---|---|---|---|---|---|---|
| |
Years Ended December 31, |
As of December 31, |
||||||||||||||
| |
2011 | 2010 | 2009 | 2011 | 2010 | |||||||||||
Customer A |
29 | % | 52 | % | 59 | % | * | 11 | % | |||||||
Customer B |
* | * | — | * | 20 | % | ||||||||||
Customer C |
* | * | — | — | 12 | % | ||||||||||
Customer D(1) |
18 | % | 20 | % | 29 | % | * | * | ||||||||
Customer E |
* | * | — | * | 11 | % | ||||||||||
Customer F |
* | * | — | * | 19 | % | ||||||||||
Customer G |
17 | % | * | — | 78 | % | 24 | % | ||||||||
- *
- less
than 10%
- (1)
- In February 2012, Customer D filed for protection under the Corporate Reorganization Act in Japan. As part of any restructuring under this law Customer D may either voluntarily or involuntarily reduce or eliminate payments owed to the Company or shipments of products that include the Company's technology, which would lead to a reduction in revenue from Customer D. During the years ended December 31, 2011, 2010 and 2009 the Company recognized $9.9 million, $8.6 million and $7.9 million in revenue from Customer D.
Cost of Revenue
Cost of revenue is primarily comprised of salaries and other personnel-related expenses for collaborative research and development scientists, engineers and development fab process operations employees. Additionally, cost of revenue includes wafers, targets, materials, program-related supplies, depreciation on equipment used in collaborative development programs and allocated facility-related costs. Product cost of revenue primarily includes cost of products sold. Cost of licensing and royalty includes related party license fees paid to Symyx. As a result of the Symyx asset purchase transaction the amortization of acquired patents is being recorded in cost of revenue.
Research and Development
Research and development expenses, including direct and allocated expenses, are expensed as incurred. Research and development costs include salaries of technical staff, consultant costs, research and development parts and prototypes, wafers, chemicals, research and development supply costs, facilities rental, utilities costs related to laboratories and offices occupied by technical staff, depreciation on equipment used by technical staff, and outside services, such as machining and third-party research and development costs.
91
INTERMOLECULAR, INC. AND SUBSIDIARIES
Notes to Consolidated Financial Statements (Continued)
1. The Company and Summary of Significant Accounting Policies (Continued)
Software Development Costs
The costs to develop software have not been capitalized as the technological feasibility of the related software is not established until substantially all product development is complete.
Income Taxes
Income taxes have been accounted for under the asset and liability method. Deferred tax assets and liabilities are determined based on the difference between the financial statement and tax bases of assets and liabilities as measured by the enacted tax rates that will be in effect when these differences reverse. Accordingly, realization of any deferred tax assets is dependent on future taxable income against which these deductions, losses and credits can be utilized.
The Company assesses the likelihood that the deferred tax assets will be recovered and establishes a valuation allowance to the extent the Company believes that it is more likely than not that all or some portion of the asset will not be realized due to the inability to generate sufficient taxable income in the period and/or of the character necessary to utilize the benefit of the deferred tax asset. The Company recorded a full valuation allowance against its deferred tax assets as of December 31, 2011 and 2010. Based on the available evidence, the Company believed it was more likely than not that it would not be able to utilize its deferred tax assets in the future. The Company intends to maintain a full valuation allowance until and if sufficient evidence exists to support all or a portion of its reversal.
The Company regularly reviews its tax positions for benefits to be realized. A tax position must be more likely than not to be sustained upon examination. The amount recognized is measured as the largest amount of benefit that is more likely than not to be realized upon settlement. The Company's policy is to recognize interest and penalties related to income tax matters as income tax expense. As of December 31, 2011, the Company has not recognized any interest or penalties associated with unrecognized tax benefits.
Share-Based Compensation
Compensation costs related to employee stock options grants are based on the fair value of the options on the date of grant, net of estimated forfeitures. The Company determines the grant date fair value of the options using the Black-Scholes option-pricing model and the related stock-based compensation expense is generally recognized on a straight-line basis over the period in which an employee is required to provide service in exchange for the options, or the vesting period of the respective options.
The Company accounts for stock options issued to nonemployees based on the fair value of the options determined using the Black-Scholes option-pricing model. The fair value of stock options granted to nonemployees is remeasured each reporting period as the stock options vest and the resulting change in value, if any, is recognized in the Company's consolidated statements of operations during the period the related services are rendered.
Comprehensive Loss
Comprehensive loss consists of the same components as net loss and therefore the Company does not separately disclose a statement of comprehensive loss.
92
INTERMOLECULAR, INC. AND SUBSIDIARIES
Notes to Consolidated Financial Statements (Continued)
1. The Company and Summary of Significant Accounting Policies (Continued)
Employee Savings Plan
The Company has a savings plan in the United States that qualifies under Section 401(k) of the Internal Revenue Code. Participating employees may contribute up to the statutory limits. The Company has not made employer contributions to the plan to date.
Segment Information
The Company operates in one reportable segment. The Company's chief operating decision-maker, its chief executive officer, reviews its operating results on an aggregate basis and manages its operations as a single operating segment.
Fair Value of Financial Instruments
The Company measures and reports its cash equivalents and preferred stock warrant liabilities at fair value. Fair value is defined as the exchange price that would be received for an asset or an exit price paid to transfer a liability in the principal or most advantageous market for the asset or liability in an orderly transaction between market participants on the measurement date. Valuation techniques used to measure fair value must maximize the use of observable inputs and minimize the use of unobservable inputs. The fair value hierarchy defines a three-level valuation hierarchy for disclosure of fair value measurements as follows:
Level I—Unadjusted quoted prices in active markets for identical assets or liabilities;
Level II—Inputs other than quoted prices included within Level I that are observable, unadjusted quoted prices in markets that are not active, or other inputs that are observable or can be corroborated by observable market data for substantially the full term of the related assets or liabilities; and
Level III—Unobservable inputs that are supported by little or no market activity for the related assets or liabilities.
The categorization of a financial instrument within the valuation hierarchy is based upon the lowest level of input that is significant to the fair value measurement.
The Company's financial instruments consist of Level I assets and Level III liabilities. Level I securities include highly liquid money market funds and certificates of deposit. The Company does not hold any Level II instruments. Level III liabilities that were measured at fair value on a recurring basis during 2011 and 2010 consisted of preferred stock warrant liabilities. The fair values of the outstanding preferred stock warrants were measured using the Black-Scholes option-pricing model. Inputs used to determine estimated fair value include the estimated fair value of the underlying stock at the valuation measurement date, the remaining contractual term of the warrants, risk-free interest rates, expected dividends and the expected volatility of the underlying stock. In connection with the Company's initial public offering in November 2011, outstanding preferred stock warrants were converted to common stock warrants and subsequently exercised.
Foreign Currency
The functional currency of foreign subsidiaries is the U.S. dollar and foreign currency transaction gains and losses are recorded in other income (expense), net.
93
INTERMOLECULAR, INC. AND SUBSIDIARIES
Notes to Consolidated Financial Statements (Continued)
1. The Company and Summary of Significant Accounting Policies (Continued)
Net Loss per Share of Common Stock
The Company's basic net loss per share of common stock is calculated by dividing the net loss by the weighted average number of shares of common stock outstanding for the period. The diluted net loss per share of common stock is computed by giving effect to all potential common stock equivalents outstanding for the period determined using the if-converted method for convertible securities and the treasury stock method for all other common stock equivalents. For purposes of this calculation, redeemable convertible preferred stock, options to purchase common stock, common stock subject to repurchase, warrants to purchase redeemable convertible preferred stock and warrants to purchase common stock are considered to be common stock equivalents but have been excluded from the calculation of diluted net loss per share of common stock as their effect is antidilutive.
Recent Accounting Pronouncements
In January 2010, the FASB issued an amendment to an accounting standard that requires new disclosures for fair value measurements and provides clarification for existing fair value disclosure requirements. The amendment will require an entity to disclose separately the amounts of significant transfers in and out of Levels I and II fair value measurements and to describe the reasons for the transfers; and to disclose information about purchases, sales, issuances and settlements separately in the reconciliation for fair value measurements using significant unobservable inputs, or Level III inputs. This amendment clarifies existing disclosure requirements for the level of disaggregation used for classes of assets and liabilities measured at fair value and requires disclosures about the valuation techniques and inputs used to measure fair value for both recurring and nonrecurring fair value measurements using Level II and Level III inputs. This guidance is effective for interim and annual reporting periods beginning after December 15, 2009, except for certain Level III activity disclosure requirements that will be effective for reporting periods beginning after December 15, 2010. Accordingly, the Company adopted this amendment as of January 1, 2010 and adopted the additional Level III requirements as of January 1, 2011. The Company did not hold any Level II investments during any of the years presented and has disclosed in note 7 the underlying inputs used to value its Level III preferred stock warrant liability.
94
INTERMOLECULAR, INC. AND SUBSIDIARIES
Notes to Consolidated Financial Statements (Continued)
2. Fair Value of Financial Instruments
The Company measures and reports its cash equivalents and preferred stock warrant liability at fair value. The following tables set forth the fair value of the Company's financial assets and liabilities by level within the fair value hierarchy (in thousands):
| |
As of December 31, 2011 | ||||||||||||
|---|---|---|---|---|---|---|---|---|---|---|---|---|---|
| |
Fair Value | Level I | Level II | Level III | |||||||||
Assets: |
|||||||||||||
Money market funds |
$ | 75,660 | $ | 75,660 | $ | — | $ | — | |||||
Certificates of deposit |
100 | 100 | |||||||||||
Total assets measured at fair value |
$ | 75,760 | $ | 75,760 | $ | — | $ | — | |||||
| |
As of December 31, 2010 | ||||||||||||
|---|---|---|---|---|---|---|---|---|---|---|---|---|---|
| |
Fair Value | Level I | Level II | Level III | |||||||||
Assets: |
|||||||||||||
Money market funds |
$ | 20,659 | $ | 20,659 | $ | — | $ | — | |||||
Total assets measured at fair value |
$ | 20,659 | $ | 20,659 | $ | — | $ | — | |||||
Liabilities: |
|||||||||||||
Preferred stock warrant liability |
$ | 215 | $ | — | $ | — | $ | 215 | |||||
Total liabilities measured at fair value |
$ | 215 | $ | — | $ | — | $ | 215 | |||||
The following table sets forth a summary of the changes in the fair value of the Company's Level III financial liabilities (in thousands):
| |
Years Ended December 31, | |||||||||
|---|---|---|---|---|---|---|---|---|---|---|
| |
2011 | 2010 | 2009 | |||||||
Fair value—beginning of period |
$ | 215 | $ | 159 | $ | 117 | ||||
Initial fair value of derivative liability |
2,842 | — | — | |||||||
Mark-to-market of warrant and derivative liabilities |
25,030 | — | — | |||||||
Reclassification of warrant liability to equity upon IPO |
(769 | ) | 56 | 42 | ||||||
Reclassification of derivative liability to note payable |
(27,318 | ) | — | — | ||||||
Fair value—end of period |
$ | — | $ | 215 | $ | 159 | ||||
95
INTERMOLECULAR, INC. AND SUBSIDIARIES
Notes to Consolidated Financial Statements (Continued)
3. Property and Equipment
Property and equipment consist of the following (in thousands):
| |
As of December 31, | ||||||
|---|---|---|---|---|---|---|---|
| |
2011 | 2010 | |||||
Lab equipment and machinery |
$ | 33,515 | $ | 24,766 | |||
Leasehold improvements |
2,086 | 5,055 | |||||
Computer equipment and software |
3,016 | 2,314 | |||||
Furniture and fixtures |
146 | 108 | |||||
Construction in progress |
5,088 | 5,252 | |||||
Total property and equipment |
43,851 | 37,495 | |||||
Less accumulated depreciation |
(18,723 | ) | (15,767 | ) | |||
Property and equipment, net |
$ | 25,128 | $ | 21,728 | |||
As of December 31, 2011 all tangible property and equipment were pledged as collateral against the note payable issued in connection with the closing of the Symyx asset purchase transaction. As of December 31, 2010 no property and equipment were pledged as collateral against borrowings. Amortization of leasehold improvements is included in depreciation expense. Depreciation expense was $7.0 million, $5.0 million, and $4.4 million during the years ended December 31, 2011, 2010 and 2009, respectively.
The Company maintained dedicated equipment to support contractual customer capacity requirements as part of certain collaborative development programs that are classified as lab equipment and machinery that have a net book value of $7.0 million and $2.1 million as of December 31, 2011 and 2010, respectively.
4. Intangible Assets
Intangible assets consist of the following (in thousands):
| |
As of December 31, |
||||||
|---|---|---|---|---|---|---|---|
| |
2011 | 2010 | |||||
Patents issued |
$ | 3,562 | $ | 209 | |||
Patents pending |
2,566 | 2,009 | |||||
Trademarks |
38 | 38 | |||||
Total intangible assets |
6,166 | 2,256 | |||||
Less patent amortization |
(99 | ) | (18 | ) | |||
Intangible assets, net |
$ | 6,067 | $ | 2,238 | |||
Amortization commences upon patent issuance. The useful life of the patents, once approved, will not exceed 20 years, and will depend on the nature of the patent. The average estimated amortization period of our current portfolio is 17 years from the date of patent issuance. The average estimated remaining amortization period of patents acquired as part of the Symyx asset purchase transaction disclosed in note 5 is 6 years. Amortization expense during the years ended December 31, 2011, 2010 and 2009 was $81,000, $9,000, and $5,000, respectively.
96
INTERMOLECULAR, INC. AND SUBSIDIARIES
Notes to Consolidated Financial Statements (Continued)
4. Intangible Assets (Continued)
Estimated future aggregate annual amortization expense for both issued and pending intangible assets is as follows (in thousands):
As of December 31: |
||||
2012 |
$ | 640 | ||
2013 |
700 | |||
2014 |
700 | |||
2015 |
624 | |||
2016 |
423 | |||
Thereafter |
2,942 | |||
Total |
$ | 6,029 | ||
5. Commitments and Contingencies
Leases
The Company entered into an operating lease agreement in July 2005 for its facility in California with a lease term that expires on October 31, 2011. During the year ended December 31, 2008, the space under the operating lease was expanded to support the Company's operating needs. During the year ended December 31, 2010, the Company relocated its operations to a new facility and, accordingly, entered into an operating lease agreement in May 2010 that expires in May 2015. Rent expense for both facilities, which is being recognized on a straight-line basis over the lease term, was approximately $2.0 million, $1.6 million, $0.8 million during the years ended December 31, 2011, 2010 and 2009, respectively. Future commitments and obligations under the operating leases to be satisfied as they become due over the term are as follows (in thousands):
As of December 31: |
||||
The years ending December 31, |
||||
2012 |
$ | 1,573 | ||
2013 |
1,657 | |||
2014 |
1,707 | |||
2015 |
728 | |||
Total |
$ | 5,665 | ||
During 2011, the Company made payments of $1.6 million on operating leases.
Equipment Loan
On June 1, 2007, the Company borrowed $3.8 million pursuant to the terms of a loan and security agreement with a bank that was signed in 2005. In May 2008, the Company borrowed an additional $3.0 million under this loan and security agreement. The loan amounts were payable over a 36-month term ending June 1, 2010 and May 1, 2011, respectively. The outstanding loan balances under this loan and security agreement were paid off in February 2009. Effective January 27, 2010 and March 26, 2010, the Company amended the terms of the loan and security agreement to extend the availability of additional loan advances through December 31, 2011. Any additional borrowing will be payable in 36 monthly installments ending no later than December 1, 2013. These loans are secured by all
97
INTERMOLECULAR, INC. AND SUBSIDIARIES
Notes to Consolidated Financial Statements (Continued)
5. Commitments and Contingencies (Continued)
company assets, excluding intellectual property. The amount borrowed must be requested in no less than $500,000 increments. The loan amount must be 100% first position secured by eligible equipment purchased within 270 days before the equipment advance. The loan advance allows for a look back for eligible equipment purchased, as long as the loan request is made within 90 days of the execution of the loan and security agreement. Equipment advances will accrue interest at a 5.50% annual rate.
In connection with the original loan and security agreement, the Company issued a warrant to purchase Series B redeemable convertible preferred stock for 2.5% of the value of the loan facility. As of December 31, 2010, there was no outstanding balances under the equipment loans and the Company was compliant with all loan covenants, which primarily consist of monthly and annual financial statement reporting and the maintenance of certain minimum financial ratios. As of December 31, 2010, there was $10.0 million available for advances under this loan and security agreement. On September 15, 2011, the Company terminated its loan and security agreement. There were no balances outstanding under the loan and security agreement and the Company was compliant with all covenants.
Symyx Asset Purchase and Note Payable
On July 28, 2011, the Company entered into an agreement with Symyx Technologies, Inc., a related party at the time of the agreement (Symyx), pursuant to which the Company agreed to use commercially reasonable efforts to allow Symyx to sell in the initial public offering of its common stock a total of 3,968,204 shares of common stock held by them, and Symyx agreed to sell such shares in the offering, transfer to the Company all patents held by them that relate to combinatorial processing and terminate future royalty obligations under the Symyx agreements to the extent they would have accrued after December 31, 2011. The Company completed this asset purchase in connection with the closing of its initial public offering in November 2011. In connection with this transaction, the Company also issued Symyx a secured promissory note in a principal amount equal to $27.3 million with a term of 24 months and an interest rate equal to 4%. The note is payable in an amount equal to the greater of $500,000 per quarter or the amount of accrued interest, with a balloon payment at maturity, if applicable. The note is also pre-payable by the Company at any time without penalty or premium, and is secured by tangible personal property, excluding intellectual property. In addition, the Company reimbursed Symyx for 50% of the underwriting discounts and commissions payable by them in connection with the sale of their common stock in the offering, which amount was equal to approximately $1.4 million.
In connection with entering into the agreement the Company recorded a derivative liability representing the value of the guaranteed return to Symyx and reimbursement of 50% of the underwriting discounts and commissions payable in connection with the offering. The Company recorded the liability at inception because it has effectively issued a written option that requires the Company to settle with a cash payment to Symyx. The initial fair value of the contract as of the date of the agreement was determined using a hybrid model utilizing a probability-weighted expected return model and a Monte Carlo Simulation model to be $2.8 million, which incorporates parameters such as the volatility of the Company's stock price, the time value of the feature, the strike price on the guarantee, the likelihood of an initial public offering, and the obligation to pay a portion of Symyx's selling costs. Between July 28, 2011 and the date of the offering, the Company adjusted the fair value of the derivative liability to market value, with changes in the market value recorded in other income (expense), net, in the Company's statement of operations. On July 28, 2011, the Company recorded an
98
INTERMOLECULAR, INC. AND SUBSIDIARIES
Notes to Consolidated Financial Statements (Continued)
5. Commitments and Contingencies (Continued)
intangible asset in the amount of $2.8 million that represents the value of the intangible assets that was transferred by Symyx to the Company upon the completion of the offering.
During 2011 and until the completion of the Company initial public offering on November 23, 2011, the Company recorded charges to other income (expense), net in the amount of $25.9 million that represents the change in value of the derivative liability. The following table sets forth a summary of the changes in the fair value of the Company's derivative liability related to the Symyx asset purchase transaction (in thousands):
Minimum return to Symyx |
$ | 67,000 | ||
Proceeds to Symyx from offering |
(39,682 | ) | ||
Initial fair value of derivative liability |
(2,842 | ) | ||
Reimbursement of offering related expenses |
1,389 | |||
Mark-to-market adjustment |
$ | 25,865 | ||
Litigation
The Company is subject to various claims arising in the ordinary course of business. Although no assurance may be given, the Company believes that it is not presently a party to any litigation of which the outcome, if determined adversely, would individually or in the aggregate be reasonably expected to have a material adverse effect on the business, operating results, cash flows or financial position of the Company.
Third parties and others may claim in the future that the Company has infringed their past, current or future intellectual property rights. These claims, whether meritorious or not, could be time-consuming, result in costly litigation, require expensive changes in the Company's methods of doing business or require the Company to enter into costly royalty or licensing agreements, if available. As a result, these claims could harm the Company's business, operating results, cash flows and financial position.
Indemnification
From time to time, the Company agrees to indemnify certain customers against certain third-party liabilities, including liability if its products infringe a third party's intellectual property rights. The indemnification is typically limited to no more than the amount paid by the customer. As of December 31, 2011 and 2010, the Company was not subject to any material pending intellectual property-related litigation for which it is indemnifying a customer.
99
INTERMOLECULAR, INC. AND SUBSIDIARIES
Notes to Consolidated Financial Statements (Continued)
6. Redeemable Convertible Preferred Stock
On November 23, 2011, the closing date of the Company's initial public offering, and pursuant to the amended and restated certificate of incorporation, all outstanding shares of redeemable convertible preferred stock converted into an aggregate of 29,230,708 shares of common stock.
| |
Conversion Rate |
Preferred Stock Shares |
Common Stock Shares |
|||||||
|---|---|---|---|---|---|---|---|---|---|---|
Series A |
1-for-2 | 8,399,831 | 4,199,912 | |||||||
Series B |
1-for-2 | 22,780,964 | 11,390,477 | |||||||
Series C |
1-for-2 | 14,686,698 | 7,343,345 | |||||||
Series D |
1-for-2 | 6,575,832 | 3,287,915 | |||||||
Series E |
1-for-2 | 6,018,122 | 3,009,059 | |||||||
|
58,461,447 | 29,230,708 | ||||||||
(a) Redeemable Convertible Preferred Stock
During the year ended December 31, 2011, the Company issued 6,018,122 shares of Series E at $4.15 per share, resulting in net cash proceeds of $24.9 million.
The following table is in thousands, except share data:
| |
As of December 31, 2010 | |||||||||
|---|---|---|---|---|---|---|---|---|---|---|
| |
Shares Authorized |
Shares Issued and Outstanding |
Aggregate Liquidation Preference |
|||||||
Series A |
8,399,831 | 8,399,831 | $ | 800 | ||||||
Series B |
22,949,711 | 22,780,964 | 10,125 | |||||||
Series C |
14,686,698 | 14,686,698 | 25,050 | |||||||
Series D |
9,963,760 | 6,575,832 | 20,000 | |||||||
Total |
56,000,000 | 52,443,325 | $ | 55,975 | ||||||
Significant terms of Series A, B, C, D and E redeemable convertible preferred stock are as follows:
Conversion Features
Holders of Series A, B, C, D and E redeemable convertible preferred stock have the option to convert each share into common stock at any time at a conversion rate of 1-for-2. The preferred stock will automatically convert into shares of common stock upon an affirmative vote of more than 60% of the preferred stock voting together or an initial public offering with a share price of not less than $10.80 and with net proceeds of not less than $30.0 million.
Voting Rights
Each share of Series A, B, C, D and E redeemable convertible preferred stock has voting rights equivalent to the number of shares of common stock into which it is convertible. In regards to the selection of the Company's board of directors, the Series A holders will elect two directors, the Series B holders will elect one director, the Series C holders will elect one director and the common
100
INTERMOLECULAR, INC. AND SUBSIDIARIES
Notes to Consolidated Financial Statements (Continued)
6. Redeemable Convertible Preferred Stock (Continued)
stock holders will elect one director. Any remaining directors will be elected by the common and preferred stock holders voting together.
Dividend Rights
The holders of Series A, B, C, D and E redeemable convertible preferred stock are entitled to receive annual noncumulative dividends at a rate of $0.01, $0.04, $0.15, $0.24 and $0.33 per share, respectively, as adjusted for stock splits, stock dividends, reverse stock splits, stock combinations, reorganizations, and the like, out of any assets available when and if declared by the board of directors. No dividends have been declared to date.
Annual noncumulative cash dividends of $0.01, $0.04, $0.15, $0.24 and $0.33 per share of Series A, B, C, D and E redeemable convertible preferred stock, respectively, multiplied by the number of years that dividends were not declared and paid since issuance, must be paid prior to the payment of any dividends on the common stock, if and when declared by the board of directors.
Liquidation Preferences
In the event of liquidation, dissolution or winding up of the affairs of the Company, the holders of Series A, B, C, D and E redeemable convertible preferred stock are entitled to receive $0.10, $0.44, $1.88, $3.04 and $4.15 per share, respectively, and any declared but unpaid dividends prior to any other distributions. In the event of insufficient assets to pay the holders of Series A, B, C, D and E, the remaining assets will be distributed proportionally to all holders of redeemable convertible preferred stock. Any remaining assets after distribution to the holders of Series A, B, C, D and E redeemable convertible preferred stock will be distributed pro rata among all stockholders on an as converted basis until the holders of the redeemable convertible preferred stock receive a return of three times their original purchase price. Any remaining assets will be distributed pro rata among the common stockholders.
Redemption Rights
Series A, B, C, D and E redeemable convertible preferred stock are redeemable at any time after June 14, 2016 upon the affirmative vote or written consent of the holders of greater than 60% of the then-outstanding shares of redeemable convertible preferred stock (the Redemption Request). Upon receiving a Redemption Request, the Company will redeem these shares from any source of funds legally available on each of the respective Redemption Dates (as defined below) in three equal annual installments of one-third of the outstanding shares of redeemable convertible preferred stock to be redeemed. The redemption date for each annual redemption of shares (the Redemption Date) will be (i) for the first such installment, a date determined by the Company falling not later than 60 days after the date the Company received a Redemption Request and (ii) for the second and third installments, on the first and second anniversary of the first Redemption Date. The shares of preferred stock not redeemed as of a certain Redemption Date will remain outstanding and will be entitled to all the rights and preferences provided to holders of the redeemable convertible preferred stock.
The redemption price of the redeemable convertible preferred stock will be the greater of the original purchase price as adjusted for any stock splits, stock dividends, reverse stock splits, stock combinations, recapitalizations, and similar events, plus any declared but unpaid dividends, or the fair market value of each respective Series as determined by the board of directors with the approval of at
101
INTERMOLECULAR, INC. AND SUBSIDIARIES
Notes to Consolidated Financial Statements (Continued)
6. Redeemable Convertible Preferred Stock (Continued)
least 60% of the directors then serving on the board on the date of Redemption Request. The original purchase price was $800,000, $10.1 million, $25.1 million, $20.0 million and $25.0 million for Series A, B, C, D and E, respectively.
Adoption of Classification and Measurement of Redeemable Securities Accounting Standard
In connection with the Company's decision to file a registration statement with the Securities Exchange Commission for an initial public offering of the Company's common stock, the Company adopted the provisions of ASC Topic 480-10-S99-3A, Classification and Measurement of Redeemable Securities.
The shares contain redemption features that are not solely within the Company's control. Accordingly, all shares of redeemable convertible preferred stock, previously classified in stockholders' equity (deficit), have been classified as temporary equity rather than as a component of stockholders' equity (deficit) in the Company's consolidated balance sheets for all periods presented.
The carrying value of redeemable convertible preferred stock was recorded at its fair value at the date of issue. In accordance with the standard, the Company has accounted for changes in the redemption value over the period from the date of issuance to the earliest redemption date using the interest method to a value equal to the fair value, as determined by the Company using the most recent round of redeemable convertible preferred stock financing as an estimate for the fair value, of its redeemable convertible preferred stock over the period from the date of issuance to the earliest redemption date on June 14, 2016. As the Company did not have a round of redeemable preferred stock financing around December 31, 2009 or December 31, 2010, the Company determined the fair value by selecting a value that approximated an increase in value on a consistent basis between the Series D round (December 31, 2008) and the Series E round (June 14, 2011). The increases in the redemption value increases the value of the redeemable convertible preferred stock and decreases the additional paid-in capital and accumulated deficit balances. There was no impact of adopting this accounting principle on the consolidated statements of cash flows and the impact on the consolidated statement of operations was an increase in the net loss attributable to common stockholders as a result of the accounting for the change in the redemption value.
Estimated Redemption Values
The redemption values by security that the Company is using to accrete to are as follows (in thousands):
| |
December 31, | ||||||
|---|---|---|---|---|---|---|---|
| |
2011 | 2010 | |||||
Redeemable convertible preferred stock series: |
|||||||
A |
$ | — | $ | 33,067 | |||
B |
— | 89,680 | |||||
C |
— | 57,816 | |||||
D |
— | 25,887 | |||||
E |
— | — | |||||
102
INTERMOLECULAR, INC. AND SUBSIDIARIES
Notes to Consolidated Financial Statements (Continued)
6. Redeemable Convertible Preferred Stock (Continued)
In evaluating the fair value of preferred stock and the related preferred stock accretion leading up to the Company's initial public offering the Company considered the potential impact of the appreciation on the fair value of common stock between the June 14, 2011 Series E second closing as well as the convergence of the preferred stock and common stock prices as the likelihood of an initial public offering increased. The Company determined that following the filing of its registration statement on Form S-1 on July 29, 2011 a redemption was no longer probable given the decrease in the likelihood of a redemption occurring. Accordingly, effective July 29, 2011 the Company was no longer accreting its redeemable convertible preferred stock to its redemption value. Upon the completion of its initial public offering all mandatorily convertible preferred stock and related preferred stock accretion were reclassified to additional paid-in capital.
(b) Common Stock
As of December 31, 2011 and 2010, the Company had reserved shares of common stock, on an as if converted basis, for issuance as follows:
| |
As of December 31, | ||||||
|---|---|---|---|---|---|---|---|
| |
2011 | 2010 | |||||
Issuances under stock option plan |
12,530,593 | 7,445,656 | |||||
Conversion of redeemable convertible preferred stock |
— | 26,221,649 | |||||
Issuances upon exercise of warrants |
912,368 | 1,812,360 | |||||
|
13,442,961 | 35,479,665 | |||||
7. Warrants
Preferred Stock Warrants
In connection with the loan and security agreement obtained in November 2005, the Company issued a warrant to purchase 168,747 shares of Series B redeemable convertible preferred stock at a price of $0.44 per share. The Series B warrants are exercisable immediately and expire in November 2012. The fair value of the warrant on the date of issuance was $37,000 which is being recognized as interest expense over the term of the loan and security agreement. The fair value of the warrant was determined using the Black-Scholes option-pricing model and is remeasured at each reporting period. In connection with the Company's initial public offering which closed on November 23, 2011, the preferred stock warrants were remeasured to their current value prior to their conversion to common stock warrants and subsequent exercise. As of December 31, 2011 there were no preferred stock warrants outstanding. As of December 31, 2011 and 2010, the Company recorded a warrant liability of $0 and $215,000, respectively, on the consolidated balance sheets. During the years ended December 31, 2011, 2010 and 2009 , the remeasurement of the warrant liability resulted in the recognition of remeasurement losses of $0.6 million, $56,000 and $42,000, respectively, which was recorded as other income (expense), net on the consolidated statement of operations.
103
INTERMOLECULAR, INC. AND SUBSIDIARIES
Notes to Consolidated Financial Statements (Continued)
7. Warrants (Continued)
The Company determined the fair value of the Series B warrants at the end of each reporting period using the Black-Scholes option-pricing model with the following assumptions:
| |
|
Years Ended December 31, |
||||||||
|---|---|---|---|---|---|---|---|---|---|---|
| |
November 23, 2011 |
|||||||||
| |
2010 | 2009 | ||||||||
Contractual term (in years) |
1.0 | 2.0 | 3.0 | |||||||
Risk-free interest rate |
0.1 | % | 0.6 | % | 1.7 | % | ||||
Expected volatility |
62 | % | 55 | % | 60 | % | ||||
Expected dividend rate |
0 | % | 0 | % | 0 | % | ||||
Common Stock Warrants
During the year ended December 31, 2007, the Company issued warrants to purchase 817,500 shares of common stock in connection with certain collaboration agreements with exercise prices ranging from $1.50 to $3.76 per share and five year terms. Of these warrants, 735,000 were granted to a related party and were exercisable immediately while the remaining warrants vest over periods ranging from two to four years. During the years ended December 31, 2011and 2010, the Company recognized expenses related to the issuances and vesting of these warrants in the amount of $1,000, $1,000 and $7,000, respectively. As of December 31, 2011 and 2010, there were 0 and 815,619, respectively, of these warrants to purchase shares of common stock outstanding.
During the year ended December 31, 2008, the Company issued warrants to purchase 90,000 shares of common stock for consulting services with an exercise price of $2.04 per share and a 10 year term. These warrants vest over four years. During the years ended December 31, 2011, 2010 and 2009, the Company recognized expenses related to the issuances and vesting of these warrants in the amount of $52,000, $35,000, and $51,000, respectively. As of December 31, 2011 and 2010, these warrants to purchase shares of common stock were still outstanding.
During the year ended December 31, 2010, the Company issued warrants to purchase 822,368 shares of common stock in connection with certain collaboration agreements with an exercise price of $6.08 per share and approximately two year terms, of which 411,184 were granted to a related party. These warrants will become exercisable upon election of specified licenses by the holders prior to the expiration of the warrants. These warrants, if they become exercisable, do not contain a net exercise provision and therefore can only be exercised on a cash basis upon surrender of the warrants. Upon a license election by the holders, the Company will record the fair value of these warrants as measured on the date of election against any related revenue derived from these agreements. As of December 31, 2011, the holders have not elected the license option.
During the year ended December 31, 2011, the Company issued a warrant to purchase 411,000 shares of common stock in connection with a collaboration agreement with an exercise price of $8.31 per share and a term of 18 months. The warrant was exercisable immediately. The warrant does not contain a net exercise provision and therefore can only be exercised on a cash basis upon surrender of the warrants. The fair value of the warrant as measured on the date of grant was $312,000 and was recognized as a reduction of revenue derived from the agreement. The Company also issued a warrant to purchase 2,500 shares of common stock in connection with services that were provided to the Company with an exercise price of $0.20 per share and a term of 18 months. The warrant was
104
INTERMOLECULAR, INC. AND SUBSIDIARIES
Notes to Consolidated Financial Statements (Continued)
7. Warrants (Continued)
exercisable immediately. The fair value of the warrant as measured on the date of grant was $29,000 and was recognized in general and administrative expenses. In connection with the Company's initial public offering both of these warrants were exercised.
In total, the Company had 912,368 and 1,727,987 outstanding warrants to purchase shares of common stock as of December 31, 2011 and 2010, respectively. Of these outstanding warrants, 78,750 and 871,088 were exercisable as of December 31, 2011 and 2010, respectively. During the years ended December 31, 2011, 2010 and 2009, the Company recognized expenses related to the issuances and vesting of these warrants in the amount of $82,000, $36,000 and $58,000, respectively. Additionally, during the year ended December 31, 2011, the Company recognized a reduction to revenue in the amount of $312,000 related to the issuance and vesting of a warrant granted to a customer in connection with a collaboration agreement.
8. Stock-Based Compensation
On October 26, 2011, the Board of Directors approved the 2011 Equity Incentive Plan (2011 Plan). A total of 4,225,648 shares of common stock were reserved for future issuance under the 2011 Plan, which became effective on November 17, 2011. The Company has a 2004 Equity Incentive Plan (2004 Plan), but no longer grants stock options under this plan. Cancelled or forfeited stock option grants under the 2004 Plan will be added to the total amount of shares available for grant under the 2011 Plan. In addition, shares authorized but unissued as of November 17, 2011 under the 2004 Plan were added to shares available for grant under the 2011 Plan. The 2011 Plan contains an "evergreen" provision, pursuant to which the number of shares available for issuance under the 2011 Plan may be increased on the first day of the fiscal year, in an amount equal to the least of (a) 2,535,389 shares, (b) 4.5% of the outstanding Shares on the last day of the immediately preceding fiscal year or (c) such number of shares determined by the Board of Directors.
The 2011 Plan allows the Company to award stock options (incentive and non-qualified), restricted stock, restricted stock units, stock appreciation rights, deferred stock awards, dividend equivalents, performance awards, stock payments, performance shares and other incentive awards, or any combination thereof to employees, officers, directors and consultants of the Company. The exercise price of incentive stock options, which may only be granted to employees, granted under the 2011 Plan to participants with less than 10% voting power of all classes of stock of the Company or any parent or subsidiary company may not be less than 100% of the fair market value of the Company's common stock on the date of the grant. The exercise price of incentive stock options granted under the 2011 Plan to participants with 10% or more voting power of all classes of stock of the Company or any parent or subsidiary company may not be less than 110% of the fair market value of the Company's common stock on the date of the grant. Options granted under the 2011 Plan generally expire 10 years from the date of grant and are generally exercisable at any time after the date of grant when the shares are vested. Incentive and nonstatutory stock options granted generally vest at a rate of 25% on the first anniversary of the commencement or grant date and 1/48th each month thereafter. Incentive stock options granted to participants with 10% or more of the voting power of all classes of the Company's common stock on the date of grant have a maximum term of five years from the date of grant.
105
INTERMOLECULAR, INC. AND SUBSIDIARIES
Notes to Consolidated Financial Statements (Continued)
8. Stock-Based Compensation (Continued)
Option activity for the periods presented is as follows:
| |
|
Options Outstanding | ||||||||||||||
|---|---|---|---|---|---|---|---|---|---|---|---|---|---|---|---|---|
| |
Shares Available For Grant |
Number of Stock Options Outstanding |
Weighted- Average Exercise Price |
Weighted- Average Remaining Contractual Life (Years) |
Aggregate Intrinsic Value (in thousands) |
|||||||||||
Balance as of December 31, 2008 |
2,251,126 | 5,310,870 | $ | 0.90 | 7.7 | $ | 5,989 | |||||||||
Granted |
(1,725,250 | ) | 1,725,250 | 2.00 | ||||||||||||
Exercised |
— | (76,300 | ) | 0.18 | 142 | |||||||||||
Repurchased |
46,875 | — | — | |||||||||||||
Cancelled |
862,389 | (862,389 | ) | 1.18 | ||||||||||||
Balance as of December 31, 2009 |
1,435,140 | 6,097,431 | 1.18 | 7.3 | 9,047 | |||||||||||
Granted |
(1,579,875 | ) | 1,579,875 | 2.76 | ||||||||||||
Exercised |
— | (86,915 | ) | 1.18 | 141 | |||||||||||
Cancelled |
321,482 | (321,482 | ) | 2.06 | ||||||||||||
Balance as of December 31, 2010 |
176,747 | 7,268,909 | 1.48 | 6.9 | 13,937 | |||||||||||
Additional shares authorized |
5,453,131 | — | ||||||||||||||
Granted |
(1,570,684 | ) | 1,570,684 | 7.13 | ||||||||||||
Exercised |
— | (368,194 | ) | 1.26 | 2,854 | |||||||||||
Cancelled |
241,802 | (241,802 | ) | 3.28 | ||||||||||||
Balance as of December 31, 2011 |
4,300,996 | 8,229,597 | 2.52 | 6.6 | 50,541 | |||||||||||
Exercisable as of December 31, 2011 |
5,429,616 | $ | 1.25 | 5.4 | $ | 39,611 | ||||||||||
Vested and expected to vest as of December 31, 2011 |
7,708,179 | $ | 2.38 | $ | 48,358 | |||||||||||
The options exercisable as of December 31, 2011 include options that are exercisable prior to vesting. The weighted average grant date fair value of options granted during the years ended December 31, 2011, 2010 and 2009 was $4.14, $1.48 and $1.06, respectively.
The Company recognized stock-based compensation expense for awards granted to its employees and nonemployees as follows (in thousands):
| |
Years Ended December 31, | |||||||||
|---|---|---|---|---|---|---|---|---|---|---|
| |
2011 | 2010 | 2009 | |||||||
Cost of revenue |
$ | 622 | $ | 285 | $ | 134 | ||||
Research and development |
462 | 204 | 222 | |||||||
Sales and marketing |
770 | 422 | 378 | |||||||
General and administrative |
588 | 453 | 347 | |||||||
Total stock-based compensation |
$ | 2,442 | $ | 1,364 | $ | 1,081 | ||||
As of December 31, 2011 and 2010, there was $5.8 million and $3.4 million, respectively, of unrecognized compensation cost related to stock option compensation arrangements which is primarily recognized on a straight-line basis over a weighted average period of 3.1 and 2.8 years, respectively.
106
INTERMOLECULAR, INC. AND SUBSIDIARIES
Notes to Consolidated Financial Statements (Continued)
8. Stock-Based Compensation (Continued)
There were no capitalized stock-based compensation costs or recognized stock-based compensation tax benefits during the years ended December 31, 2011 and 2010.
Additional information regarding options outstanding as of December 31, 2011 is as follows:
| |
Options Outstanding | Options Exercisable | |||||||||||||||
|---|---|---|---|---|---|---|---|---|---|---|---|---|---|---|---|---|---|
| Exercise Price | Options Outstanding |
Weighted-Average Remaining Contractual Life (Years) |
Weighted-Average Exercise Price per Share |
Exercisable | Weighted-Average Exercise Price per Share |
||||||||||||
| $ | 0.02 | 192,500 | 3.1 | $ | 0.02 | 192,500 | $ | 0.02 | |||||||||
| 0.10 | 1,350,000 | 3.5 | 0.10 | 1,350,000 | 0.10 | ||||||||||||
| 0.20 | 669,000 | 4.4 | 0.20 | 669,000 | 0.20 | ||||||||||||
| 1.50 | 391,500 | 4.9 | 1.50 | 391,500 | 1.50 | ||||||||||||
| 1.66 | 895,625 | 5.7 | 1.66 | 895,625 | 1.66 | ||||||||||||
| 2.00 | 1,497,900 | 7.2 | 2.00 | 1,058,687 | 2.00 | ||||||||||||
| 2.04 | 241,363 | 6.2 | 2.04 | 227,784 | 2.04 | ||||||||||||
| 2.66 | 1,224,630 | 8.2 | 2.66 | 528,537 | 2.66 | ||||||||||||
| 2.90 | 43,770 | 6.8 | 2.90 | 36,792 | 2.90 | ||||||||||||
| 3.40 | 198,625 | 9.0 | 3.40 | 59,941 | 3.40 | ||||||||||||
| 6.20 | 1,221,499 | 9.3 | 6.20 | 19,250 | 6.16 | ||||||||||||
| 9.05 | 37,935 | 9.9 | 9.05 | — | — | ||||||||||||
| 10.00 | 138,750 | 9.9 | 10.00 | — | — | ||||||||||||
| 11.96 | 126,500 | 9.7 | 11.96 | — | — | ||||||||||||
| 8,229,597 | 6.6 | 2.52 | 5,429,616 | 1.25 | |||||||||||||
Determining Fair Value of Stock Options
The fair value of each grant of stock options was determined by the Company and its board of directors using the methods and assumptions discussed below. Each of these inputs is subjective and generally requires significant judgment to determine.
Valuation Method—The Company estimates the fair value of its stock options using the Black-Scholes option-pricing model.
Expected Term—The expected term represents the period that the stock-based awards are expected to be outstanding. For option grants that are considered to be "plain vanilla," the Company used the simplified method to determine the expected term as provided by the Securities and Exchange Commission. The simplified method calculates the expected term as the average of the time-to-vesting and the contractual life of the options.
Expected Volatility—The expected volatility was based on the historical stock volatilities of several of the Company's publicly listed peers over a period approximately equal to the expected term of the options as the Company did not have a sufficient trading history to use the volatility of its own common stock.
Fair Value of Common Stock—The fair value of the common stock underlying the stock options, prior to our initial public offering in November 2011, had been determined by the Company's board of
107
INTERMOLECULAR, INC. AND SUBSIDIARIES
Notes to Consolidated Financial Statements (Continued)
8. Stock-Based Compensation (Continued)
directors. Because there was no public market for the Company's common stock prior to November 2011, the board of directors determined the fair value of the common stock at the time of the option grant by considering a number of objective and subjective factors including valuations of comparable companies, sales of redeemable convertible preferred stock to unrelated third parties, operating and financial performance, lack of liquidity of capital stock and general and industry-specific economic outlook, amongst other factors.
Risk-Free Interest Rate—The risk-free interest rate is based on the U.S. Treasury yield curve in effect at the time of grant for zero coupon U.S. Treasury notes with maturities approximately equal to the expected term of the options.
Expected Dividend—The expected dividend has been zero as the Company has never paid dividends and does not expect to pay dividends.
Summary of Assumptions—The fair value of the employee stock options were estimated on the grant dates using a Black-Scholes option-pricing model with the following weighted average assumptions:
| |
Years Ended December 31, |
|||||||||
|---|---|---|---|---|---|---|---|---|---|---|
| |
2011 | 2010 | 2009 | |||||||
Expected term (in years) |
6.0 | 6.0 | 6.0 | |||||||
Risk-free interest rate |
2.1 | % | 2.2 | % | 2.5 | % | ||||
Expected volatility |
57 | % | 55 | % | 55 | % | ||||
Expected dividend rate |
0 | % | 0 | % | 0 | % | ||||
108
INTERMOLECULAR, INC. AND SUBSIDIARIES
Notes to Consolidated Financial Statements (Continued)
9. Net Loss per Share of Common Stock
The following table sets forth the computation of the Company's basic and diluted net loss per share of common stock during the years ended December 31, 2011, 2010 and 2009 (in thousands, except for share and per share amounts):
| |
Years Ended December 31, | |||||||||
|---|---|---|---|---|---|---|---|---|---|---|
| |
2011 | 2010 | 2009 | |||||||
Net loss attributable to common stockholders |
$ | (38,675 | ) | (15,940 | ) | $ | (14,424 | ) | ||
Shares used in computing net loss per share of common stock, basic and diluted |
9,698,880 | 5,567,286 | 5,511,889 | |||||||
Net loss per share of common stock, basic and diluted |
$ | (3.99 | ) | (2.86 | ) | $ | (2.62 | ) | ||
The following outstanding shares of common stock equivalents were excluded from the computation of diluted net loss per share of common stock for the periods presented because including them would have been antidilutive:
| |
Years Ended December 31, | |||||||||
|---|---|---|---|---|---|---|---|---|---|---|
| |
2011 | 2010 | 2009 | |||||||
Redeemable convertible preferred stock |
— | 26,221,649 | 26,221,649 | |||||||
Stock options to purchase common stock |
8,229,597 | 7,268,909 | 6,097,431 | |||||||
Common stock subject to repurchase |
15,000 | — | 26,042 | |||||||
Common and preferred stock warrants |
912,368 | 1,812,360 | 989,992 | |||||||
10. Income Taxes
The Company follows FASB ASC 740, Income Taxes, for the computation and presentation of its tax provision. For the year ended December 31, 2011, the income tax provision of $43,000 represents a provision for income taxes of $42,000 related to foreign income taxes and state minimum income taxes of $1,000.
109
INTERMOLECULAR, INC. AND SUBSIDIARIES
Notes to Consolidated Financial Statements (Continued)
10. Income Taxes (Continued)
The provision for annual income taxes consisted of the following (in thousands):
| |
As of December 31, | |||||||||
|---|---|---|---|---|---|---|---|---|---|---|
| |
2011 | 2010 | 2009 | |||||||
Current: |
||||||||||
U.S. Federal |
$ | — | $ | — | $ | — | ||||
State |
1 | 1 | 4 | |||||||
Foreign |
42 | 18 | 13 | |||||||
Total current |
$ | 43 | $ | 19 | $ | 17 | ||||
Deferred: |
||||||||||
U.S. Federal |
$ | — | $ | — | $ | — | ||||
State |
— | — | — | |||||||
Foreign |
— | — | — | |||||||
Total deferred |
— | — | — | |||||||
Total provision for income taxes |
$ | 43 | $ | 19 | $ | 17 | ||||
The reconciliation of federal statutory income tax to the Company's provision for income taxes is as follows (in thousands):
| |
As of December 31, | |||||||||
|---|---|---|---|---|---|---|---|---|---|---|
| |
2011 | 2010 | 2009 | |||||||
Expected provision at statutory federal rate |
$ | (10,482 | ) | $ | (616 | ) | $ | (1,781 | ) | |
State tax—net of federal benefit |
1 | 1 | 4 | |||||||
U.S. federal research credit |
(870 | ) | (626 | ) | (444 | ) | ||||
Non deductible expenses |
763 | 486 | 399 | |||||||
Change in statutory tax rate |
— | (264 | ) | — | ||||||
Others |
6 | 164 | 93 | |||||||
Change in valuation allowance |
10,625 | 874 | 1,746 | |||||||
Provision for income taxes |
$ | 43 | $ | 19 | $ | 17 | ||||
As of December 31, 2011, the Company's foreign subsidiaries had accumulated approximately $0.2 million of earnings that have been reinvested in their operations. The Company has not provided U.S. tax on these earnings as the reinvestment is considered permanent in duration.
Deferred income taxes reflect the net tax effects of temporary differences between the carrying amounts of assets and liabilities for financial reporting purposes and the amounts used for income tax
110
INTERMOLECULAR, INC. AND SUBSIDIARIES
Notes to Consolidated Financial Statements (Continued)
10. Income Taxes (Continued)
purposes. Significant components of the Company's deferred tax assets and liabilities are as follows (in thousands):
| |
As of December 31, | ||||||
|---|---|---|---|---|---|---|---|
| |
2011 | 2010 | |||||
Deferred tax assets: |
|||||||
Net operating loss federal and state |
$ | 10,776 | $ | 8,426 | |||
Research credits |
4,619 | 3,271 | |||||
Accrued compensation and vacation |
437 | 324 | |||||
Deferred revenue, other accruals and reserves |
2,186 | 3,705 | |||||
Stock compensation |
346 | 242 | |||||
Patents |
10,280 | — | |||||
Gross deferred tax assets |
28,644 | 15,968 | |||||
Valuation allowance |
(27,057 | ) | (15,818 | ) | |||
Total deferred tax asset |
1,587 | 150 | |||||
Deferred tax liabilities: |
|||||||
Property and equipment |
1,587 | 150 | |||||
Total deferred tax liabilities |
1,587 | 150 | |||||
Net deferred tax assets |
$ | — | $ | — | |||
The Company established valuation allowances for U.S. federal and state deferred tax assets. The valuation allowances require an assessment of both positive and negative evidence when determining whether it is more likely than not that deferred tax assets are recoverable. Such assessment is required on a jurisdiction by jurisdiction basis. During the year ended December 31, 2011, the Company continued to maintain the valuation allowances for U.S. federal and state deferred tax assets. The Company intends to maintain a full valuation allowance until sufficient positive evidence exists to support reversal. The valuation allowance for deferred tax assets was $27.1 million and $15.8 million as of December 31, 2011 and 2010, respectively. The increase in the valuation allowance during the years ended December 31, 2011 and 2010 was $11.3 million and $1.9 million, respectively.
As of December 31, 2011, the Company has net operating loss carryforwards for U.S. federal and state income tax purposes of approximately $26.7 million and $29.9 million, respectively, to offset future taxable income. The U.S. federal net operating loss carryforwards will start to expire in 2026 while for state purposes, the net operating losses will begin to expire in 2018. Utilization of the Company's net operating loss carryforwards and tax credits may be subject to substantial annual limitation due to the ownership change limitations provided by the Internal Revenue Code and similar state provisions. Such an annual limitation could result in the expiration of the net operating loss before utilization. The Company has not determined whether an ownership change has occurred.
In addition, the Company has $3.5 million U.S. federal R&D credit and $3.5 million California R&D credit carryforwards to offset future income tax liabilities. U.S. federal R&D tax credits can be carried forward for 20 years and will start to expire in 2025. California R&D credits can be carried forward indefinitely.
111
INTERMOLECULAR, INC. AND SUBSIDIARIES
Notes to Consolidated Financial Statements (Continued)
10. Income Taxes (Continued)
Uncertain Tax Positions
For the year ended December 31, 2011, the total amount of unrecognized tax benefits excluding interest thereon was $1.4 million, none of which would impact the effective tax rate if realized during the year. The Company has not accrued interest and penalties related to the unrecognized tax benefits reflected in the financial statements for the years ended December 31, 2011, 2010 and 2009. Although the timing and outcome of income tax audits is highly uncertain, unrecognized tax benefits are not expected to decrease in the next twelve months.
The following table summarizes the activity related to unrecognized tax benefits (in thousands):
| |
As of December 31, | |||||||||
|---|---|---|---|---|---|---|---|---|---|---|
| |
2011 | 2010 | 2009 | |||||||
Unrecognized benefit—beginning of period |
$ | 1,067 | $ | 746 | $ | 518 | ||||
Gross decreases—prior period tax positions |
(113 | ) | — | — | ||||||
Gross increases—current period tax positions |
447 | 321 | 228 | |||||||
Unrecognized benefit—end of period |
$ | 1,401 | $ | 1,067 | $ | 746 | ||||
The Company's U.S. federal, state and local and foreign income tax returns are subject to audit by relevant tax authorities. The Company's income tax reporting periods beginning with tax year ended December 31, 2008 for the U.S., and tax year ended December 31, 2007 for the Company's major state and local jurisdictions remain generally open to audit by relevant tax authorities.
11. Related Party Transactions
The Company entered into a Collaborative Development and License Agreement in March 2005 and an Alliance Agreement in December 2005 with a technology company under which the two companies will work together to conduct research and development and other activities with respect to materials and high throughput technology for use in semiconductor applications. Depending on the output of the research and development, the primary rightholder could be either company. However, the party that is not the primary rightholder will be assigned the right to use the output property. Each party is bearing its own expenses with respect to patents and the patent application process. The Company is required to pay royalties based on a percentage of revenue derived, directly or indirectly, from the use of this technology. The Company is not generating revenue from the other party. In August 2006, the Company received $13.5 million from the other party in exchange for shares of Series C representing 9.8% of the Company's fully diluted shares. In December 2008, the Company received $1.6 million from the other party in exchange for shares of Series D. As of November 23, 2011, the other party is no longer a beneficial owner as a result of the sale of all of their shares in the Company's initial public offering. During the years ended December 31, 2011, 2010, and 2009, the Company expensed $1.8 million, $2.0 million, and $1.2 million, respectively, in related party cost of revenue and had accrued liabilities in the amount of $795,000 and $502,000, due to the other party as of December 31, 2010 and 2009, respectively. During the years ended December 31, 2011, 2010 and 2009, the Company purchased $172,000, $6,000 and $14,000, respectively, of fixed assets, software licenses, maintenance and consumables from the other party. In July 2011, the Company entered into an asset purchase agreement with the same party to purchase intellectual property that the Company,
112
INTERMOLECULAR, INC. AND SUBSIDIARIES
Notes to Consolidated Financial Statements (Continued)
11. Related Party Transactions (Continued)
at the time, licensed from them. The Company has disclosed in note 5 an overview of the asset purchase agreement.
The Company entered into a Collaborative Development and License Agreement in August 2006 and a second Collaborative Development and License Agreement in March 2010 with another related party. Under the agreements, the two companies will work together to conduct research and development and other activities. Depending on the output of the research and development, the primary rightholder will be the Company or the other party. However, if the other party is not the primary rightholder, it will be able to license the developed technology from the Company. The other party's vice chairman of the board of directors is a director of the Company and is also a managing member of a significant shareholder of the Company. As of December 31, 2011, this shareholder is a beneficial owner of approximately 12.7% of the Company's common stock. During the years ended December 31, 2011, 2010 and 2009, the Company recorded revenue in the amount of $5.2 million, $3.9 million and $0, respectively, from these agreements.
In November 2006, the Company entered into an Alliance Agreement with a related party that is a beneficial owner of approximately 9.1% of the Company's common stock as of December 31, 2011. The other party and the Company each have an independent board member that serves on both companies board of directors. Under the agreement, the two companies will work together to conduct research and development and other activities with respect to materials and high productivity combinatorial technology for use in semiconductor applications. Depending on the output of the research and development, the primary rightholder could be either company. However, the party that is not the primary rightholder will be assigned the right to use the output property. Under the agreement, the other party will pay the Company fees for services and both parties may provide royalties to the other for licensed technology sold to third parties. In July 2007, the Company and the other party entered into a Workflow Purchase Agreement whereby the other party agreed to purchase from the Company a fluids-based workflow including services and licensing of intellectual property. In December 2007, the Company and the other party added an addendum to the Workflow Purchase Agreement. As part of this addendum, the other party increased the number of fluids-based workflows for purchase, contracted with the Company for additional services and provided for a $10.0 million prepayment of minimum royalties. The $10.0 million minimum royalty prepayment is nonrefundable. The minimum royalty prepayment began revenue recognition during the year ended December 31, 2009 and should be fully earned no later than the year ended December 31, 2012. The agreement committed the other party to purchase three additional workflows in addition to the initial workflow order. In December 2008, the Company and the other party added an additional addendum to the Workflow Purchase Agreement and entered into a Dry Workflow Agreement. As part of this 2008 addendum, the third Wet Workflow was canceled and the deposit applied to the Dry Workflow purchase. In March 2009, the Company and the other party entered into a supplement to the Workflow Purchase Agreement which adjusted the timing and delivery of services to be performed. Effective August 2010, the Company and the other party entered into a Modification to the Wets Workflow Purchase Agreement and Dry Workflow Purchase Agreement which further extended and adjusted the timing and services to be performed. In October 2011, the Company and the other party entered into an additional addendum to both the Dry Workflow Purchase Agreement and Wets Workflow Purchase Agreement, whereby the Company agreed to perform additional services for an agreed upon fee and to provide additional workflows. During the years ended December 31, 2011, 2010 and 2009, the Company recorded revenue in the amount of $15.8 million, $22.1 million and $16.0 million, respectively, in equipment sales, license
113
INTERMOLECULAR, INC. AND SUBSIDIARIES
Notes to Consolidated Financial Statements (Continued)
11. Related Party Transactions (Continued)
fees and service fees and expensed $78,000, $0 and $0, respectively, in related party cost of revenue and had accounts receivable in the amount of $466,000 and $461,000 as of December 31, 2011 and 2010, respectively, related to these agreements. The Company recorded a deferred revenue balance in the amount of $10.2 million and $13.3 million related to these agreements as of December 31, 2011 and 2010, respectively. The deferred revenue balance includes the unrecognized portion of the prepayment of the $10.0 million minimum royalty, of which $2.5 million and $7.5 million remains as of December 31, 2011 and 2010, respectively, as well as payments for elements of the workflow purchases.
12. Information about Geographic Areas
Revenue
Revenue by geography is based on the billing address of the customer. The following table sets forth revenue by geographic area (in thousands):
| |
Years Ended December 31, | |||||||||
|---|---|---|---|---|---|---|---|---|---|---|
| |
2011 | 2010 | 2009 | |||||||
United States |
$ | 35,573 | $ | 29,526 | $ | 18,894 | ||||
Japan |
15,148 | 12,449 | 7,906 | |||||||
Taiwan |
2,934 | 489 | — | |||||||
Europe |
175 | 210 | 110 | |||||||
Total |
$ | 53,830 | $ | 42,674 | $ | 26,910 | ||||
Long-Lived Assets
Substantially all of the Company's long-lived assets are located in the U.S. An insignificant amount of long-lived assets reside in the Company's foreign subsidiaries and branches in Hong Kong, Japan and Taiwan.
114
ITEM 9. CHANGES IN AND DISAGREEMENTS WITH ACCOUNTANTS ON ACCOUNTING AND FINANCIAL DISCLOSURE
None.
ITEM 9A. CONTROLS AND PROCEDURES
Evaluation of Disclosure Controls and Procedures
Our management, including our Chief Executive Officer and Chief Financial Officer, evaluated the effectiveness of our disclosure controls and procedures as of December 31, 2011. The term "disclosure controls and procedures," as defined in Rules 13a-15(e) and 15d-15(e) under the Exchange Act, means controls and other procedures of a company that are designed to ensure that information required to be disclosed by us in the reports that we file or submit under the Exchange Act is recorded, processed, summarized and reported within the time periods specified in the SEC's rules and forms. Disclosure controls and procedures include, without limitation, controls and procedures designed to ensure that information required to be disclosed by us in the reports that we file or submit under the Exchange Act is accumulated and communicated to our management, including our Chief Executive Officer and Chief Financial Officer, as appropriate, to allow timely decisions regarding required disclosure. In designing and evaluating the disclosure controls and procedures, management recognizes that any controls and procedures, no matter how well designed and operated, can provide only reasonable, and not absolute, assurance of achieving the desired objectives. In reaching a reasonable level of assurance, management necessarily applies its judgment in evaluating the cost-benefit relationship of possible controls and procedures. Based on this evaluation, our Chief Executive Officer and Chief Financial Officer concluded that our disclosure controls and procedures were effective as of December 31, 2011 at the reasonable assurance level.
Exemption from Management's Report on Internal Control Over Financial Reporting for the Fiscal Year Ended December 31, 2011
This annual report does not include a report of management's assessment regarding internal control over financial reporting or an attestation report of the Company's registered public accounting firm due to a transition period established by rules of the SEC for newly public companies.
Changes in Internal Control Over Financial Reporting
There was no change in our internal control over financial reporting (as defined in Rules 13a-15(f) and 15d-15(f) under the Exchange Act) that occurred during the quarterly period ended December 31, 2011 that has materially affected, or is reasonably likely to materially affect, our internal control over financial reporting.
None.
115
ITEM 10. DIRECTORS, EXECUTIVE OFFICERS AND CORPORATE GOVERNANCE
The information required by this item concerning our directors, executive officers, compliance with Section 16 of the Exchange Act, our code of ethics and Nominating and Corporate Governance Committee and Audit Committee is incorporated by reference from the information set forth in the sections under the headings "Election of Directors," "Executive Officers," "Section 16(a) Beneficial Ownership Reporting Compliance" and "Corporate Governance Matters" in our Definitive Proxy Statement to be filed with the Securities and Exchange Commission in connection with the Annual Meeting of Stockholders to be held in 2012 (the "2012 Proxy Statement").
ITEM 11. EXECUTIVE COMPENSATION
The information required by this item concerning executive compensation is incorporated by reference from the information in the 2012 Proxy Statement under the headings "Executive Compensation," "Corporate Governance Matters" and "Executive Compensation—Compensation Committee Report."
ITEM 12. SECURITY OWNERSHIP OF CERTAIN BENEFICIAL OWNERS AND MANAGEMENT AND RELATED STOCKHOLDER MATTERS
The information required by this item concerning securities authorized for issuance under equity compensation plans and security ownership of certain beneficial owners and management is incorporated by reference from the information in the 2012 Proxy Statement under the headings "Executive Compensation—Equity Compensation Plan Information" and "Security Ownership of Certain Beneficial Owners and Management."
ITEM 13. CERTAIN RELATIONSHIPS AND RELATED TRANSACTIONS, AND DIRECTOR INDEPENDENCE
The information required by this item concerning transactions with related persons and director independence is incorporated by reference from the information in the 2012 Proxy Statement under the headings "Certain Relationships and Related Transactions" and "Corporate Governance Matters."
ITEM 14. PRINCIPAL ACCOUNTANT FEES AND SERVICES
The information required by this item is incorporated by reference from the information in the 2012 Proxy Statement under the heading "Ratification of Independent Registered Public Accounting Firm—Principal Accounting Fees and Services."
116
ITEM 15. EXHIBITS AND FINANCIAL STATEMENT SCHEDULES
- (a)
- The
following documents are filed as part of this report:
- (1)
- Financial
Statements: See "Index to Consolidated Financial Statements" in Part II, Item 8 of this Annual Report on
Form 10-K
- (2)
- All
schedules are omitted because they are not required information or the required information is in the financial statements or notes thereto.
- (3)
- Exhibits: The exhibits listed in the accompanying index to exhibits are filed or incorporated by reference as part of this Annual Report on Form 10-K.
117
Pursuant to the requirements of Section 13 or 15(d) of the Securities Exchange Act of 1934, the registrant has duly caused this report to be signed on its behalf by the undersigned thereunto duly authorized.
| INTERMOLECULAR, INC. | ||||
Date: March 16, 2012 |
By: |
/s/ DAVID E. LAZOVSKY David E. Lazovsky President and Chief Executive Officer |
||
Pursuant to the requirements of the Securities Exchange Act of 1934, this report has been signed below by the following persons on behalf of the registrant and in the capacities and on the dates indicated.
Signature
|
Title
|
Date
|
||
|---|---|---|---|---|
| /s/ DAVID E. LAZOVSKY David E. Lazovsky |
President, Chief Executive Officer and Director (Principal Executive Officer) | March 16, 2012 | ||
/s/ PETER L. EIDELMAN Peter L. Eidelman |
Chief Financial Officer (Principal Financial and Accounting Officer) |
March 16, 2012 |
||
/s/ THOMAS R. BARUCH Thomas R. Baruch |
Chairman of the Board of Directors |
March 16, 2012 |
||
/s/ MARVIN D. BURKETT Marvin D. Burkett |
Director |
March 16, 2012 |
||
/s/ IRWIN FEDERMAN Irwin Federman |
Director |
March 16, 2012 |
||
/s/ BRUCE M. MCWILLIAMS Bruce M. McWilliams |
Director |
March 16, 2012 |
||
/s/ GEORGE M. SCALISE George M. Scalise |
Director |
March 16, 2012 |
||
/s/ JOHN L. WALECKA John L. Walecka |
Director |
March 16, 2012 |
118
| |
|
Incorporated by Reference | |
|||||||||||
|---|---|---|---|---|---|---|---|---|---|---|---|---|---|---|
| Exhibit Number |
|
Filed Herewith |
||||||||||||
| Exhibit Description | Form | Date | Number | |||||||||||
| 2.1 | Asset Purchase Agreement by and between Intermolecular, Inc. and Symyx Technologies, Inc. dated as of July 28, 2011.(1) | S-1/A | 9/9/2011 | 2.1 | ||||||||||
3.1 |
Amended and Restated Certificate of Incorporation of Intermolecular, Inc. |
X |
||||||||||||
3.2 |
Amended and Restated Bylaws of Intermolecular, Inc. |
X |
||||||||||||
4.1 |
Specimen Common Stock Certificate. |
S-1/A |
11/7/2011 |
4.1 |
||||||||||
4.2 |
Warrant to purchase shares of common stock issued to Timane S.a.r.l. dated June 20, 2008. |
S-1 |
7/29/2011 |
4.2 |
||||||||||
4.3 |
Form of warrant to purchase shares of common stock issued to Toshiba Corporation and SanDisk Corporation dated March 15, 2010. |
S-1/A |
10/26/2011 |
4.3 |
||||||||||
4.4 |
Fourth Amended and Restated Investor Rights Agreement dated as of March 4, 2011, by and among Intermolecular, Inc. and certain stockholders named therein, as amended by Amendment No. 1 to Fourth Amended and Restated Investor Rights Agreement dated as of June 14, 2011. |
S-1 |
7/29/2011 |
10.1 |
||||||||||
4.5 |
Secured Promissory Note, issued by the Company to Symyx Technologies, Inc. on November 23, 2011. |
X |
||||||||||||
10.1 |
Lease Agreement by and between Intermolecular, Inc. and Novellus Systems, Inc. dated as of May 11, 2010, as amended by the Confirmation of Commencement Date of the Lease Agreement dated as of June 10, 2010. |
S-1 |
7/29/2011 |
10.2 |
||||||||||
10.2 |
† |
Collaborative Development Program Agreement by and among SanDisk Corporation, Toshiba Corporation and Intermolecular, Inc. dated March 15, 2010. |
S-1/A |
11/7/2011 |
10.3 |
|||||||||
10.3 |
† |
Alliance Agreement by and between Intermolecular, Inc. and Advanced Technology Materials, Inc. dated as of November 17, 2006. |
S-1/A |
10/26/2011 |
10.4 |
|||||||||
119
| |
|
Incorporated by Reference | |
|||||||||||
|---|---|---|---|---|---|---|---|---|---|---|---|---|---|---|
| Exhibit Number |
|
Filed Herewith |
||||||||||||
| Exhibit Description | Form | Date | Number | |||||||||||
| 10.4 | † | Wets Workflow Purchase Agreement by and between Intermolecular, Inc. and Advanced Technology Materials, Inc. dated as of July 13, 2007, as amended by the Addendum to Wets Workflow Purchase Agreement dated as of December 21, 2007, the Amendment to Addendum to Wets Workflow Purchase Agreement dated as of December 16, 2008 and the Supplemental Agreement to the Amendment to the Addendum to Wets Workflow Purchase Agreement dated as of March 16, 2009. | S-1/A | 11/7/2011 | 10.5 | |||||||||
10.5 |
† |
Dry Workflow Purchase Agreement by and between Intermolecular, Inc. and Advanced Technology Materials, Inc. dated as of December 16, 2008. |
S-1/A |
10/26/2011 |
10.6 |
|||||||||
10.6 |
† |
Modification to the Wets Workflow Purchase Agreement and Dry Workflow Purchase Agreement by and between Intermolecular, Inc. and Advanced Technology Materials, Inc. dated as of August 27, 2010. |
S-1/A |
9/30/2011 |
10.7 |
|||||||||
10.7 |
† |
Amendment Number 5 to the Wets Workflow Purchase Agreement and Dry Workflow Purchase Agreement by and between Intermolecular, Inc. and Advanced Technology Materials, Inc. dated as of March 3, 2011. |
S-1/A |
9/30/2011 |
10.8 |
|||||||||
10.8 |
† |
CDP Services Addendum to Dry Workflow Purchase Agreement by and between Intermolecular, Inc. and Advanced Technology Materials, Inc. dated as of October 1, 2011, Amendment Number 6 to the Wets Workflow Purchase Agreement and Dry Workflow Purchase Agreement by and between Intermolecular, Inc. and Advanced Technology Materials, Inc. dated as of October 27, 2011, and Amendment Number 7 to the Wets Workflow Purchase Agreement and Dry Workflow Purchase Agreement by and between Intermolecular, Inc. and Advanced Technology Materials, Inc. dated as of October 27, 2011. |
X |
|||||||||||
10.9 |
† |
Advanced Memory Development Program Agreement by and between Intermolecular, Inc. and Elpida Memory, Inc. dated as of May 22, 2008, as amended by Exhibit C—Royalty Terms dated as of August 18, 2008, the Supplemental Joint Development Agreement dated as of January 27, 2009, the Amendment to the Supplemental Joint Development Agreement dated as of May 25, 2009 and the Amendment to the Advanced Memory Agreement dated July 29, 2010. |
S-1/A |
11/7/2011 |
10.9 |
|||||||||
120
| |
|
Incorporated by Reference | |
|||||||||||
|---|---|---|---|---|---|---|---|---|---|---|---|---|---|---|
| Exhibit Number |
|
Filed Herewith |
||||||||||||
| Exhibit Description | Form | Date | Number | |||||||||||
| 10.10 | † | Collaborative Development Program Agreement by and between Intermolecular, Inc. and GLOBALFOUNDRIES Inc. dated as of June 1, 2011. | S-1/A | 9/30/2011 | 10.10 | |||||||||
10.11 |
Form of Indemnification Agreement between Intermolecular, Inc. and each of its directors, officers and certain employees. |
S-1/A |
11/7/2011 |
10.12 |
||||||||||
10.12a |
+ |
Intermolecular, Inc. 2004 Equity Incentive Plan, as amended. |
S-1 |
7/29/2011 |
10.13a |
|||||||||
10.12b |
+ |
Form of Early Exercise Stock Option Agreement under the 2004 Equity Incentive Plan. |
S-1 |
7/29/2011 |
10.13b |
|||||||||
10.12c |
+ |
Form of Stock Option Agreement under the 2004 Equity Incentive Plan. |
S-1 |
7/29/2011 |
10.13c |
|||||||||
10.13a |
+ |
Intermolecular, Inc. 2011 Incentive Award Plan. |
S-1/A |
11/7/2011 |
10.14a |
|||||||||
10.13b |
+ |
Form of Stock Option Grant Notice and Stock Option Agreement under the 2011 Incentive Award Plan. |
S-1/A |
11/7/2011 |
10.14b |
|||||||||
10.13c |
+ |
Form of Restricted Stock Award Grant Notice and Restricted Stock Award Agreement under the 2011 Incentive Award Plan. |
S-1/A |
11/7/2011 |
10.14c |
|||||||||
10.13d |
+ |
Form of Restricted Stock Unit Award Grant Notice and Restricted Stock Unit Award Agreement under the 2011 Incentive Award Plan. |
S-1/A |
11/7/2011 |
10.14d |
|||||||||
10.14a |
+ |
Form of Change in Control Severance Agreement between the Company and certain of its executive officers. |
S-1/A |
11/7/2011 |
10.15a |
|||||||||
10.14b |
+ |
Change in Control Severance Agreement between the Company and David E. Lazovsky. |
S-1/A |
11/7/2011 |
10.15b |
|||||||||
23.1 |
Consent of Independent Registered Public Accounting Firm. |
X |
||||||||||||
31.1 |
Certification of Chief Executive Officer pursuant to Section 302 of the Sarbanes-Oxley Act of 2002. |
X |
||||||||||||
31.2 |
Certification of Chief Financial Officer pursuant to Section 302 of the Sarbanes-Oxley Act of 2002. |
X |
||||||||||||
32.1 |
Certification of Chief Executive Officer pursuant to 18 U.S.C. §1350, as adopted pursuant to Section 906 of the Sarbanes-Oxley Act of 2002. |
X |
||||||||||||
32.2 |
Certification of Chief Financial Officer pursuant to 18 U.S.C. §1350, as adopted pursuant to Section 906 of the Sarbanes-Oxley Act of 2002. |
X |
||||||||||||
- +
- Indicates a management contract or compensatory plan.
121
- †
- Certain
portions have been omitted pursuant to a confidential treatment request. Omitted information has been filed separately with the SEC.
- (1)
- All exhibits, schedules and similar attachments to this exhibit have been omitted. Copies of such exhibits, schedules and similar attachments will be furnished supplementally to the SEC upon request.
122