Attached files
| file | filename |
|---|---|
| 8-K - FORM 8-K - TELEFLEX INC | d316162d8k.htm |

| TELEFLEX INCORPORATED Company Overview Exhibit 99.1 |
| 2 This presentation and our discussion contain forward-looking information and statements including, but not limited to, longer-term growth and profitability objectives over the next 5 years, including, achievement of constant currency revenue growth of greater-than 5%, gross margins of approximately 55%, research and development expense of approximately 5%, operating margins of approximately 25% and return on equity of approximately 15%; and other matters which inherently involve risks and uncertainties which could cause actual results to differ from those projected or implied in the forward-looking statements. These risks and uncertainties are addressed in the Company's SEC filings, including its most recent Form 10-K. Revenues and growth exclude the impact of translating the results of international subsidiaries at different currency exchange rates from year to year and the comparable activity of companies acquired or divested within the most recent twelve-month period. Except as otherwise noted, the following slides reflect continuing operations. Forward-Looking Statements |
| 3 Agenda Company Overview Strategic Objectives Financial Review Question and Answer Summary |

| 4 COMPANY OVERVIEW |

| 5 Our Mission Enhance patient outcomes by providing products that help clinicians improve clinical results and reduce procedural costs Act as a partner and a trusted resource for our customers |
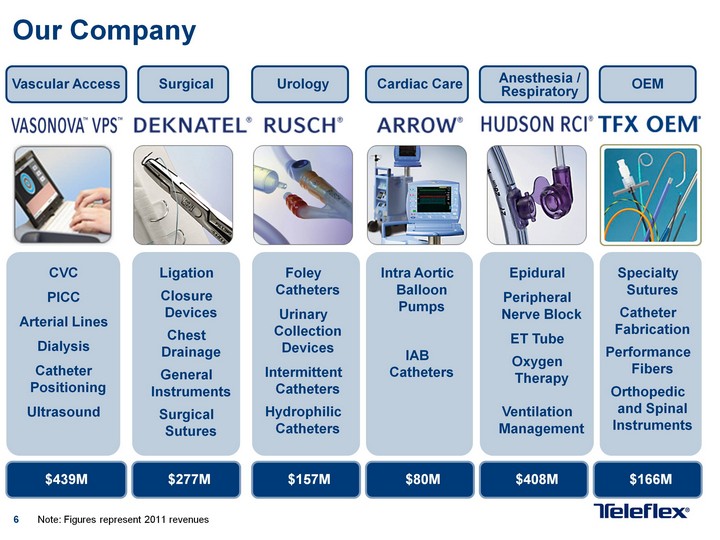
| Our Company 6 CVC PICC Arterial Lines Dialysis Catheter Positioning Ultrasound Intra Aortic Balloon Pumps IAB Catheters Vascular Access Urology Surgical Cardiac Care OEM Foley Catheters Urinary Collection Devices Intermittent Catheters Hydrophilic Catheters Ligation Closure Devices Chest Drainage General Instruments Surgical Sutures Specialty Sutures Catheter Fabrication Performance Fibers Orthopedic and Spinal Instruments $439M $157M $277M $80M $166M Note: Figures represent 2011 revenues Anesthesia / Respiratory Epidural Peripheral Nerve Block ET Tube Oxygen Therapy Ventilation Management $408M |
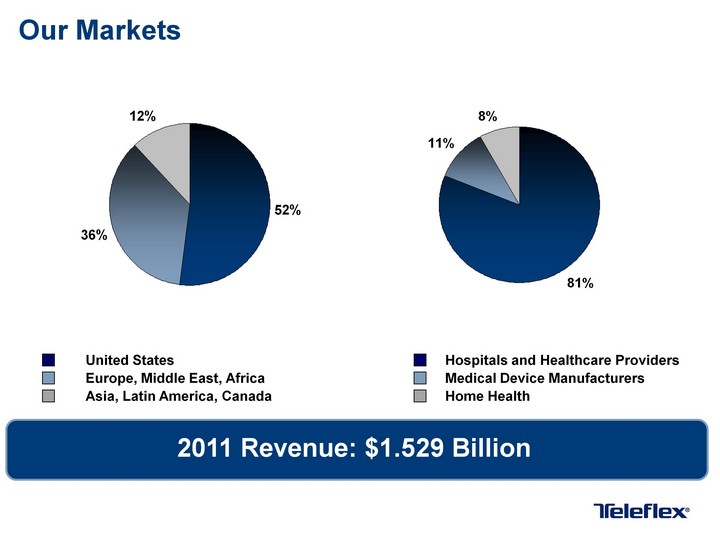
| Our Markets 2011 Revenue: $1.529 Billion Hospitals / Healthcare Providers Medical Device Manufacturers Home Health 0.81 0.11 0.08 U.S. EMEA Asia / Latin America / Canada 0.52 0.36 0.12 United States Europe, Middle East, Africa Asia, Latin America, Canada Hospitals and Healthcare Providers Medical Device Manufacturers Home Health |
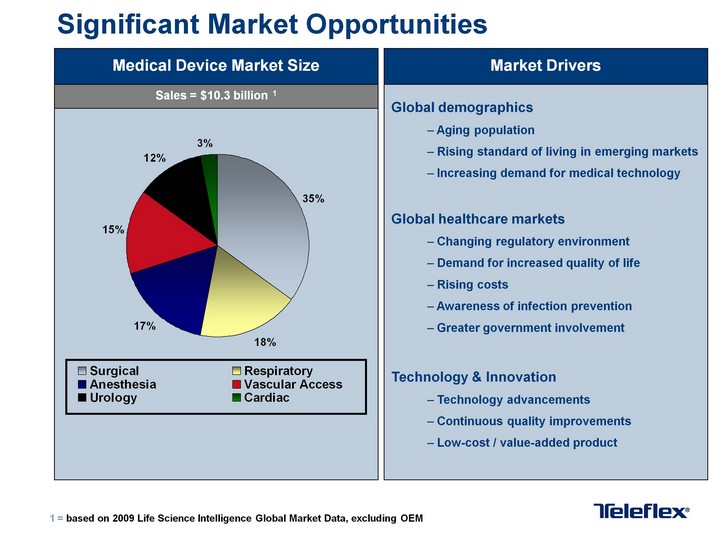
| Significant Market Opportunities Surgical Respiratory Anesthesia Vascular Access Urology Cardiac 0.35 0.18 0.17 0.15 0.12 0.03 Medical Device Market Size Sales = $10.3 billion 1 Market Drivers Global demographics Aging population Rising standard of living in emerging markets Increasing demand for medical technology Global healthcare markets Changing regulatory environment Demand for increased quality of life Rising costs Awareness of infection prevention Greater government involvement Technology & Innovation Technology advancements Continuous quality improvements Low-cost / value-added product 1 = based on 2009 Life Science Intelligence Global Market Data, excluding OEM |

| 9 STRATEGIC OBJECTIVES |
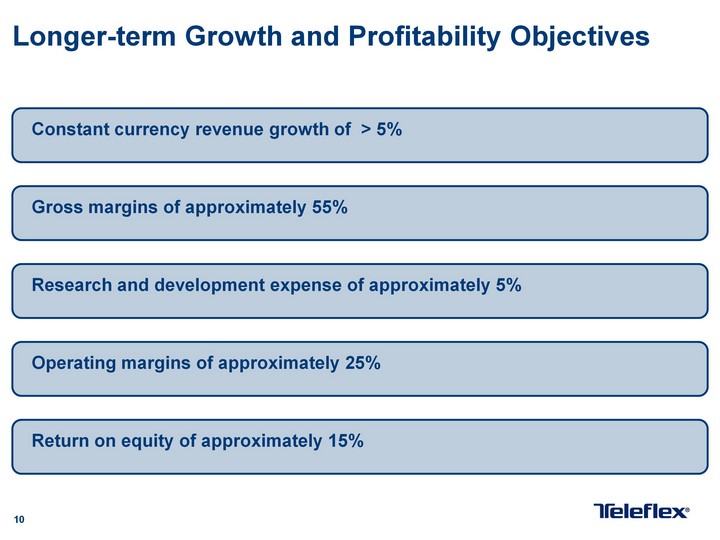
| 10 Constant currency revenue growth of > 5% Gross margins of approximately 55% Research and development expense of approximately 5% Return on equity of approximately 15% Operating margins of approximately 25% Longer-term Growth and Profitability Objectives |
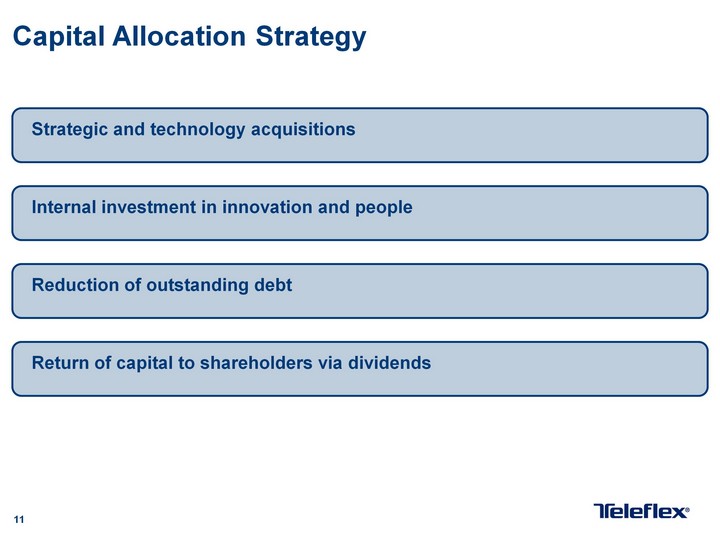
| 11 Strategic and technology acquisitions Internal investment in innovation and people Reduction of outstanding debt Return of capital to shareholders via dividends Capital Allocation Strategy |
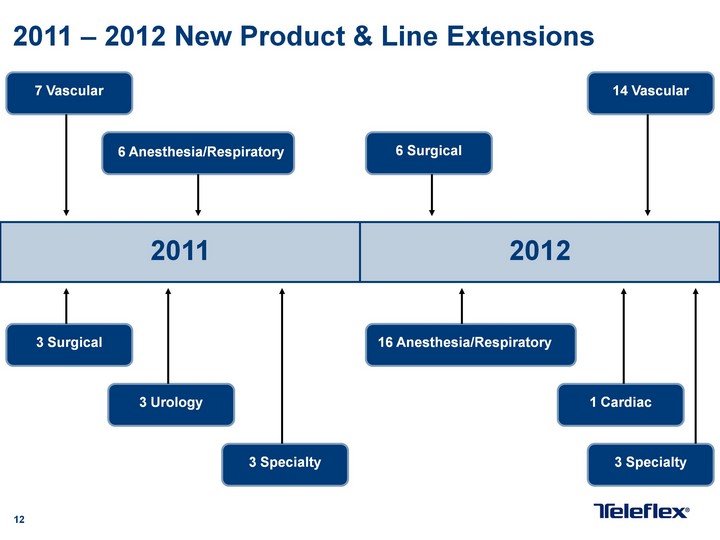
| 12 2011 - 2012 New Product & Line Extensions 2011 7 Vascular 6 Anesthesia/Respiratory 3 Surgical 3 Urology 3 Specialty 14 Vascular 16 Anesthesia/Respiratory 6 Surgical 3 Specialty 2012 1 Cardiac |

| 13 FINANCIAL REVIEW |
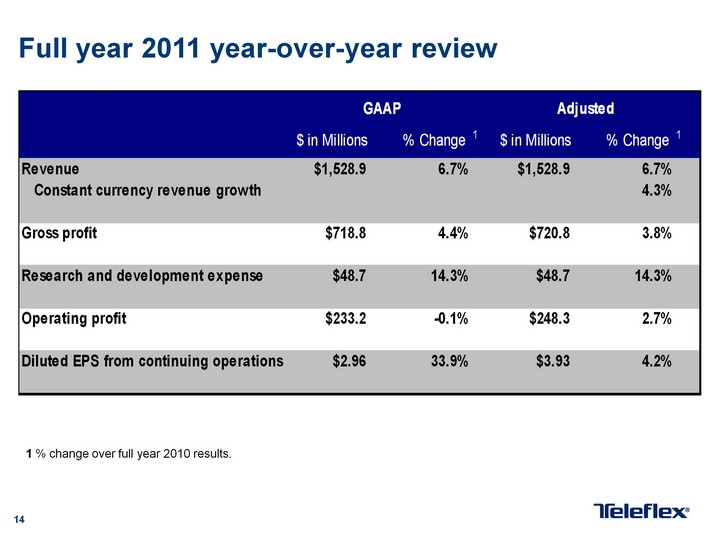
| 14 Full year 2011 year-over-year review 1 % change over full year 2010 results. |

| 15 SUMMARY |
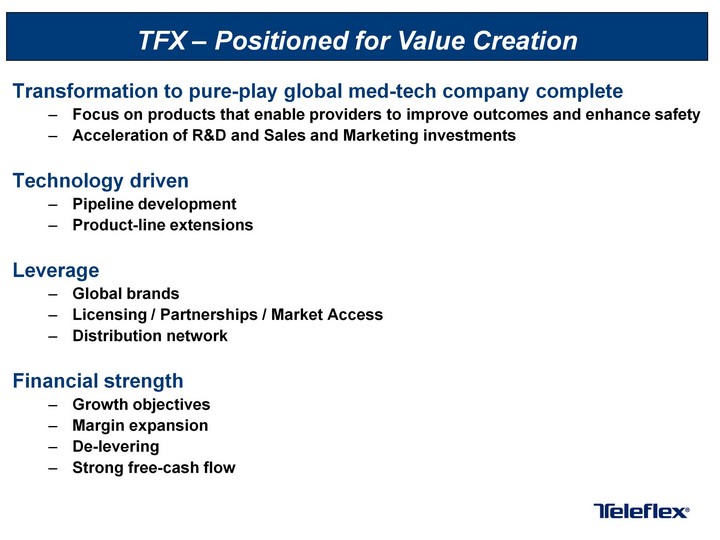
| Transformation to pure-play global med-tech company complete Focus on products that enable providers to improve outcomes and enhance safety Acceleration of R&D and Sales and Marketing investments Technology driven Pipeline development Product-line extensions Leverage Global brands Licensing / Partnerships / Market Access Distribution network Financial strength Growth objectives Margin expansion De-levering Strong free-cash flow TFX - Positioned for Value Creation |

| 17 QUESTION & ANSWER |

| Thank you for your attention |

| 19 APPENDIX |

| 20 Reconciliation of Constant Currency Revenue Growth |
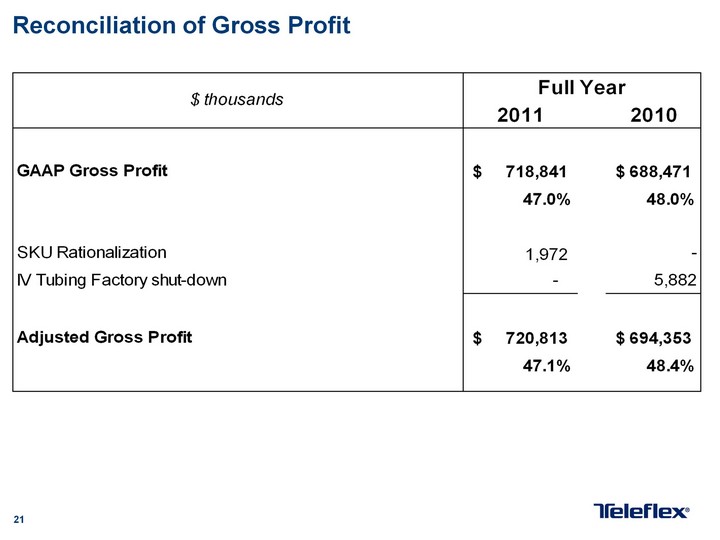
| 21 Reconciliation of Gross Profit |
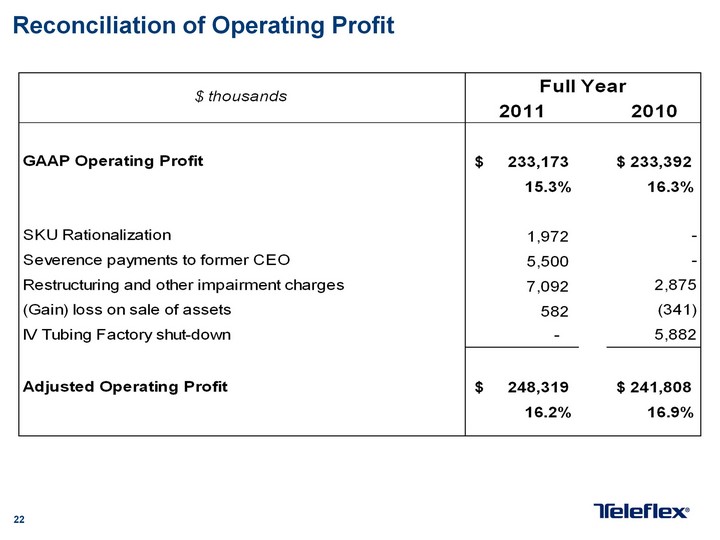
| 22 Reconciliation of Operating Profit |

| 23 Full Year EPS Reconciliation from Continuing Operations In 2011, losses and other charges include approximately $9.8 million, net of tax, or $0.24 per share, related to the loss on extinguishment of debt; approximately $3.5 million, net of tax, or $0.09 per share, in charges related to severance payments and benefits to be provided to our former chief executive officer; costs attributed to a stock keeping unit ("SKU") rationalization to eliminate SKUs based on low sales volume or insufficient margins to help improve future profitability. The net of tax impact was approximately $1.3 million, or $0.03 per share; and approximately $0.4 million, net of tax, or $0.01 per share, related to the sale of a facility. In 2010, losses and other charges include approximately $31.3 million, net of tax, or $0.78 per share, related to the loss on extinguishment of debt; and approximately $3.6 million, net of tax, or $0.09 per share, related to factory shut-down costs associated with the custom IV tubing product. In 2011, the Company terminated our interest rate swap that, at the date of termination, had a notional amount of $350 million. The interest rate swap was designated as a cash flow hedge against the term loan under our senior credit facility. At the date of termination, the interest rate swap was in a liability position resulting in a cash payment of approximately $14.8 million, which included $3.1 million of accrued interest. The net of tax impact was approximately $7.0 million, or $0.17 per share. The tax adjustment represents a net benefit resulting from the resolution (including the expiration of statutes of limitations) of various U.S. federal, state and foreign tax matters relating to prior years. |
