Attached files
| file | filename |
|---|---|
| 8-K - 8-K - APARTMENT INVESTMENT & MANAGEMENT CO | d313643d8k.htm |
Exhibit 99.1

| 2012 Citi Global Property CEO Conference March 11 - 14, 2012 |

| What We Expect How We Plan to Get There Operations A Solid Year Ahead Conventional Same-Store NOI ? 5.25% - 7.25% Affordable Same-Store NOI ? 0.0% - 1.0% Total Same-Store NOI ? 4.5% - 6.25% Revenue ? 4.5% - 5.5%: 2.1% "in the bank" from 2011 and 5.0%+ increase in 2012 lease rates Expenses ? 2.5% - 3.0% due to increases in real estate taxes & insurance; operating expenses flat Portfolio Better Than Ever Conventional rents ? ~10% to $1,260 from $1,143 today Affordable portfolio < 10% of NAV Conventional NOI margin ? ~1.5% to ~64% Conventional Free Cash Flow margin (1) ? ~3% to ~58% Dispositions $550 - $650M Sell 25+ Conventional properties with average rents < $700 Sell 60+ Affordable properties with average ownership of 41% Acquisitions $220M+ with $160M in partnerships Redevelopment Full Speed Ahead Conventional redevelopment $125 - $150M Robust pipeline; 5% - 6% of NAV under redevelopment at one time Eight projects underway in 2012; four in coastal California and four others in Seattle, Chicago and Philadelphia; ~$400M multi-year investment Three vacant properties; ~1,220 units returned to service over next two years; target rents > $2,400 Current returns on un-trended rents > 7%, Free Cash Flow IRRs > 10% Balance Sheet Lower Leverage (2) EBITDA:Interest 2.5:1 EBITDA:Interest & Preferred Dividends 2.0:1 Debt:EBITDA 7.5x Debt & Preferreds:EBITDA 9x Continue to be non-recourse, long-term, fixed rate borrower Increasing property income Property debt amortization $83M or ~2% of debt Refinance maturing debt of $118M or ~2.5% of debt Opportunistic redemption of high cost preferreds Business Simpler Average ownership in Conventional properties ? to 96% Sale of third-party asset management business; ~$0.01 per share of 2011 and 2012 FFO Average ownership in Affordable properties ? to 74% Tender or merge 11 partnerships with 19 properties; 7 public partnerships with average annual administration costs of ~$1M Earn-in of technology initiatives, scale reductions and efficiency gains Earnings & Dividend Moving Up FFO of $1.72 - $1.82 per share ? 8% AFFO of $1.17 - $1.29 per share ? 21% Dividend ? 50% to $0.72 per share per year; ~60% AFFO payout Stick to the plan Aimco 2012 Plan Free Cash Flow is defined as property NOI less assumed capital replacement expenditures of $850 per unit.Leverage metrics based on annualized projected 4Q 2012 EBITDA. |

| Property Operations Strategy Low turnover strategy contributes to NOI performance Low turnover strategy:Customer retention is key to greater NOI contribution and more predictable operating resultsAimco's annual turnover of 48% is significantly lower than an apartment industry average of 55% - 60% (1)By maintaining lower than industry average turnover, Aimco avoids expensed and capitalized turn costs, vacancy loss and marketing expense of $10 - $12M annuallyRenewal lease rates are generally less volatile and are, on average, higher than new lease ratesOn average, customers choose to rent an Aimco apartment for 22 months, up 22% from 2007 Based on information collected by YieldStar.Peer group consists of AvalonBay, Camden, Equity Residential, Essex, Home Properties and UDR. 2012E represents midpoint of company guidance. (2) |

| 2012 Plan: Property Operations Property operations is on track for a solid year What We Expect How We Plan to Get There Year-to-Date Progress Conventional Same-Store NOI ? 5.25% - 7.25% Affordable Same-Store NOI ? 0.0% - 1.0% Total Same-Store NOI ? 4.5% - 6.25% Revenue ? 4.5% - 5.5%: 2.1% "in the bank" from 2011 5.0%+ increase in 2012 lease rates Expenses ? 2.5% - 3.0%: ? real estate taxes & insurance operating expenses flat Lease rates on track High occupancy Expenses tracking better than expected due to mild winter Year-to-DateBlended lease rates ? 2.9%New lease rates ? 0.8%Renewal lease rates ? 5.1%ADO ahead of plan at 95.9% |

| Our target customers are:Aged 24 - 40 ? high propensity to rentCollege-educated ? strongest job and earnings growth, lowest unemploymentSingle ? homeownership is a lifestyle choice; not yet motivated by marriage, children Portfolio Strategy And they want to live in:Hub and gateway cities ? lifestyle, job opportunitiesUrban areas ? proximity to jobs Portfolio designed around our target customers Manhattan Boston Philadelphia Suburban NY / NJ Washington Greater Los Angeles Denver Phoenix Chicago Houston South Florida Atlanta Seattle Bay Area San Diego Jacksonville Orlando Tampa Dallas / Ft Worth Increase capitalMaintain capitalDecrease capitalUpgrade locations within marketRecycle out Capital Allocation Objectives: Portfolio increasingly concentrated in the locations where our target customers want to live |
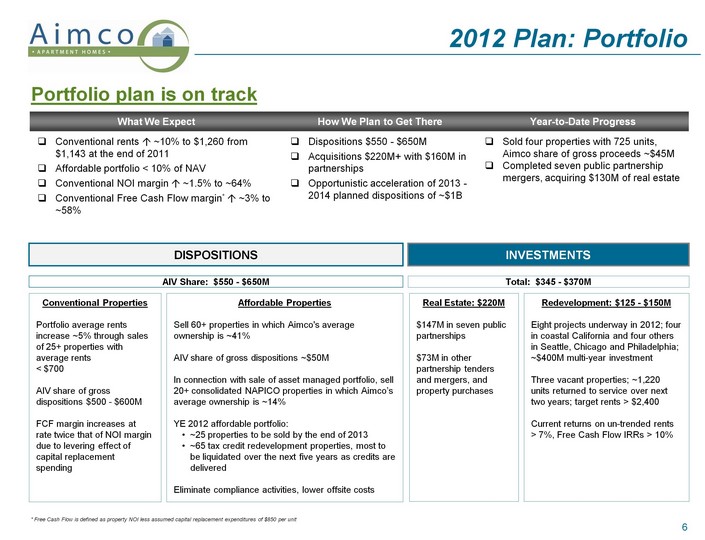
| 2012 Plan: Portfolio 2012 Plan: Portfolio Portfolio plan is on track AIV Share: $550 - $650M Conventional PropertiesPortfolio average rents increase ~5% through sales of 25+ properties with average rents < $700AIV share of gross dispositions $500 - $600MFCF margin increases at rate twice that of NOI margin due to levering effect of capital replacement spending Affordable PropertiesSell 60+ properties in which Aimco's average ownership is ~41%AIV share of gross dispositions ~$50MIn connection with sale of asset managed portfolio, sell 20+ consolidated NAPICO properties in which Aimco's average ownership is ~14%YE 2012 affordable portfolio:~25 properties to be sold by the end of 2013~65 tax credit redevelopment properties, most to be liquidated over the next five years as credits are deliveredEliminate compliance activities, lower offsite costs INVESTMENTS Real Estate: $220M$147M in seven public partnerships$73M in other partnership tenders and mergers, and property purchases DISPOSITIONS Total: $345 - $370M Redevelopment: $125 - $150MEight projects underway in 2012; four in coastal California and four others in Seattle, Chicago and Philadelphia; ~$400M multi-year investmentThree vacant properties; ~1,220 units returned to service over next two years; target rents > $2,400Current returns on un-trended rents > 7%, Free Cash Flow IRRs > 10% * Free Cash Flow is defined as property NOI less assumed capital replacement expenditures of $850 per unit |

| Redevelopment Strategy Pipeline of opportunities to generate higher risk-adjusted returns Redevelopment philosophy:Land in quality locations appreciates over timeOlder assets in quality locations provide opportunity for redevelopmentRedevelopment is a short-cycle business making it a lower-risk activity than ground-up developmentCurrently, redevelopment provides higher risk-adjusted returns than acquisitions, with 2012 projects generating current returns > 7% in markets where cap rates average ~4.5%Aimco's portfolio composition and expertise in redevelopment provide a pipeline of opportunities Pacific Bay Vistas, San Bruno CA Madera Vista, Corte Madera CA Lincoln Place Apartments, Venice CA San Francisco Tiburon Corte Madera San Francisco Santa Monica Marina Del Rey |
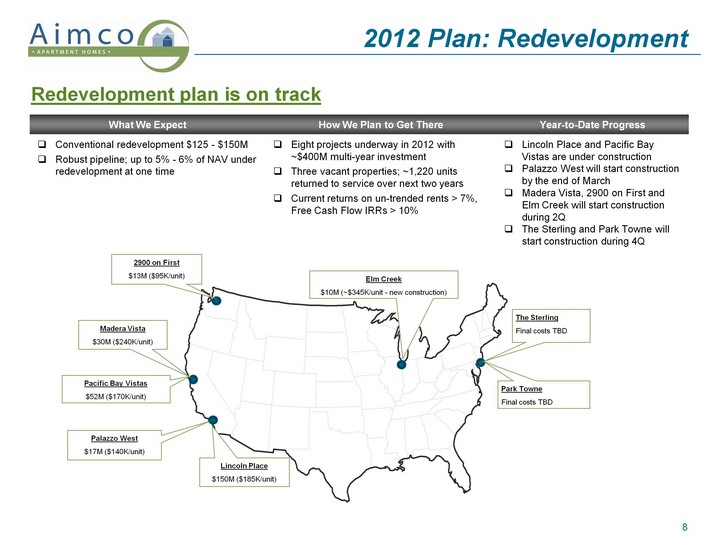
| 2012 Plan: Redevelopment 2012 Plan: Redevelopment Redevelopment plan is on track Palazzo West$17M ($140K/unit) Lincoln Place$150M ($185K/unit) Pacific Bay Vistas$52M ($170K/unit) 2900 on First$13M ($95K/unit) Elm Creek$10M (~$345K/unit - new construction) The SterlingFinal costs TBD Park TowneFinal costs TBD Madera Vista$30M ($240K/unit) |

| Balance Sheet Strategy Balance sheet designed for safety Leverage strategy:Limit entity risk by avoiding recourse debt, of which Aimco has virtually noneReduce repricing risk by using fixed rate loans and refinancing nearer-term maturities to lock in current interest ratesReduce refunding risk by laddering maturities of long-term, non-recourse, amortizing property loans with little or no near-term maturities and perpetual preferred stockHedge against inflation and cap rate expansion by using long-dated, fixed rate leverage * As of 12/31/2011 with the exception that 2012 maturities exclude $56M of committed financings and $69M of refinancing activity occurring during the first quarter 2012. Avg cost: 5.50% Avg cost: 7.55% |

| 2012 Plan: Balance Sheet 2012 Plan: Balance Sheet De-levering plan is on track, may accelerate * 2012 leverage metrics are based on annualized projected 4Q 2012 EBITDA. |

| Business Strategy Simple business: own and operate apartments, redevelop some Business strategy:Own and operate B+ apartments in desirable markets serving customers with high and rising incomesRedevelop properties where returns are > 150 basis points higher than acquisitionsEliminate non-core activities, simplify structure and reduce costs: IN PROCESS COMPLETE Reduce number of partnershipsReduce investment in Affordable properties Exit third-party property managementExit third-party asset managementExit tax credit redevelopment |

| 2012 Plan: Business 2012 Plan: Business Simplification plans are on-track |

| 2012 Plan: Earnings & Dividend Increasing earnings, higher dividends FFO $1.72 - $1.82AFFO $1.17 - $1.29Dividend $0.72, ~ 60% AFFO payout |

| Forward-Looking Statements and Other Information This presentation contains forward-looking statements within the meaning of the federal securities laws, including statements regarding projected results and specifically: projected 2012 operating results, asset sales and redevelopment investment; projected returns on redevelopment projects started during 2012; the impact of acquisition, disposition and other investment activities on portfolio metrics; and projected 2012 leverage ratios. These forward-looking statements reflect management's judgment as of this date, and Aimco assumes no obligation to revise or update them to reflect future events or circumstances. These forward-looking statements include certain risks and uncertainties. Readers should carefully review Aimco's financial statements and notes thereto, as well as the risk factors described in Aimco's Annual Report on Form 10-K for the year ended December 31, 2011, and the other documents Aimco files from time to time with the Securities and Exchange Commission. This presentation does not constitute an offer of securities for sale. |