Attached files
| file | filename |
|---|---|
| EX-99.1 - PRESS RELEASE - FX Alliance Inc. | d312906dex991.htm |
| 8-K - FORM 8-K - FX Alliance Inc. | d312906d8k.htm |
| Exhibit 99.2
|
FX Alliance Inc.
Fourth Quarter & Full Year 2011 Results March 8, 2012
|
|
Forward Looking Statements
The following information contains, or may be deemed to contain, “forward-looking statements.” By their nature, forward-looking statements involve risks, assumptions and uncertainties because they relate to events and depend on circumstances that may or may not occur in the future. The future results of FX Alliance Inc. (the “Company”) may vary from the results and performance expressed in, or implied by, such forward-looking statements, possibly to a material degree. For discussion of some of the important factors that could cause the Company’s results and performance to differ from those expressed in, or implied by, the forward-looking statements contained in the following information, please refer to the Company’s Registration Statement on Form S-1, as subsequently amended, in particular, the information under headings such as “Forward-Looking Statements,” “Risk Factors” and “Management’s Discussion and Analysis of Financial Condition and Results of Operations” and in other filings and furnishings made by the Company with the SEC from time to time. The Company undertakes no obligation to update or revise any forward-looking statements.
©2012 FX Alliance Inc. (All Rights Reserved)
2
|
|
Introduction to FXall
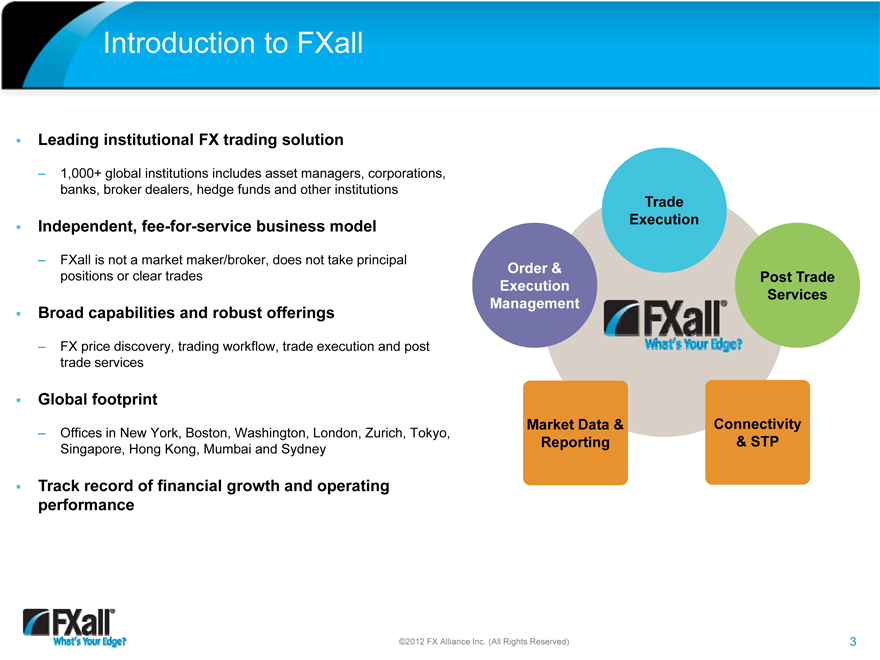
Leading institutional FX trading solution
– 1,000+ global institutions includes asset managers, corporations, banks, broker dealers, hedge funds and other institutions
Independent, fee-for-service business model
– FXall is not a market maker/broker, does not take principal positions or clear trades
Broad capabilities and robust offerings
– FX price discovery, trading workflow, trade execution and post trade services
Global footprint
– Offices in New York, Boston, Washington, London, Zurich, Tokyo, Singapore, Hong Kong, Mumbai and Sydney
Track record of financial growth and operating performance
Order & Execution Management
Trade Execution
Post Trade Services
Market Data & Reporting
Connectivity
& STP
©2012 FX Alliance Inc. (All Rights Reserved)
3
|
|
Record Financial & Operating Performance
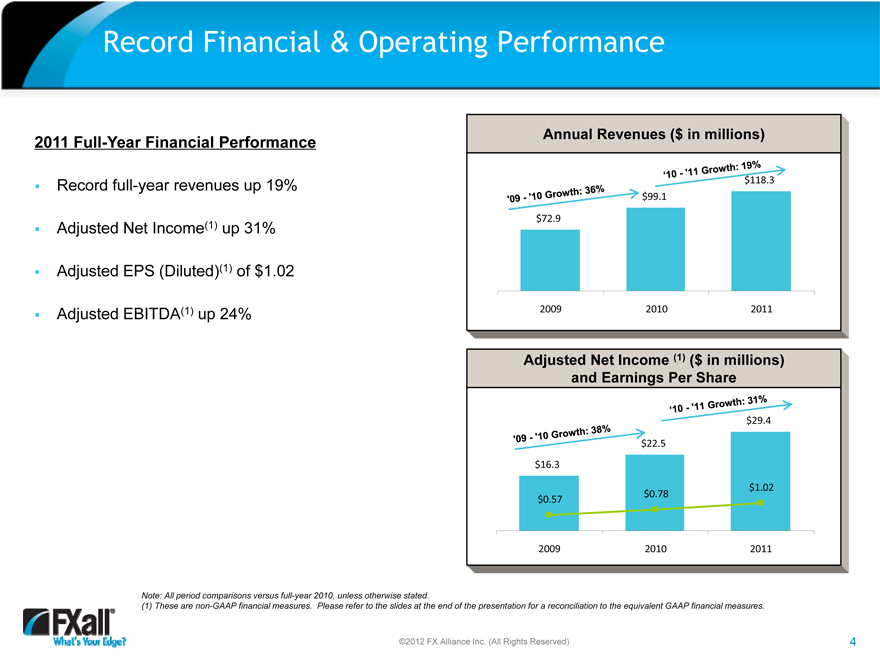
2011 Full-Year Financial Performance
Record full-year revenues up 19%
Adjusted Net Income(1) up 31% Adjusted EPS (Diluted)(1) of $1.02 Adjusted EBITDA(1) up 24%
Annual Revenues ($ in millions)
$118.3
$99.1
$72.9
2009 2010 2011
Adjusted Net Income (1) ($ in millions) and Earnings Per Share
$29.4
$22.5
$16.3
$1.02
$0.78
$0.57
2009 2010 2011
Note: All period comparisons versus full-year 2010, unless otherwise stated.
(1) These are non-GAAP financial measures. Please refer to the slides at the end of the presentation for a reconciliation to the equivalent GAAP financial measures.
©2012 FX Alliance Inc. (All Rights Reserved)
4
|
|
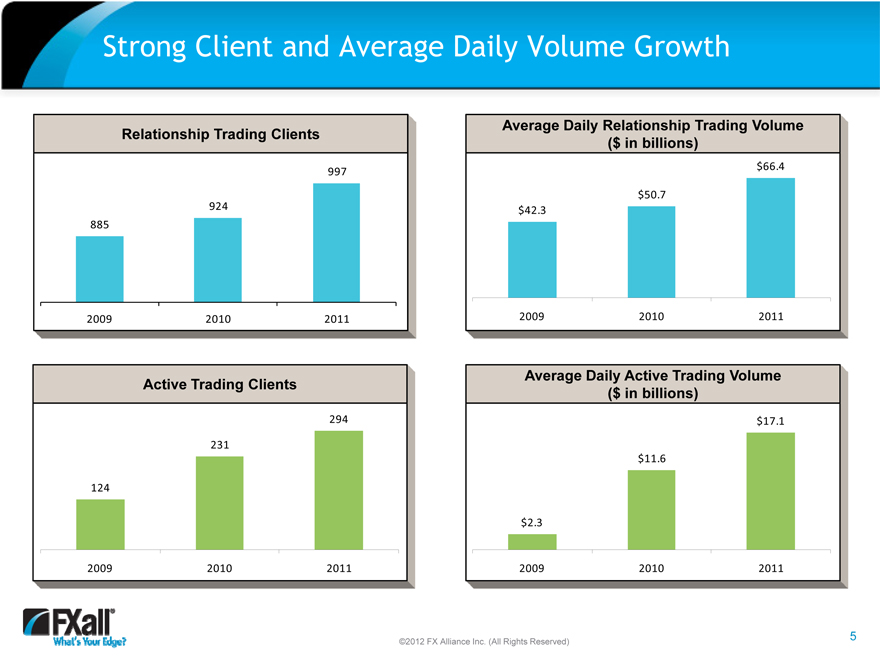
Strong Client and Average Daily Volume Growth
Relationship Trading Clients
997
924 885
2009 2010 2011
Average Daily Relationship Trading Volume ($ in billions)
$66.4
$50.7
$42.3
2009 2010 2011
Active Trading Clients
294
231
124
2009 2010 2011
Average Daily Active Trading Volume ($ in billions)
$17.1
$11.6
$2.3
2009 2010 2011
©2012 FX Alliance Inc. (All Rights Reserved)
5
|
|
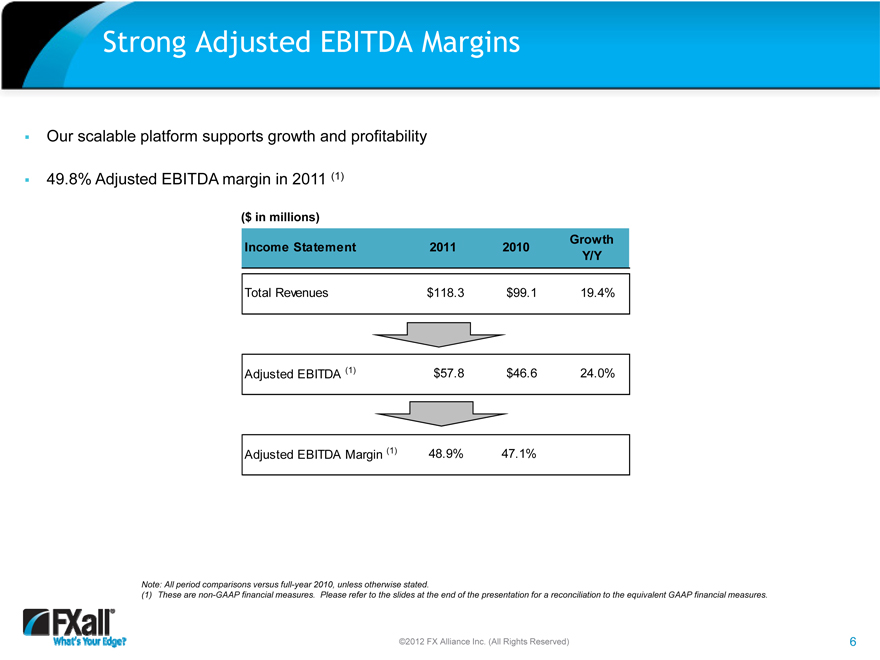
Strong Adjusted EBITDA Margins
Our scalable platform supports growth and profitability
49.8% Adjusted EBITDA margin in 2011 (1)
($ in millions)
Growth Income Statement 2011 2010 Y/Y
Total Revenues $118.3 $99.1 19.4%
Adjusted EBITDA (1) $57.8 $46.6 24.0%
Adjusted EBITDA Margin (1) 48.9% 47.1%
Note: All period comparisons versus full-year 2010, unless otherwise stated.
(1) These are non-GAAP financial measures. Please refer to the slides at the end of the presentation for a reconciliation to the equivalent GAAP financial measures
©2012 FX Alliance Inc. (All Rights Reserved)
6
|
|
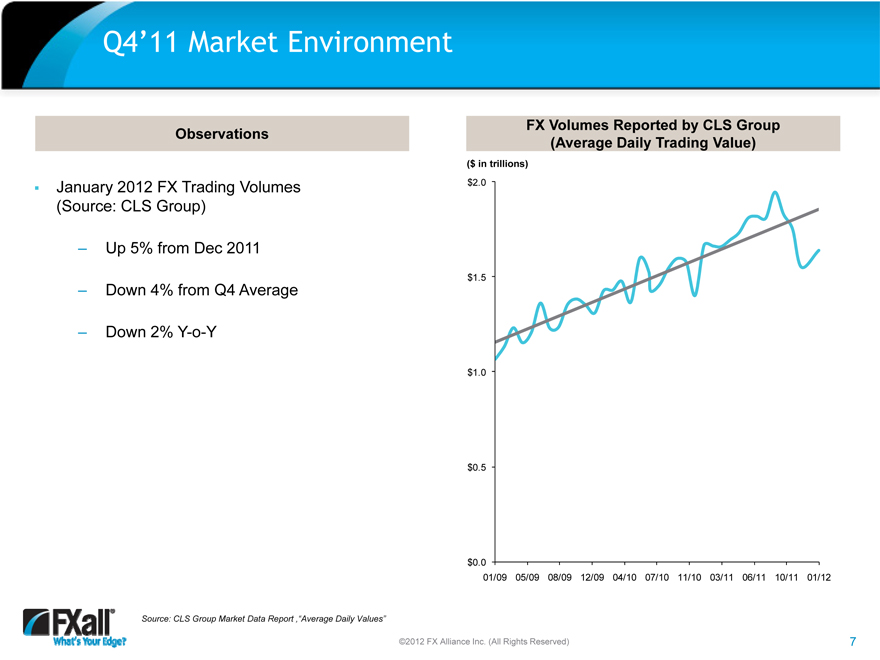
Q4’11 Market Environment
Observations
January 2012 FX Trading Volumes
(Source: CLS Group)
– Up 5% from Dec 2011
– Down 4% from Q4 Average
– Down 2% Y-o-Y
FX Volumes Reported by CLS Group (Average Daily Trading Value)
($ in trillions)
$2.0
$1.5
$1.0
$0.5
$0.0
01/09 05/09 08/09 12/09 04/10 07/10 11/10 03/11 06/11 10/11 01/12
Source: CLS Group Market Data Report ,”Average Daily Values”
©2012 FX Alliance Inc. (All Rights Reserved)
7
|
|
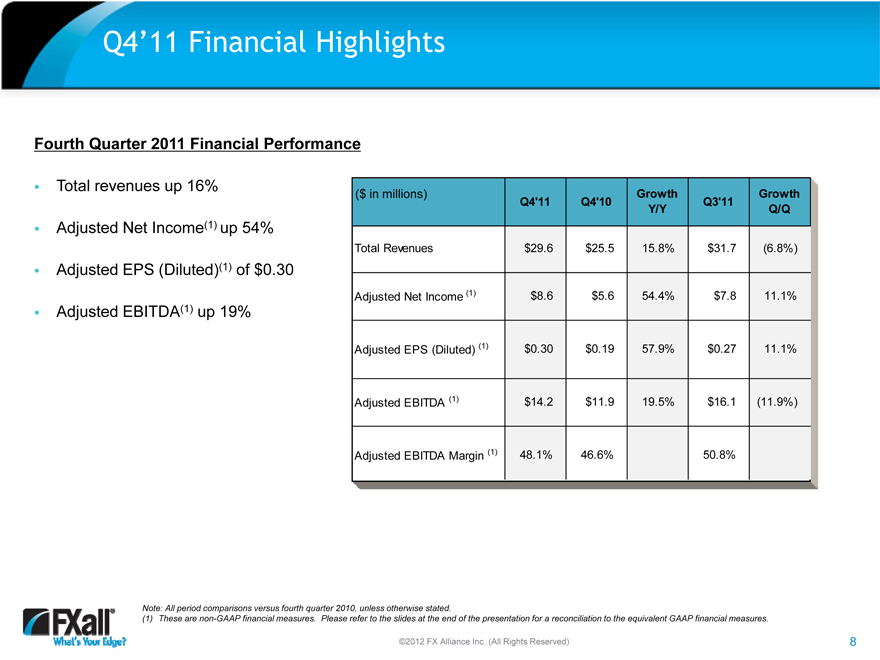
Q4’11 Financial Highlights
Fourth Quarter 2011 Financial Performance
Total revenues up 16%
Adjusted Net Income(1) up 54% Adjusted EPS (Diluted)(1) of $0.30 Adjusted EBITDA(1) up 19%
($ in millions) Growth Growth
Q4’11 Q4’10 Q3’11
Y/Y Q/Q
Total Revenues $29.6 $25.5 15.8% $31.7 (6.8%)
Adjusted Net Income (1) $8.6 $5.6 54.4% $7.8 11.1%
Adjusted EPS (Diluted) (1) $0.30 $0.19 57.9% $0.27 11.1%
Adjusted EBITDA (1) $14.2 $11.9 19.5% $16.1 (11.9%)
Adjusted EBITDA Margin (1) 48.1% 46.6% 50.8%
Note: All period comparisons versus fourth quarter 2010, unless otherwise stated.
(1) These are non-GAAP financial measures. Please refer to the slides at the end of the presentation for a reconciliation to the equivalent GAAP financial measures.
©2012 FX Alliance Inc. (All Rights Reserved)
8
|
|
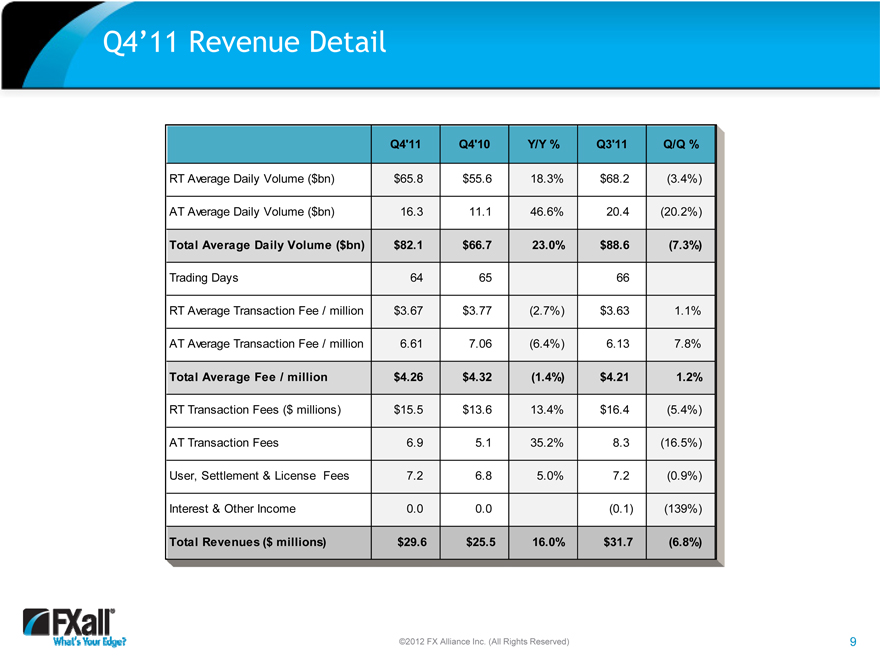
Q4’11 Revenue Detail
Q4’11 Q4’10 Y/Y % Q3’11 Q/Q %
RT Average Daily Volume ($bn) $65.8 $55.6 18.3% $68.2 (3.4%)
AT Average Daily Volume ($bn) 16.3 11.1 46.6% 20.4 (20.2%)
Total Average Daily Volume ($bn) $82.1 $66.7 23.0% $88.6 (7.3%)
Trading Days 64 65 66
RT Average Transaction Fee / million $3.67 $3.77 (2.7%) $3.63 1.1%
AT Average Transaction Fee / million 6.61 7.06 (6.4%) 6.13 7.8%
Total Average Fee / million $4.26 $4.32 (1.4%) $4.21 1.2%
RT Transaction Fees ($ millions) $15.5 $13.6 13.4% $16.4 (5.4%)
AT Transaction Fees 6.9 5.1 35.2% 8.3 (16.5%)
User, Settlement & License Fees 7.2 6.8 5.0% 7.2 (0.9%)
Interest & Other Income 0.0 0.0 (0.1) (139%)
Total Revenues ($ millions) $29.6 $25.5 16.0% $31.7 (6.8%)
©2012 FX Alliance Inc. (All Rights Reserved)
9
|
|
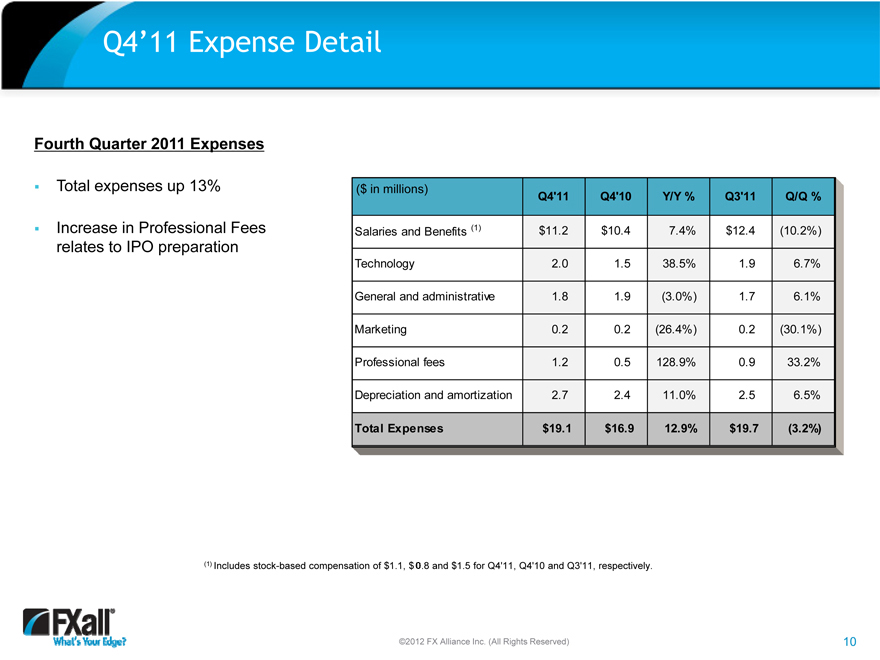
Q4’11 Expense Detail
Fourth Quarter 2011 Expenses
Total expenses up 13%
Increase in Professional Fees relates to IPO preparation
($ in millions) Q4’11 Q4’10 Y/Y % Q3’11 Q/Q %
Salaries and Benefits (1) $11.2 $10.4 7.4% $12.4 (10.2%)
Technology 2.0 1.5 38.5% 1.9 6.7%
General and administrative 1.8 1.9 (3.0%) 1.7 6.1%
Marketing 0.2 0.2 (26.4%) 0.2 (30.1%)
Professional fees 1.2 0.5 128.9% 0.9 33.2%
Depreciation and amortization 2.7 2.4 11.0% 2.5 6.5%
Total Expenses $19.1 $16.9 12.9% $19.7 (3.2%)
(1) Includes stock-based compensation of $1.1, $.8 and $1.5 for Q4’11, Q4’10 and Q3’11, respectively.
©2012 FX Alliance Inc. (All Rights Reserved)
10
|
|
Summary
Leading institutional FX trading solution
Strong fourth quarter and full-year 2011 year-over-year financial and operating performance
Record relationship and active trading volume for the full-year 2011
Increased global market share of FX volumes—average daily trading volume of $83.4 billion in 2011 Strong growth across diversified institutional client base Strategic expansion of product suite and geographic presence
FXall is well positioned
Diversified institutional client base Broad capabilities and robust offerings Global footprint
Strong growth across diversified institutional client base
©2012 FX Alliance Inc. (All Rights Reserved)
11
|
|
Appendix
©2012 FX Alliance Inc. (All Rights Reserved)
|
|
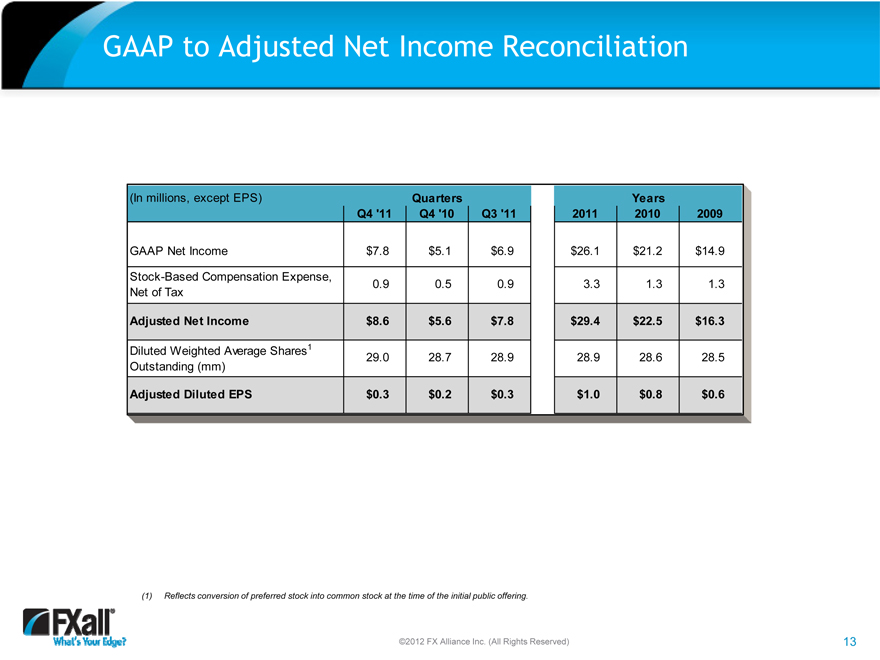
GAAP to Adjusted Net Income Reconciliation
(In millions, except EPS) Quarters Years
Q4 ‘11 Q4 ‘10 Q3 ‘11 2011 2010 2009
GAAP Net Income $7.8 $5.1 $6.9 $26.1 $21.2 $14.9
Stock-Based Compensation Expense, 0.9 0.5 0.9 3.3 1.3 1.3
Net of Tax
Adjusted Net Income $8.6 $5.6 $7.8 $29.4 $22.5 $16.3
Diluted Weighted Average Shares1 29.0 28.7 28.9 28.9 28.6 28.5
Outstanding (mm)
Adjusted Diluted EPS $0.3 $0.2 $0.3 $1.0 $0.8 $0.6
(1) Reflects conversion of preferred stock into common stock at the time of the initial public offering.
©2012 FX Alliance Inc. (All Rights Reserved)
13
|
|
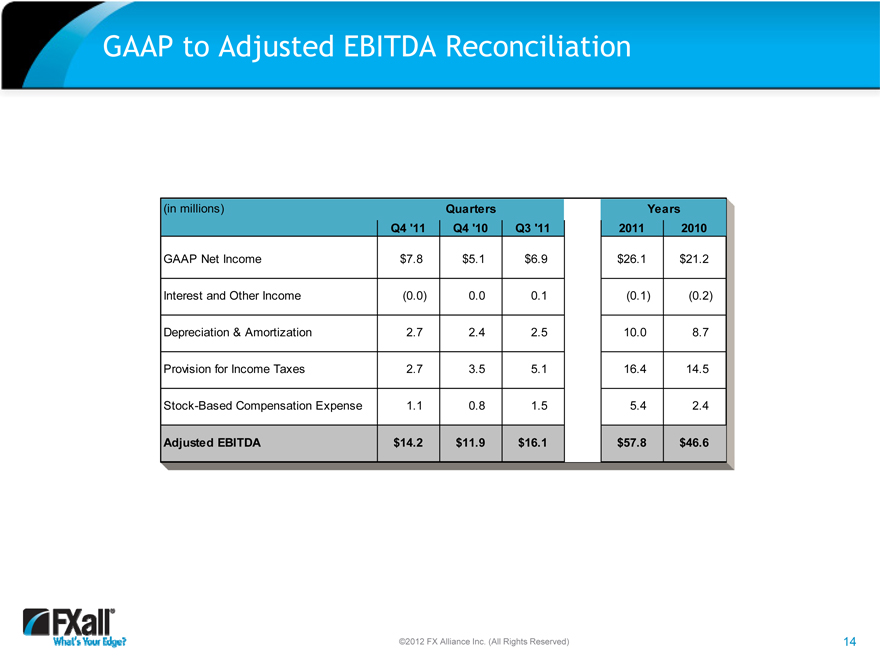
GAAP to Adjusted EBITDA Reconciliation
(in millions) Quarters Years
Q4 ‘11 Q4 ‘10 Q3 ‘11 2011 2010
GAAP Net Income $7.8 $5.1 $6.9 $26.1 $21.2
Interest and Other Income (0.0) 0.0 0.1 (0.1) (0.2)
Depreciation & Amortization 2.7 2.4 2.5 10.0 8.7
Provision for Income Taxes 2.7 3.5 5.1 16.4 14.5
Stock-Based Compensation Expense 1.1 0.8 1.5 5.4 2.4
Adjusted EBITDA $14.2 $11.9 $16.1 $57.8 $46.6
©2012 FX Alliance Inc. (All Rights Reserved)
14