Attached files
| file | filename |
|---|---|
| 8-K - POLARIS INDUSTRIES INC. 8-K - Polaris Inc. | a50186012.htm |
Exhibit 99.1
Polaris Industries Inc. February 2012 Investor Presentation
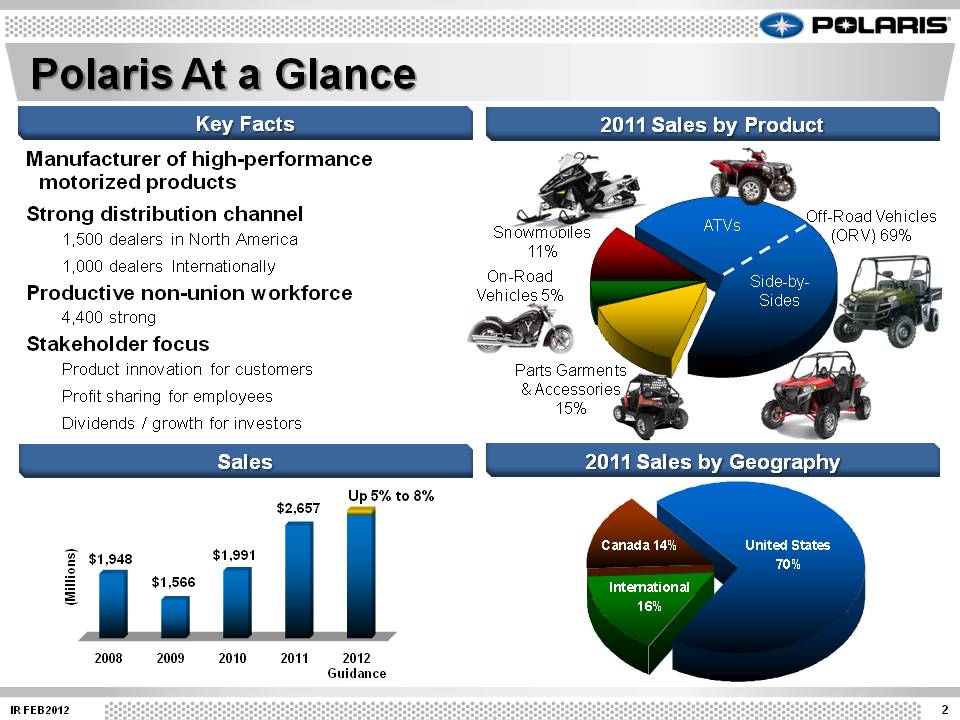
Canada 14% International16% United States 70% 2 IR FEB2012 Manufacturer of high-performance motorized products Strong distribution channel 1,500 dealers in North America 1,000 dealers Internationally Productive non-union workforce 4,400 strong Stakeholder focus Product innovation for customers Profit sharing for employees Dividends / growth for investors Off-Road Vehicles (ORV) 69% On-Road Vehicles 5% Snowmobiles11% Parts Garments & Accessories 15% ATVs Side-by-Sides 2008 2009 2010 2011 2012 Guidance $1,948 $1,566 $1,991 $2,657 (Millions) Up 5% to 8% ranger Key Facts 2011 Sales by Product Sales 2011 Sales by Geography Polaris At a Glance
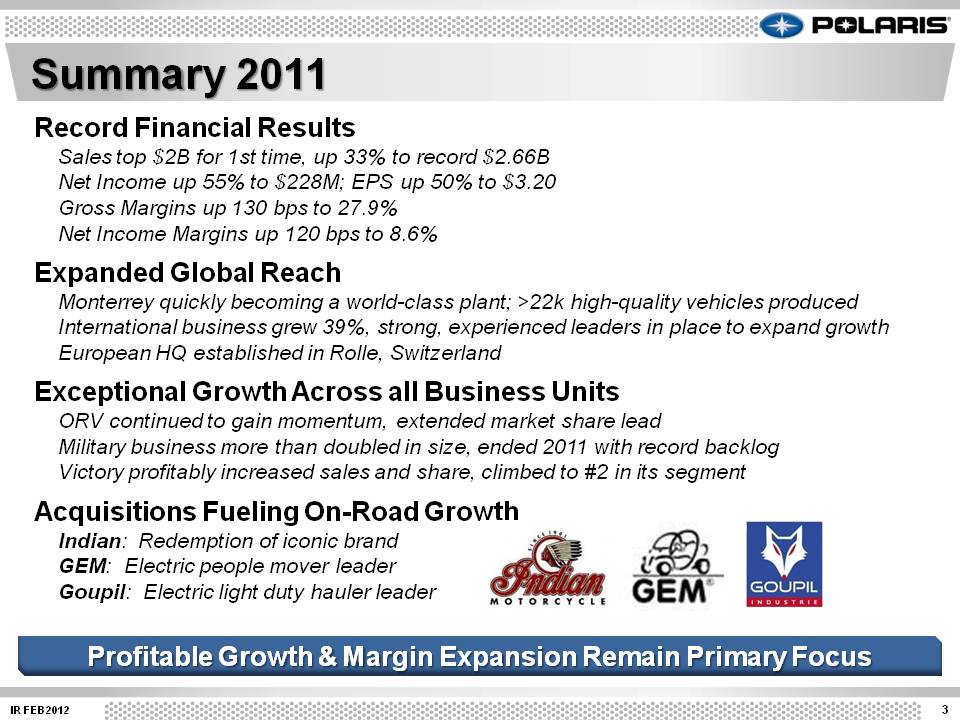
3 IR FEB2012 Summary 2011 Record Financial Results Sales top $2B for 1st time, up 33% to record $2.66B Net Income up 55% to $228M; EPS up 50% to $3.20 Gross Margins up 130 bps to 27.9% Net Income Margins up 120 bps to 8.6% Expanded Global Reach Monterrey quickly becoming a world-class plant; >22k high-quality vehicles produced International business grew 39%, strong, experienced leaders in place to expand growth European HQ established in Rolle, Switzerland Exceptional Growth Across all Business Units ORV continued to gain momentum, extended market share lead Military business more than doubled in size, ended 2011 with record backlog Victory profitably increased sales and share, climbed to #2 in its segment Acquisitions Fueling On-Road Growth Indian: Redemption of iconic brand GEM: Electric people mover leader Goupil: Electric light duty hauler leader Profitable Growth & Margin Expansion Remain Primary Focus

4 IR FEB2012 Strategic Objectives Best in Powersports PLUS 5-8% annual organic growth Growth through Adjacencies $200 -500M growth Global Market Leadership >25% of Polaris revenue Operations is Competitive Advantage Op Ex drives > 200 bps operating margin improvement Strong Financial Performance Sustainable, profitable growth Net Income Margin >9.5% $1.6Billion >$5.0 Billion >$3.0 Billion 2009 2014 2018 2009 2014 2018 6.5% 10.0% >9.5% >8.0% Grow Sales $5 Billion by 2018 Clear, Consistent Strategy Expand Net Income Margins 10% of Sales by 2018
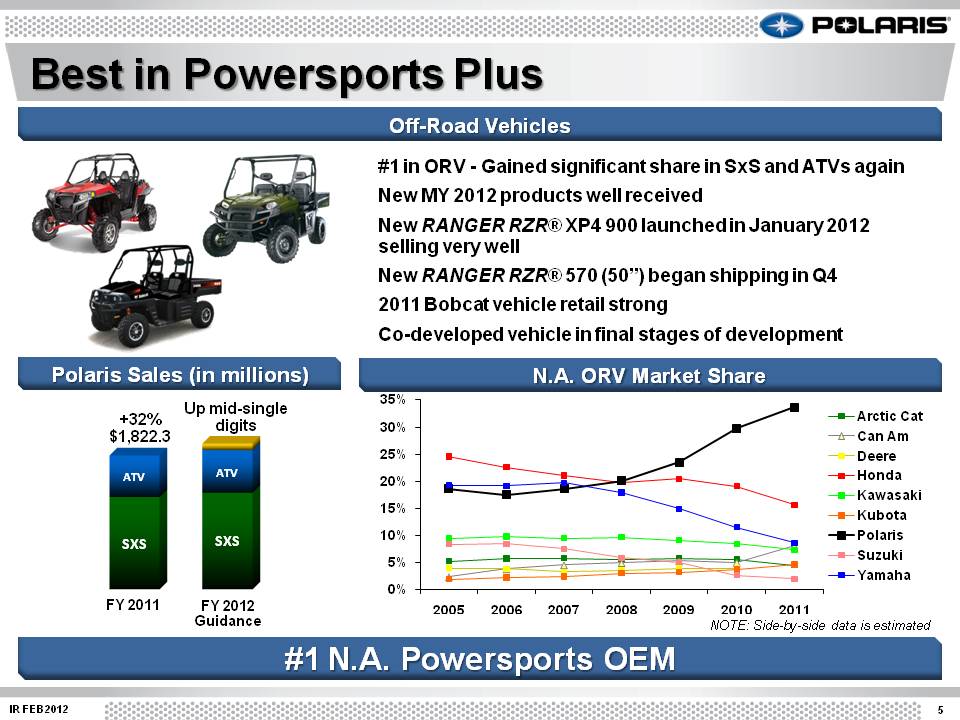
#1 in ORV -Gained significant share in SxS and ATVs again New MY 2012 products well received New RANGER RZR® XP4 900 launched in January 2012 selling very well New RANGER RZR® 570 (50”) began shipping in Q4 2011 Bobcat vehicle retail strong Co-developed vehicle in final stages of development +32% $1,822.3 Up mid-single digits FY 2012 Guidance FY 2011 SXS SXS ATV ATV ranger 0% 5% 10% 15% 20% 25% 30% 35% 2005 2006 2007 2008 2009 2010 2011 Arctic Cat Can Am Deere Honda Kawasaki Kubota Polaris Suzuki Yamaha IR FEB2012 5 Best in PowersportsPlus Off-Road Vehicles Polaris Sales (in millions) N.A. ORV Market Share #1 N.A. Powersports OEM NOTE: Side-by-side data is estimated
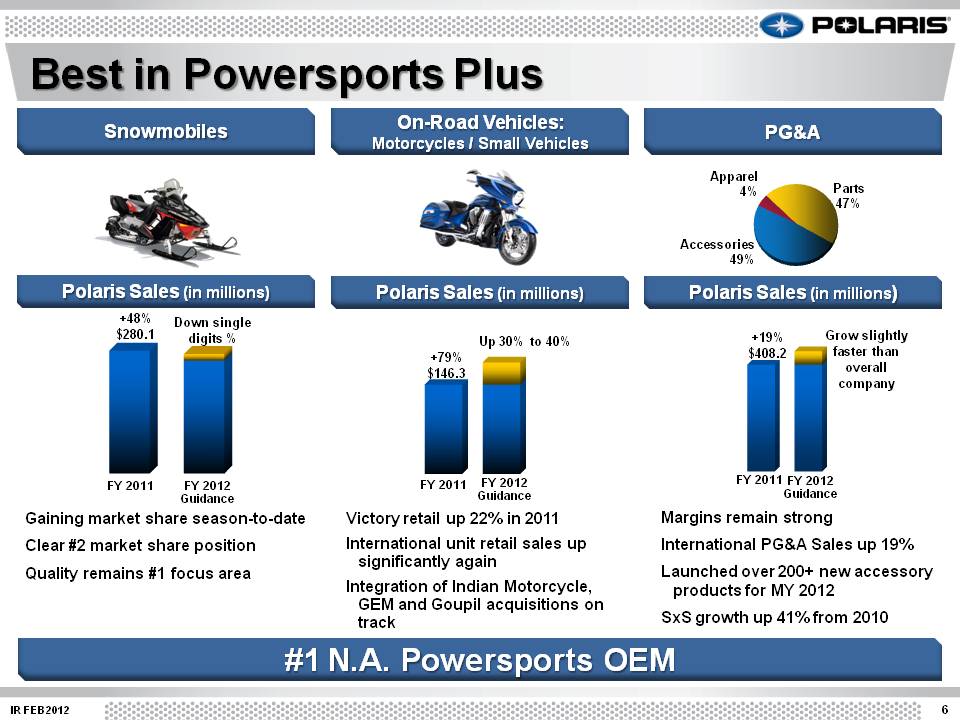
6 IR FEB2012 Best in PowersportsPlus Gaining market share season-to-date Clear #2 market share position Quality remains #1 focus area Victory retail up 22% in 2011 International unit retail sales up significantly again Integration of Indian Motorcycle, GEM and Goupilacquisitions on track FY 2012 Guidance FY 2011 FY 2012 Guidance FY 2011 +48% $280.1 Down single digits % +79% $146.3 Up 30% to 40% Margins remain strong International PG&A Sales up 19% Launched over 200+ new accessory products for MY 2012 SxS growth up 41% from 2010 Parts 47% Accessories 49% Apparel 4% FY 2012 Guidance FY 2011 +19% $408.2 Grow slightly faster than overall company Snowmobiles On-Road Vehicles: Motorcycles / Small Vehicles PG&A Polaris Sales (in millions) Polaris Sales (in millions) Polaris Sales (in millions) #1 N.A. Powersports OEM
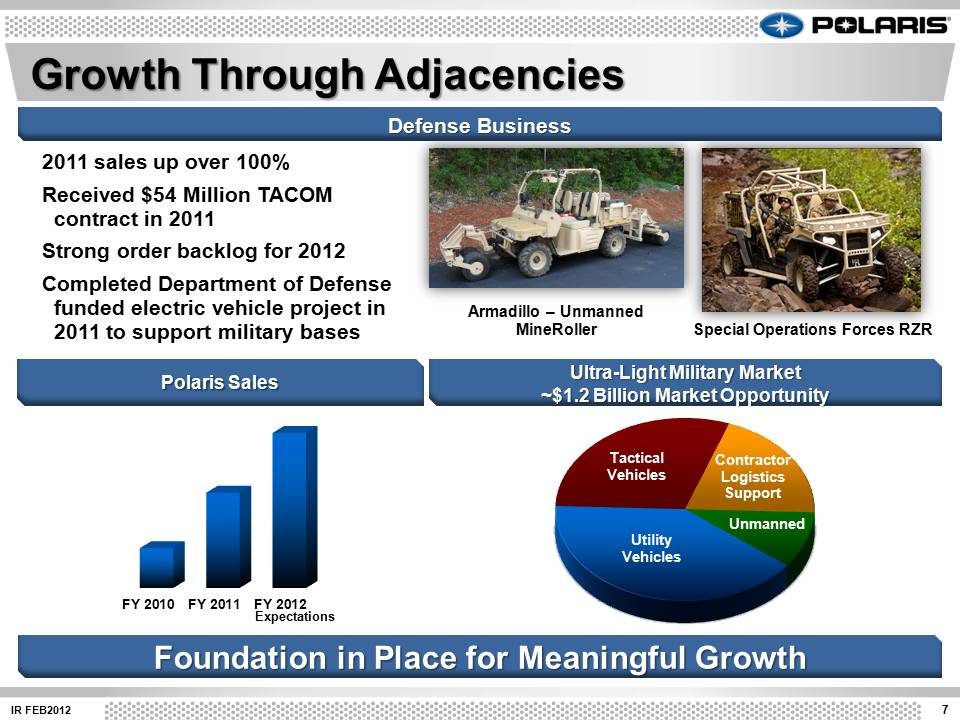
7 IR FEB2012 Growth Through Adjacencies Armadillo –Unmanned MineRoller 2011 sales up over 100% Received $54 Million TACOM contract in 2011 Strong order backlog for 2012 Completed Department of Defense funded electric vehicle project in 2011 to support military bases FY 2010 FY 2011 FY 2012 Special Operations Forces RZR Contractor Logistics Support Unmanned Utility Vehicles Tactical Vehicles Expectations Defense Business Foundation in Place for Meaningful Growth Polaris Sales Ultra-Light Military Market ~$1.2 Billion Market Opportunity
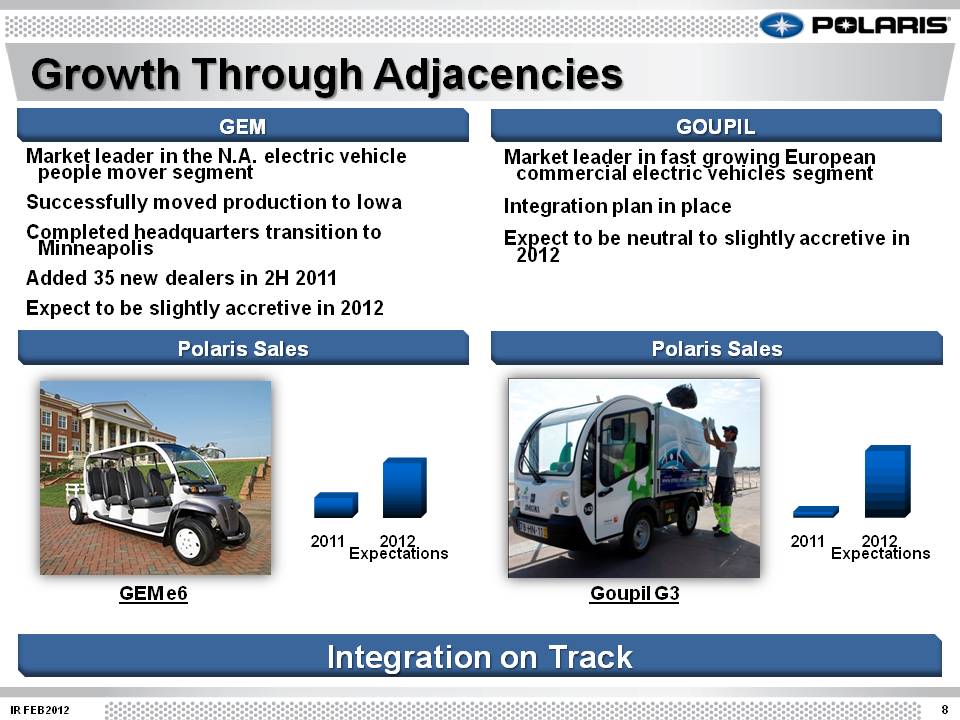
8 IR FEB2012 Market leader in the N.A. electric vehicle people mover segment Successfully moved production to Iowa Completed headquarters transition to Minneapolis Added 35 new dealers in 2H 2011 Expect to be slightly accretive in 2012 Market leader in fast growing European commercial electric vehicles segment Integration plan in place Expect to be neutral to slightly accretive in 2012 Growth Through Adjacencies GEM e6 2011 2012 2011 2012 Goupil G3 Expectations Expectations GEM GOUPIL Polaris Sales Polaris Sales Integration on Track
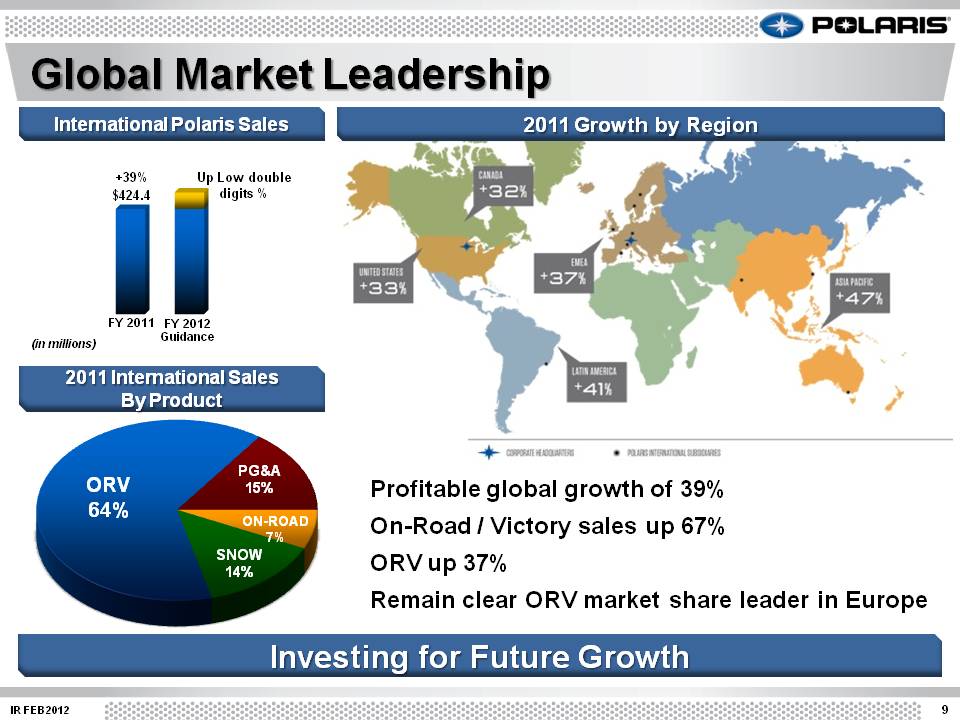
9 IR FEB2012 Global Market Leadership Profitable global growth of 39% On-Road / Victory sales up 67% ORV up 37% Remain clear ORV market share leader in Europe FY 2012 Guidance FY 2011 +39% $424.4 Up Low double digits % ON-ROAD 7% SNOW 14% ORV 64% PG&A15% 2011 Growth by Region 2011 International Sales By Product International Polaris Sales (in millions) Investing for Future Growth
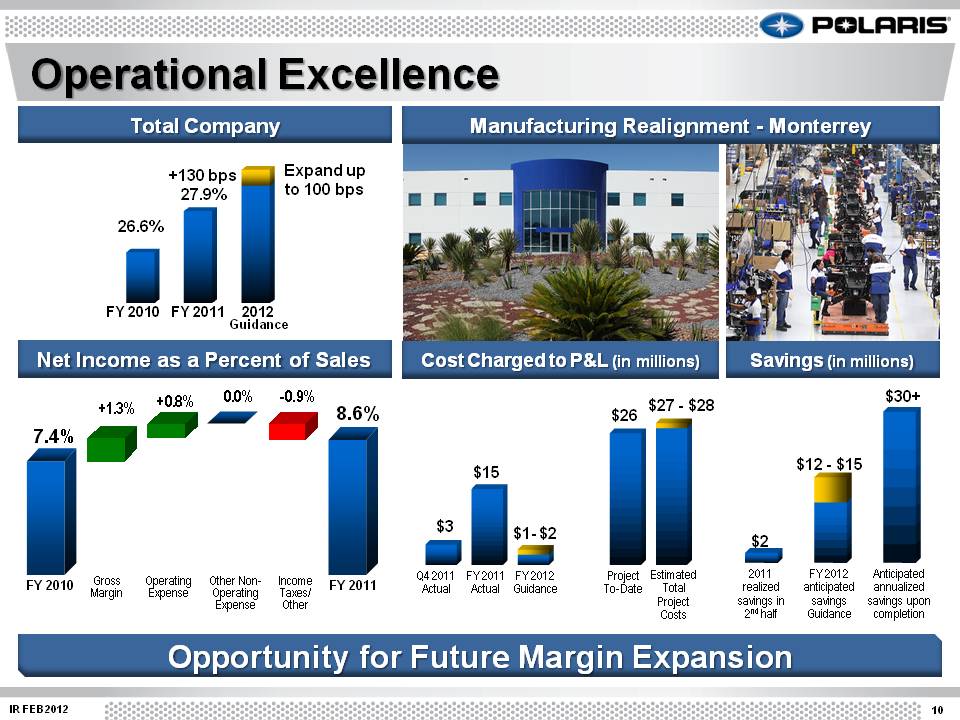
$3 $26 10 IR FEB2012 Operational Excellence FY 2010 FY 2011 2012 Guidance 26.6% +130 bps 27.9% +1.3% +0.8% 0.0% -0.9% Gross Margin Operating Expense Other Non-Operating Expense Income Taxes/ Other FY 2010 FY 2011 7.4% 8.6% Estimated Total Project Costs FY 2011Actual FY 2012 Guidance Project To-Date Q4 2011 Actual $27 -$28 $15 $1-$2 Anticipated annualized savings upon completion 2011 realized savings in 2ndhalf FY 2012 anticipated savings Guidance $12 -$15 $2 Total Company Manufacturing Realignment - Monterrey Expand up to 100 bps Net Income as a Percent of Sales Cost Charged to P&L (in millions) Opportunity for Future Margin Expansion $30+ Savings (in millions)
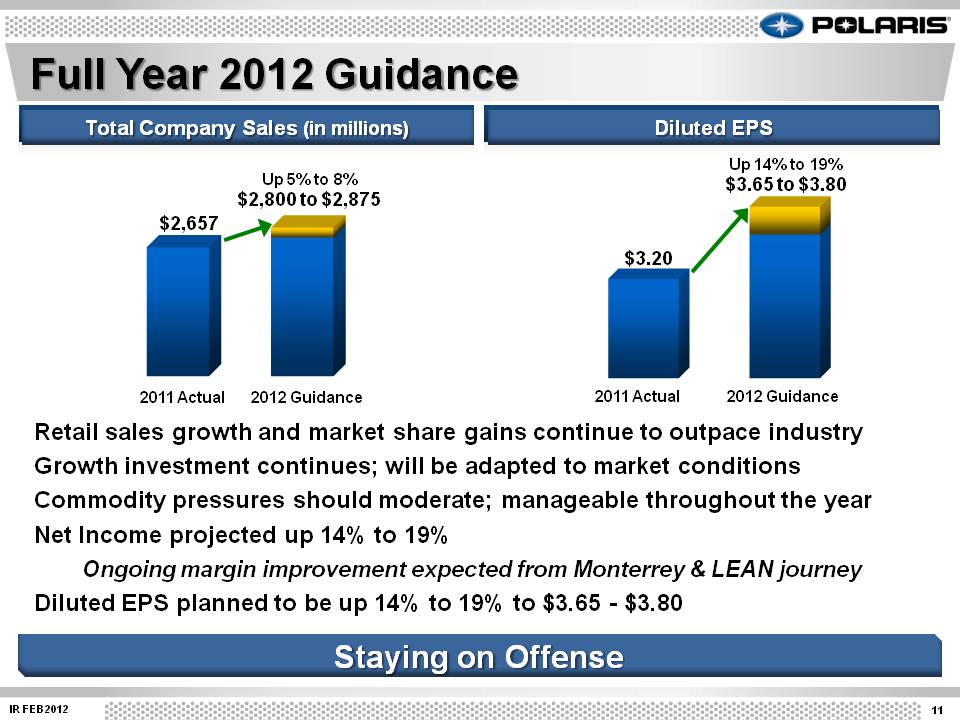
Total Company Sales (in millions) Diluted EPS 11 IR FEB2012 Full Year 2012 Guidance $2,657 Up 5% to 8% $2,800 to $2,875 2011 Actual 2012 Guidance $3.20 Up 14% to 19% $3.65 to $3.80 Retail sales growth and market share gains continue to outpace industry Growth investment continues; will be adapted to market conditions Commodity pressures should moderate; manageable throughout the year Net Income projected up 14% to 19% Ongoing margin improvement expected from Monterrey & LEAN journey Diluted EPS planned to be up 14% to 19% to $3.65 -$3.80 2011 Actual 2012 Guidance Staying on Offense

Thank you. Questions? IR FEB2012 12
13 IR FEB2012 Balance Sheet and Liquidity Profile Recent Polaris Performance 2012 Full Year Guidance Q4 2011 Sales and Net Income Gross Margin Percentage Trends ORV Customer Profile Product Innovation N.A. Dealer Inventory and Retail Sales Safe Harbor Statement Appendices
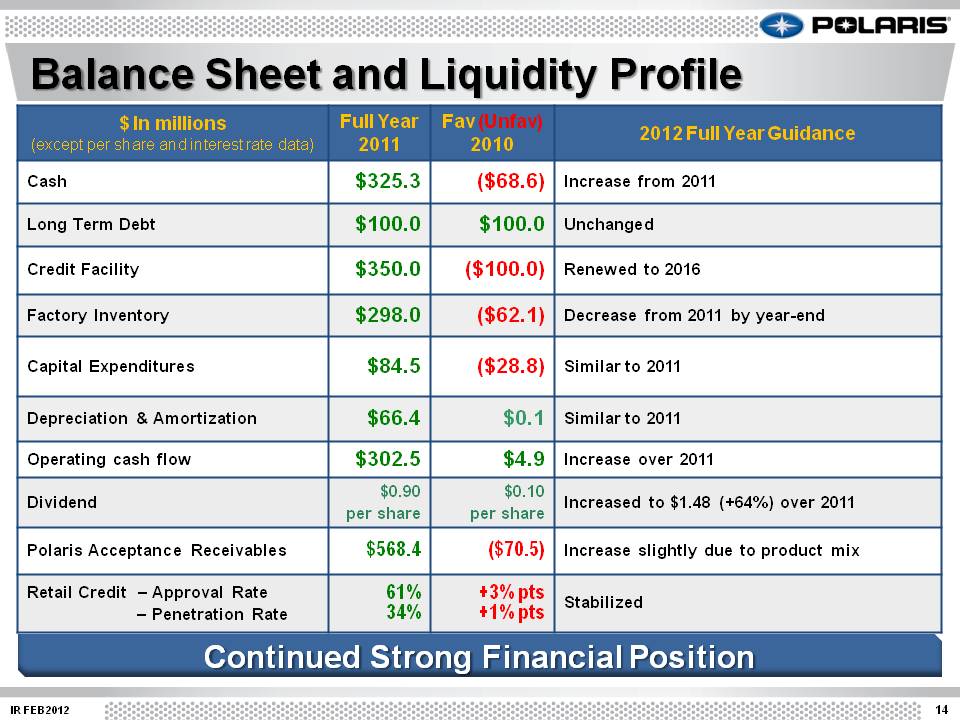
14 IR FEB2012 Balance Sheet and Liquidity Profile $ In millions (except per share and interest rate data) Full Year 2011 Fav (Unfav) 2010 2012 Full Year Guidance Cash $325.3 ($68.6) Increase from 2011 Long Term Debt $100.0 $100.0 Unchanged Credit Facility $350.0 ($100.0) Renewed to 2016 Factory Inventory $298.0 ($62.1) Decrease from 2011 by year-end Capital Expenditures $84.5 ($28.8) Similar to 2011 Depreciation & Amortization $66.4 $0.1 Similar to 2011 Operating cash flow $302.5 $4.9 Increase over 2011 Dividend $0.90 per share $0.10 per share Increased to $1.48 (+64%) over 2011 Polaris Acceptance Receivables $568.4 ($70.5) Increase slightly due to product mix Retail Credit – Approval Rate – Penetration Rate 61% 34% +3% pts +1% pts Stabilized Continued Strong Financial Position
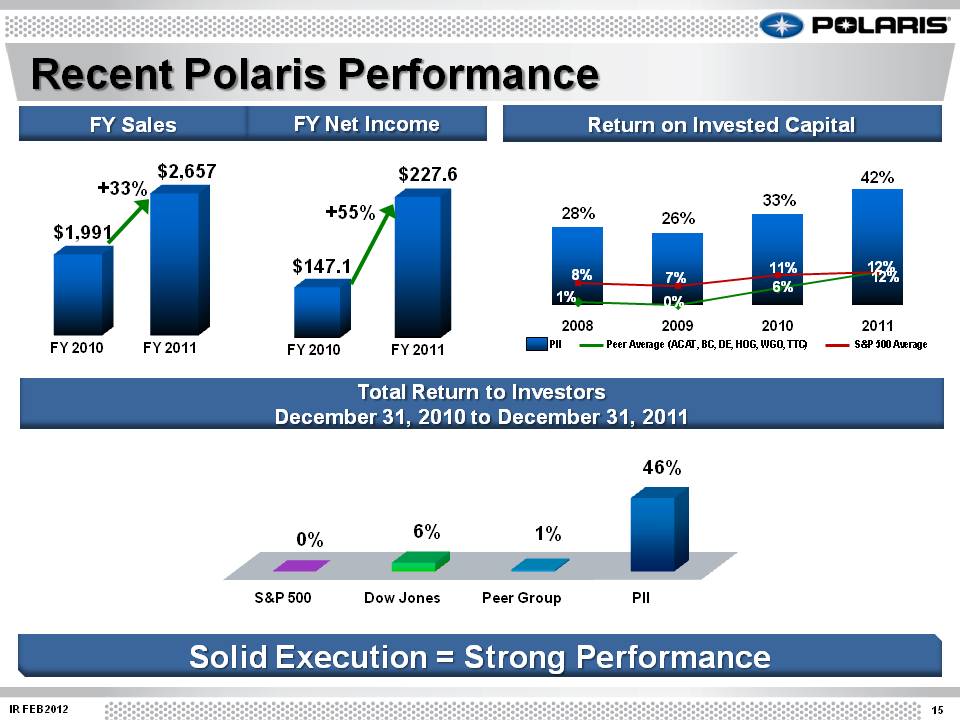
15 IR FEB2012 Recent Polaris Performance Return on Invested Capital FY Sales 28% 26% 33% 42% 1% 0% 6% 12% 8% 7% 11% 12% 2008 2009 2010 2011 Total Return to Investors December 31, 2010 to December 31, 2011 S&P 500 Dow Jones Peer Group PII 0% 6% 1% 46% FY Net Income PII Peer Average (ACAT, BC, DE, HOG, WGO, TTC) S&P 500 Average $147.1 $227.6 $1,991 $2,657 FY 2011 FY 2010 FY 2011 FY 2010 +55% +33% Solid Execution = Strong Performance
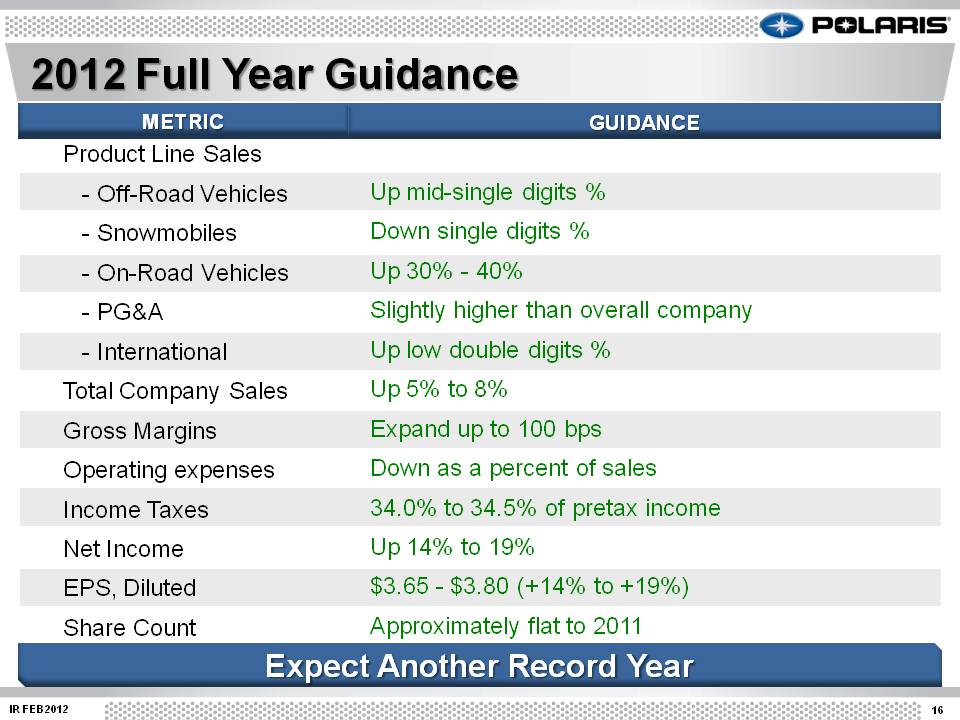
16 IR FEB2012 2012 Full Year Guidance Product Line Sales - Off-Road Vehicles - Snowmobiles - On-Road Vehicles - PG&A - International Total Company Sales Gross Margins Operating expenses Income Taxes Net Income EPS, Diluted Share Count Up mid-single digits % Down single digits % Up 30% - 40% Slightly higher than overall company Up low double digits % Up 5% to 8% Expand up to 100 bps Down as a percent of sales 34.0% to 34.5% of pretax income Up 14% to 19% $3.65 -$3.80 (+14% to +19%) Approximately flat to 2011 METRIC GUIDANCE Expect Another Record Year
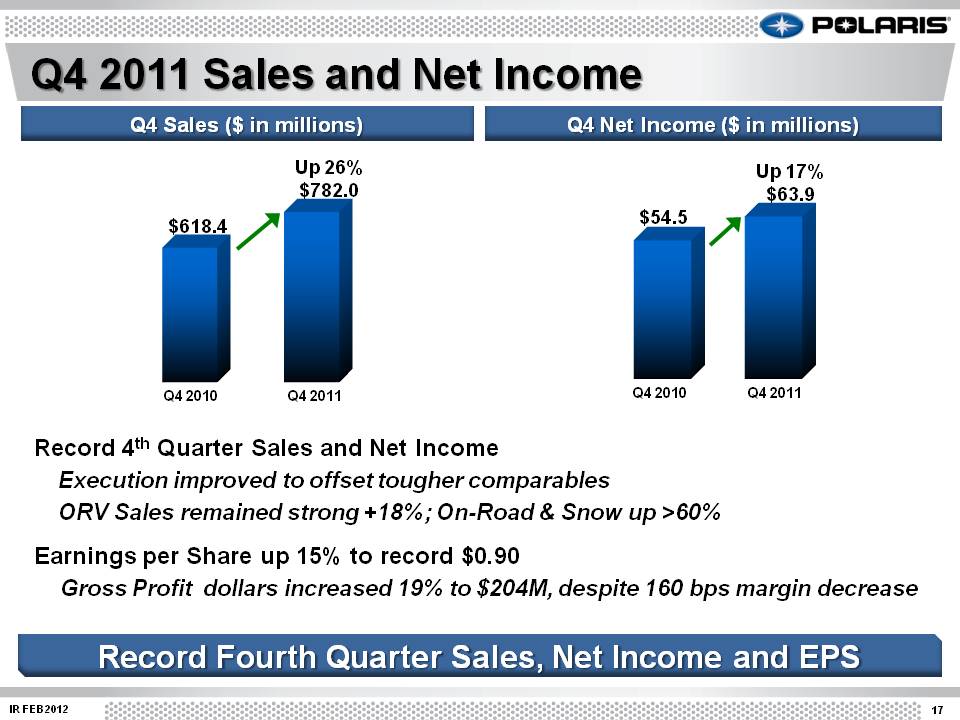
17 IR FEB2012 Q4 2011 Sales and Net Income Q4 Net Income ($ in millions) Q4 Sales ($ in millions) $54.5 Up 17% $63.9 Q4 2011 Q4 2010 Q4 2011 Q4 2010 Record 4th Quarter Sales and Net Income Execution improved to offset tougher comparables ORV Sales remained strong +18%; On-Road & Snow up >60% Earnings per Share up 15% to record $0.90 Gross Profit dollars increased 19% to $204M, despite 160 bps margin decrease Up 26% $782.0 $618.4 Record Fourth Quarter Sales, Net Income and EPS
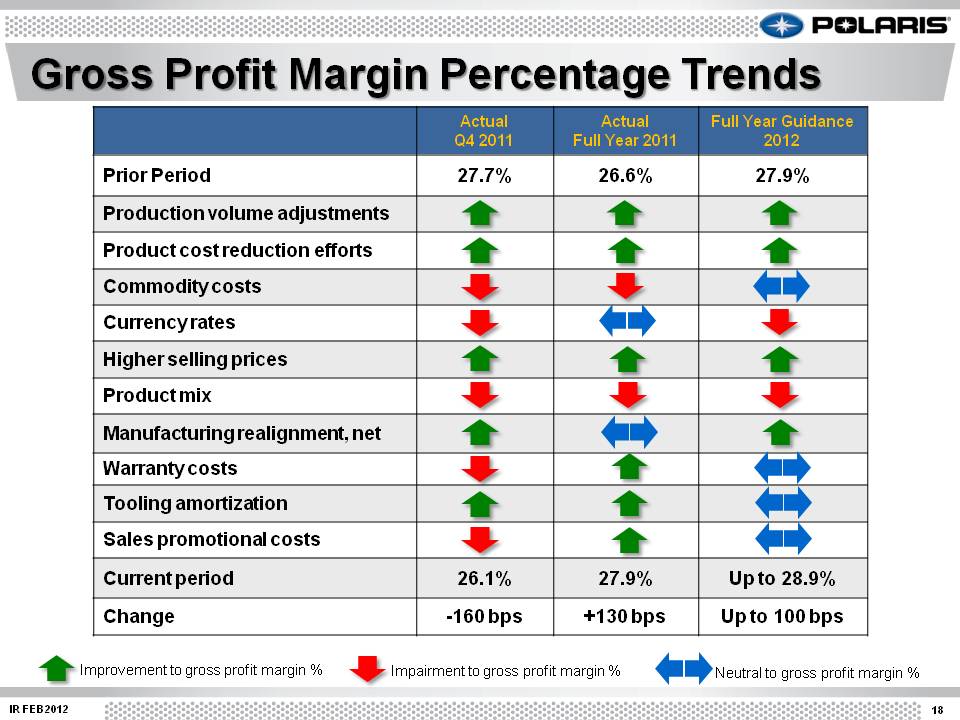
18 IR FEB2012 Gross Profit Margin Percentage Trends Actual Q4 2011 Actual Full Year 2011 Full Year Guidance2012 Prior Period 27.7% 26.6% 27.9% Production volume adjustments Product cost reduction efforts Commodity costs Currency rates Higher selling prices Product mix Manufacturing realignment, net Warranty costs Tooling amortization Sales promotional costs Current period 26.1% 27.9% Up to 28.9% Change -160 bps +130 bps Up to 100 bps Improvement to gross profit margin % Impairment to gross profit margin % Neutral to gross profit margin %
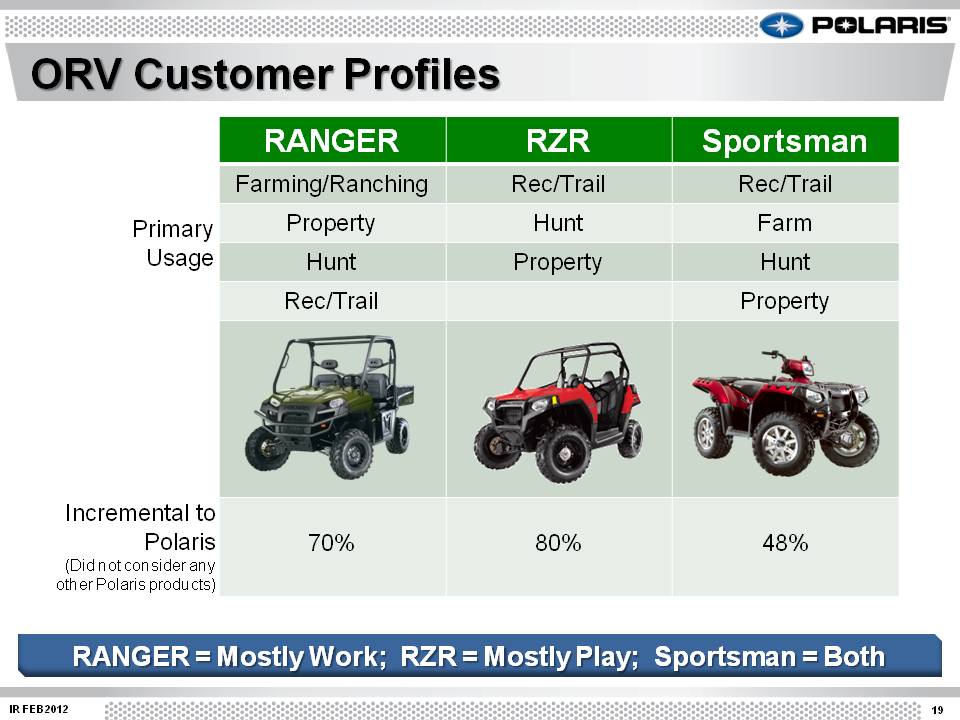
19 IR FEB2012 ORV Customer Profiles RZR RANGER RANGER RZR Sportsman Farming/Ranching Rec/Trail Rec/Trail Property Hunt Farm Hunt Property Hunt Rec/Trail Property 70% 80% 48% ranger Primary Usage Incremental to Polaris (Did not consider any other Polaris products) RANGER = Mostly Work; RZR = Mostly Play; Sportsman = Both
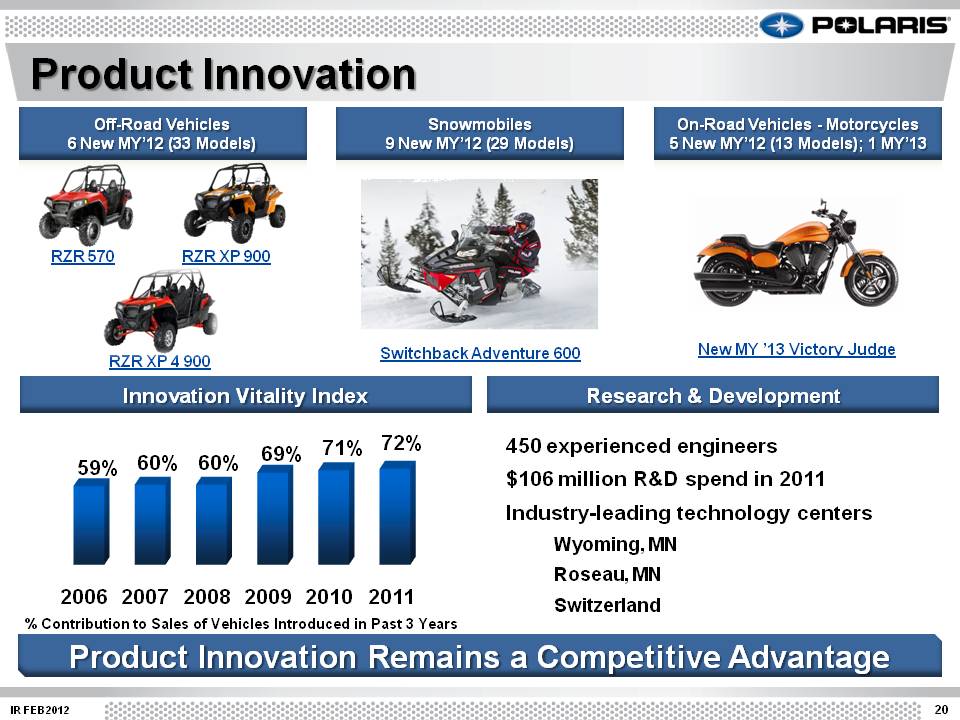
20 IR FEB2012 Product Innovation Off-Road Vehicles 6 New MY’12 (33 Models) Snowmobiles9 New MY’12 (29 Models) On-Road Vehicles -Motorcycles 5 New MY’12 (13 Models); 1 MY’13 Innovation Vitality Index % Contribution to Sales of Vehicles Introduced in Past 3 Years 450 experienced engineers $106 million R&D spend in 2011 Industry-leading technology centers Wyoming, MN Roseau, MN Switzerland RZR 570 RZR XP 4 900 Switchback Adventure 600 RZR XP 900 Research & Development New MY ’13 Victory Judge 2006 2007 2008 2009 2010 2011 59% 60% 60% 69% 71% 72% Product Innovation Remains a Competitive Advantage
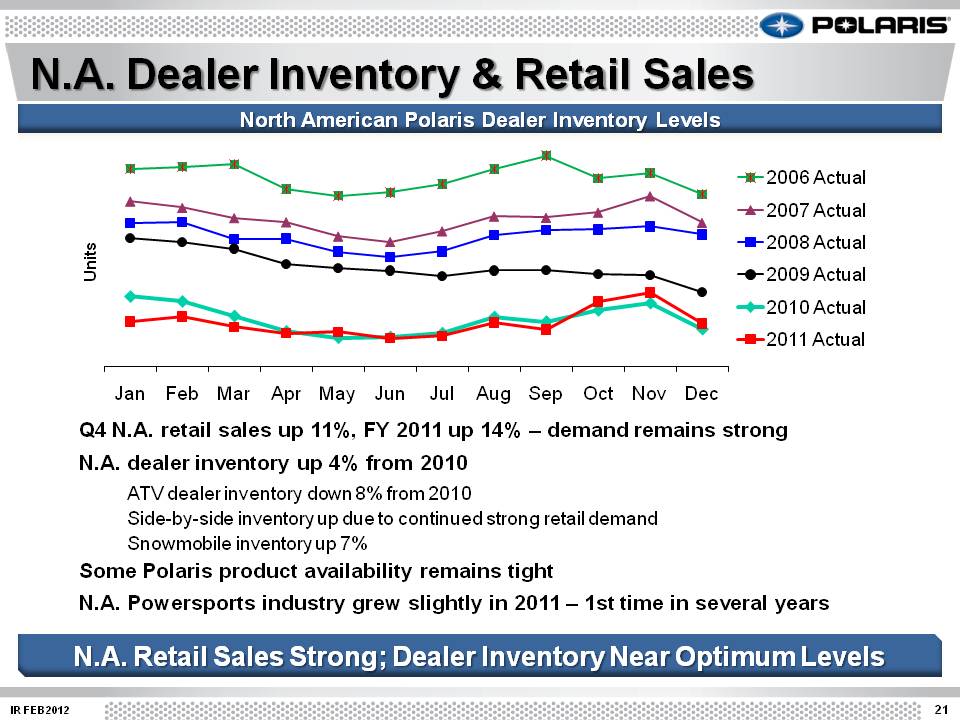
North American Polaris Dealer Inventory Levels 21 IR FEB2012 N.A. Dealer Inventory & Retail Sales 21 Q4 N.A. retail sales up 11%, FY 2011 up 14% – demand remains strong N.A. dealer inventory up 4% from 2010 ATV dealer inventory down 8% from 2010 Side-by-side inventory up due to continued strong retail demand Snowmobile inventory up 7% Some Polaris product availability remains tight N.A. Powersports industry grew slightly in 2011 – 1st time in several years Jan Feb Mar Apr May Jun Jul Aug Sep Oct Nov Dec Units 2006 Actual 2007 Actual 2008 Actual 2009 Actual 2010 Actual 2011 Actual N.A. Retail Sales Strong; Dealer Inventory Near Optimum Levels
22 IR FEB2012 Except for historical information contained herein, the matters set forth in this document, including but not limited to management’s expectations regarding 2012 sales, shipments, net income, cash flow, and manufacturing realignment transition costs and savings, are forward-looking statements that involve certain risks and uncertainties that could cause actual results to differ materially from those forward-looking statements.Potential risks and uncertainties include such factors as product offerings, promotional activities and pricing strategies by competitors; manufacturing realignment transition costs; acquisition integration costs; warranty expenses; impact of changes in Polaris stock prices on incentive compensation; foreign currency exchange rate fluctuations; environmental and product safety regulatory activity; effects of weather; commodity costs; uninsured product liability claims; uncertainty in the retail and wholesale credit markets; changes in tax policy and overall economic conditions, including inflation, consumer confidence and spending and relationships with dealers and suppliers. Investors are also directed to consider other risks and uncertainties discussed in our 2010 annual report and Form 10-K filed by the Company with the Securities and Exchange Commission. The Company does not undertake any duty to any person to provide updates to its forward-looking statements. The data source for retail sales figures included in this presentation is registration information provided by Polaris dealers in North America and compiled by the Company or Company estimates. The Company must rely on information that its dealers supply concerning retail sales, and other retail sales data sources and this information is subject to revision. Note: Shares and per share information have been adjusted to give effect to the two-for-one stock split declared on July 20, 2011, payable on September 12, 2011 to shareholders of record on September 2, 2011. Safe Harbor