Attached files
| file | filename |
|---|---|
| 8-K - FORM 8-K - MAGNUM HUNTER RESOURCES CORP | d309719d8k.htm |
Exhibit 99.1
| News Release |

|
News Release |
MAGNUM HUNTER REPORTS FINANCIAL RESULTS FOR THE
FOURTH QUARTER OF 2011 AND FISCAL YEAR END 2011
Record EBITDAX and Cash Flow Reported
2011 Production Increased 324% from 2010
2011 Revenues Increased 295% from 2010
4th Quarter Avg. Daily Production Increased 73% from 3rd Quarter
Year-End 2012 Production Exit Rate Guidance Increased to 16,000 BOEPD
FOR IMMEDIATE RELEASE – Houston – (Market Wire) – February 29, 2012 – Magnum Hunter Resources Corporation (NYSE: MHR, NYSE Amex: MHR-PrC and MHR-PrD) (“Magnum Hunter” or the “Company”) announced today financial results for the fourth quarter of 2011 and fiscal year end 2011.
Financial Results for the Three Months Ended December 31, 2011
Magnum Hunter reported an increase in total revenues of 404% to $49.1 million for the three months ended December 31, 2011 compared to $9.7 million for the three months ended December 31, 2010. The increase in revenues was driven principally by the significant increase in production derived from both the NuLoch and NGAS acquisitions completed in the second quarter of 2011; and, the subsequent success achieved in the Company’s drilling programs in its three unconventional resource plays.
Operating margins also improved substantially as lease operating expenses per barrel of oil equivalent (“Boe”) declined from $20.15 per Boe to $11.71 per Boe. This operating improvement is a result of the addition of new production, divestitures of high lifting cost conventional properties, and tighter controls on field operating expenses. Recurring cash general and administrative costs per Boe also declined from $38.63 to $10.04 per Boe. The Company anticipates this trend of improving operating statistics to continue into fiscal year 2012 as production continues to expand in its unconventional resource plays while at the same time the Company’s overhead requires minimal expansion.
The Company reported a net loss of $60.9 million or ($0.46) per basic and diluted common shares outstanding for the three months ended December 31, 2011, compared to a net loss of $1.9 million, or ($0.03) per basic and diluted common shares outstanding for the three months ended December 31, 2010. The Company’s net loss per share for the three months ended December 31, 2011, was ($0.05) per basic and diluted common shares outstanding when adjusted for non-cash and non-recurring expenses summarized as follows: (i) impairment of proved oil gas properties of $22.9 million ($0.17 per share); (ii) unrealized loss on derivatives of $21.4 million ($0.16 per share); (iii) non-cash
compensation expense of $6.0 million ($0.05 per share); and (iv) acquisition-related and other non-cash and non-recurring expenses of $3.6 million ($0.03 per share). The company’s impairment charge is specifically related to the write-down of natural gas properties of NGAS located in Kentucky. The Company employs successful efforts reserve method of accounting which requires that reserve values be calculated on a field-by-field basis utilizing current commodity pricing. An impairment was recorded when the estimated fair value of a field was less than the net capitalized cost of the field at December 31, 2011. Fair value was determined by calculating the present value of future cash flows using NYMEX prices in effect during February 2012.
For the three months ended December 31, 2011, Magnum Hunter’s ‘Adjusted Earnings Before Interest, Income Taxes, Depreciation and Amortization’ (“Adjusted EBITDA”) was $21.2 million or $0.16 per basic and diluted common shares outstanding as compared to $0.9 million or $0.01 per basic and diluted common shares outstanding for the three months ended December 31, 2010, representing an increase of 2,281%.
Financial Results for Fiscal Year End 2011
Magnum Hunter reported an increase in revenues of 295% to $129.2 million for the twelve months ended December 31, 2011 compared to $32.7 million for the twelve months ended December 31, 2010. This increase in revenues was driven principally by the significant increase in production from the Company’s acquisitions completed in 2011 and the success of its drilling programs in its three unconventional resource plays. Operating margins also improved substantially as lease operating expenses per Boe declined from $21.90 per Boe to $13.46 per Boe; and recurring cash general and administrative costs per Boe also declined significantly from $34.43 per Boe to $13.36 per Boe.
The Company reported a net loss of $90.7 million or ($0.80) per basic and diluted common shares outstanding for the twelve months ended December 31, 2011, compared to a net loss of $22.3 million, or ($0.25) per basic and diluted common shares outstanding during the twelve months ended December 31, 2010. The Company’s net loss for the twelve months ended December 31, 2011 would have been ($0.19) per basic and diluted common shares outstanding when adjusted for non-cash and non-recurring expenses summarized as follows: (i) non-cash compensation expense of $25.4 million ($0.22 per share); (ii) impairment of proved oil gas properties of $22.9 million ($0.20 per share); (iii) acquisition-related and other non-cash and non-recurring expenses of $16.9 million ($0.15 per share); and (iv) unrealized loss on derivatives of $4.2 million ($0.04 per share).
For the twelve months ended December 31, 2011, Magnum Hunter’s Adjusted EBITDA was $50.4 million or $0.45 per basic and diluted common shares outstanding as compared to $4.2 million or $0.07 per basic and diluted common shares outstanding for the prior fiscal year ended December 31, 2010, representing a 1,094% increase.
Production Results for 2011 and Outlook for 2012
Average daily production increased 547% for the three months ended December 31, 2011 to 9,124 barrels of oil equivalent per day (“Boepd”) (37% oil/liquids) as compared to the 1,410 Boepd reported for the three months ended December 31, 2010. The daily production rate in the fourth quarter of 2011 represents a 73% increase over the production rate of 5,270 Boepd reported during the third quarter of 2011, demonstrating success from the Company’s organic drilling programs in each of its operating regions. The Company had a year-end 2011 exit rate in excess of 12,500 Boepd. The Company averaged approximately 13,000 Boepd for the month of January 2012 and is currently producing above 13,000 Boepd. The Company expects to exit 2012 in excess of 16,000 Boepd, with approximately 55% of the production mix being oil/liquids.
Average daily production for fiscal year 2011 was 5,510 Boepd (43% oil/liquids) which represents a 324% increase over the 1,301 Boepd reported for fiscal year 2010. This significant production increase is due primarily to the drilling and completion success achieved with new wells in each of the Company’s operating regions.
Proved Reserves Overview
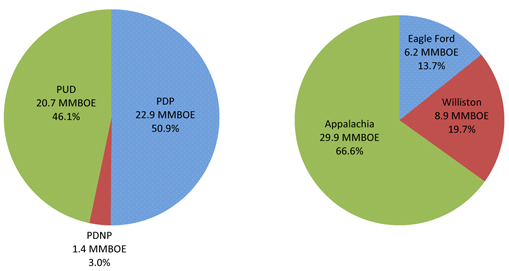
The Company’s total proved reserves increased by 31.5 million Boe or 235% to 44.9 million Boe (48% crude oil and ngls; 51% proved developed producing) as of December 31, 2011 as compared to 13.4 million Boe (51% crude oil & ngls; 44% proved developed producing) at December 31, 2010. The increase in total proved reserves is attributable to the NGAS and NuLoch acquisitions and new wells completed in the Company’s three unconventional resource plays.
| December 31, 2011 | December 31, 2011 | |
| Total Proved Reserves: 44.9 MMBOE | Proved Reserves by Region | |
| 48% Oil/Liquids | ||
| ||
Capital Expenditures and Liquidity
Magnum Hunter’s fiscal year 2011 total capital expenditures, excluding acquisitions, were $268 million. The Company’s preliminary 2012 capital expenditure budget is $200 million including $150 million in its upstream business and $50 million for its midstream business. The Company intends to direct a much larger percentage of capital expenditures in 2012 to oil and liquids projects and will delay drilling and completion on the majority of its high liquid natural gas projects until later in the year when the MarkWest Mobley liquids complex becomes operational. As a result, the Company’s budget is substantially all focused on oil development in the first half of the year. We will continue to evaluate further reallocation of our capital budget as we move towards the second half of the year depending on commodity price levels and the progress and timing of the completion of the MarkWest Mobley liquids complex.
As a result of the Company’s internally generated cash flows, issuance of preferred stock and availability under its expanded Credit Facilities, Magnum Hunter has sufficient resources to fund its preliminary capital expenditure budget for 2012. Additionally, all of our budgeted expenditures for our midstream segment are expected to be funded through separate financing with the Eureka Hunter Credit Facility. As of February 28, 2012 the Company had total liquidity of approximately $100 million under its combined credit facilities. In addition, the Company has resumed the sales of its Series D Preferred Stock (non-convertible) in 2012 with approximately $35 million sold year-to-date. We expect to continue issuing Series D preferred throughout 2012 with approximately $150 million remaining and available to be sold in the future under our existing ATM program. In addition, the Company also expects to review opportunities now available in the high yield markets this year, and is actively working on monetizing a minority interest in its Eureka Pipeline system. As a result of these efforts, the Company anticipates having additional liquidity to fund 2012 capital expenditures and any future budget expansions based upon continued successful drilling results.
Management Comments
Mr. Gary C. Evans, Chairman of the Board and Chief Executive Officer of Magnum Hunter Resources, commented, “Calendar year 2011 was a transitional period for Magnum Hunter. During the first half of the year, we successfully closed on a number of acquisitions that provided the foundation from which we are growing our daily production and proved reserves today. During the second half of the year, we completed the integration of approximately $590 million in transactions and began our “harvesting” mode of exploiting the tremendous leasehold acreage positions covering these unconventional resource plays. Our year-end production success which is continuing into the first quarter of 2012, has given us the confidence to increase our projected exit rate on daily production a third time to 16,000 Boe per day by year-end. At the same time, we continue reducing our cost structure both in the field and at our corporate offices which will enable us to report much wider margins of cash flow available for reinvestment. Because we are in control of approximately 75% of our core properties as an operator, we have the flexibility to move our capital program around and reallocate among our two oil plays (Bakken and Eagle Ford) while the energy industry deals with an unprecedented glut of natural gas. This will ensure that our returns on capital deployed in 2012 remain at superior levels. Our management team continues to make operating improvements in the field which is resulting in production levels that exceed our prior expectations.”
Non-GAAP Financial Measures and Reconciliations
Note: Adjusted EBITDA is a non-GAAP financial accounting measure and as such, a full reconciliation of the above exhibited Adjusted EBITDA numbers to the Company’s reported net income for the three and twelve months ended December 31, 2011 and 2010 using standardized GAAP financial accounting methodology and as reported to and filed with the Securities and Exchange Commission can be found and is exhibited in the footnotes of this press release below. Also, a reconciliation of the recurring loss per common share to the reported loss per common share for the three and twelve months ended December 31, 2011, and a reconciliation to recurring cash G&A for the three and twelve months ended December 31, 2011 and 2010 are provided in the footnotes of this press release below. These non-GAAP financial measures should be considered in addition to, but not as a substitute for, measures for financial performance prepared in accordance with GAAP that are presented in this release. We believe these non-GAAP financial measures to be important measures for evaluating the relative significance of our financial information used by equity analysts and investors.
Forward-Looking Statements
The statements and information contained in this press release that are not statements of historical fact, including any estimates and assumptions contained herein, are “forward looking statements” as defined in Section 27A of the Securities Act of 1933, as amended, referred to as the Securities Act, and Section 21E of the Securities Exchange Act of 1934, as amended, referred to as the Exchange Act. These forward-looking statements include, among others, statements, estimates and assumptions relating to our business and growth strategies, our oil and gas reserve estimates, our ability to successfully and economically explore for and develop oil and gas resources, our exploration and development prospects, future inventories, projects and programs, expectations relating to availability and costs of drilling rigs and field services, anticipated trends in our business or industry, our future results of operations, our liquidity and ability to finance our exploration and development activities and our midstream activities, market conditions in the oil and gas industry and the impact of environmental and other governmental regulation. In addition, with respect to any pending acquisitions described herein, forward-looking statements include, but are not limited to, statements regarding the expected timing of the completion of the proposed transactions; the ability to complete the proposed transactions considering the various closing conditions; the benefits of such transactions and their impact on the Company’s business; and any statements of assumptions underlying any of the foregoing. In addition, if and when any proposed transaction is consummated, there will be risks and uncertainties related to the Company’s ability to successfully integrate the operations and employees of the Company and the acquired business. Forward-looking statements generally can be identified by the use of forward-looking terminology such as “may”, “will”, “could”, “should”, “expect”, “intend”, “estimate”, “anticipate”, “believe”, “project”, “pursue”, “plan” or “continue” or the negative thereof or variations thereon or similar terminology.
These forward-looking statements are subject to numerous assumptions, risks, and uncertainties. Factors that may cause our actual results, performance, or achievements to be materially different from those anticipated in forward-looking statements include, among others, the following: adverse economic conditions in the United States, Canada and globally; difficult and adverse conditions in the domestic and global capital and credit markets; changes in domestic and global demand for oil and natural gas; volatility in the prices we receive for our oil and natural gas; the effects of government regulation, permitting and other legal requirements; future developments with respect to the quality of our
properties, including, among other things, the existence of reserves in economic quantities; uncertainties about the estimates of our oil and natural gas reserves; our ability to increase our production and oil and natural gas income through exploration and development; our ability to successfully apply horizontal drilling techniques; the effects of increased federal and state regulation, including regulation of the environmental aspects, of hydraulic fracturing; the number of well locations to be drilled, the cost to drill and the time frame within which they will be drilled; drilling and operating risks; the availability of equipment, such as drilling rigs and transportation pipelines; changes in our drilling plans and related budgets; regulatory, environmental and land management issues, and demand for gas gathering services, relating to our midstream operations; and the adequacy of our capital resources and liquidity including, but not limited to, access to additional borrowing capacity.
These factors are in addition to the risks described in the “Risk Factors” and “Management’s Discussion and Analysis of Financial Condition and Results of Operations” sections of the Company’s 2011 annual report on Form 10-K filed with the Securities and Exchange Commission, which we refer to as the SEC, on February 29, 2012. Most of these factors are difficult to anticipate and beyond our control. Because forward-looking statements are subject to risks and uncertainties, actual results may differ materially from those expressed or implied by such statements. You are cautioned not to place undue reliance on forward-looking statements contained herein, which speak only as of the date of this document. Other unknown or unpredictable factors may cause actual results to differ materially from those projected by the forward-looking statements. Unless otherwise required by law, we undertake no obligation to publicly update or revise any forward-looking statements, whether as a result of new information, future events or otherwise. We urge readers to review and consider disclosures we make in our reports that discuss factors germane to our business. See in particular our reports on Forms 10-K, 10-Q and 8-K subsequently filed from time to time with the SEC. All forward-looking statements attributable to us are expressly qualified in their entirety by these cautionary statements.
Magnum Hunter Contact: Gabe Scott
Assistant Vice President - Corporate Development and Assistant Treasurer
ir@magnumhunterresources.com
(832) 203-4539
Production and Commodity Pricing
| Three Months Ended | Twelve Months Ended | |||||||||||||||
| December 31, | December 31, | |||||||||||||||
| 2011 | 2010 | 2011 | 2010 | |||||||||||||
| Production |
||||||||||||||||
| Oil (MBbls) |
279 | 91 | 776 | 316 | ||||||||||||
| Gas (MMcfs) |
3,149 | 233 | 6,855 | 952 | ||||||||||||
| NGL (MBbls) |
36 | 0 | 93 | 0 | ||||||||||||
| Total (MBoe) |
839 | 130 | 2,011 | 475 | ||||||||||||
| Total (Boe/d) |
9,124 | 1,410 | 5,510 | 1,301 | ||||||||||||
| Average prices |
||||||||||||||||
| Oil (per Bbl) |
$ | 92.46 | $ | 76.89 | $ | 90.32 | $ | 72.41 | ||||||||
| Gas (per Mcf) |
$ | 4.19 | $ | 4.62 | $ | 4.59 | $ | 5.07 | ||||||||
| NGL (per Bbl) |
$ | 48.85 | N/A | $ | 51.30 | N/A | ||||||||||
| Total average price (per Boe) |
$ | 48.50 | $ | 62.18 | $ | 52.84 | $ | 58.37 | ||||||||
| LOE - $/Boe |
$ | 11.71 | $ | 20.15 | $ | 13.46 | $ | 21.90 | ||||||||
| Recurring G&A - $/Boe |
$ | 10.04 | $ | 38.63 | $ | 13.36 | $ | 34.43 | ||||||||
2011 and Recent Accomplishments
Eagle Ford
Completed and commenced to production on 10 gross (4.8 net) wells
Average 24-hour IP rate of 1,339 Boepd, with two wells over 2,000 Boepd
Average lateral length of 5,650 / Average number of frac stages of 19
Appalachia
Completed and commenced to production on 10 gross (9.5 net) Marcellus wells
Average 24-hour IP rate of 9,300 Mcfepd
Average lateral length of 4,675 / Average number of frac stages of 15
Williston Basin
Completed and commenced to production 4 gross (4 net) operated wells in Tableland
Completed and commenced to production 40 gross (3.6 net) wells in North Dakota
Recent Tableland 24-hour IP rates have increased 100%, with recent wells averaging 590 Boepd
Restored all weather related shut-in production
Eureka Hunter Pipeline
Completed 36 miles of pipeline completed in 2011 (To-date 45 miles of pipeline has been completed)
Currently gathering approximately 60,000 Mcfpd
Gas processing initiative closed with Markwest Liberty Midstream & Resources, LLC
Financial
Final funding of $100 million in Series C Perpetual Preferred Stock on 1/11/2011
Closing of initial $20 million public offering of 8.0% Series D Preferred Stock on 3/21/2011
Over $100 million of Series D Preferred Stock raised through 2/28/2012
Established new $250 million Senior Secured Revolving Credit Facility – Current borrowing base of $235 million
Borrowing base increased six times since beginning of 2011 through 2/28/2012
New $150 million Credit Facility for Eureka Hunter Pipeline completed on 8/17/2011
Credit facilities expanded to include $100 million Term Loan completed on 9/29/2011
Acquisitions/Joint Ventures
Closed second phase of PostRock acquisition for $13.3 million on 1/14/2011
Closed third phase of PostRock acquisition for $4.9 million on 6/16/2011
Closed acquisition of $20 million of Marcellus Shale properties on 4/7/2011
Closed acquisition of NGAS Resources for $124.5 million on 4/13/2011
Closed acquisition of NuLoch Resources for $430.5 million on 5/3/2011
Closed joint exploration agreement with Stone Energy Corp. in the Marcellus Shale on 12/12/2011
Closed acquisition of $25 million of Utica Shale properties on 2/17/2012
MAGNUM HUNTER RESOURCES CORPORATION
UNAUDITED CONDENSED CONSOLIDATED BALANCE SHEETS
(in thousands, except shares and per-share data)
| December 31, 2011 |
December 31, 2010 |
|||||||
| ASSETS | ||||||||
| CURRENT ASSETS: |
||||||||
| Cash and cash equivalents |
$ | 14,851 | $ | 554 | ||||
| Accounts receivable |
50,476 | 11,705 | ||||||
| Derivative assets |
5,732 | 867 | ||||||
| Prepaids and other current assets |
6254 | |||||||
|
|
|
|
|
|||||
| Total current assets |
77,313 | 13,126 | ||||||
|
|
|
|
|
|||||
| PROPERTY AND EQUIPMENT (Net of Accumulated Depletion and Depreciation): |
||||||||
| Oil and natural gas properties, successful efforts accounting |
962,965 | 189,912 | ||||||
| Gas gathering and other equipment |
115,541 | 42,689 | ||||||
|
|
|
|
|
|||||
| Total property and equipment, net |
1,078,506 | 232,601 | ||||||
|
|
|
|
|
|||||
| OTHER ASSETS: |
||||||||
| Deferred financing costs, net of amortization of $958 and $1,237 respectively |
10,642 | 2,678 | ||||||
| Other assets |
1943 | 562 | ||||||
|
|
|
|
|
|||||
| Total assets |
$ | 1,168,404 | $ | 248,967 | ||||
|
|
|
|
|
|||||
| LIABILITIES AND SHAREHOLDERS’ EQUITY | ||||||||
| CURRENT LIABILITIES: |
||||||||
| Current portion of notes payable |
$ | 4,681 | $ | 7,132 | ||||
| Accounts payable |
139,052 | 33,319 | ||||||
| Accrued liabilities |
5,656 | 435 | ||||||
| Revenue payable |
10,781 | 2,630 | ||||||
| Derivatives and other current liabilities |
7,149 | 719 | ||||||
|
|
|
|
|
|||||
| Total current liabilities |
167,319 | 44,235 | ||||||
|
|
|
|
|
|||||
| OTHER LIABILITIES: |
||||||||
| Notes payable, less current portion |
286,064 | 26,019 | ||||||
| Asset retirement obligation |
20,116 | 4,455 | ||||||
| Deferred tax liability |
95,299 | — | ||||||
| Derivatives and other long term liabilities |
8,954 | 700 | ||||||
|
|
|
|
|
|||||
| Total liabilities |
577,752 | 75,409 | ||||||
|
|
|
|
|
|||||
| COMMITMENTS AND CONTINGENCIES (Note 14) |
||||||||
| REDEEMABLE PREFERRED STOCK: |
||||||||
| Series C Cumulative Perpetual Preferred Stock, cumulative dividend rate 10.25% per annum, 4,000,000 authorized, 4,000,000 and 2,809,456 issued & outstanding as of December 31, 2011 and December 31, 2010, respectively, with liquidation preference of $25.00 per share |
100,000 | 70,236 | ||||||
|
|
|
|
|
|||||
| SHAREHOLDERS’ EQUITY: |
||||||||
| Preferred Stock, 10,000,000 shares authorized: |
— | — | ||||||
| Series D Cumulative Perpetual Preferred Stock, cumulative dividend rate 8.0% per annum, 5,750,000 authorized, 1,437,558 and none issued & outstanding as of December 31, 2011 and December 31, 2010, respectively, with liquidation preference of $50.00 per share |
71,878 | — | ||||||
| Common stock, $0.01 par value; 250,000,000 shares authorized, 130,270,295 and 74,863,135 shares issued and 129,803,374 and 74,863,135 oustanding as of December 31, 2011 and 2010, respectively |
1,298 | 749 | ||||||
| Exchangeable common stock, par value $0.01 per share, 3,693,871 and none issued & outstanding as of December 31, 2011 and 2010, respectively |
37 | — | ||||||
| Additional paid in capital |
569,690 | 152,439 | ||||||
| Accumulated deficit |
(140,070 | ) | (49,402 | ) | ||||
| Accumulated other comprehensive income |
(12,463 | ) | — | |||||
| Treasury stock at cost, 761,652 shares |
(1,310 | ) | (1,310 | ) | ||||
| Unearned common stock in KSOP at cost, 153,300 shares |
(604 | ) | (604 | ) | ||||
|
|
|
|
|
|||||
| Total Magnum Hunter Resources Corporation shareholders’ equity |
488,456 | 101,872 | ||||||
| Non-controlling interest |
2,196 | 1,450 | ||||||
|
|
|
|
|
|||||
| Total shareholders’ equity |
490,652 | 103,322 | ||||||
|
|
|
|
|
|||||
| Total liabilities and shareholders’ equity |
$ | 1,168,404 | $ | 248,967 | ||||
|
|
|
|
|
|||||
MAGNUM HUNTER RESOURCES CORPORATION
UNAUDITED CONDENSED CONSOLIDATED STATEMENTS OF OPERATIONS
(in thousands, except shares and per-share data)
| Year Ended December 31, | ||||||||||||
| 2011 | 2010 | 2009 | ||||||||||
| REVENUE: |
||||||||||||
| Oil and gas sales |
$ | 106,266 | $ | 27,715 | $ | 6,607 | ||||||
| Field operations and other |
22,912 | 5,009 | 237 | |||||||||
|
|
|
|
|
|
|
|||||||
| Total revenue |
129,178 | 32,724 | 6,844 | |||||||||
|
|
|
|
|
|
|
|||||||
| EXPENSES: |
||||||||||||
| Lease operating expenses |
27,067 | 10,399 | 3,879 | |||||||||
| Severance taxes and marketing |
7,475 | 2,305 | 500 | |||||||||
| Exploration |
1,537 | 936 | 790 | |||||||||
| Field operations |
16,938 | 4,363 | — | |||||||||
| Impairment of unproved oil & gas properties |
1,108 | — | — | |||||||||
| Impairment of proved oil & gas properties |
21,792 | 306 | 634 | |||||||||
| Depreciation, depletion and accretion |
49,090 | 8,923 | 3,168 | |||||||||
| General and administrative |
63,561 | 24,901 | 8,490 | |||||||||
|
|
|
|
|
|
|
|||||||
| Total expenses |
188,568 | 52,133 | 17,461 | |||||||||
|
|
|
|
|
|
|
|||||||
| OPERATING LOSS |
(59,390 | ) | (19,409 | ) | (10,617 | ) | ||||||
| OTHER INCOME (EXPENSE): |
||||||||||||
| Interest income |
27 | 61 | 1 | |||||||||
| Interest expense |
(12,005 | ) | (3,594 | ) | (2,691 | ) | ||||||
| Gain (loss) on derivative contracts |
(6,346 | ) | 814 | (2,325 | ) | |||||||
| Other |
606 | — | — | |||||||||
|
|
|
|
|
|
|
|||||||
| Total other income and expense |
(17,718 | ) | (2,719 | ) | (5,015 | ) | ||||||
| Loss from continuing operations before non-controlling interest |
(77,108 | ) | (22,128 | ) | (15,632 | ) | ||||||
| Income tax benefit |
696 | — | — | |||||||||
| Net income attributable to non-controlling interest |
(249 | ) | (129 | ) | 63 | |||||||
|
|
|
|
|
|
|
|||||||
| Net loss attributable to Magnum Hunter Resources Corporation from continuing operations |
(76,661 | ) | (22,257 | ) | (15,569 | ) | ||||||
| Income from discontinued operations |
— | 8,457 | 445 | |||||||||
|
|
|
|
|
|
|
|||||||
| Net loss |
(76,661 | ) | (13,800 | ) | (15,124 | ) | ||||||
| Dividend on Preferred Stock |
(14,007 | ) | (2,467 | ) | (26 | ) | ||||||
|
|
|
|
|
|
|
|||||||
| Net loss attributable to common shareholders |
$ | (90,668 | ) | $ | (16,267 | ) | $ | (15,150 | ) | |||
|
|
|
|
|
|
|
|||||||
| Weighted average number of common shares outstanding |
||||||||||||
| Basic and diluted |
113,154,270 | 63,921,525 | 38,953,834 | |||||||||
|
|
|
|
|
|
|
|||||||
| Net loss from continuing operations |
$ | (0.80 | ) | $ | (0.38 | ) | $ | (0.40 | ) | |||
|
|
|
|
|
|
|
|||||||
| Net income from discontinued operations |
$ | — | $ | 0.13 | $ | 0.01 | ||||||
|
|
|
|
|
|
|
|||||||
| Net loss per common share, basic and diluted |
$ | (0.80 | ) | $ | (0.25 | ) | $ | (0.39 | ) | |||
|
|
|
|
|
|
|
|||||||
MAGNUM HUNTER RESOURCES CORPORATION
UNAUDITED CONDENSED CONSOLIDATED STATEMENTS OF CASH FLOWS
(in thousands)
| Year Ended December 31, | ||||||||||||
| 2011 | 2010 | 2009 | ||||||||||
| Cash flows from operating activities |
||||||||||||
| Net loss |
$ | (76,661 | ) | $ | (13,800 | ) | $ | (15,124 | ) | |||
| Adjustments to reconcile net loss to net cash provided by (used in) operating activities: |
||||||||||||
| Noncontrolling Interest |
249 | 129 | (63 | ) | ||||||||
| Depletion, depreciation, and accretion |
49,090 | 10,346 | 4,500 | |||||||||
| Share-based compensation |
25,057 | 6,379 | 3,091 | |||||||||
| Asset impairment |
22,900 | 306 | 634 | |||||||||
| Cash paid for plugging wells |
(8 | ) | — | — | ||||||||
| Exploratory costs |
— | — | 647 | |||||||||
| Gain on sale of assets |
(185 | ) | (6,731 | ) | (14 | ) | ||||||
| Unrealized (gain) loss on derivative contracts |
4,210 | 3,063 | 7,700 | |||||||||
| Amortization of deferred financing cost included in interest expense |
3,636 | 1,201 | 1,234 | |||||||||
| Deferred taxes |
(696 | ) | — | — | ||||||||
| Changes in operating assets and liabilities: |
||||||||||||
| Accounts receivable and accrued revenue |
(25,075 | ) | (2,949 | ) | (1,909 | ) | ||||||
| Inventory |
(3,889 | ) | — | — | ||||||||
| Prepaid expenses and other current assets |
(124 | ) | 134 | (16 | ) | |||||||
| Accounts payable |
25,883 | 8,866 | 1,571 | |||||||||
| Revenue payable |
6,979 | 359 | 343 | |||||||||
| Accrued liabilities |
2,473 | (8,470 | ) | 779 | ||||||||
|
|
|
|
|
|
|
|||||||
| Net cash provided by operating activities |
33,839 | (1,167 | ) | 3,373 | ||||||||
|
|
|
|
|
|
|
|||||||
| Cash flows from investing activities |
||||||||||||
| Capital expenditures and advances |
(291,942 | ) | (80,078 | ) | (14,602 | ) | ||||||
| Net cash paid in acquisition, net of cash received of $2,500; $0; and $235, respectively |
(78,524 | ) | (59,500 | ) | 235 | |||||||
| Change in restricted cash and deposits |
42 | 59 | (56 | ) | ||||||||
| Proceeds from sales of assets |
8,708 | 21,238 | 500 | |||||||||
| Purchase of derivatives |
— | — | (2,701 | ) | ||||||||
|
|
|
|
|
|
|
|||||||
| Net cash used in investing activities |
(361,716 | ) | (118,281 | ) | (16,624 | ) | ||||||
|
|
|
|
|
|
|
|||||||
| Cash flows from financing activities |
||||||||||||
| Net proceeds from sale of common stock and warrants |
13,892 | 38,678 | 14,095 | |||||||||
| Net proceeds from sale of preferred shares |
94,764 | 63,444 | 4,956 | |||||||||
| Proceeds from exercise of warrants and options |
7,618 | 16,231 | — | |||||||||
| Purchase of company shares and loan to KSOP |
— | (604 | ) | — | ||||||||
| Options surrendered for cash |
— | (116 | ) | — | ||||||||
| Preferred stock dividends paid |
(14,007 | ) | (2,492 | ) | — | |||||||
| Principal repayments of debt |
(242,472 | ) | (84,886 | ) | (34,194 | ) | ||||||
| Proceeds from borrowings on debt |
493,906 | 101,581 | 25,718 | |||||||||
| Payment on payable on sale of partnership |
— | — | (113 | ) | ||||||||
| Payment of deferred financing costs |
(11,577 | ) | (2,866 | ) | (1,049 | ) | ||||||
| Cash paid upon conversion of Series B preferred stock |
— | (11,250 | ) | — | ||||||||
| Change in other long-term liabilities |
69 | — | — | |||||||||
|
|
|
|
|
|
|
|||||||
| Net cash provided by financing activities |
342,193 | 117,720 | 9,413 | |||||||||
|
|
|
|
|
|
|
|||||||
| Effect of exchange rate changes on cash |
(19 | ) | — | — | ||||||||
|
|
|
|
|
|
|
|||||||
| Net increase (decrease) in cash and cash equivalents |
14,297 | (1,728 | ) | (3,838 | ) | |||||||
| Cash and cash equivalents, beginning of period |
554 | 2,282 | 6,120 | |||||||||
|
|
|
|
|
|
|
|||||||
| Cash and cash equivalents, end of period |
$ | 14,851 | $ | 554 | $ | 2,282 | ||||||
|
|
|
|
|
|
|
|||||||
| Supplemental disclosure of cash flow information |
||||||||||||
| Cash paid for interest |
$ | 7,952 | $ | 2,749 | $ | 2,142 | ||||||
|
|
|
|
|
|
|
|||||||
| Non-cash transactions |
||||||||||||
| Common stock issued for acquisitions |
$ | 345,537 | $ | 17,093 | $ | 2,685 | ||||||
|
|
|
|
|
|
|
|||||||
| Series B Preferred stock issued for acquisition of Triad |
$ | — | $ | 14,982 | $ | — | ||||||
|
|
|
|
|
|
|
|||||||
| Debt assumed in acquisitions |
$ | 71,895 | $ | 3,412 | $ | — | ||||||
|
|
|
|
|
|
|
|||||||
| Common stock issued for payment of services |
$ | 779 | $ | 165 | $ | — | ||||||
|
|
|
|
|
|
|
|||||||
| Common stock issued in conversion of Series C Convertible Preferred Stock |
$ | — | $ | 3,732 | $ | — | ||||||
|
|
|
|
|
|
|
|||||||
| Accrued capital expenditures |
$ | 81,136 | $ | 23,218 | $ | — | ||||||
|
|
|
|
|
|
|
|||||||
| Exchangeable common stock issued for acquisition of NuLoch Resources |
$ | 31,642 | $ | — | $ | — | ||||||
|
|
|
|
|
|
|
|||||||
| Warrants issued for payment of common stock dividends |
$ | 6,695 | $ | — | $ | — | ||||||
|
|
|
|
|
|
|
|||||||
| Warrants issued for payment of dividends on MHR Exchangeco Corporation exchangeable shares |
$ | 197 | $ | — | $ | — | ||||||
|
|
|
|
|
|
|
|||||||
Recurring Loss per Common Share
| ($ in thousands) | Three Months Ended December 31, 2011 |
Twelve Months Ended December 31, 2011 |
||||||
| Net loss attributable to common shareholders - reported |
($60,922 | ) | ($90,668 | ) | ||||
| Non-recurring and non-cash items: |
||||||||
| Exploration expense |
$ | 530 | $ | 1,537 | ||||
| Impairment of oil & gas properties |
$ | 22,900 | $ | 22,900 | ||||
| Non-Cash: write-off of deferred financing costs |
$ | 0 | $ | 2,300 | ||||
| Non-Cash: stock compensation expense |
$ | 5,136 | $ | 25,057 | ||||
| Non-Cash: compensation accrual |
$ | 864 | $ | 370 | ||||
| Non-recurring acquisition and other expense |
$ | 2,045 | $ | 11,636 | ||||
| Unrealized (gain) loss on derivatives |
$ | 21,431 | $ | 4,210 | ||||
| (Gain) Loss on Sale of Assets |
$ | 501 | ($185 | ) | ||||
| Non-recurring LOE |
$ | 488 | $ | 1,533 | ||||
|
|
|
|
|
|||||
| Total non-recurring and non-cash items |
$ | 53,897 | $ | 69,358 | ||||
| Net loss attributable to common shareholders - recurring |
($7,025 | ) | ($21,309 | ) | ||||
EBITDAX Reconciliation
| Three Months Ended December 31, |
Twelve Months Ended December 31, |
|||||||||||||||
| ($ in thousands) | 2011 | 2010 | 2011 | 2010 | ||||||||||||
| Net income (loss) from continuing operations |
($56,932 | ) | ($7,555 | ) | ($76,661 | ) | ($22,257 | ) | ||||||||
| Net interest expense |
$ | 5,017 | $ | 918 | $ | 12,005 | $ | 3,594 | ||||||||
| Loss (Gain) on sale of assets |
$ | 501 | ($71 | ) | ($185 | ) | ($71 | ) | ||||||||
| Depletion, Depreciation & Amortization |
$ | 20,262 | $ | 3,035 | $ | 49,090 | $ | 8,923 | ||||||||
| Impairment of oil and gas properties |
$ | 22,900 | $ | 286 | $ | 22,900 | $ | 306 | ||||||||
| Exploration expense |
$ | 530 | $ | 239 | $ | 1,537 | $ | 936 | ||||||||
| Non-Cash Stock Comp. expense |
$ | 5,136 | $ | 1,175 | $ | 25,057 | $ | 6,326 | ||||||||
| Non-recurring acquisition and other expense |
$ | 2,045 | $ | 810 | $ | 11,636 | $ | 2,225 | ||||||||
| Non-recurring LOE |
$ | 488 | $ | 169 | $ | 1,533 | $ | 1,178 | ||||||||
| Income tax benefit |
($226 | ) | $ | 0 | ($696 | ) | $ | 0 | ||||||||
| Unrealized loss (gain) on derivatives |
$ | 21,431 | $ | 1,882 | $ | 4,210 | $ | 3,063 | ||||||||
|
|
|
|
|
|
|
|
|
|||||||||
| Total EBITDAX |
$ | 21,153 | $ | 888 | $ | 50,428 | $ | 4,223 | ||||||||
|
|
|
|
|
|
|
|
|
|||||||||
Recurring G&A Reconciliation
| Three Months Ended December 31, |
Twelve Months Ended December 31, |
|||||||||||||||
| 2011 | 2010 | 2011 | 2010 | |||||||||||||
| Total G&A |
$ | 15,607 | $ | 6,998 | $ | 63,561 | $ | 24,901 | ||||||||
| Adjustments: |
||||||||||||||||
| Non-cash stock compensation |
$ | 5,136 | $ | 1,175 | $ | 25,057 | $ | 6,326 | ||||||||
| Acquisition and other non-recurring expense |
$ | 2,045 | $ | 810 | $ | 11,636 | $ | 2,225 | ||||||||
|
|
|
|
|
|
|
|
|
|||||||||
| Recurring G&A |
$ | 8,426 | $ | 5,013 | $ | 26,867 | $ | 16,350 | ||||||||