Attached files
| file | filename |
|---|---|
| 8-K - 8-K - RETAIL PROPERTIES OF AMERICA, INC. | a12-5954_18k.htm |
| EX-99.1 - EX-99.1 - RETAIL PROPERTIES OF AMERICA, INC. | a12-5954_1ex99d1.htm |
Exhibit 99.2
|
|
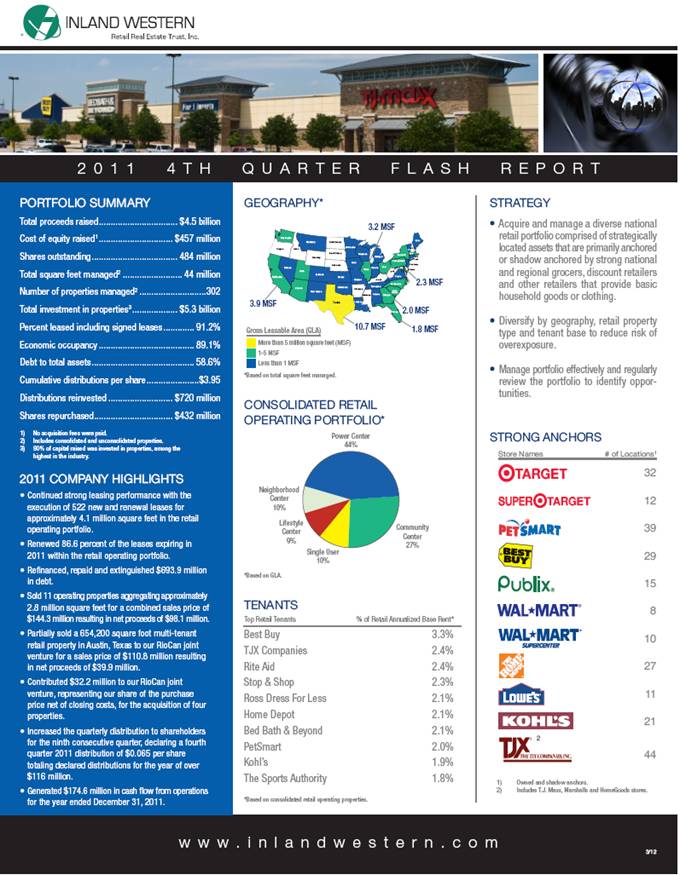
2 0 1 1 4 T H Q U A R T E R F L A S H R E P O R T PORTFOLIO SUMMARY Total proceeds raised $4.5 billion Cost of equity raised1 $457 million Shares outstanding 484 million Total square feet managed2 44 million Number of properties managed2 302 Total investment in properties3 $5.3 billion Percent leased including signed leases 91.2% Economic occupancy 89.1% Debt to total assets 58.6% Cumulative distributions per share $3.95 Distributions reinvested $720 million Shares repurchased $432 million 2011 COMPANY HIGHLIGHTS • Continued strong leasing performance with the execution of 522 new and renewal leases for approximately 4.1 million square feet in the retail operating portfolio. • Renewed 86.6 percent of the leases expiring in 2011 within the retail operating portfolio. • Refinanced, repaid and extinguished $693.9 million in debt. • Sold 11 operating properties aggregating approximately 2.8 million square feet for a combined sales price of $144.3 million resulting in net proceeds of $98.1 million. • Partially sold a 654,200 square foot multi-tenant retail property in Austin, Texas to our RioCan joint venture for a sales price of $110.8 million resulting in net proceeds of $39.9 million. • Contributed $32.2 million to our RioCan joint venture, representing our share of the purchase price net of closing costs, for the acquisition of four properties. • Increased the quarterly distribution to shareholders for the ninth consecutive quarter, declaring a fourth quarter 2011 distribution of $0.065 per share totaling declared distributions for the year of over $116 million. • Generated $174.6 million in cash flow from operations for the year ended December 31, 2011. 1) No acquisition fees were paid. 2) Includes consolidated and unconsolidated properties. 3) 90% of capital raised was invested in properties, among the highest in the industry. STRATEGY Acquire and manage a diverse national retail portfolio comprised of strategically located assets that are primarily anchored or shadow anchored by strong national and regional grocers, discount retailers and other retailers that provide basic household goods or clothing. Diversify by geography, retail property type and tenant base to reduce risk of overexposure. Manage portfolio effectively and regularly review the portfolio to identify opportunities. STRONG ANCHORS 32 12 39 29 15 8 10 27 11 21 44 Store Names # of Locations1 1) Owned and shadow anchors. 2) Includes T.J. Maxx, Marshalls and HomeGoods stores. 2 Best Buy 3.3% TJX Companies 2.4% Rite Aid 2.4% Stop & Shop 2.3% Ross Dress For Less 2.1% Home Depot 2.1% Bed Bath & Beyond 2.1% PetSmart 2.0% Kohl’s 1.9% The Sports Authority 1.8% Top Retail Tenants % of Retail Annualized Base Rent* *Based on total square feet managed. *Based on consolidated retail operating properties. *Based on GLA. CONSOLIDATED RETAIL OPERATING PORTFOLIO* TENANTS GEOGRAPHY* 3/12 Washington Oregon Arizona New Mexico Texas Oklahoma Kansas Colorado Utah Nevada California Idaho Montana North Dakota South Dakota Nebraska Minnesota Iowa Missouri Arkansas Mississippi Alabama Louisiana Florida Georgia Tennessee Wisconsin Illinois Indiana Ohio Michigan entucky New Jersey New York Conn. R.I. Mass. N.H. Maine Wyoming Pennsylvania Virginia West Delaware Vt. Carolina North Carolina Virginia Md. South K 3.9 MSF 10.7 MSF 1.8 MSF 2.0 MSF 2.3 MSF 3.2 MSF Gross Leasable Area (GLA) More than 5 million square feet (MSF) 1-5 MSF Less than 1 MSF Community Center 27% Neighborhood Center 10% Power Center 44% Lifestyle Center 9% Single User 10% w w w . i n l a n d w e s t e r n . c o m |
|
|
|
|
|
The Inland name and logo are registered trademarks being used under license. “Inland” refers to some or all of the entities that are part of The Inland Real Estate Group of Companies, Inc., a company that is comprised of separate legal entities, some of which may be subsidiaries of the same entity, affiliates of each other, share some common ownership or were previously sponsored by Inland Real Estate Investment Corporation. The companies depicted in the photographs and logos herein may have proprietary interests in their trade names and trademarks and nothing herein shall be considered to be an endorsement, authorization or approval of Inland Western Retail Real Estate Trust, Inc. by the companies. Further, none of these companies are affiliated with Inland Western Retail Real Estate Trust, Inc. in any manner other than being a tenant in properties owned by Inland Western Retail Real Estate Trust, Inc. 2901 BUTTERFIELD ROAD OAK BROOK, IL 60523 www.inlandwestern.com CONTACT Inland Western Investor Relations ir@inland-western.com 800.541.7661 R INLAND WESTERN Retail Real Estate Trust, Inc. CONSOLIDATED RETAIL OPERATING PROPERTIES LEASE EXPIRATION SCHEDULE1 AWARD WINNING MARKETING PROGRAMS BENEFIT RETAILERS AND CONSUMERS Inland Western’s marketing team partners with retailers and community groups to create one of a kind marketing programs that drive traffic, enhance retail sales and make an impact on the community. The marketing team was recognized by the International Council of Shopping Centers with 5 US MAXI Awards for its innovative events and programs in 2010. Inland Western has won 12 MAXI Awards in the last two years. CASH FLOW HISTORY AND DISTRIBUTIONS 1) Funds from Operations is a non-GAAP measure, and is calculated as follows: 3 Mo. Ended 3 Mo. Ended 3 Mo. Ended 3 Mo. Ended 12/31/11 9/30/11 6/30/11 3/31/11 Net loss attributable to Company shareholders $ (13,837) $ (5,023) $ (13,724) $ (40,025) Add: Deprection and amortization 61,797 63,549 64,389 65,447 Add: Provision for impairment of investment properties 8,288 1,379 1,523 32,747 Less: Gain on sales of investment properties (7,566) (13,626) (6,104) (6,119) Less: Noncontrolling interests’ share of depreciation related to consolidated joint ventures (178) (132) (96) (584) Funds from operations $ 48,504 $ 46,147 $ 48,988 $ 51,466 Safe Harbor Statement Forward-looking statements are statements that are not historical including statements regarding management’s intentions, beliefs, expectations, representations, plans or predictions of the future, and are typically identified by such words as “believe,” “expect,” “anticipate,” “intend,” “estimate,” “may,” “will,” “should” and “could.” The Company intends that such forward-looking statements be subject to the safe harbors created by section 27A of the Securites Act of 1933 and Section 21E of the Securites Exchange Act of 1934. There are numerous risks and uncertainties that could cause actual results to differ materially from those set forth in the forward-looking statements. For a more complete discussion of these risks and uncertainties, please see the company’s Annual Report on Form 10-K and each Quarterly Report filed on Form 10-Q. Inland Western Retail Real Estate Trust, Inc. disclaims any intention or obligation to update or revise any forward-looking statements whether as a result of new information or future events. Over 37,253 fans and followers receive regular information regarding events, special offers and giveaways, which drive retail sales. DISTRIBUTION HISTORY Since inception, the company has paid gross distributions of $1.4 billion. Yield based on the last published estimated valuation for each time period. 2.5% 2.6% 7.5% 6.4% 6.4% 6.4% 6.6% 6.0% 3.5% Cash Flows From Operations Gross Distributions 1) Excludes month-to-month leases. (Square Feet) Multi-Tenant Single Tenant 5.4% Average 7.7% 3.7% 7.2% 9.2% 11.0% 8.9% 13.3% 6.7% 6.2% 5.1% MORTGAGE DEBT MATURITY SCHEDULE Debt maturities represent amounts due at maturity, which have been reduced by regularly scheduled monthly amortization payments and exclude net mortgage premium of $10.9 million and net mortgage discount of $2.0 million as of 12/31/11. 1) Mortgage debt status is as of 2/22/12. The 2012 maturities include $51.8 million of mortgages payable that had matured as of 12/31/11. 2) Distributions for the quarter ended 9/30/11 were declared on 10/3/11. 3 Months 3 Months 3 Months 3 Months Ended Ended Ended Ended (in thousands) 12/31/11 9/30/11 6/30/11 3/31/11 Funds from Operations1 $ 48,504 $ 46,147 $ 48,988 $ 51,466 Cash Flow From Operations $ 46,220 $ 43,376 $ 53,156 $ 31,855 Distribitions Declared2 31,445 30,738 30,031 28,433 Excess $ 14,775 $ 12,638 $ 23,125 $ 3,422 Paid, Refinanced, Extended & Forgiven 20121 2013 2014 2015 $1,000,000 $800,000 $600,000 $400,000 $200,000 $0 Debt ($000s) Under Application / Unencumbered Pool Remaining to be Addressed |