Attached files
| file | filename |
|---|---|
| 8-K - FORM 8-K - GAIN Capital Holdings, Inc. | d307544d8k.htm |
| EX-99.1 - PRESS RELEASE - GAIN Capital Holdings, Inc. | d307544dex991.htm |
 4
th
Quarter and Full Year 2011
Financial and Operating Results
February 28, 2012
Exhibit 99.2 |
 Special Note Regarding Forward-Looking Information
In addition to historical information, this presentation contains
"forward-looking" statements that reflect management's
expectations for the future. A variety of important factors could cause
results to differ materially from such statements. These factors are noted
throughout GAIN Capital’s annual report on Form 10-K, as filed with the Securities
and Exchange Commission on March 30, 2011, and include, but are not limited to, the
actions of both current and potential new competitors, fluctuations in
market trading volumes, financial market volatility, evolving industry
regulations, errors or malfunctions in our systems or technology, rapid
changes in technology, effects of inflation, customer trading patterns, the
success of our products and service offerings, our ability to continue to
innovate and meet the demands of our customers for new or enhanced products, our
ability to successfully integrate assets and companies we have acquired, changes in
tax policy or accounting rules, fluctuations in foreign exchange rates,
adverse changes or volatility in interest rates, as well as general
economic, business, credit and financial market conditions, internationally
or nationally, and our ability to continue paying a quarterly dividend in
light of future financial performance and financing needs. The
forward-looking statements included herein represent GAIN Capital’s views
as of the date of this presentation. GAIN Capital undertakes no obligation
to revise or update publicly any forward-looking statement for any
reason unless required by law. 2 |
 Overview
Glenn Stevens, CEO |
 4
th
Quarter and FY 2011 Results Overview
4
•
Q4 2011 Financial Results
•
Net Revenue: $31.6 million
•
EBITDA
(1)
: ($3.1) million
•
Net Income: ($3.3) million
•
Adjusted Net Income
(2)
: ($1.6) million
•
FY 2011 Financial Summary
•
Net Revenue: $181.5 million
•
EBITDA
(1)
: $36.6 million (20.1% margin)
•
Net Income: $15.7 million (8.7% margin)
•
Adjusted Net Income
(2)
: $21.7 million (12.0% margin)
•
EPS (Diluted): $0.40
•
Adjusted EPS (Diluted)
(3)
: $0.56
•
Operating Metrics
(4)
•
Total trading volume up 62% to $2.5 trillion
•
Retail volume increased 19% to $1.6 trillion
•
Institutional volume increased 298% to $953.6 billion
•
Client assets up 21% to $310.4 million as of December 31, 2011
(Comparisons are referenced to FY 2010)
(1) EBITDA is a non-GAAP financial measure that represents our earnings
before interest, taxes, depreciation and amortization. A reconciliation of net income to EBITDA and EBITDA margin is available
in the appendix to this presentation.
(2) Adjusted net income is a non-GAAP financial measure that prior
to the closing of our initial public offering in December 2010 represented our net income/(loss) excluding the change in fair value of the
embedded derivative in our
preferred stock and purchase intangible amortization. With the consummation of our IPO, all outstanding shares of our preferred stock converted into common stock and in
2011 and in future periods adjusted net income no longer reflects an adjustment related to the embedded
derivative. A reconciliation of net income to adjusted net income and adjusted net income
margin is available in the appendix to this
presentation. (3) Reconciliation of EPS to adjusted EPS is available in
the appendix to this presentation. (4) Definitions for all our operating
metrics are available in the appendix to this presentation. |
 Recent
Developments – Retail
•
Launch of new German market offering
–
Fastest growing European market for Forex and CFD trading
•
New strategic partnerships
–
Asia, Middle East and North America
•
Continued momentum in mobile trading
–
412% year-over-year volume growth
–
Strong take-up of iPad app
•
14% of mobile volume in December, three months post-launch
5 |
 Recent
Developments – Institutional
•
Strategic Asian partnerships
–
Provide liquidity and credit & matching services to Asian exchange
–
Launch a new national electronic dealing service in China
•
Exclusive agreement with one of the largest independent energy
brokers for cross-distribution of energy and forex services
•
Product enhancement
–
Basket trading
–
Meta-bridge
–
Streaming Non-Deliverable Forwards (NDF)
6 |
 2011
FY Highlights Retail
•
–
China
regulatory
approval,
new
office
in
Beijing,
Korea
partnerships,
growth
in
Japan,
enhanced Middle East
offering and presence
•
Transparency Initiatives
–
Introduced Monthly Execution Scorecard
–
Enhanced with 3rd party Pricing Comparison
•
Product Enhancements
–
Expanded mobile offering (iPhone, iPad and Android), new FOREXTrader Pro active
trader platform and broadened CFD offering (commodities, global
indices) •
Acquisition
–
dbFX (Deutsche Bank’s retail FX business)
Institutional
•
Momentum
–
298% year-over-year trading volume increase
•
Service Enhancements
–
GTX Direct offering, Agency Execution Desk
•
Product Enhancements
–
Metals & NDF Trading
7
Global Expansion |
 Financial and Operating Metric Review
Daryl Carlough, Interim CFO |
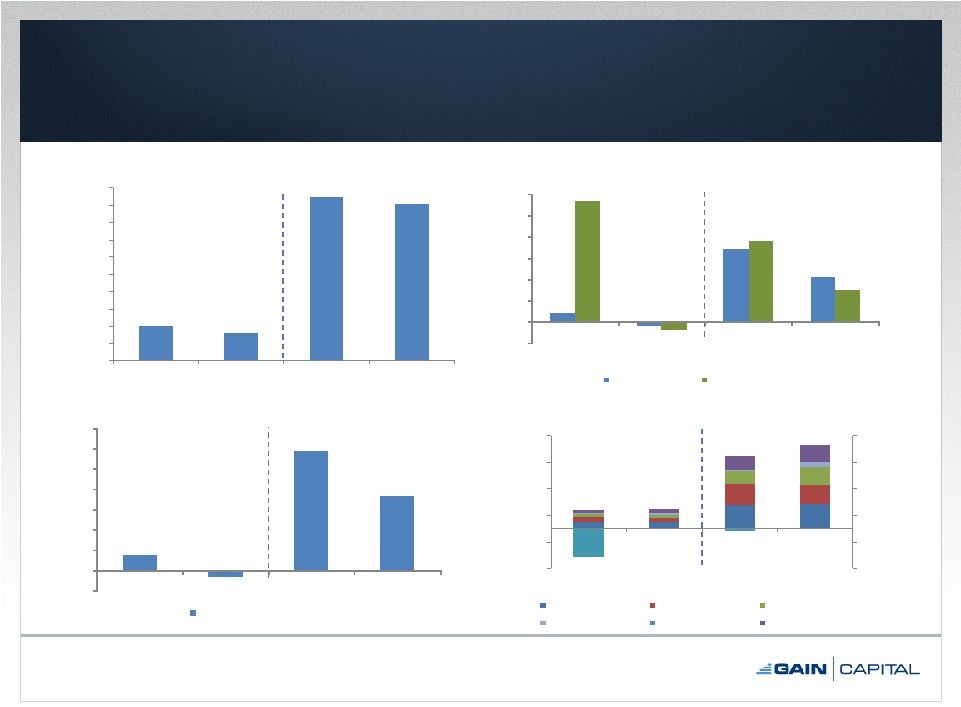 ($17.7)
$38.3
$131.7
$158.2
($75.0)
($25.0)
$25.0
$75.0
$125.0
$175.0
($75.0)
($25.0)
$25.0
$75.0
$125.0
$175.0
2010
2011
2010
2011
Total Expenses
Comp & Benefits
Marketing
Trading
Purchase Intangible Amort.
Embedded Derivative
All Other
$40.9
$31.6
$189.1
$181.5
$0.0
$20.0
$40.0
$60.0
$80.0
$100.0
$120.0
$140.0
$160.0
$180.0
$200.0
2010
2011
2010
2011
Net Revenue
Financial Results
9
Q4
FY
Q4
FY
Q4
FY
Q4
FY
$7.2
($3.1)
$58.5
$36.6
($10.0)
$0.0
$10.0
$20.0
$30.0
$40.0
$50.0
$60.0
$70.0
2010
2011
2010
2011
EBITDA (Adjusted EBITDA in 2010)
(2)(3)
EBITDA/Adjusted EBITDA
$4.0
($1.6)
$33.9
$21.7
$56.8
($3.3)
$37.8
$15.7
(10.0)
-
10.0
20.0
30.0
40.0
50.0
60.0
2010
2011
2010
2011
GAAP & Adjusted Net Income
(1)
Adjusted Net Income
GAAP Net Income
Note: Dollars in millions.
(1) Reconciliation of net income to
adjusted net income available in appendix.
(2) Adjusted EBITDA is a non-GAAP
financial measure that prior to the closing of our initial public offering in December 2010 represented our earnings before interest, taxes, depreciation and amortization and
excluded the change in fair
value of the embedded derivative in our preferred stock. With the consummation of our IPO, all outstanding shares of our preferred stock converted into common stock. Accordingly,
in 2011 we no longer adjusted EBITDA for
the embedded derivative. A reconciliation of net income to adjusted EBITDA is available in the appendix to this presentation.
(3) EBITDA is a non-GAAP financial
measure that represents our earnings before interest, taxes, depreciation and amortization. A reconciliation of net income to EBITDA is available in the appendix to this
presentation. |
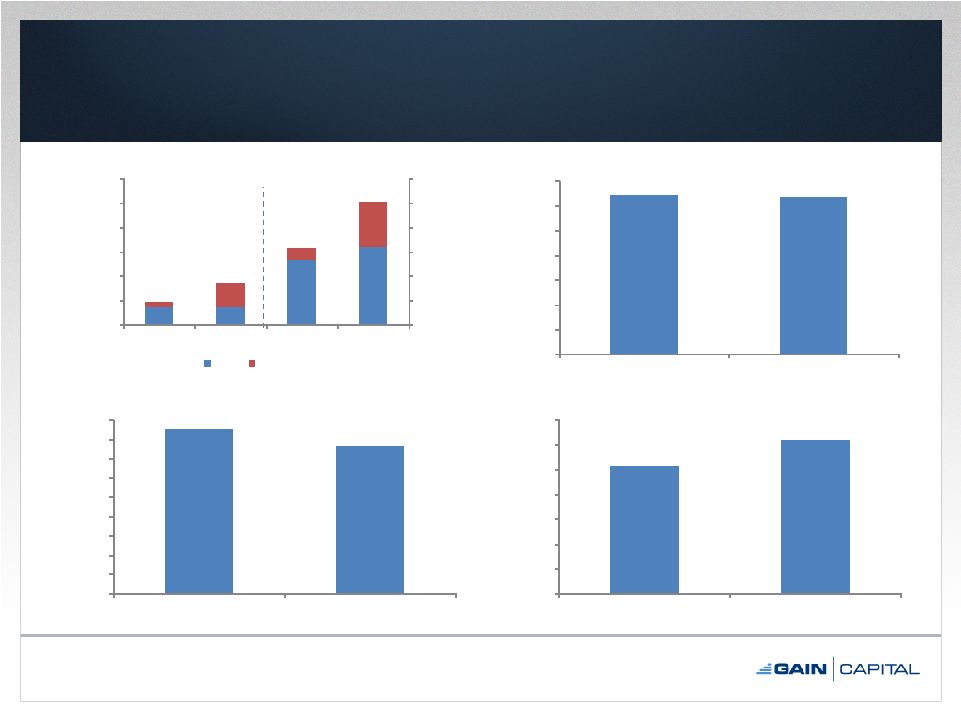 Operating Metrics
(1)
10
Note: Trading volume in billions. Client assets in millions.
(1)
Definitions for all our operating metrics are available in the appendix to this
presentation. (2)
For periods ending December 31.
(3)
As of December 31.
Q4
FY
Traded Retail Accounts
(2)
$366.3
$366.4
$1,324.8
$1,574.0
$103.9
$486.2
$239.3
$953.6
$470.2
$852.6
$1,564.1
$2,527.6
$0.0
$500.0
$1,000.0
$1,500.0
$2,000.0
$2,500.0
$3,000.0
$0.0
$500.0
$1,000.0
$1,500.0
$2,000.0
$2,500.0
$3,000.0
2010
2011
2010
2011
Retail
Institutional
Total
Trading
Volume
(2)
64,313
63,436
-
10,000
20,000
30,000
40,000
50,000
60,000
70,000
2010
2011
85,562
76,485
0
10,000
20,000
30,000
40,000
50,000
60,000
70,000
80,000
90,000
2010
2011
Funded Retail Accounts
(3)
$256.7
$310.4
$0.0
$50.0
$100.0
$150.0
$200.0
$250.0
$300.0
$350.0
2010
2011
Client Assets
(3) |
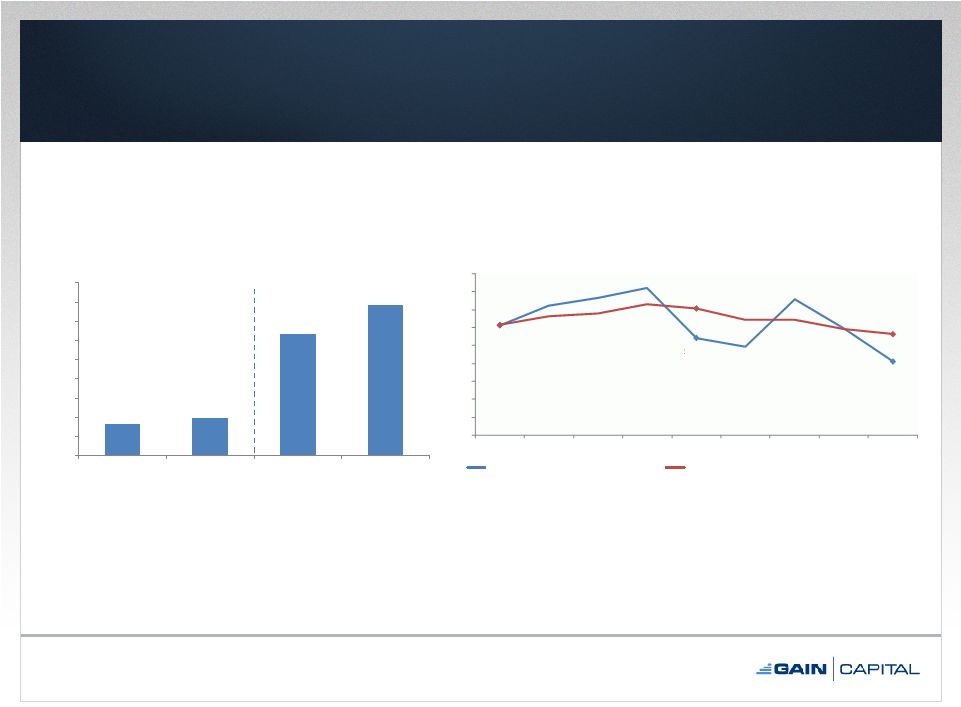 Operating
Metrics
(cont.)
(1)
11
Note: Trades in millions.
(1)
Definitions for all our operating metrics are available in the appendix to this
presentation. (2)
For periods ending December 31.
Q4
FY
8.2
9.9
31.7
39.2
-
5.0
10.0
15.0
20.0
25.0
30.0
35.0
40.0
45.0
2010
2011
2010
2011
Trades
(2)
$122.6
$108.5
$81.3
$123.0
$141.5
$111.7
$0.0
$20.0
$40.0
$60.0
$80.0
$100.0
$120.0
$140.0
$160.0
$180.0
Q4 09
Q1 10
Q2 10
Q3 10
Q4 10
Q1 11
Q2 11
Q3 11
Q4 11
Retail Trading Revenue per Million
Retail Trading Revenue per Million (Quarterly)
Retail Trading Revenue per Million (Last Twelve Months) |
 Strong Liquidity and Capital Allocation
•
Strong cash position
–
$80mm
of
excess
net
capital
(1)
–
$50mm available under revolver
•
$0.05 per share quarterly dividend approved
–
Record Date: March 13
–
Payment Date: March 22
12
(1)
As of February 27, 2012. |
 Looking Ahead –
2012
•
Retail Product Expansion
–
Expanded CFD offering for international markets
•
Large market opportunity: $1.3 billion per annum (Europe & Australia
alone) –
Social trading initiatives
•
Geographic Expansion
–
Middle East: Local presence in 2012
–
Japan: Increased GAIN GTX penetration; capitalizing on market
consolidation
13 |
 Appendix |
 Condensed Consolidated Statements of Operations
15
2011
2010
2011
2010
Revenue
Trading revenue
29.8
$
39.7
$
175.9
$
187.4
$
Other revenue
1.8
1.5
6.4
3.4
Total non-interest revenue
31.6
41.2
182.3
190.8
Interest revenue
0.3
0.1
0.6
0.4
Interest expense
(0.3)
(0.4)
(1.4)
(2.1)
Total net interest revenue (expense)
-
(0.3)
(0.8)
(1.7)
Net revenue
31.6
40.9
181.5
189.1
Expenses
Employee compensation and benefits
11.5
11.4
46.4
45.4
Selling and marketing
8.2
10.0
36.2
37.7
Trading expenses and commissions
7.5
7.1
33.0
25.7
Bank fees
0.8
1.0
4.2
4.2
Depreciation and amortization
1.0
0.9
3.9
3.4
Purchase intangible amortization
2.5
1.2
8.9
1.2
Communications and data processing
0.8
0.7
2.9
3.0
Occupancy and equipment
1.2
1.1
4.7
4.1
Bad debt provision
0.1
0.1
0.9
0.6
Professional fees
1.4
0.4
5.2
2.0
Product development, software and maintenance
1.2
1.0
4.2
3.5
Change in fair value of convertible, redeemable preferred stock embedded
derivative
(1)
-
(53.6)
-
(4.7)
Other
2.1
1.0
7.7
5.6
Total
38.3
(17.7)
158.2
131.7
Income / (loss) before tax expense
(6.7)
58.6
23.3
57.4
Income tax expense / (benefit)
(3.4)
1.8
7.6
20.0
Net Income / (loss)
(3.3)
$
56.8
$
15.7
$
37.4
$
Net loss applicable to noncontrolling interest
-
-
-
(0.4)
Net income / (loss) applicable to GAIN
Capital Holdings, Inc.
(3.3)
$
56.8
$
15.7
$
37.8
$
Earnings / (loss) per common share
(2)
:
Basic
(0.10)
$
6.62
$
0.46
$
8.62
$
Diluted
(0.10)
$
1.44
$
0.40
$
1.00
$
Weighted average common shares outstanding used
in computing earnings per common share
(2)
:
Basic
34,205,991
8,570,387
34,286,840
4,392,798
Diluted
34,205,991
39,347,111
38,981,792
37,742,902
(unaudited)
December 31,
December 31,
Three Months Ended
Twelve Months Ended
In millions, except per share data
(1)
For the periods prior to the closing of our initial public offering in December 2010, in accordance
with Financial Accounting Standards Board Accounting Standards Codification 815, Derivatives and Hedging,
we accounted for an embedded derivative liability attributable to the redemption feature of our
previously outstanding preferred stock. This redemption feature and the associated embedded derivative liability
was no longer required to be recognized following the conversion of all of our preferred stock into
common stock in connection with the completion of our initial public offering in December 2010 (the “IPO”).
(2)
In connection with our IPO, our board of directors approved a 2.29-for-1 stock split of our
common stock to be effective immediately prior to the completion of the IPO. The 2.29-for-1 stock split, after
giving effect to the receipt by us of 407,692 shares of common stock from all of our pre-IPO common
stockholders (on a pro-rata basis) in satisfaction of previously outstanding obligations owed by such
stockholders to us, resulted in an effective stock split of 2.26-for-1. Accordingly, all
references to share and per share data have been retroactively restated for the three and twelve months ended
December 31, 2010 to reflect the effective 2.26-for-1 stock split.
|
 Consolidated Balance Sheet
16
December 31,
December
31,
2011
2010
ASSETS:
Cash and cash equivalents
$
370.7
$
284.2
Short term investments
0.1
0.1
Trading securities
–
20.1
Receivables from brokers
85.4
98.1
Property and equipment, net
7.5
7.3
Prepaid assets
9.9
9.9
Goodwill
3.1
3.1
Intangible assets, net
10.8
9.1
Other assets, net
18.1
11.2
Total assets
$
505.6
$
443.1
LIABILITIES AND SHAREHOLDERS' EQUITY:
Payables to brokers, dealers, FCMs and other regulated entities
$
17.3
$
6.1
Payables to customers
293.1
250.6
Accrued compensation and benefits
4.9
5.1
Accrued expenses and other liabilities
14.9
10.5
Income tax payable
2.6
2.6
Notes payable
7.9
18.4
Total liabilities
340.7
293.3
Shareholders' equity
Common Stock
–
–
Accumulated other comprehensive income
0.3
0.4
Additional paid-in capital
79.6
73.4
Treasury stock, at cost (850,121 shares at December 31, 2011 and
zero shares at December 31, 2010)
(5.0)
–
Retained earnings
90.0
76.0
Total shareholders' equity
164.9
149.8
Total liabilities and shareholders' equity
$
505.6
$
443.1
In millions, except share data
(unaudited) |
 Adjusted Net Income / Margin Reconciliation
17
Note: Dollars in millions, except per share data.
(1)
In
connection
with
our
IPO,
our
board
of
directors
approved
a
2.29-for-1
stock
split
of
our
common
stock
to
be
effective
immediately
prior
to
the
completion
of
the
IPO.
The
2.29-for-1
stock
split,
after
giving
effect
to
the
receipt
by
us
of
407,692
shares
of
common
stock
from
all
of
our
pre-IPO
common
stockholders
(on
a
pro-rata
basis)
in
satisfaction
of
previously
outstanding
obligations
owed
by
such
stockholders
to
us,
resulted
in
an
effective
stock
split
of
2.26-for-1.
Accordingly,
all
references
to
share
and
per
share
data
have
been
retroactively restated for the three and twelve months ended December 31, 2010 to
reflect the effective 2.26-for-1 stock split. Three Months Ended December
31,Twelve Months Ended December 31, 2011
2010
2011
2010
Net Revenue
31.6
$
40.9
$
181.5
$
189.1
$
Net income/(loss) applicable to GAIN
Capital Holdings, Inc.
(3.3)
56.8
15.7
37.8
Change in fair value of convertible,
redeemable preferred stock embedded
derivative
–
(53.6)
–
(4.7)
Plus: Purchase intangible amortization (net of tax)
1.7
0.8
6.0
0.8
Adjusted Net Income/(Loss)
(1.6)
$
4.0
$
21.7
$
33.9
$
Adjusted Earnings/(Loss) per Share
(1)
Basic
(0.05)
$
0.45
$
0.63
$
7.72
$
Diluted
(0.05)
$
0.10
$
0.56
$
0.90
$
Net Income Margin %
(10.4%)
138.9%
8.7%
20.0%
Adjusted Net Income Margin %
(5.1%)
9.8%
12.0%
17.9% |
 EBITDA/Adjusted EBITDA / Margin Reconciliation
18
Note: Dollars in millions.
(1)
EBITDA is not adjusted in 2011 because the embedded derivative relating to our
previously outstanding preferred stock was extinguished in connection with our IPO.
Three Months Ended December 31,
Twelve Months Ended December 31,
2011
2010
2011
2010
Net Revenue
31.6
$
40.9
$
181.5
$
189.1
$
Interest on Note Payable
0.1
0.2
0.5
1.1
Net Revenue (ex. Interest on Note)
31.7
$
41.1
$
182.0
$
190.2
$
Net income/(loss) applicable to GAIN
Capital Holdings, Inc.
(3.3)
$
56.8
$
15.7
$
37.8
$
Change in fair value of convertible,
redeemable preferred stock embedded
derivative
–
(53.6)
–
(4.7)
Plus: Depreciation & amortization
1.0
0.9
3.9
3.4
Plus: Purchase intangible amortization
2.5
1.2
8.9
1.2
Plus: Interest expense of note payable
0.1
0.2
0.5
1.1
Plus/(Less): Income tax expense/(benefit)
(3.4)
1.8
7.6
20.0
Less: Net loss applicable to
non-controlling interest
–
–
–
(0.4)
EBITDA/Adjusted
EBITDA
(1)
(3.1)
$
7.2
$
36.6
$
58.5
$
EBITDA/Adjusted
EBITDA
Margin
%
(1)
(9.8%)
17.5%
20.1%
30.8% |
 Adjusted EPS (Diluted) Reconciliation
19
(1)
Net of tax.
(2)
In connection with our IPO, our board of directors approved a 2.29-for-1
stock split of our common stock to be effective immediately prior to the completion of the IPO. The 2.29-for-1
stock
split,
after
giving
effect
to
the
receipt
by
us
of
407,692
shares
of
common
stock
from
all
of
our
pre-IPO
common
stockholders
(on
a
pro-rata
basis)
in
satisfaction
of
previously
outstanding
obligations
owed
by
such
stockholders
to
us,
resulted
in
an
effective
stock
split
of
2.26-for-1.
Accordingly,
all
references
to
share
and
per
share
data
have
been
retroactively restated for the three and twelve months ended December 31, 2010 to
reflect the effective 2.26-for-1 stock split. Three Months Ended December
31, Twelve
Months
Ended
December
31,
2011
2010
2011
2010
GAAP Earnings per Share (Diluted)
(0.10)
$
1.44
$
0.40
$
1.00
$
Change in fair value of convertible,
redeemable preferred stock embedded
derivative
–
(1.36)
–
(0.12)
Plus: Purchase intangible amortization
(1)
0.05
0.02
0.16
0.02
Adjusted Earnings per Share (Diluted)
(2)
(0.05)
$
0.10
$
0.56
$
0.90
$
|
 Q4
& Full Year 2011 Financial Summary 20
Note: Dollars in millions, except per share data.
(1)
See page 18 for a reconciliation of GAAP net income to adjusted EBITDA. EBITDA
is not adjusted in 2011 since the embedded derivative relating to our previously
outstanding preferred stock was extinguished in connection with our IPO.
(2)
See page 17 for a reconciliation of GAAP net income to adjusted net income.
(3)
See page 19 for a reconciliation of GAAP EPS to adjusted EPS.
3 Mos. Ended December 31,
12 Mos. Ended December 31,
'11 v '10 % Change
2011
2010
2011
2010
Q4
FY
Net Revenue
$31.6
$40.9
$181.5
$189.1
(23%)
(4%)
Interest Expense on Note Payable
0.1
0.2
0.5
1.1
(45%)
(51%)
Net Revenue (ex. Interest on Note)
$31.7
$41.1
$182.0
$190.2
(23%)
(4%)
Operating Expenses
34.8
$33.9
145.4
131.7
3%
10%
EBITDA/Adjusted
EBITDA
(1)
($3.1)
$7.2
$36.6
$58.5
(143%)
(37%)
GAAP Net Income
($3.3)
$56.8
$15.7
$37.8
(106%)
(58%)
Adjusted
Net
Income
(2)
(1.6)
4.0
21.7
33.9
(140%)
(36%)
GAAP EPS (Diluted)
($0.10)
$1.44
$0.40
$1.00
(107%)
(60%)
Adjusted
EPS
(Diluted)
(3)
($0.05)
$0.10
$0.56
$0.90
(150%)
(38%)
EBITDA/Adjusted
EBITDA
Margin
%
(1)
(9.8%)
17.5%
20.1%
30.8%
NA
(11 pts)
Net Income Margin %
(10.4%)
138.9%
8.7%
20.0%
NA
(12 pts)
Adjusted
Net
Income
Margin
%
(2)
(5.1%)
9.8%
12.0%
17.9%
NA
(6 pts) |
 Q4
& Full Year 2011 Operating Metrics 21
Note: Dollars in millions, except retail trading revenue per million.
(1)
Average calculated using excess net capital balance at each month-end during the
relevant period. 4th Quarter
Full Year
'11 v '10 % Change
2011
2010
2011
2010
Q4
FY
For Period Ending December 31,
Total Trading Volume (billions)
$852.6
$470.2
$2,527.6
$1,564.1
81%
62%
Retail
366.4
366.3
1,574.0
1,324.8
0%
19%
Institutional
486.2
103.9
953.6
239.3
368%
298%
Traded Retail Accounts (Period)
34,019
36,241
63,436
64,313
(6%)
(1%)
Traded Retail Accounts (Last 12 Months)
63,436
64,313
63,436
64,313
(1%)
(1%)
New Retail Accounts
6,897
8,924
31,661
38,417
(23%)
(18%)
Net Deposits from Retail Customers
$43.3
$61.4
$233.2
$267.8
(29%)
(13%)
Trades
9,852,951
8,161,012
39,192,219
31,747,019
21%
23%
Retail Trading Revenue per Million
$81.3
$108.5
$111.7
$141.5
(25%)
(21%)
Average Excess Net Capital
(1)
$57.8
$69.5
$56.0
$63.3
(17%)
(11%)
As of December 31,
Funded Retail Accounts
76,485
85,562
76,485
85,562
(11%)
(11%)
Client Assets
$310.4
$256.7
$310.4
$256.7
21%
21% |
 Monthly Operating Metrics
(1)
22
Note: Dollars in millions.
(1)
Definitions for all our operating metrics are available in the appendix to this
presentation. (2)
As of period ended.
(3)
For period ended.
(4)
Excludes 1,650 accounts from GAIN Capital’s acquisition of dbFX.
Funded
New Retail
Client
Month
Retail Accts.
(2)
Accounts
(3)
Assets
(2)
Jan 2011
86,236
2,902
$277.0
Feb 2011
87,049
2,874
286.3
Mar 2011
85,698
3,132
283.0
Apr 2011
80,915
2,801
239.2
May 2011
79,623
2,775
(4)
290.8
Jun 2011
78,379
2,428
293.1
Jul 2011
78,082
2,350
283.4
Aug 2011
77,140
2,886
303.7
Sep 2011
77,013
2,616
286.4
Oct 2011
76,496
2,372
311.8
Nov 2011
76,647
2,330
319.3
Dec 2011
76,485
2,195
310.4
|
 Quarterly Operating Metrics
(1)
23
Note: For period ended. Volume in billions. Net deposits in
millions. (1)
Definitions for all our operating metrics are available in the appendix to this
presentation. Net Deposits
Volume
Traded Retail
From Retail
Quarter
Retail
Institutional
Accts. (Period)
Customers
Trades
Q1 11
$402.5
$110.1
36,570
$60.7
9,025,828
Q2 11
357.2
97.4
36,868
64.3
9,363,640
Q3 11
447.9
260.0
36,927
64.8
10,949,800
Q4 11
366.4
486.2
34,019
43.3
9,852,951 |
 Definition of Metrics
•
Total Trading Volume
–
Represents the U.S. dollar equivalent of notional amounts traded
•
Traded Retail Accounts
–
Retail accounts who executed a transaction during a given period
•
Funded Retail Accounts
–
Retail accounts who maintain a cash balance
•
Client Assets
–
Represents amounts due to clients, including customer deposits and unrealized
gains or losses arising from open positions
•
New Retail Accounts
–
The number of customer accounts that have initially opened and funded their
accounts •
Net Deposits from Retail Customers
–
Represents
customers’
deposits
less
withdrawals
for
a
given
period
•
Trades
–
The
number
of
transactions
retail
customers
have
completed
for
a
given
period
•
Retail Trading Revenue per Million
–
The revenue we realize from our forex, CFDs and metals trading activities per one
million of U.S. dollar-equivalent trading volume
•
Excess Net Capital
–
Represents the excess funds held over the regulatory minimum capital requirements,
as defined by the regulatory bodies that regulate our operating
subsidiaries 24 |
 4
th
Quarter and Full Year 2011
Financial and Operating Results
February 28, 2012 |