Attached files
| file | filename |
|---|---|
| 8-K - FLAGSTAR BANCORP, INC. - FLAGSTAR BANCORP INC | d307676d8k.htm |
| EX-99.2 - PRESS RELEASE - FLAGSTAR BANCORP INC | d307676dex992.htm |
| EX-99.1 - PRESS RELEASE - FLAGSTAR BANCORP INC | d307676dex991.htm |
Exhibit 99.3
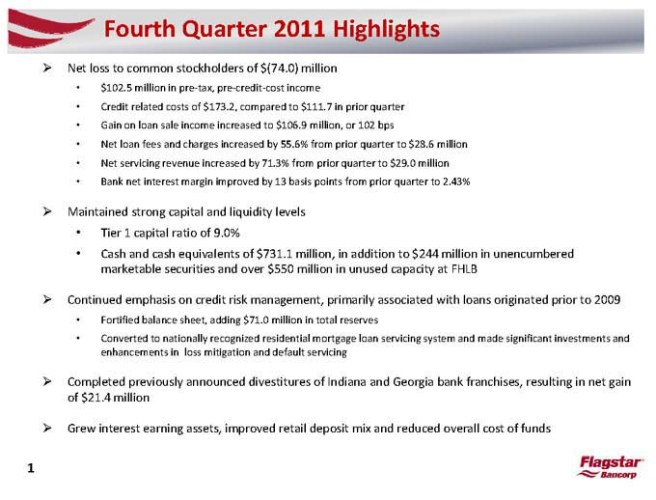
Fourth Quarter 2011 Highlights
??Net loss to common stockholders of $(74.0) million
$102.5 million in pre? tax, pre? credit? cost income
Credit related costs of $173.2, compared to $111.7 in prior quarter
Gain on loan sale income increased to $106.9 million, or 102 bps
Net loan fees and charges increased by 55.6% from prior quarter to $28.6 million
Net servicing revenue increased by 71.3% from prior quarter to $29.0 million
Bank net interest margin improved by 13 basis points from prior quarter to 2.43%
??Maintained strong capital and liquidity levels
Tier 1 capital ratio of 9.0%
Cash and cash equivalents of $731.1 million, in addition to $244 million in unencumbered marketable securities and over $550 million in unused capacity at FHLB
??Continued emphasis on credit risk management, primarily associated with loans originated prior to 2009
Fortified balance sheet, adding $71.0 million in total reserves
Converted to nationally recognized residential mortgage loan servicing system and made significant investments and enhancements in loss mitigation and default servicing
??Completed previously announced divestitures of Indiana and Georgia bank franchises, resulting in net gain of $21.4 million
??Grew interest earning assets, improved retail deposit mix and reduced overall cost of funds
| 1 |
|
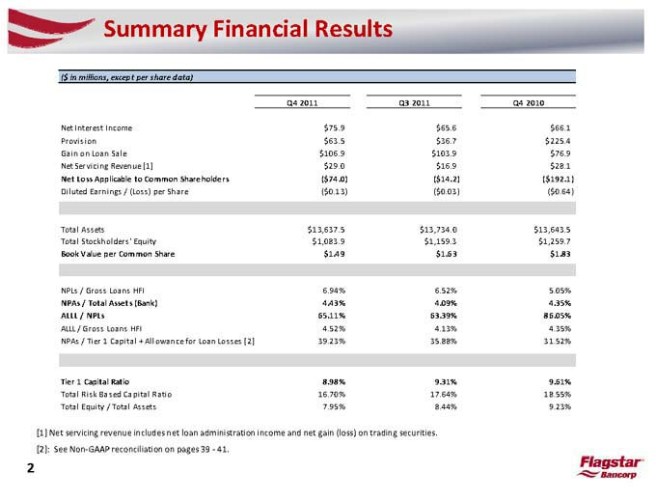
Summary Financial Results
($ in millions, except per share data)
Q4 2011 Q3 2011 Q4 2010
Net Interest Income $75.9 $65.6 $66.1
Provision $63.5 $36.7 $225.4
Gain on Loan Sale $106.9 $103.9 $76.9
Net Servicing Revenue [1] $29.0 $16.9 $28.1
Net Loss Applicable to Common Shareholders($74.0)($14.2)($192.1)
Diluted Earnings / (Loss) per Share($0.13)($0.03)($0.64)
Total Assets $13,637.5 $13,734.0 $13,643.5
Total Stockholders’ Equity $1,083.9 $1,159.3 $1,259.7
Book Value per Common Share $1.49 $1.63 $1.83
NPLs / Gross Loans HFI 6.94% 6.52% 5.05%
NPAs / Total Assets (Bank) 4.43% 4.09% 4.35%
ALLL / NPLs 65.11% 63.39% 86.05%
ALLL / Gross Loans HFI 4.52% 4.13% 4.35%
NPAs / Tier 1 Capital + Allowance for Loan Losses [2] 39.23% 35.88% 31.52%
Tier 1 Capital Ratio 8.98% 9.31% 9.61%
Total Risk Based Capital Ratio 16.70% 17.64% 18.55%
Total Equity / Total Assets 7.95% 8.44% 9.23%
[1] Net servicing revenue includes net loan administration income and net gain (loss) on trading securities.
[2]: See Non?GAAP reconciliation on pages 39 ?41.
| 2 |
|
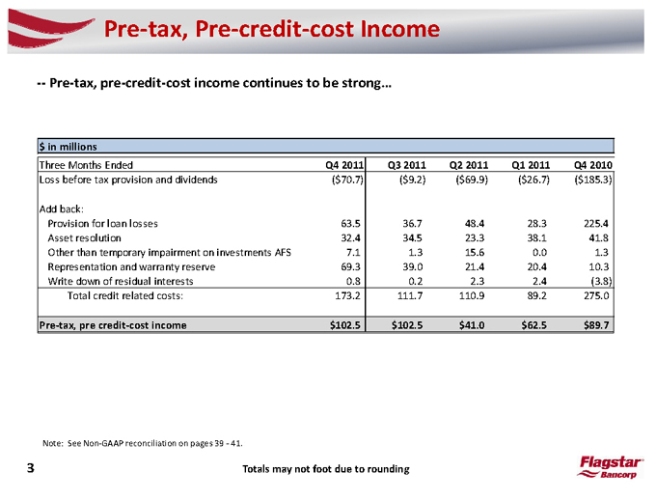
Pre?tax, Pre?credit?cost Income
??Pre?tax, pre?credit?cost income continues to be strong…
$ in millions
Three Months Ended Q4 2011 Q3 2011 Q2 2011 Q1 2011 Q4 2010
Loss before tax provision and dividends($70.41 6)7)($9.2)($69.9)($26.7)($185.3)
Add back:
Provision for loan losses 63.5 36.7 48.4 28.3 225.4
Asset resolution 32.4 34.5 23.3 38.1 41.8
Other than temporary impairment on investments AFS 7.1 1.3 15.6 0.0 1.3
Representation and warranty reserve 69.3 39.0 21.4 20.4 10.3
Write down of residual interests 0.8 0.2 2.3 2.4(3.8)
Total credit related costs: 173.2 111.7 110.9 89.2 275.0
Pre?tax, pre credit?cost income $102.131 56 $102.5 $41.0 $62.5 $89.7
Note: See Non?GAAP reconciliation on pages 39 ?41.
| 3 |
|
Totals may not foot due to rounding |
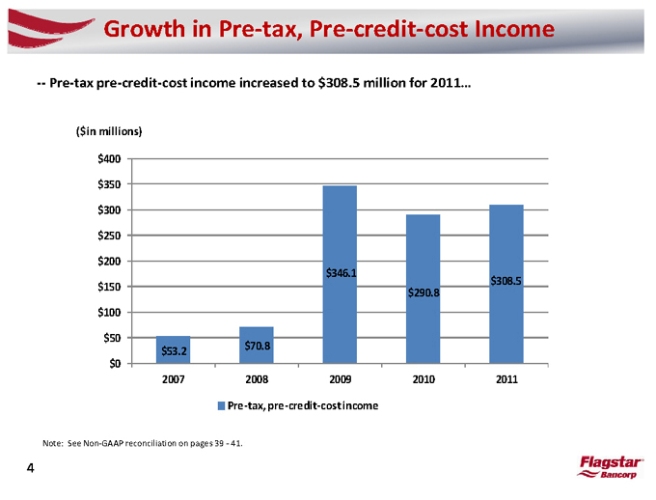
Growth in Pre?tax, Pre?credit?cost Income
??Pre?tax pre?credit?cost income increased to $308.5 million for 2011…
($ in millions)
$400
$350
$300
$250
$200
$346.1
$150 $308.5
$290.8
$100
$50
| $53.2 |
|
$70.8 |
$0
2007 2008 2009 2010 2011
Pre?tax, pre?credit?costincome
Note: See Non?GAAP reconciliation on pages 39 ?41.
| 4 |
|
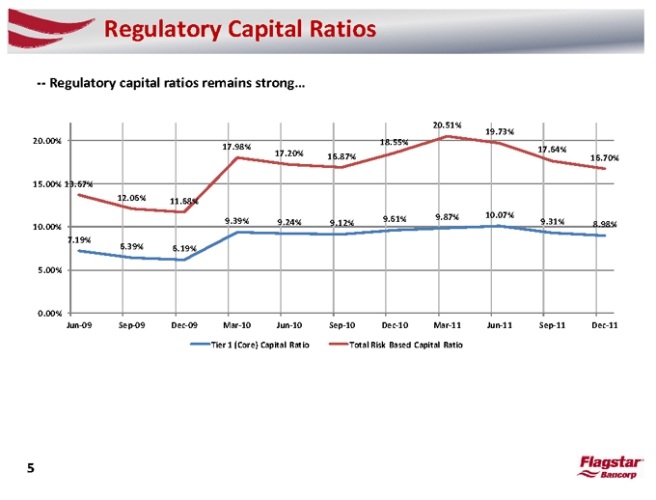
Regulatory Capital Ratios
??Regulatory capital ratios remains strong…
20.51%
19.73%
| 20.00% |
|
18.55% |
| 17.98% |
|
17.64% |
| 17.20% |
|
16.87% 16.70% |
| 15.00% |
|
13.67% |
| 12.06% |
|
11.68% |
07%
| 9.39% |
|
9.24% 9.12% 9.61% 9.87% 10. 9.31% |
| 10.00% |
|
8.98% |
7.19%
| 6.39% |
|
6.19% |
5.00%
0.00%
Jun?09 Sep?09 Dec?09 Mar?10 Jun?10 Sep?10 Dec?10 Mar?11 Jun?11 Sep?11 Dec?11
Tier 1 (Core) Capital Ratio Total Risk Based Capital Ratio
| 5 |
|
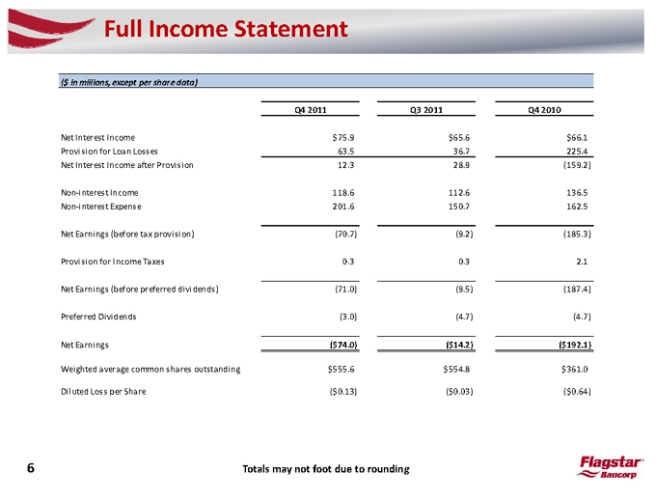
Full Income Statement
($ in millions, except per share data)
Q4 2011 Q3 2011 Q4 2010
Net Interest Income $75.9 $65.6 $66.1
Provision for Loan Losses 63.5 36.7 225.4
Net Interest Income after Provision 12.3 28.9(159.2)
Non?interest Income 118.6 112.6 136.5
Non?interest Expense 201.6 150.7 162.5
Net Earnings (before tax provision)(70.7)(9.2)(185.3)
Provision for Income Taxes 0.3 0.3 2.1
Net Earnings (before preferred dividends)(71.0)(9.5)(187.4)
Preferred Dividends(3.0)(4.7)(4.7)
Net Earni ngs($74.0)($14.2)($192.1)
Weighted average common shares outstanding $555.6 $554.8 $361.0
Diluted Loss per Share($0.13)($0.03)($0.64)
| 6 |
|
Totals may not foot due to rounding |
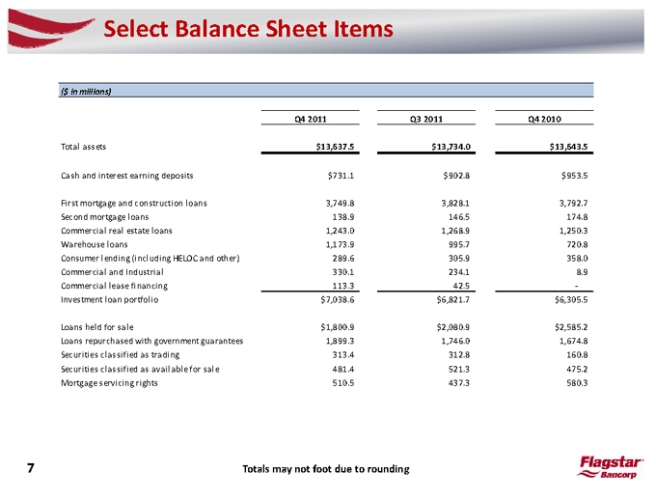
Select Balance Sheet Items
($ in millions)
Q4 2011 Q3 2011 Q4 2010
Total assets $13,637.5 $13,734.0 $13,643.5
Cash and interest earning deposits $731.1 $902.8 $953.5
First mortgage and construction l oans 3,749.8 3,828.1 3,792.7
Second mortgage loans 138.9 146.5 174.8
Commercial real estate loans 1,243.0 1,268.9 1,250.3
Warehouse loans 1,173.9 995.7 720.8
Consumer lending (including HELOC and other) 289.6 305.9 358.0
Commercial and Industrial 330.1 234.1 8.9
Commercial lease financing 113.3 42.5
Investment loan portfolio $7,038.6 $6,821.7 $6,305.5
Loans held for sale $1,800.9 $2,080.9 $2,585.2
Loans repurchased with government guarantees 1,899.3 1,746.0 1,674.8
Securities classified as trading 313.4 312.8 160.8
Securities classified as available for sale 481.4 521.3 475.2
Mortgage servicing rights 510.5 437.3 580.3
| 7 |
|
Totals may not foot due to rounding |
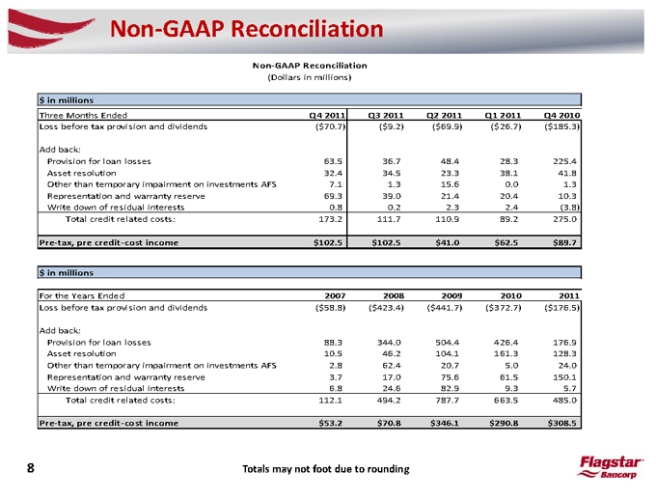
Non?GAAP Reconciliation
Non?GAAP Reconciliation
(Dollars in millions)
$ in millions
Three Months Ended Q4 2011 Q3 2011 Q2 2011 Q1 2011 Q4 2010
Loss before tax provision and dividends($70.7)($9.2)($69.9)($26.7)($185.3)
Add back:
Provision for loan losses 63.5 36.7 48.4 28.3 225.4
Asset resolution 32.4 34.5 23.3 38.1 41.8
Other than temporary impairment on investments AFS 7.1 1.3 15.6 0.0 1.3
Representation and warranty reserve 69.3 39.0 21.4 20.4 10.3
Write down of residual interests 0.8 0.2 2.3 2.4(3.8)
Total credit related costs: 173.2 111.7 110.9 89.2 275.0
Pre?tax, pre credit?cost income $102.5 $102.5 $41.0 $62.5 $89.7
$ in millions
For the Years Ended 2007 2008 2009 2010 2011
Loss before tax provision and dividends($58.8)($423.4)($441.7)($372.7)($176.5)
Add back:
Provision for loan losses 88.3 344.0 504.4 426.4 176.9
Asset resolution 10.5 46.2 104.1 161.3 128.3
Other than temporary impairment on investments AFS 2.8 62.4 20.7 5.0 24.0
Representation and warranty reserve 3.7 17.0 75.6 61.5 150.1
Write down of residual interests 6.8 24.6 82.9 9.3 5.7
Total credit related costs: 112.1 494.2 787.7 663.5 485.0
Pre?tax, pre credit?cost income $53.2 $70.8 $346.1 $290.8 $308.5
| 8 |
|
Totals may not foot due to rounding |
Non?GAAP Reconciliation
Non?GAAP Reconciliation
(Dollars in millions)
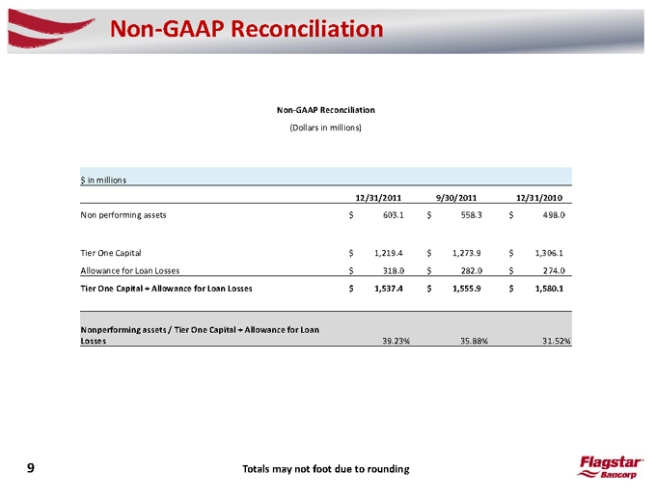
$ in millions
12/31/2011 9/30/2011 12/31/2010
Non performing assets $ 603.1 $ 558.3 $ 498.0
Tier One Capital $ 1,219.4 $ 1,273.9 $ 1,306.1
Allowance for Loan Losses $ 318.0 $ 282.0 $ 274.0
Tier One Capital + Allowance for Loan Losses $ 1,537.4 $ 1,555.9 $ 1,580.1
Nonperforming assets / Tier One Capital + Allowance for Loan
Losses 39.23% 35.88% 31.52%
9 Totals may not foot due to rounding