Attached files
| file | filename |
|---|---|
| 8-K - FORM 8-K - ABERCROMBIE & FITCH CO /DE/ | d302631d8k.htm |
| EX-99.4 - EX-99.4 - ABERCROMBIE & FITCH CO /DE/ | d302631dex994.htm |
| EX-99.2 - EX-99.2 - ABERCROMBIE & FITCH CO /DE/ | d302631dex992.htm |
| EX-99.1 - EX-99.1 - ABERCROMBIE & FITCH CO /DE/ | d302631dex991.htm |
Exhibit 99.3

| Investor Presentation2011 Fourth Quarter Investor Presentation2011 Fourth Quarter |

| 2 SAFE HARBOR STATEMENT UNDER THE PRIVATE SECURITIES LITIGATION REFORM ACT OF 1995 A&F cautions that any forward-looking statements (as such term is defined in the Private Securities Litigation Reform Act of 1995) contained in this presentation or made by management or spokespeople of A&F involve risks and uncertainties and are subject to change based on various important factors, many of which may be beyond the Company's control. Words such as "estimate," "project," "plan," "believe," "expect," "anticipate," "intend," and similar expressions may identify forward-looking statements. Except as may be required by applicable law, we assume no obligation to publicly update or revise our forward-looking statements. The factors included in the disclosure under the heading "FORWARD-LOOKING STATEMENTS AND RISK FACTORS" in "ITEM 1A. RISK FACTORS" of A&F's Annual Report on Form 10-K for the fiscal year ended January 29, 2011, in some cases have affected and in the future could affect the Company's financial performance and could cause actual results for the 2011 fiscal year and beyond to differ materially from those expressed or implied in any of the forward-looking statements included in this presentation or otherwise made by management. OTHER INFORMATIONAll dollar and share amounts are in 000's unless otherwise stated. Sub-totals and totals may not foot due to rounding. |

| 3 Q4 Adjusted P&L Summary* |
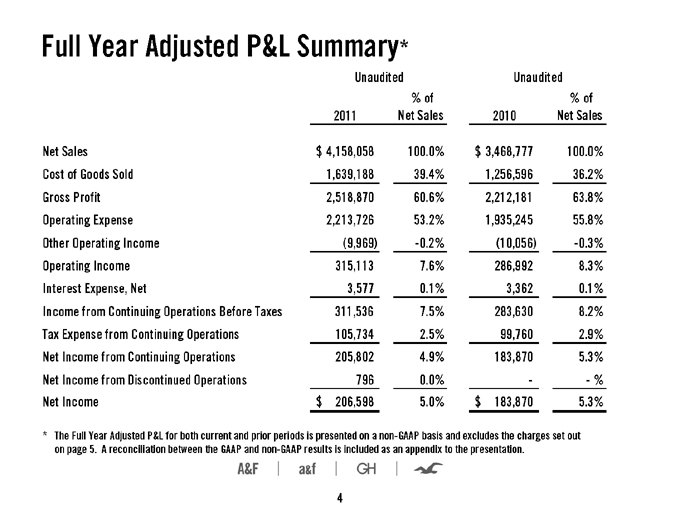
| 4 Full Year Adjusted P&L Summary* |

| 5 Impairment and Other Charges* |

| 6 Q4 Sales Analysis Versus Prior Year Sales Mix |

| 7 Full Year Sales Analysis Versus Prior Year Sales Mix |

| 8 Full Year Analysis |

| 9 Sales Growth Contribution |

| 10 Adjusted Operating Expense* |

| 11 Inventory Analysis |

| 12 Inventory Change Analysis* * Amounts expressed in millions and represent contribution to overall inventory increase of $184 million versus prior year |

| 13 Share Repurchases |

| 14 International Hollister Store Count - Cumulative |
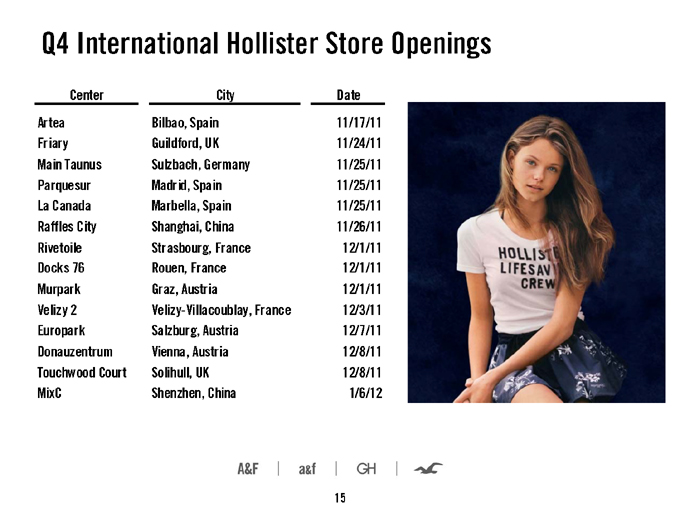
| 15 Q4 International Hollister Store Openings |

| 16 Flagship Openings |

| 17 2012 Guidance Sales Assumptions: Flat same store sales Continued strong DTC growth Greater than $300 million in revenue contribution from 2011 store openings Close to 40 international Hollister store openings in 2012 Flagship openings per page 17 Approximately $50 million negative FX impact at current rates Approximately $70 million negative sales impact from 2011 store closuresGross Margin Assumptions: Recovery of approximately half of 2011 GM rate erosion, driven by international mix benefit and AUC improvement in Fall Season |

| 18 2012 Guidance Operating Expense Assumptions: Approximately 100 to 150 basis points expense leverage, primarily driven by occupancyCapex and Other Assumptions: Approximately $400 million capex based on store opening plans and other investments FX rates: Budget rates approximately in line with current spot rates Additional share repurchases not assumed for modeling purposes Tax rate: Slightly below 35% |

| 19 2012 First Quarter Guidance Gross Margin: 400 to 500 bps of erosion Operating Expenses: Approximately flat as a percentage of sales |

| 20 Appendix: GAAP to non-GAAP Income Statement Appendix: GAAP to non-GAAP Income Statement (1 of 2) |
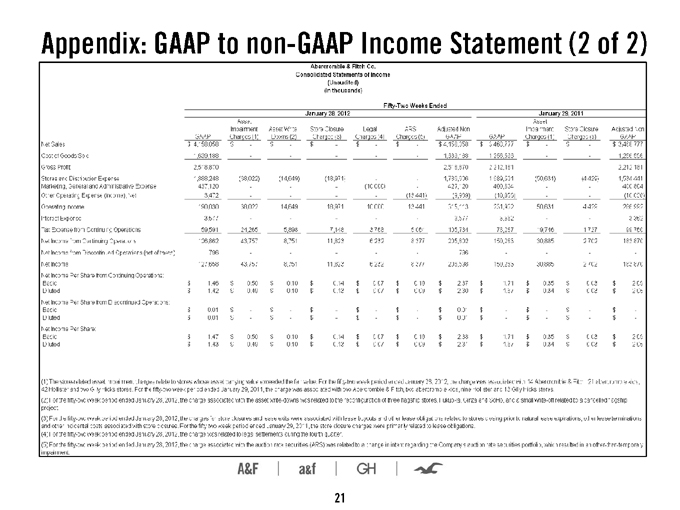
| 21 Appendix: GAAP to non-GAAP Income Statement (2 of 2) |

| 22 Appendix: Q4 Store Count Activity Store Count - By Brand and Region |

| 23 Appendix: Year-To-Date Store Count Activity Store Count - By Brand and Region |