Attached files
| file | filename |
|---|---|
| 8-K - FORM 8-K - Symetra Financial CORP | d300739d8k.htm |
 Exhibit 99.1
February 15, 2012
Bank
of
America
Merrill
Lynch
2012 Insurance Conference |
 Forward-Looking Statements
Statements made in the following presentation that relate to anticipated financial
performance or business operations, business services and product prospects
and plans, reinvestment opportunities, changes in the amount of cash flow testing
reserves, regulatory developments, accounting standard changes and similar matters
may be considered “forward-looking statements”
as defined in the Private Securities Litigation Reform Act of 1995. All
statements, other than statements of current or historical facts, are
forward-looking statements. Forward-looking statements are subject to a number of risks,
uncertainties and contingencies that may cause the operations, performance,
development and results of our business to differ materially from those
suggested by such statements. Consequently, all of the forward-looking statements made in this
presentation are qualified by these cautionary statements. The information
contained in this presentation speaks as of February 15, 2012. Symetra
undertakes no obligation to update any such forward-looking statements, whether as a result of
new information, future events or otherwise. Historical results are not necessarily
indicative of future results. Future results, including our financial
performance, business operations and trends in our business and industry, are subject to significant
risks and uncertainties, including without limitation the following:
›
the effects of fluctuations in interest rates and a prolonged low interest rate
environment; ›
general economic, market or business conditions, including further economic
downturns or other adverse conditions in the global and domestic capital
and credit markets; ›
investment losses;
›
recorded reserves for future policy benefits and claims subsequently proving to be
inadequate or inaccurate; ›
deviations
from
assumptions
used
in
setting
prices
for
insurance
and
annuity
products
or
establishing
cash
flow
testing
reserves;
›
continued viability of certain products under various economic and other
conditions; ›
market pricing and competitive trends related to insurance products and
services; ›
changes
in
amortization
of
deferred
policy
acquisition
costs
and
deferred
sales
inducements;
›
financial strength or credit ratings downgrades;
›
the availability and cost of capital and financing;
›
the continued availability and cost of reinsurance coverage;
›
changes in laws or regulations, or their interpretation, including those which
could increase Symetra's business costs and required capital levels;
›
the ability of subsidiaries to pay dividends to Symetra;
›
Symetra’s ability to successfully execute on its Grow & Diversify
strategy; ›
the effects of implementation of the Patient Protection and Affordable Care
Act; ›
the effects of implementation of the Dodd-Frank Wall Street Reform and
Consumer Protection Act; ›
the
effects
of
implementation
of
the
new
accounting
standard
for
deferred
acquisition
costs;
and
›
the
risks
that
are
described
from
time
to
time
in
Symetra's
filings
with
the
Securities
and
Exchange
Commission,
including
those
in
Symetra's 2010 Annual Report on Form 10-K and 2011 quarterly reports on Form
10-Q. 2 |
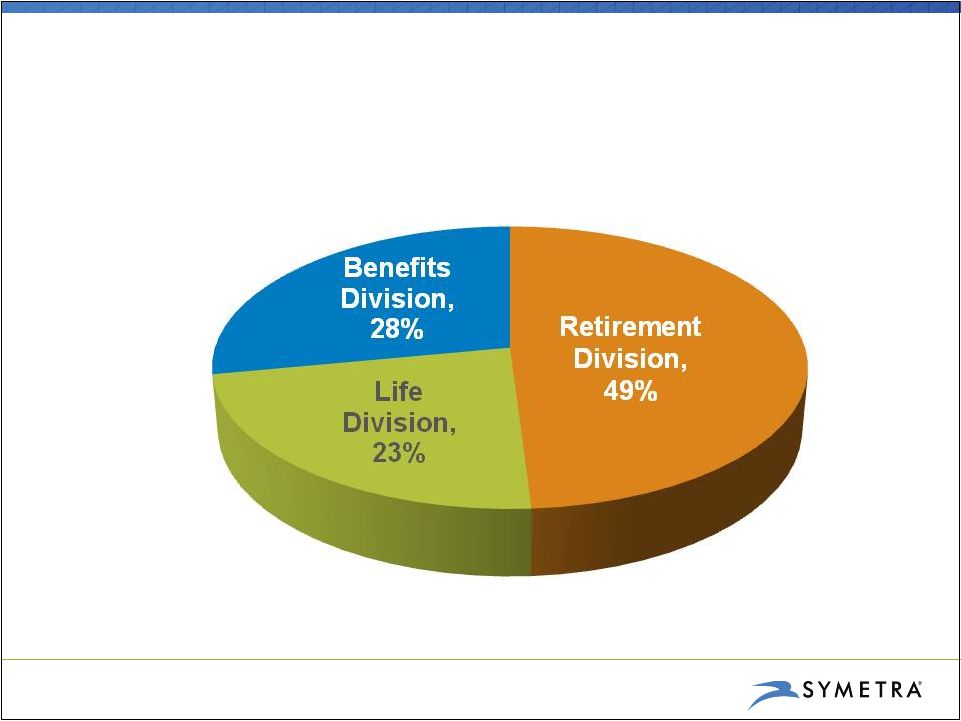 Our Businesses Are Aligned in Three Divisions
2011 Pretax Adjusted Operating Income
1
Excluding Other segment loss of $(10.7)M. A non-GAAP financial measure;
see Appendix for definition and reconciliation to the most directly
comparable GAAP measure. 3
1 |
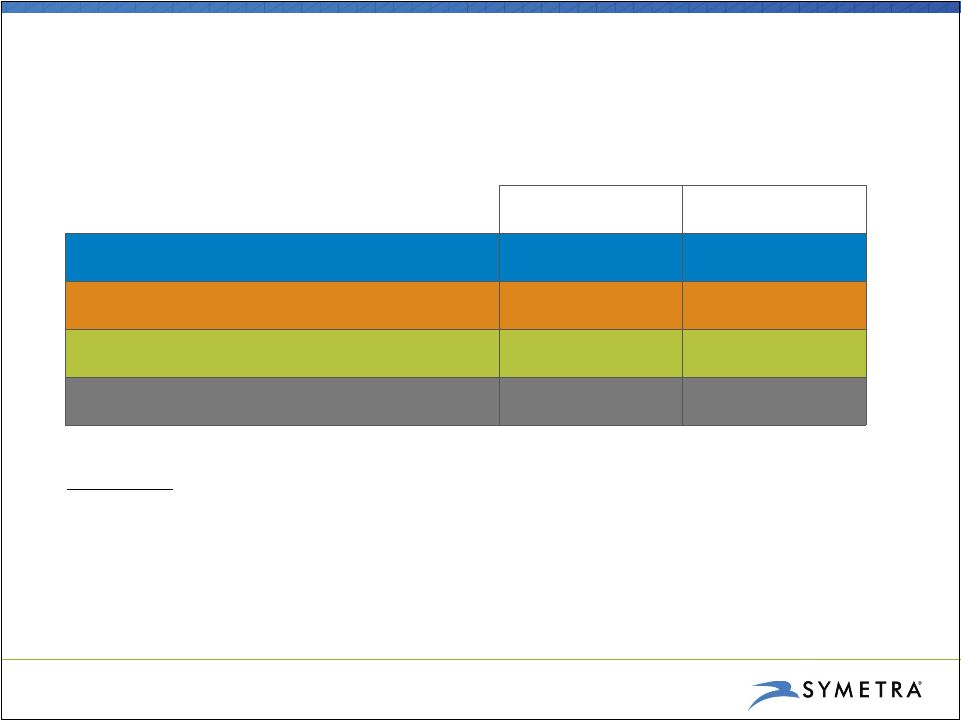
 Diversifying Our Risks Over Time
4
Present
Future
Rising interest
rates
High
Medium
Falling interest rates
High
Medium
Morbidity
(loss
ratio)
Medium
Medium
Premium revenues
(underwriting cycles)
Medium
Medium
Mortality
Low
Medium
Equity
Low
Medium
Credit
High
Medium |
 5
Executing on “Grow & Diversify”
Strategy
›
Driving profitable growth and diversifying revenue sources
(especially important in prolonged low interest rate environment)
›
Not taking easy route to growth
›
Targeting markets and products that offer higher ROE
›
Implementation
risk
–
not
balance
sheet
risk
›
Sustaining current positions of strength in:
›
Medical stop-loss
›
Banking channel distribution of fixed annuities
›
Excellent balance sheet and disciplined risk management
|
 Grow
& Diversify Initiatives Growth and diversification goals within each
division: ›
Benefits
›
Group Life & Disability Income (DI)
›
Complete transition of AUL medical stop-loss business
›
Retirement
›
Non-living benefits variable annuity (VA)
›
Fixed indexed annuity (FIA)
›
Life
›
New universal life (UL) products for life professional distribution
›
Variable corporate-owned life insurance (COLI)
6
1
American United Life Insurance Co.
1 |
 We’re Building in 2012
›
Higher expenses related to investments in infrastructure in 2012
›
Benefits: building out disability claims processing capabilities
›
Retirement: completing development of VA for mid-year launch
›
Life: steady, but more modest, cost to build product and distribution
›
Expanded distribution and product support capabilities add to the run rate
›
Pricing ROEs across all Grow & Diversify products are initially 12% or
higher ›
AUL is a net contributor to earnings in all years, with above-target ROE
›
Full investment in Grow & Diversify initiatives is recovered by
mid-2015 7
Grow & Diversify Initiatives
2012
2013
2014
2015
Net Contribution to Operating EPS
$(0.08)
$(0.02)
$0.07
$0.14
1
A non-GAAP financial measure also referred to as “adjusted operating income per common share
– diluted.”
See Appendix for definition.
1 |
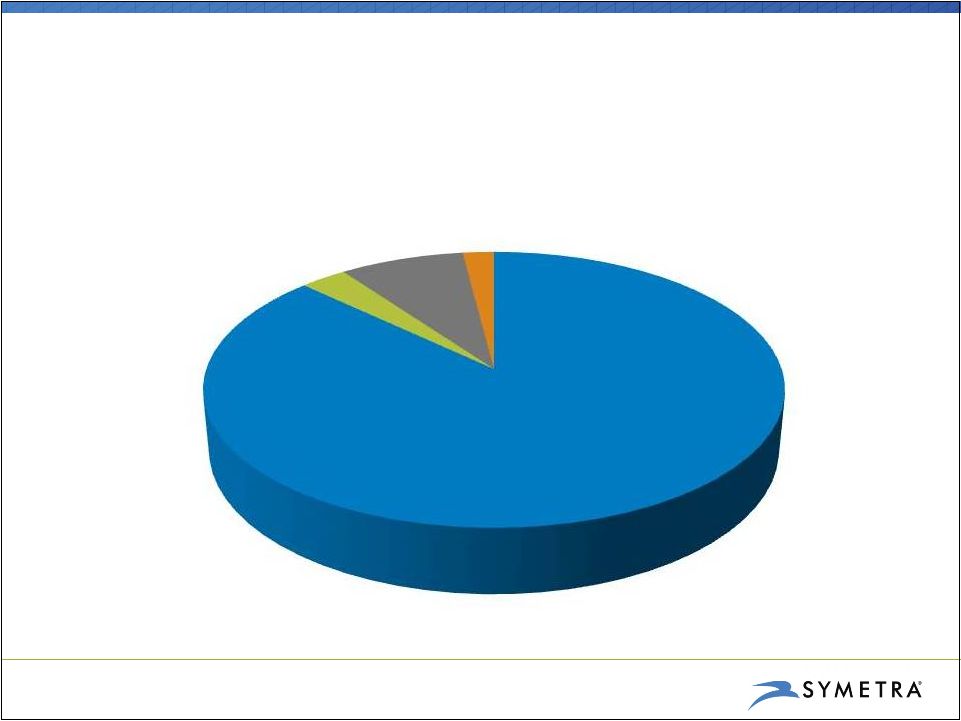 Benefits Division: Product Breakout
2011 Total Operating Revenues
8
Medical
Stop-Loss,
87%
MGU
Services, 3%
Limited
Benefit
Medical, 8%
Group Life
and Disability,
2% |
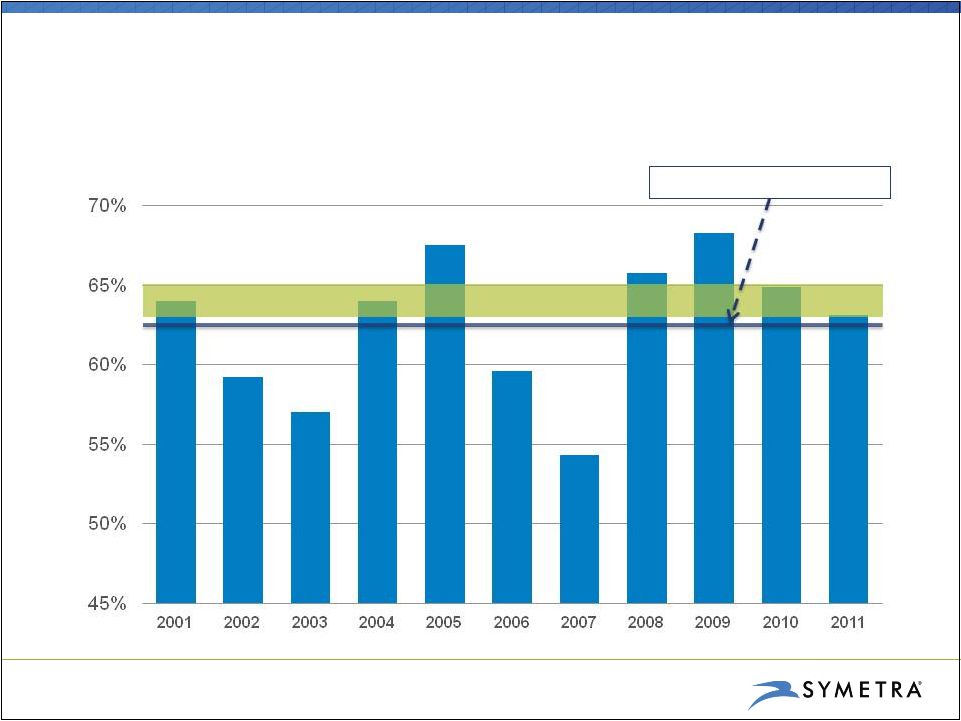 9
Excellent Track Record of Profitability
Benefits Loss Ratio
Long-term
target
range:
63%
-
65%
Average: 62.5% |
 Medical Stop-Loss
•
Maintain leadership position
•
Through consistent, disciplined
underwriting, continue to achieve
long-term profitability targets
•
Complete transition of AUL policies
to Symetra
•
Capitalize on opportunities that
arise from healthcare reform
Group Life & DI
•
Drive growth in group life and
disability income premium, while
completing buildout of capabilities
•
Focus on the middle-market
opportunity
•
Leverage medical stop-loss
distribution network
Benefits Division’s Strategic Priorities
10 |
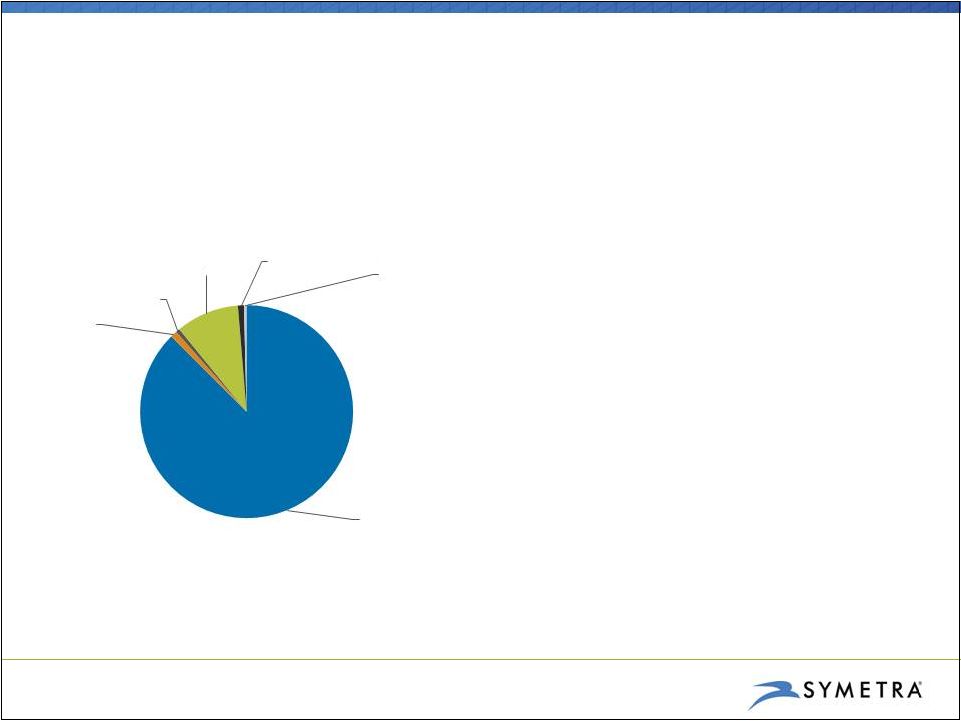
 GAAP Account Values and Reserves
As of 12/31/11
Retirement Division: Product Breakout
11
Deferred
Fixed
Annuities,
59%
Deferred
Variable
Annuities, 4%
Structured
Settlements,
32%
Retail Payout
Annuities, 5% |
 Account Values and Spreads¹
12
Fixed Annuity Block Is Growing Profitably
›
Pricing discipline will continue
›
Optimizing pricing and rates in
challenging rate environment
›
Optional guaranteed return
of purchase payment
›
Commission restructure
›
Increased surrender
charges
›
Rigorous reset of
guaranteed minimum rates
›
Spread will be a function of the
levers we pull
$ in millions
1
For 2009,
2010 and
2011, spread is base
interest spread, which excludes the impact
of asset prepayments and MBS prepayment speed
adjustments. Total interest spread for 2009, 2010 and 2011 was 1.81%, 1.87% and 1.94%, respectively.
$4,445
$5,725
$7,656
$9,244
$10,613
1.68%
1.67%
1.80%
1.80%
1.82%
1.00%
1.10%
1.20%
1.30%
1.40%
1.50%
1.60%
1.70%
1.80%
1.90%
$-
$2,000
$4,000
$6,000
$8,000
$10,000
$12,000
YE '07
YE '08
YE '09
YE '10
YE '11
Account Value
Spread
Account Values and Spreads
1 |
 Deferred Fixed
Annuities
•
Maintain leadership
position in the bank
distribution channel
•
Maintain strong interest
spread on fixed
annuities
•
Accelerate the uptake of
FIA product on bank and
broker-dealer platforms
Variable
Annuities
•
Complete development
of VA for the lower cost,
non-living benefits
market
•
Build the infrastructure
to support administration
of registered products
•
Launch in mid-2012
Income
Annuities
•
Continue to stabilize the
profitability of existing
block in low interest rate
environment with
commercial mortgage
loan origination strategy
•
Focus sales effort on
shorter duration
opportunities
Retirement Division’s Strategic Priorities
13 |
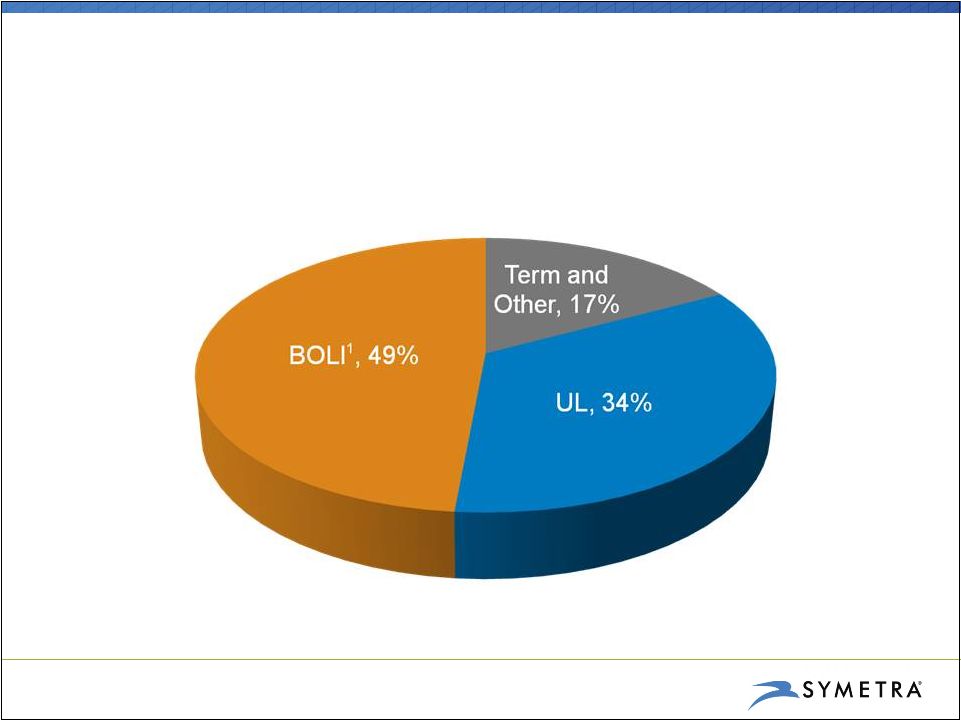 Life Division: Product Breakout
2011 Pretax Adjusted Operating Income
1
Bank-Owned Life Insurance
14 |
 Develop New Product
•
Develop competitive features
(riders) for new core UL product
launched on September 30, 2011
•
Launch COLI product for
institutional market
Broaden Distribution
•
Roll out UL on national life-focused
brokerage general agent (BGA)
distribution partners’
sales
platforms
•
Expand opportunities for BOLI,
while leveraging BOLI expertise to
expand into the COLI market
Life Division’s Strategic Priorities
15 |
 Maintaining Excellent Balance Sheet Strength
›
Conservative investment strategy:
›
ALM -
matching asset and liability cash flows
›
Driving improved yield through commercial mortgage loan origination
›
Approx. 84% of liabilities are mostly illiquid
›
Debt-to-capital ratio = 13%
›
Tangible book value
= 89% of total stockholders’
equity
›
Risk-based capital ratio = 457%
16
(As of 12/31/11)
1
A non-GAAP financial measure; see Appendix for definition and reconciliation
to most directly comparable GAAP measure.
1 |
 Grow & Diversify: 2012 Targets
17
$250M in sales of fixed indexed
annuities and variable annuities
$25M in sales of group life and
disability income insurance
$25M in sales of universal life
and BOLI/COLI
Retirement Division:
Benefits Division:
Life Division: |
 We’re Focused on Building Long-Term Value
›
Strong balance sheet provides a firm foundation
›
Symetra has market leadership positions in fixed deferred
annuities sold in banks and medical stop-loss
›
Grow & Diversify initiatives aim to generate incremental growth
from new, primarily non-interest rate sensitive earnings sources
›
Working to expand ROE over time
18 |
 Appendix
19 |
 Financial Results
20
2011
2010
Return on Equity (ROE)
7.3%
9.3%
Operating
Return
on
Average
Equity
(ROAE)
1
9.5%
9.8%
2011
2010
Net Income
$ 199.6
$ 200.9
Adjusted Operating Income
$ 194.1
$ 175.2
$ in millions
1
A non-GAAP financial measure. See Appendix for a definition of these measures and
reconciliations to the most directly comparable GAAP measures.
1 |
 21
Benefits Segment
Priorities:
›
Maintain leadership position in medical stop-loss market, while achieving
loss ratio in line with long-term target range of 63% -
65%
›
Complete transition of AUL medical stop-loss policies to Symetra
›
Drive growth in group life and disability income premium, while completing
buildout of capabilities
2011
2010
Operating Revenues
$ 533.3
$ 463.6
Pretax Adjusted Operating Income
$ 79.2
$ 71.6
Loss Ratio
63.1%
64.9%
Total Sales
$ 118.7
$ 95.5
$ in millions
1
Total revenue excluding net realized investment gains (losses).
1 |
 22
Deferred Annuities Segment
Priorities:
›
Maintain solid interest spread on fixed annuities
›
Increase sales of fixed annuities at many major bank distribution partners
and accelerate the uptake rate of fixed indexed annuities
›
Complete development for mid-year launch of variable annuity for the lower
cost non-living benefits market
2011
2010
Operating Revenues
$ 546.5
$ 482.5
Pretax Adjusted Operating Income
$ 102.1
$ 81.3
Base Interest Spread
1.82%
1.80%
Total Sales
$ 1,815.3
$ 1,810.7
Total Account Values
$11,326.9
$10,034.8
$ in millions
1
Total revenue excluding net realized investment gains (losses) and including net
investment gains (losses) on FIA options. 2
Excludes impact of asset prepayments and mortgage-backed securities prepayment speed
adjustments. 1
2 |
 23
Income Annuities Segment
Priorities:
›
Continue
to
stabilize
the
profitability
of
existing
block
in
low
interest
rate
environment with commercial mortgage loan origination strategy
›
Focus sales effort on shorter duration opportunities
2011
2010
Operating Revenues
$ 414.9
$ 423.5
Pretax Adjusted Operating Income
$ 35.1
$ 33.2
Base Interest Spread
0.50%
0.49%
Total Sales
$ 221.9
$ 260.0
$ in millions
1
Total revenue excluding net realized investment gains (losses).
2
Excludes impact of asset prepayments and mortgage-backed securities prepayment speed
adjustments. 1
2 |
 24
Life Segment
Priorities:
›
Roll out Symetra Classic UL insurance on new BGA partners’
sales platforms
›
Enhance Symetra Classic UL with additional benefits riders
›
Launch variable COLI product
2011
2010
Operating Revenues
$ 452.0
$ 429.4
Pretax Adjusted Operating Income
$ 64.9
$ 74.9
BOLI Base ROA
0.98%
0.97%
Individual Sales
$ 11.7
$ 10.2
BOLI Sales
$ --
$ 46.1
$ in millions
1
Total revenue excluding net realized investment gains (losses).
2
Excludes the impact of asset prepayments and reserve adjustments.
1
2 |
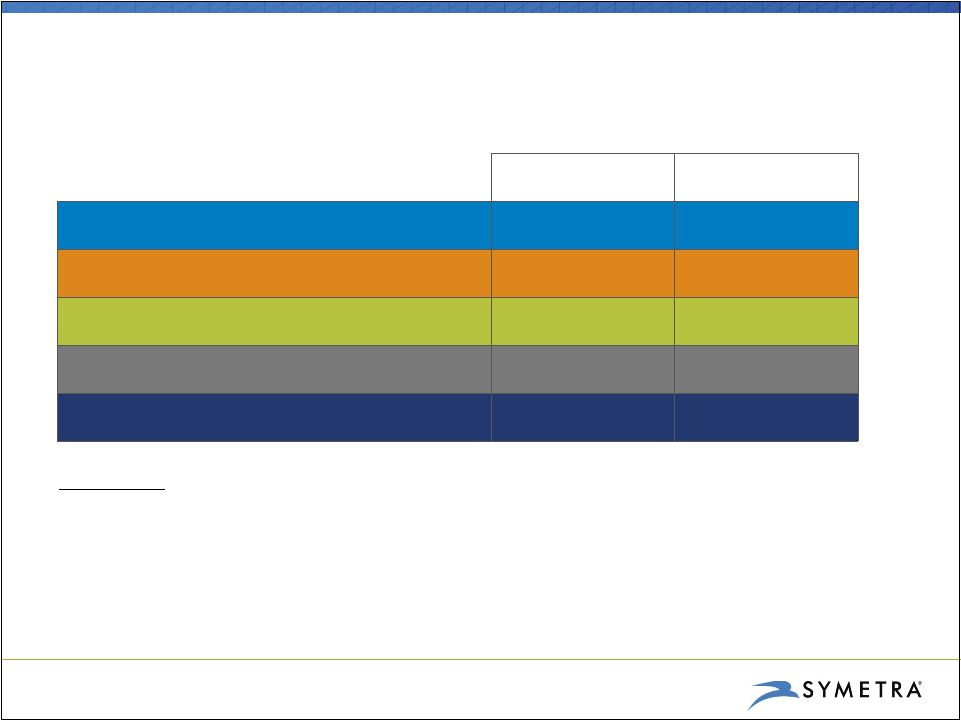
 $26.2 billion
Portfolio Composition
As of 12/31/11
25
High-Quality Investment Portfolio
1
Included in trading marketable equity securities.
2
From inception of Symetra equity portfolio in January 2005 and
Symetra REIT portfolio in April 2011.
3
FTSE NAREIT All Equity REITS Index.
›
Pretax impairments of $5.5M in 4Q11 vs $6.2M in 4Q10
›
AOCI of $1,013.5M at 12/31/11 vs $432.5M at 12/31/10
›
RMBS $3.6B
›
Gross premium of ($66.2M)
›
Gross discount of $73.7M
›
Average mortgage loan rate = 5.4%
›
Outstanding long-term equity portfolio performance:
Life-to-date
annualized
total
return
of
9.7%
(vs
2.6% for
S&P 500 Total Return Index)
›
Life-to-date
annualized
total
return
for
REITs
of
2.7%
vs benchmark total return of 2.6%
›
European exposure of $1.4B
›
$0.6M of sovereign
›
$157.1M of financials
›
Largest holding = $116M of Shell
›
Commercial mortgage loans offer attractive yields:
4Q11 originations funded at over 300 bp spread to
Treasurys
Fixed
maturities,
87.5%
Equities,
1.0%
REITs¹
, 0.6%
Commercial
mortgage
Limited
partnerships,
0.9%
and other,
0.4%
Policy loans
loans, 9.6%
2
2
3 |
 Impact of Federal Healthcare Reform
›
On March 23, 2010, the Patient Protection and Affordable Care Act (PPACA) was
signed into law:
›
Brings substantial change to insurance coverage for medical costs
›
Many changes apply primarily to fully insured group health plans, but some
provisions apply to self-funding
›
Many provisions of PPACA need to be clarified and will require follow-up
legislation ›
Specifically, PPACA:
›
Affects the market for major medical and mini-med plans
›
Mandates elimination of certain limits and exclusions
›
Establishes new payout standards with Medical Loss Ratio minimums
›
Studies find that the majority of employers (74% ) intend to continue to
offer employee healthcare plans, despite concerns that costs will rise as a
result of healthcare reform 26
1
Towers Watson survey, May 2010
Elimination of
coverage limitations
Ongoing medical
cost inflation
Increasing costs
of major medical
insurance
More employers to
self-fund their plans
and manage their
risks with stop-loss
insurance
1 |
 Non-GAAP Measures
Adjusted Operating Income
Adjusted
Operating
Income
per
Common
Share
–
Diluted,
or
Operating
EPS
Adjusted Book Value
Operating Return on Average Equity, or Operating ROAE
Tangible Book Value
27
Adjusted operating income consists of net income, less after-tax net realized investment gains
(losses), plus after-tax net investment gains (losses) on our fixed indexed annuity
(FIA) options. Net income is the most directly comparable GAAP measure to adjusted operating
income. Adjusted operating income per common share – diluted, consists of adjusted operating income,
divided by the GAAP-basis weighted average diluted shares outstanding. Net
income per common share – diluted is the most directly comparable GAAP measure to adjusted
operating income per common share – diluted. Adjusted book value consists of stockholders’ equity, less accumulated other comprehensive income
(AOCI). Stockholders’ equity is the most directly comparable GAAP measure to
adjusted book value. Operating return on average equity, or operating ROAE, consists of adjusted operating income for the
most recent four quarters, divided by average adjusted book value, both of which are
non-GAAP measures. We measure average adjusted book value by averaging adjusted book value
for the most recent five quarters. Return on stockholders’ equity, or ROE, is the most directly
comparable GAAP measure. Return on stockholders’ equity for the most recent four quarters is
calculated as net income for such period divided by the average stockholders’ equity for
the most recent five quarters. Tangible book
value is a non-GAAP financial measure calculated as stockholders’ equity excluding deferred policy acquisition costs,
goodwill and other non-tangible assets. Stockholders’ equity is the most directly comparable
GAAP measure to tangible book value. |
 Reconciliation of Non-GAAP Measures
28
Twelve Months Ended
December 31
2011
2010
Net income
$199.6
$200.9
Less: Net realized investment gains (net of
taxes)
4.6
25.9
Add: Net investment gains (losses) on FIA
options (net of taxes)
(0.9)
0.2
Adjusted operating income
$194.1
$175.2
Adjusted operating income per diluted share
of common stock
1,2
$ 1.41
$ 1.29
Twelve Months Ended
December 31
2011
2010
Return on equity (ROE)
7.3%
9.3%
Average book value
$ 2,730.6
$ 2,167.9
Operating return on average equity (ROAE)
9.5%
9.8%
Average adjusted book value
$ 2,033.7
$ 1,795.4
1
A non-GAAP measure; see slide 27 for a definition of this measure.
2
Diluted weighted average shares outstanding for the 12 months ended Dec. 31, 2011 and 2010 were
137.503 million and 135.618 million, respectively.
$ in millions
$ in millions
1
1 |
 Reconciliation of Non-GAAP Measures (cont.)
29
Twelve Months Ended
December 31
2011
2010
Segment pretax adjusted operating income (loss):
Benefits
$ 79.2
$ 71.6
Deferred Annuities
102.1
81.3
Income Annuities
35.1
33.2
Life
64.9
74.9
Other
(10.7)
(11.4)
Pretax adjusted operating income
270.6
249.6
Add: Net realized investment gains, excluding net
investment gains (losses) on FIA options
8.4
39.5
Income from operations before income taxes
$279.0
$289.1
$ in millions
$ in millions |
 Reconciliation of Non-GAAP Measures (cont.)
$ in millions
As of Dec. 31,
2011
Total stockholders‘
equity
3,134.0
Less:
Deferred policy acquisition costs
215.4
Goodwill
30.4
Intangible assets
26.7
Other non-tangible assets
63.6
Tangible book value
$ 2,797.9
30
1
A non-GAAP measure; see slide 27 for a definition of this measure.
1 |
 Symetra®
and the Symetra logo are registered service marks of Symetra Life Insurance
Company, 777 108 Ave NE, Suite 1200, Bellevue, WA 98004.
th |