Attached files
| file | filename |
|---|---|
| 8-K - FORM 8-K - HERITAGE FINANCIAL CORP /WA/ | d301870d8k.htm |
 Brian
L. Vance, President and CEO Donald J. Hinson, Senior Vice President &
CFO Exhibit 99.1
Investor Presentation
Investor Presentation
1
1
st
st
Quarter 2012
Quarter 2012
Heritage Financial Corporation
Heritage Financial Corporation |
 2
“Safe Harbor” statement under the Private Securities Litigation Reform Act of
1995: This presentation contains forward-looking statements that are subject to risks and
uncertainties, including, but not limited to: the credit risks of lending activities,
including changes in the level and trend of loan delinquencies and write-offs and changes in our
allowance for loan losses and provision for loan losses that may be impacted by
deterioration in the housing and commercial real estate markets; changes in general economic
conditions, either nationally or in our market areas; changes in the levels of general
interest rates, and the relative differences between short and long term interest rates, deposit
interest rates, our net interest margin and funding sources; fluctuations in the demand
for loans, the number of unsold homes and other properties and fluctuations in real estate
values in our market areas; results of examinations of us by the Board of Governors of
the Federal Reserve System (the “Federal Reserve Board”) and of our bank subsidiaries by
the Federal Deposit Insurance Corporation (the “FDIC”), the Washington State
Department of Financial Institutions, Division of Banks (the “Washington DFI”) or other regulatory
authorities, including the possibility that any such regulatory authority may, among
other things, require us to increase our reserve for loan losses, write-down assets, change our
regulatory capital position or affect our ability to borrow funds or maintain or
increase deposits, which could adversely affect our liquidity and earnings; legislative or regulatory
changes that adversely affect our business including changes in regulatory policies and
principles, including the interpretation of regulatory capital or other rules, the interpretation
of regulatory capital or other rules including changes from the Dodd-Frank Wall
Street Reform and Consumer Protection Act and regulations that have been or will be promulgated
thereunder; our ability to control operating costs and expenses; the use of estimates
in determining fair value of certain of our assets, which estimates may prove to be incorrect
and result in significant declines in valuation; difficulties in reducing risk
associated with the loans on our balance sheet; staffing fluctuations in response to product demand or the
implementation of corporate strategies that affect our workforce and potential
associated charges; computer systems on which we depend could fail or experience a security
breach; our ability to retain key members of our senior management team; costs and
effects of litigation, including settlements and judgments; our ability to implement our branch
expansion strategy; our ability to implement our expansion strategy; our ability to
successfully integrate any assets, liabilities, customers, systems, and management personnel we
have acquired including the Cowlitz Bank and Pierce Commercial Bank transactions or may
in the future acquire into our operations and our ability to realize related revenue
synergies and cost savings within expected time frames and any goodwill charges related
thereto; or may in the future acquire into our operations and our ability to realize related
revenue synergies and cost savings within expected time frames and any goodwill charges
related thereto; risks relating to acquiring assets or entering markets in which we have
not previously operated and may not be familiar, changes in consumer spending,
borrowing and savings habits; the availability of resources to address changes in laws, rules, or
regulations or to respond to regulatory actions; adverse changes in the securities
markets; inability of key third-party providers to perform their obligations to us; changes in
accounting policies and practices, as may be adopted by the financial institution
regulatory agencies or the Financial Accounting Standards Board, including additional guidance
and interpretation on accounting issues and details of the implementation of new
accounting methods; other economic, competitive, governmental, regulatory, and technological
factors affecting our operations, pricing, products and services; and other risks
detailed from time to time in our filings with the Securities and Exchange Commission.
The Company cautions readers not to place undue reliance on any forward-looking
statements. Moreover, you should treat these statements as speaking only as of the date they
are made and based only on information then actually known to the Company. The Company
does not undertake and specifically disclaims any obligation to revise any forward-
looking statements to reflect the occurrence of anticipated or unanticipated events or
circumstances after the date of such statements. These risks could cause our actual results
for 2011 and beyond to differ materially from those expressed in any
forward-looking statements by, or on behalf of, us, and could negatively affect the Company’s operating and
stock price performance.
Forward Looking Statement |
 •
Company & Economic Information
•
Recent Growth Initiatives
•
Financial Performance
•
Core Strategies
3
Overview |
 Company
and Economic Company and Economic
Information
Information
4 |
 Financial Highlights
Total Assets
$1.37 billion
Net Loans
$1.00 billion
Total Deposits
$1.14 billion
Tangible Common Equity
$188.0 million
Loan/Deposit Ratio
88.6%
Coverage Ratio (1)
103.5%
Core Deposit Ratio (2)
93.7%
Net Interest Margin
5.18% (Q4’11) 5.41% (FY2011)
Cost of Funds
0.58% (Q4’11) 0.71% (FY2011)
PTPP ROAA (3)
1.91% (Q4’11) 1.75% (FY2011)
(1) Allowance for loan loss/nonperforming loans (originated loans only)
(2) All deposits less wholesale CDs and CDs over $250,000
(3) Pre-tax, pre-provision return on average assets
Note: Numbers rounded for presentation purposes only
Financial data as of December 31, 2011 unless otherwise indicated
5
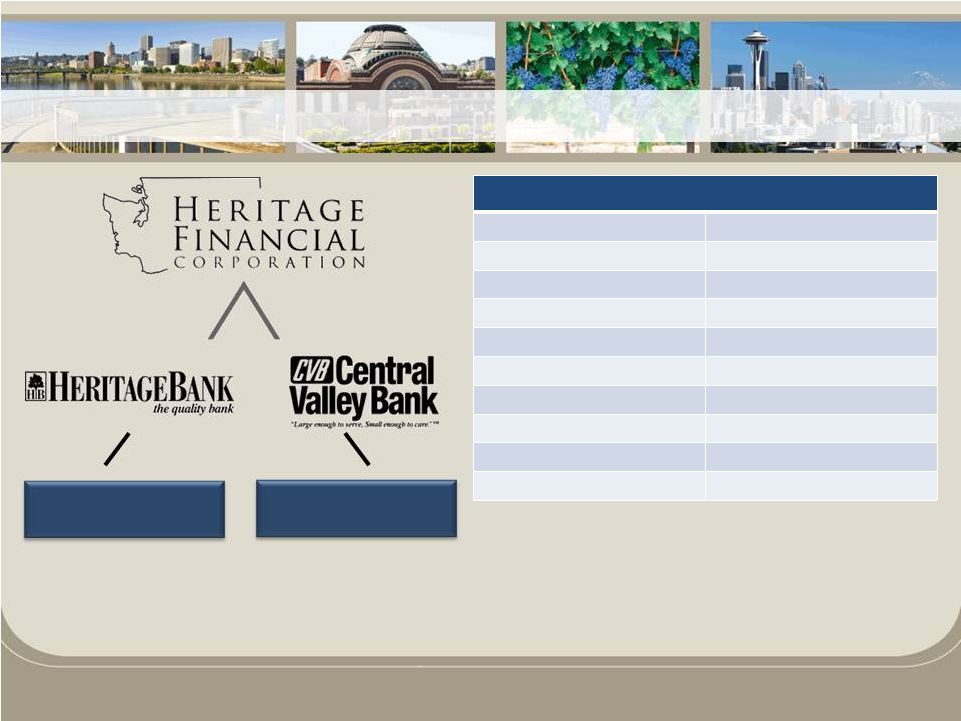
Total assets: $1.20 billion
Branches: 27
Total assets: $165.6 million
Branches: 6
Corporate Structure |
 •
33 Branches
–
27 Heritage Bank
branches along I-5 corridor
–
6 Central Valley Bank
branches in Central WA
6
Our Market Area |
 •
We have not yet achieved measurable and
sustainable economic growth in the Pacific
Northwest
•
Our local economy will continue to struggle until
unemployment and real estate values improve
•
However, we are beginning to see signs of
improvement in some areas
7
Economic Outlook
Economic Outlook |
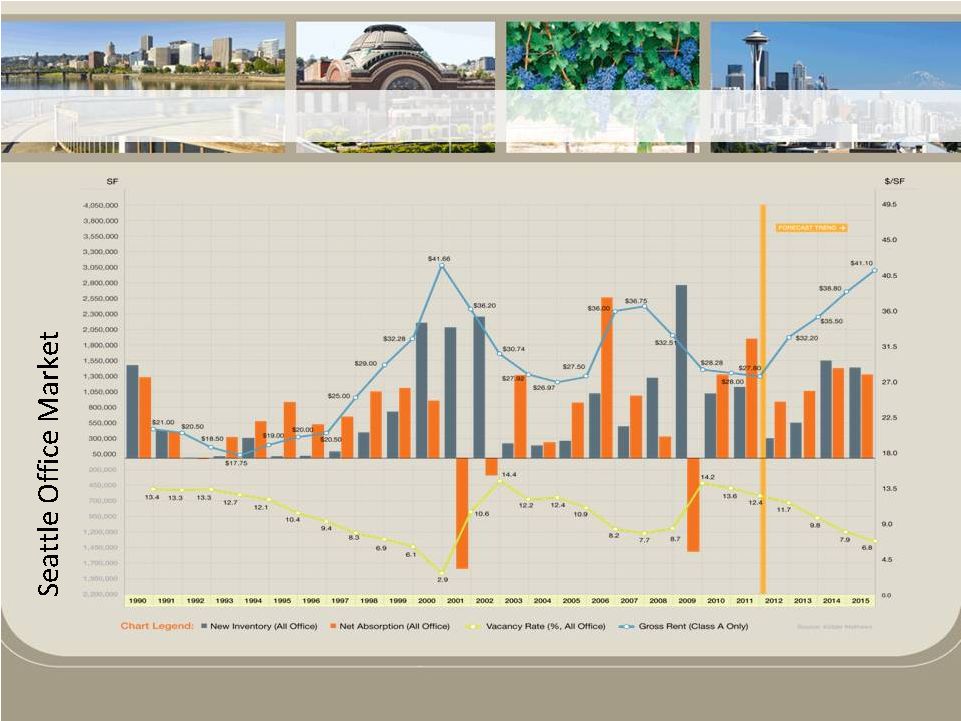
 Source:
Kidder Mathews Q4 Industrial Report 8
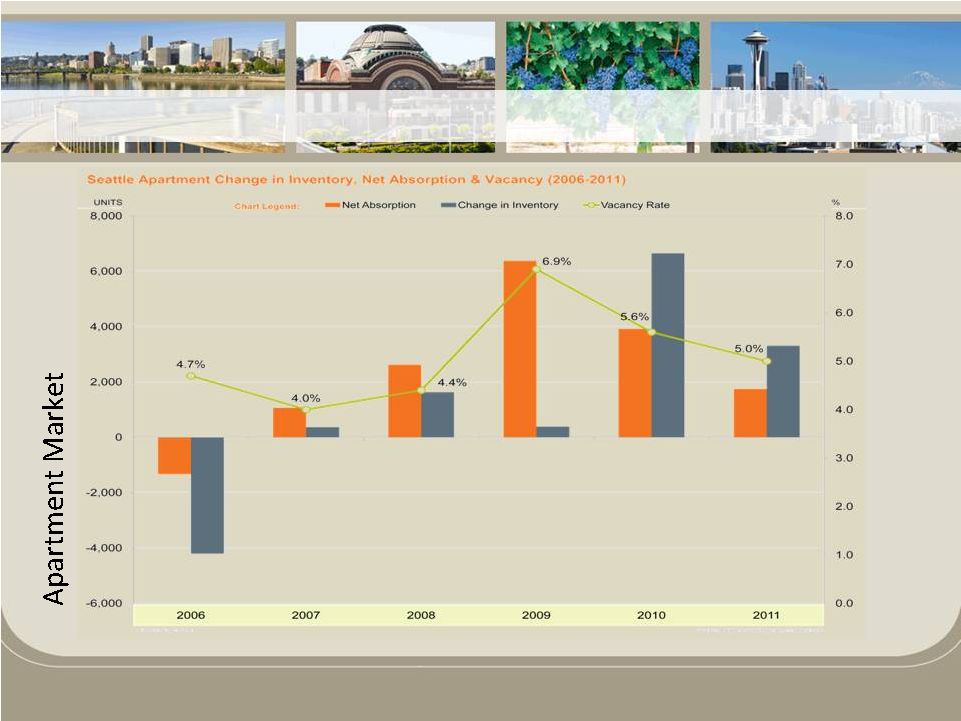
Economic Information |
 Source: Kidder Mathews Q4 Industrial Report
9
Economic Information |
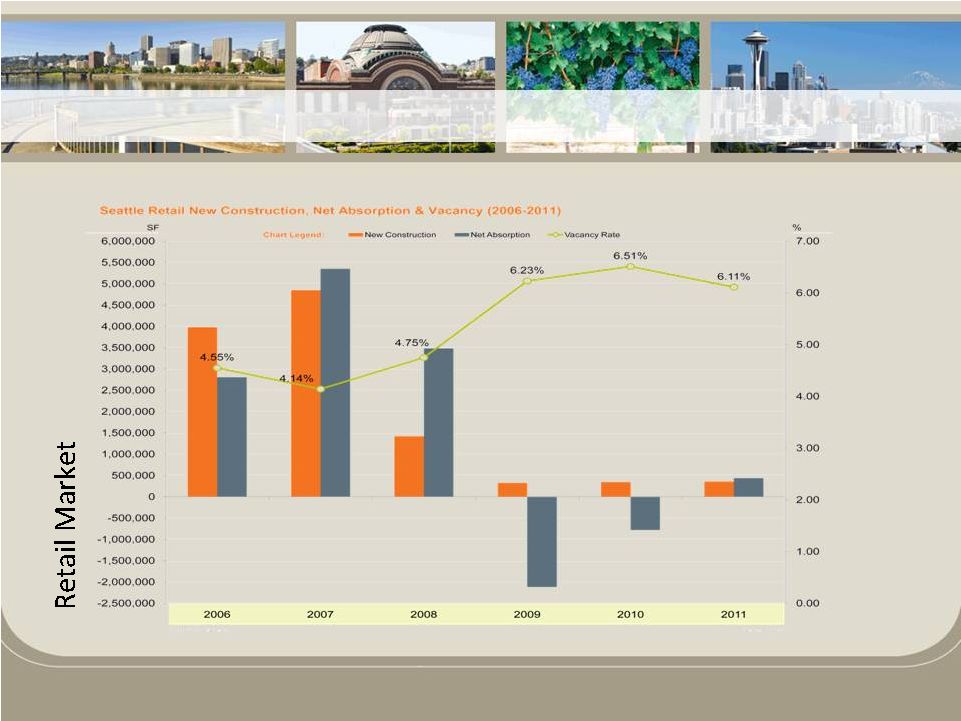
 Source: Kidder Mathews Q4 Industrial Report
10
Economic Information |
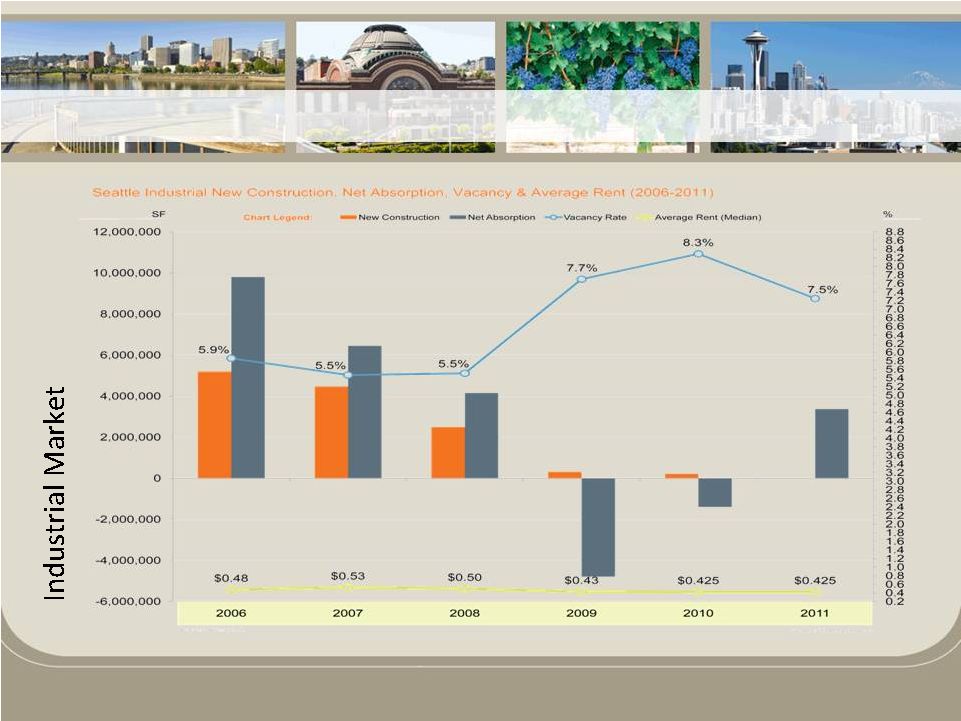
 Source: Kidder Mathews Q4 Industrial Report
11
Economic Information |
 According to PwC and ULI “Emerging Trends in Real Estate
2012”
survey, Seattle ranks as follows for investment
opportunities among all metro areas in the Nation:
Source: Urban Land Institute, in conjunction with Price Waterhouse Cooper, conducted
an annual survey of commercial real estate metrics and trends.
12
Economic Outlook
•
#1
in
Retail
Real
Estate
•
#1
in
Industrial
Real
Estate
•
#2
in
Office
Real
Estate
•
#3
in
Apartment
Real
Estate
•
#7
in
Hotel
Real
Estate |
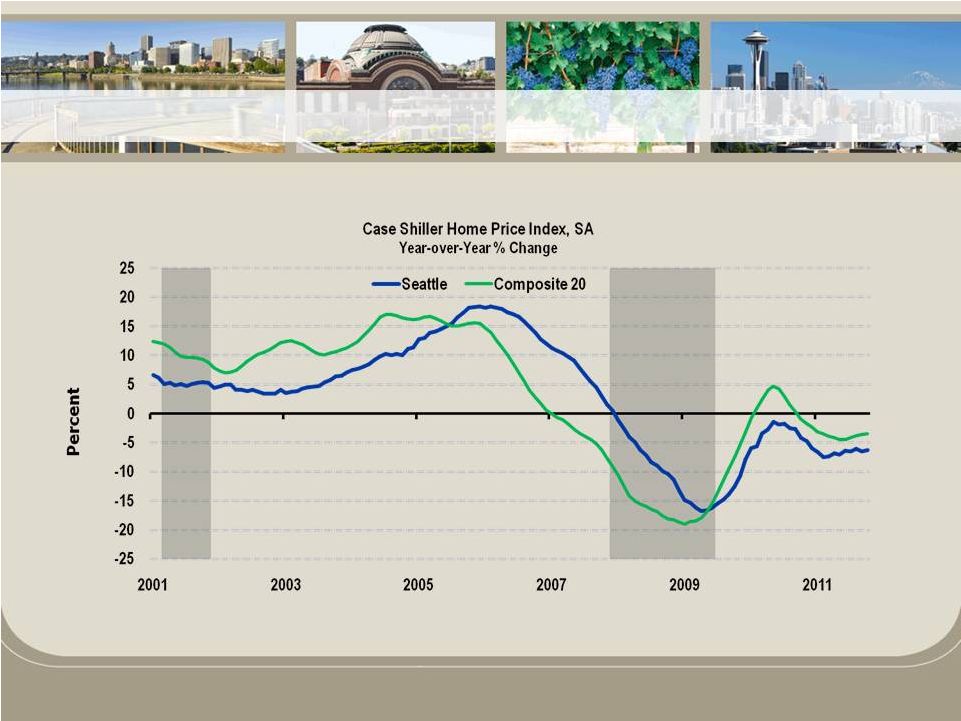 Single-family home prices continue to decline
Oct 2011:
U.S. is down 3.4%; SEA is down 6.2%
Source: S&P/Case-Shiller; data through October 2011
13
Economic Information |
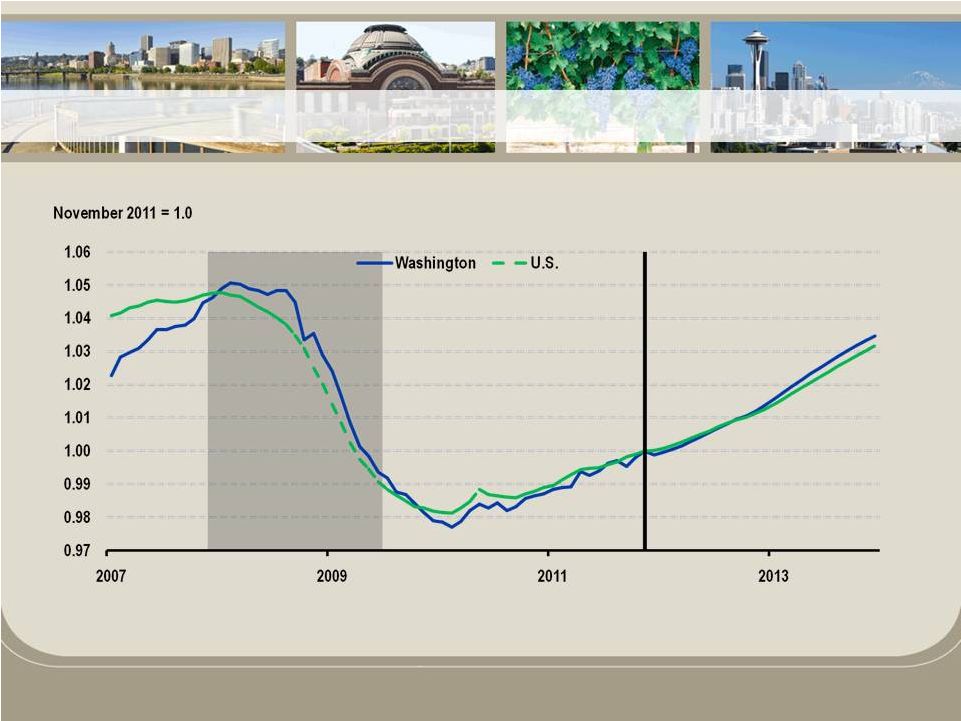 WA
employment peaked 1 month after U.S. (Feb. 2008 vs. Jan. 2008) Both WA and the
U.S. reached a trough in Feb. 2010 Both WA and the U.S. won’t reach their
previous peak until after 2013 WA employment will recover slightly faster than the
U.S. 14
Economic Information
Source: WA State Economic and Revenue Forecast Council; November 2011 forecast |
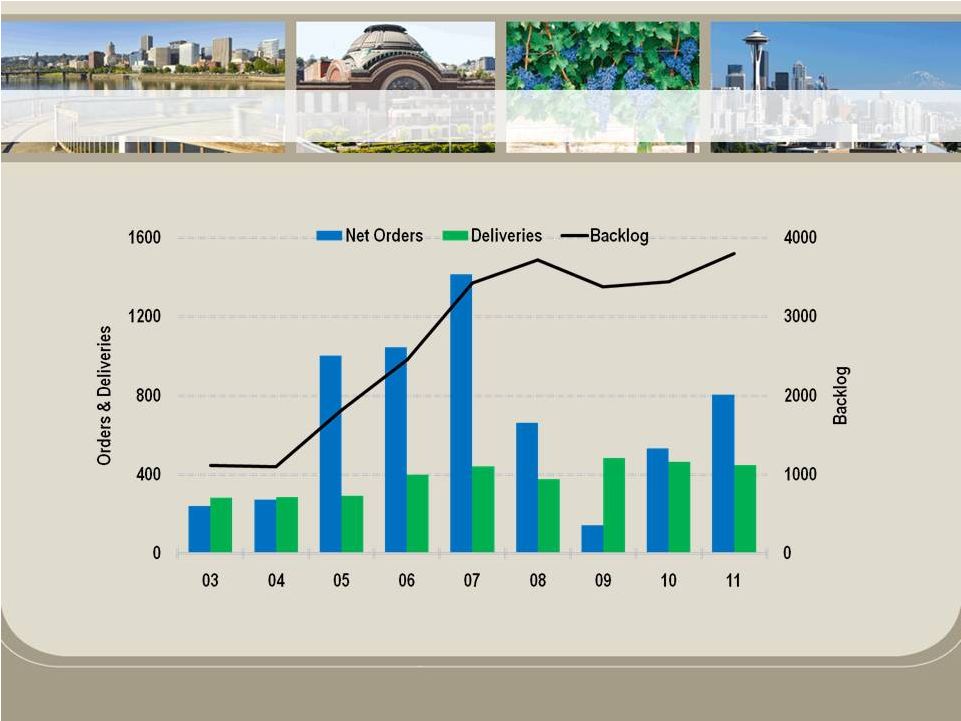 Excludes the military’s new refueling tanker
Source: Boeing; data through December 2011
Boeing has over 7 years of commercial orders on its books
15
Economic Information |
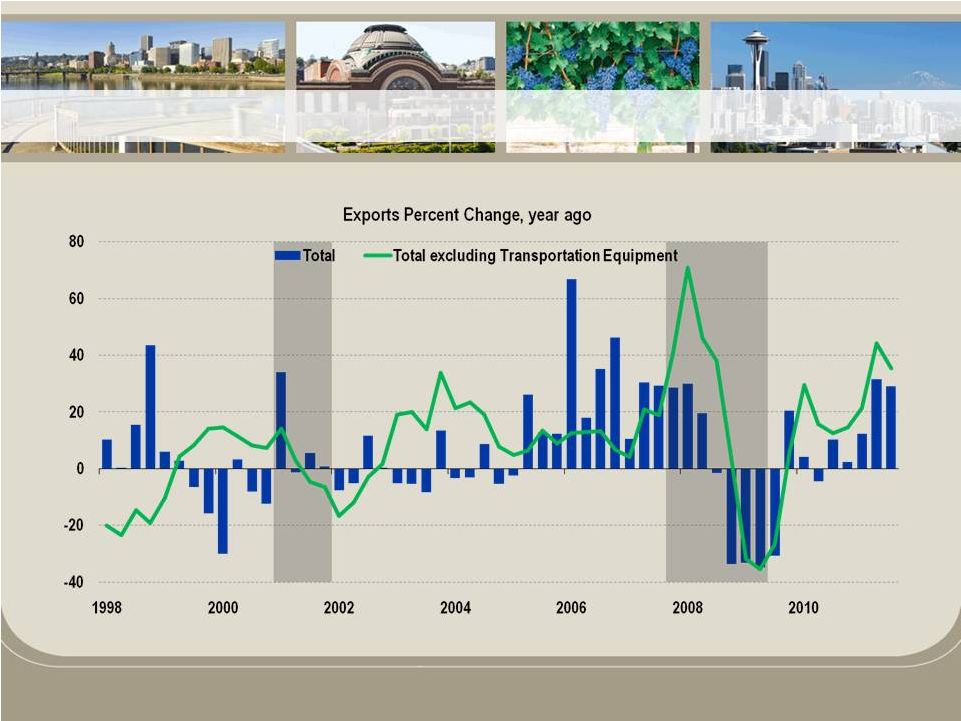 Total
exports were up 29% y/y in Q3 Source: Wiser Trade Data; through Q3 2011
WA export growth is strong, and will help state outperform in the recovery
16
Economic Information |
 Recent
Growth Initiatives Recent Growth Initiatives
17 |
 •
Organic Growth
•
FDIC Assisted Transactions
•
Open Bank M&A Activity
18
Growth Strategies |
 •
Core deposits showing strong growth
–
Non-maturity deposits (total deposits less CDs)
•
Increased $73.1 million, or 10.0%, during 2011
•
Non-maturity deposits increased to 71.0% of total deposits
•
Demand deposits increased $36.4 million, or 18.7%, during 2011
•
Demand deposits increased to 20.4% of total deposits
19
Organic Growth |
 •
Deposits at acquired branches reporting steady
growth since acquisition
–
Former Cowlitz Bank branches (acquired in July
2010) increased deposits by 19.5% during 2011
20
Organic Growth |
 •
2011 Lender Recruitment
–
During 2011 we hired 7 new Lenders and a Market
Executive
•
3 lenders in King County (Seattle/Bellevue/Kent)
•
2 lenders in Pierce County (Tacoma)
•
1 lender in Thurston County (Olympia)
•
1 lender in Portland, OR
•
1 Market Executive for Vancouver, WA / OR
21
Organic Growth |
 •
Q4 2011 Loan Growth
–
Originated loans
•
Increased $35 million, or 4.4%
–
Net loans (including acquired portfolios)
•
Increased $20.2 million, or 2.0%
•
2011 Loan Growth
–
Originated loans
•
Increased $95.9 million, or 12.9%
22
Organic Loan Growth |
 •
FDIC Acquisitions
–
Successfully completed two FDIC acquisitions
–
Continue to participate in FDIC bidding process
–
Expect less than five closures in WA/OR in 2012
•
Open Bank
–
Opportunistically review deals
23
Acquisitions |
 Financial Performance
24 |
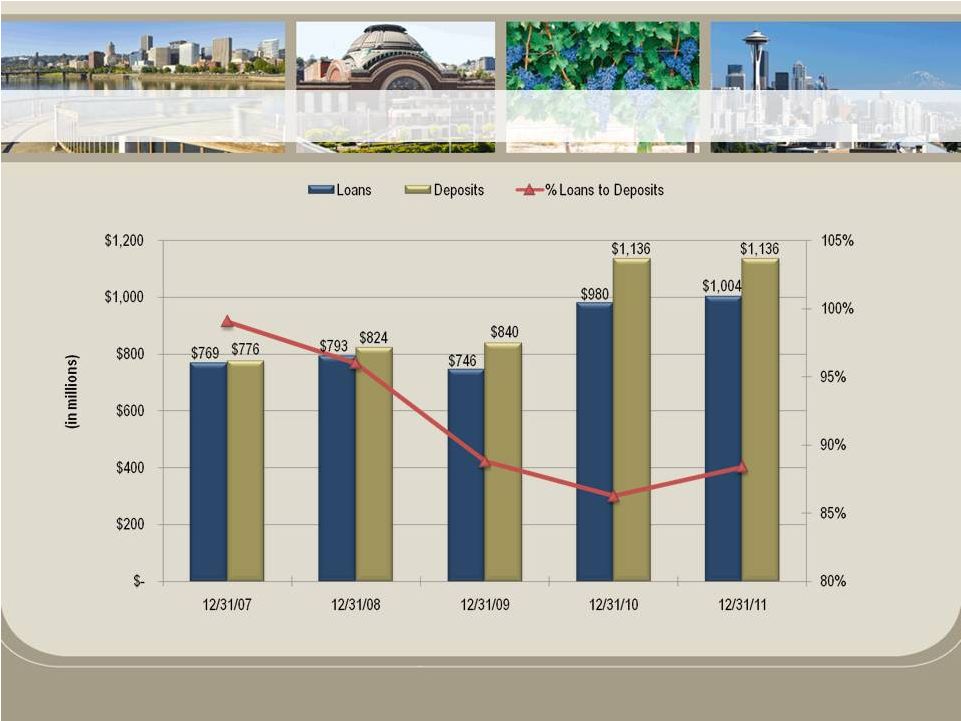 25
Loan and Deposit Growth |
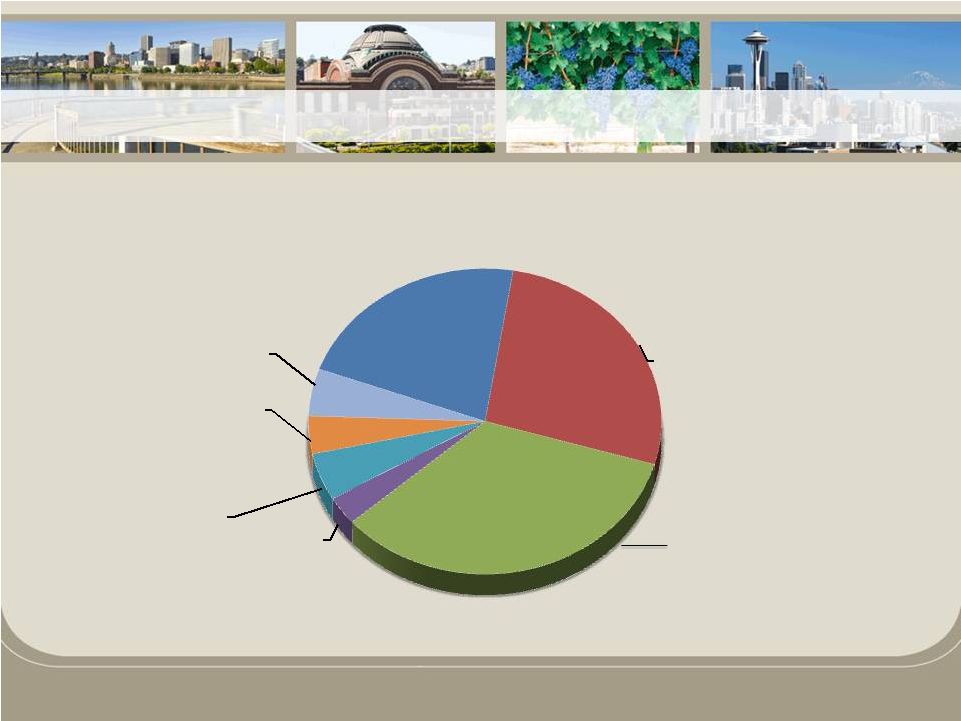 Loan
Portfolio Financial data as of December 31, 2011
26
CRE Owner
Occupied
22%
CRE Non-
Owner
Occupied
27%
Commercial &
Industrial
34%
Residential
Construction
3%
Commercial
Construction
5%
Residential Real
Estate
4%
Consumer
5%
Diversified Loan Portfolio |
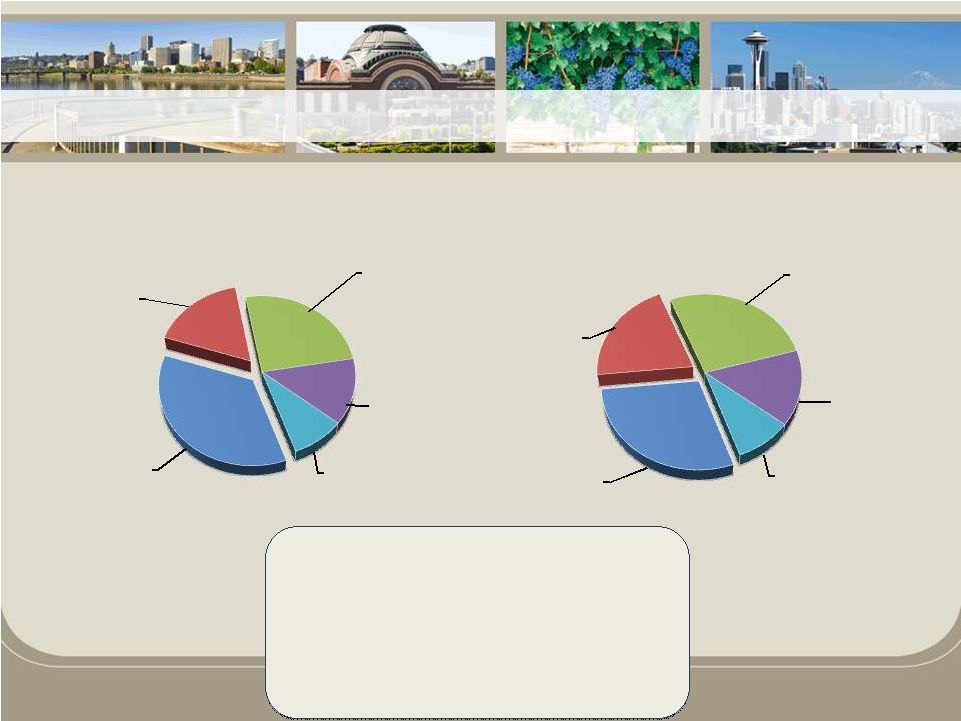   December
31, 2010 December 31, 2011
Deposit Composition
27
Attractive Deposit Base
CDs
36%
Non-
Interest
Bearing
Demand
17%
Interest
Checking
(NOW)
25%
Money
Market
13%
Savings
9%
CDs
29%
Non-
Interest
Bearing
Demand
20%
Interest
Checking
(NOW)
27%
Money
Market
15%
Savings
9%
Financial Data as of December 31, 2011
–
Total Deposits
$1.1 billion
–
Total Non-Maturity Deposits
–
Non-Maturity Deposits / Total Dep.
–
Non-Int. Bearing Dep. / Total Dep.
20.4%
–
Cost of Int. Bear. Deposits
0.71%
–
Cost of Deposits
0.58%
$806 million
71.0% |
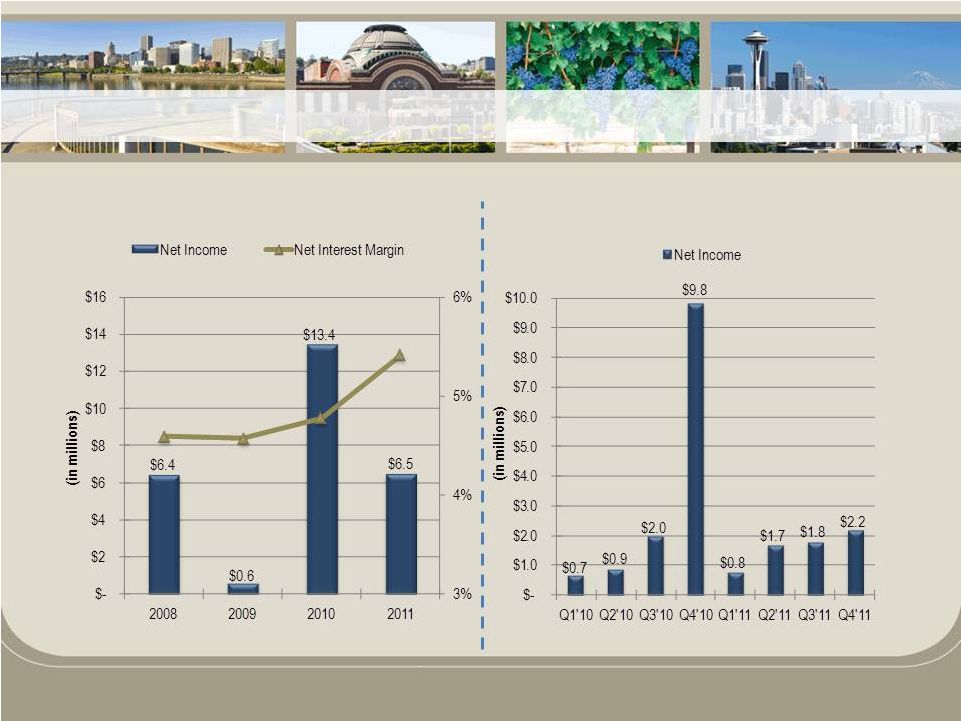 Annual
Earnings Quarterly Earnings
28
Annual Earnings |
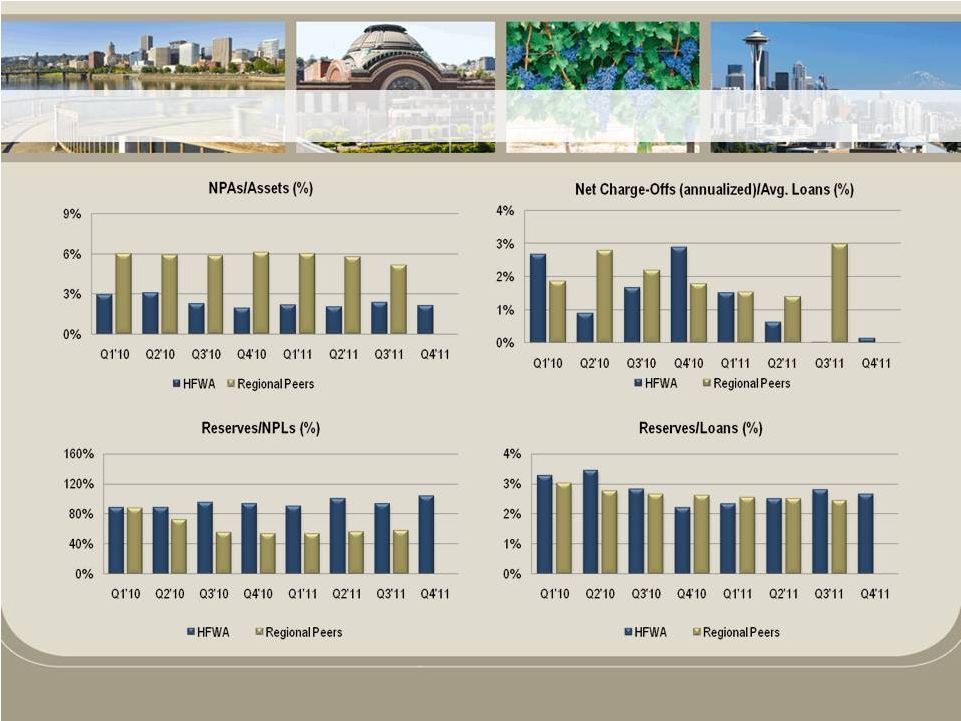 Peer
Source: SNL Financial Regional Peer Group (12): Ticker Symbols –
BANR, CACB, COLB, FFNW, HOME, NRIM, PCBK, PRWT, RVSB, TSBK, WBCO, WCBO
29
Credit Quality |
 •
Cash Dividends
–
Resumed quarterly cash dividend in Q2 2011 at $0.03
–
Increased quarterly dividend to $0.05 for Q3 and Q4 2011
–
Special dividend of $0.25 in Q4 2011
–
Increased quarterly dividend to $0.06 for Q1 2012
•
Stock Repurchases
–
Announced 5% repurchase program in Q3 2011
–
During 2011, repurchased 201,205 shares (26% of repurchase
program at an average price of $11.63)
30
Capital Management Strategies |
 Core
Strategies Core Strategies
31 |
 32
Maintain
Core
Quality Loan
Growth
Fill in PNW
Footprint
Leverage
Capital
Core Strategies |
 •
Experienced management team supported by a
strong Board of Directors
•
Disciplined approach to acquisitions
•
Well-positioned to take advantage of the right
opportunities
•
Continuing focus on building long-term franchise
value
•
Solid financial performance trends
33
Investment Value |
 Thank
You Thank You
Questions?
Questions?
Heritage Financial Corporation
Heritage Financial Corporation
34 |