Attached files
| file | filename |
|---|---|
| 8-K - FORM 8-K - CVR ENERGY INC | d296554d8k.htm |
 Credit Suisse Global Energy Conference
February 8, 2012
Exhibit 99.1 |
 1
1
1
1
1
This
presentation
should
be
reviewed
in
conjunction
with
CVR
Energy,
Inc.’s
Third
Quarter
earnings
conference
call
held
on
November
3,
2011.
The
following
information
contains
forward-looking
statements
based
on
management’s
current
expectations
and
beliefs,
as
well
as
a
number
of
assumptions
concerning
future
events.
These
statements
are
subject
to
risks,
uncertainties,
assumptions
and
other
important
factors.
You
are
cautioned
not
to
put
undue
reliance
on
such
forward-looking
statements
(including
forecasts
and
projections
regarding
our
future
performance)
because
actual
results
may
vary
materially
from
those
expressed
or
implied
as
a
result
of
various
factors,
including,
but
not
limited
to
(i)
those
set
forth
under
“Risk
Factors”
in
CVR
Energy,
Inc.’s
Annual
Report
on
Form
10-K,
Quarterly
Reports
on
Form
10-Q
and
any
other
filings
CVR
Energy,
Inc.
makes
with
the
Securities
and
Exchange
Commission,
and
(ii)
those
set
forth
under
“Risk
Factors”
and
“Cautionary
Note
Regarding
Forward-Looking
Statements”
in
the
CVR
Partners,
LP
Prospectus
and
any
other
filings
CVR
Partners,
LP
makes
with
the
Securities
and
Exchange
Commission.
CVR
Energy,
Inc.
assumes
no
obligation
to,
and
expressly
disclaims
any
obligation
to,
update
or
revise
any
forward-looking
statements,
whether
as
a
result
of
new
information,
future
events
or
otherwise. |
 2
2
2
2
2
Management Attendees
Jack Lipinski
Chief Executive Officer
Ed Morgan
Executive Vice President of Investor Relations
Jay Finks
Director of Finance |
 Company Overview |
 4
4
4
4
4
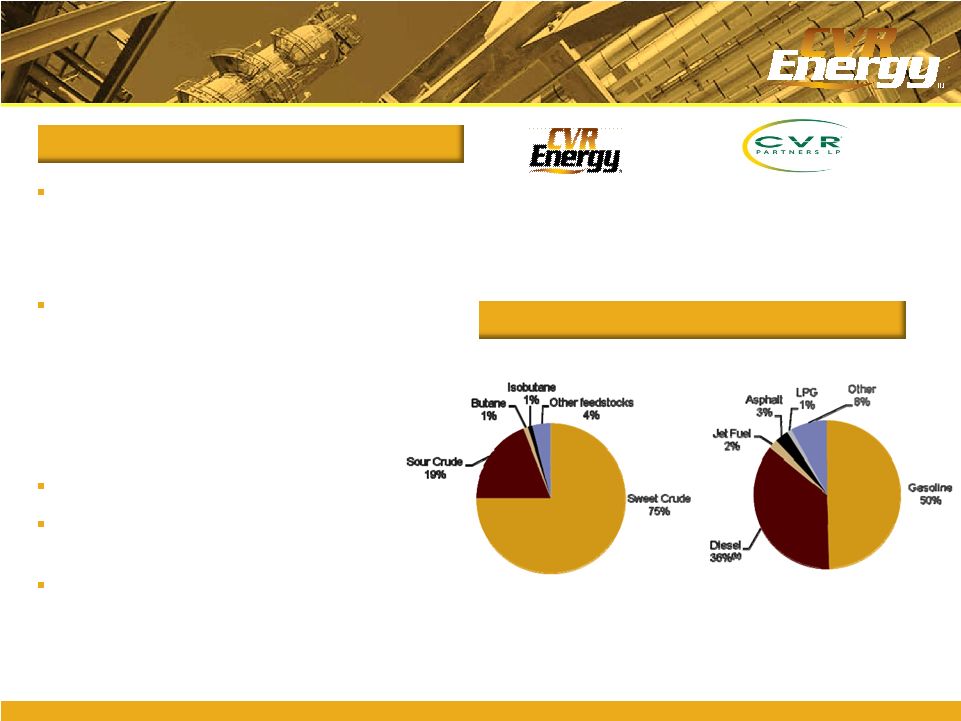
Pro Forma Company Overview
Two top-tier Mid-Continent refineries
–
115,000 bpd Coffeyville, Kansas refinery
–
70,000 bpd Wynnewood, Oklahoma
Refinery
A nitrogen fertilizer plant using pet coke
gasification (CVR Partners LP)
–
Rated capacity of 1,225 tpd ammonia;
2,025 tpd UAN Nitrogen
–
Current $100.0 million expansion
ongoing to increase UAN capacity by
400,000 tons
Operates in higher margin markets
Logistics assets supporting both
businesses
Financial flexibility
Pro Forma LTM Refinery Feedstock &
Product Slate
(a)
CVR Energy: About Us
Note: LTM as of September 30, 2011.
(a)
Pro forma based on weighted average of refinery capacity.
(b)
CVR distillate assumed to be diesel for pro forma.
NYSE–
CVI
Market Cap(1) -
$2.3 billion
NYSE–
UAN
Market Cap(1) -
$2.2 billion
CVI owns ~ 70%
(1)
As of 2/2/2012 |
 5
5
5
5
5
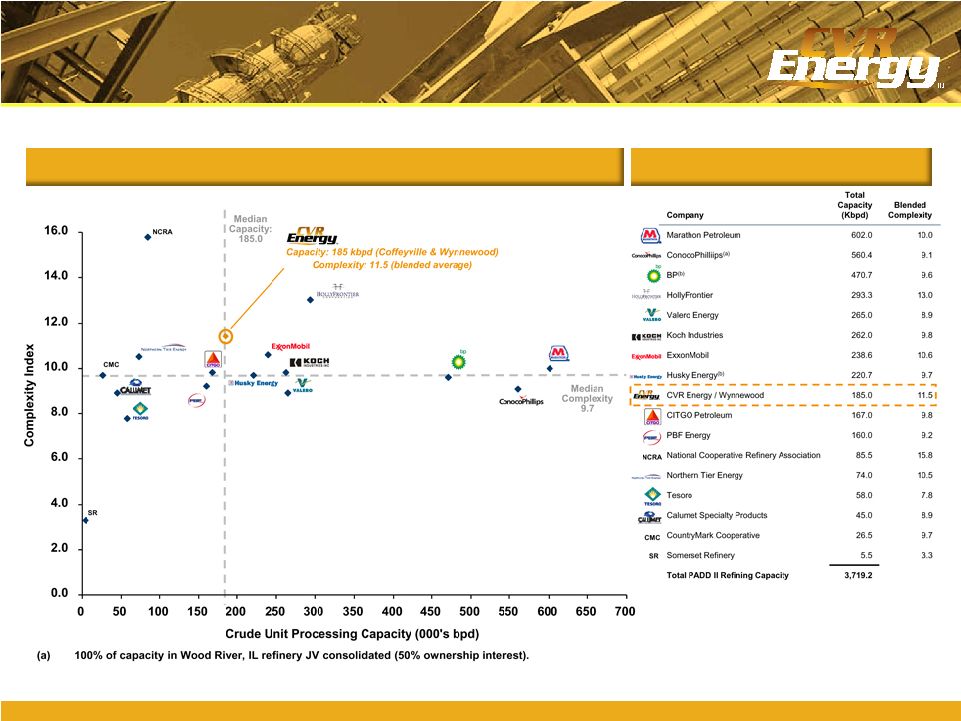
(b)
Includes 50% interest in JV in Toledo, OH refinery.
Source: EIA and Wall Street research
PADD II Consolidated Refinery Statistics –
By Owner
“Top Quartile”
Consolidated Asset Profile
PADD II Refiners
Well Positioned to Compete in
Underserved PADD II Region |
 6
6
6
6
6
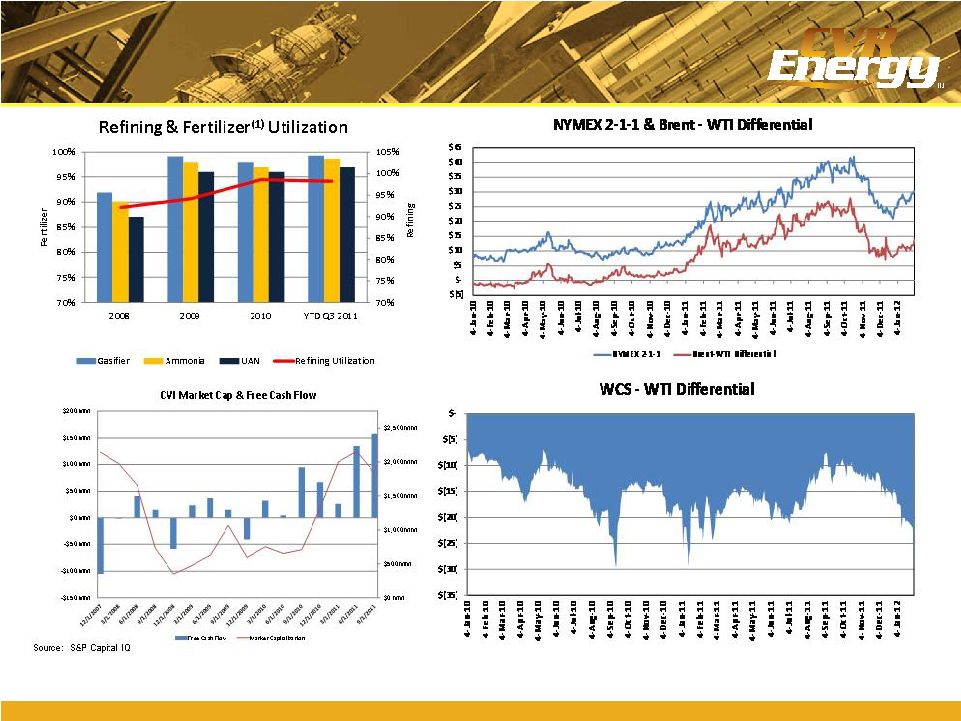
Key Business Drivers
(1) Adjusted for major scheduled turnaround, third-party outage on air
separation unit and UAN vessel rupture |
 7
7
7
7
7
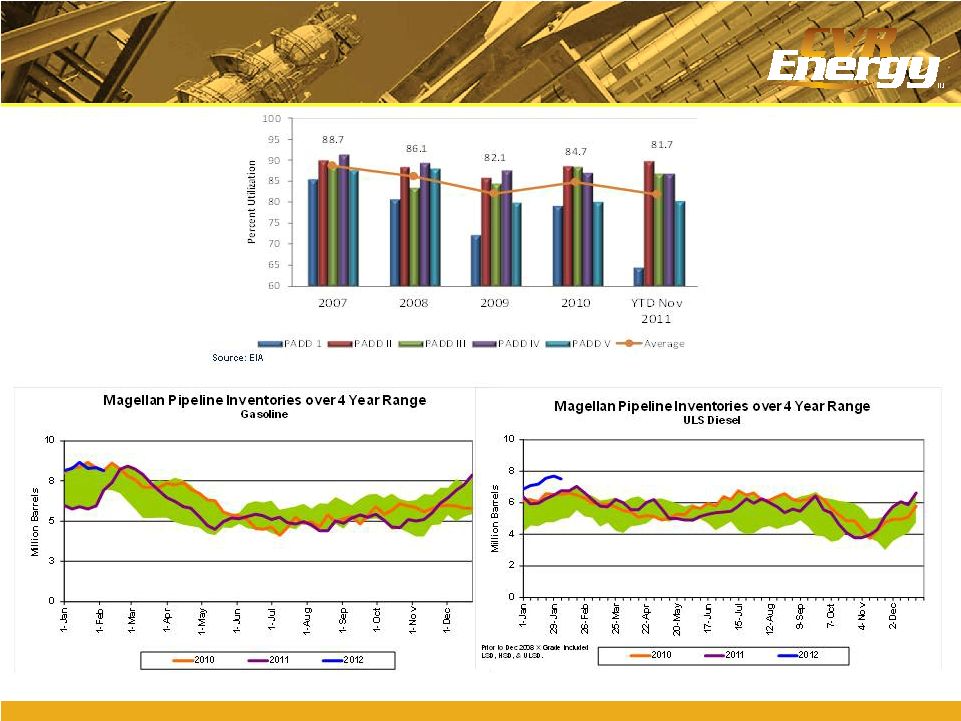
Utilization by PADD
Source: Magellan |
 8
8
8
8
8
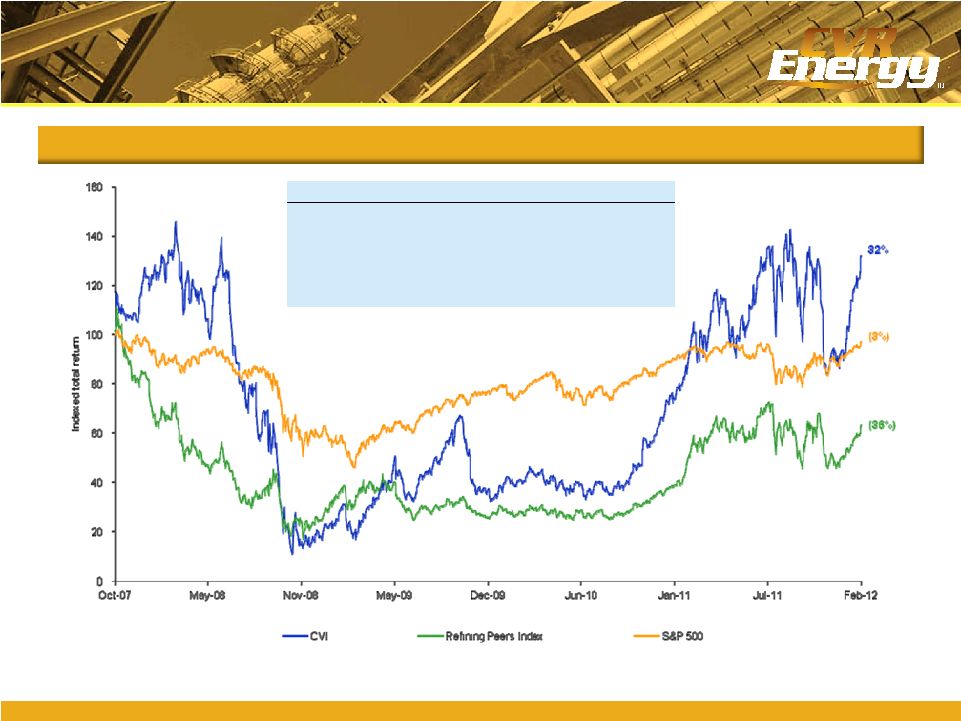
CVR Energy total shareholder return
Note:
Market data as of February 3, 2012. Peer index equal weighted and includes ALJ,
DK, HFC, TSO and WNR. CVI IPO price is based on closing price of the first day of
trading.
Source: Capital IQ
Refiners relative total return performance
CVI
Refining peers
S&P 500
Since IPO
32%
(36%)
(3%)
3-year
405%
78%
71%
2-year
230%
140%
28%
1-year
57%
34%
5%
1-month
36%
18%
5% |
 9
9
9
9
9
Building the business
Responsive to opportunities
Improving financial strength
Shareholder Value Focused
Increased total refining capacity to 185 kbpd
Integrating Wynnewood acquisition and
realizing synergies
Grown crude gathering to ~40,000 bpd
Expanding UAN capacity by 400,000 tpy
IPO of CVR Partners
Accretive acquisition of GWEC
Considering regular, fixed dividend initiation
Continuously evaluating alternatives to
realize CVR Partners’
value
Conservative leverage metrics
Tactical hedging for risk management
Ratings improvement to Ba3
Focus on maintaining discipline
Since IPO, CVR Energy is #1 in total
return among refining peers
(a)
and
remains focused on creating value for
shareholders
(a)
Total return based on period from October 23, 2007 to February 3, 2012. CVI
total return compared to total return of refining peers: ALJ, DK, HFC, TSO and WNR. |
 Refining Business |
 11
11
11
11
11
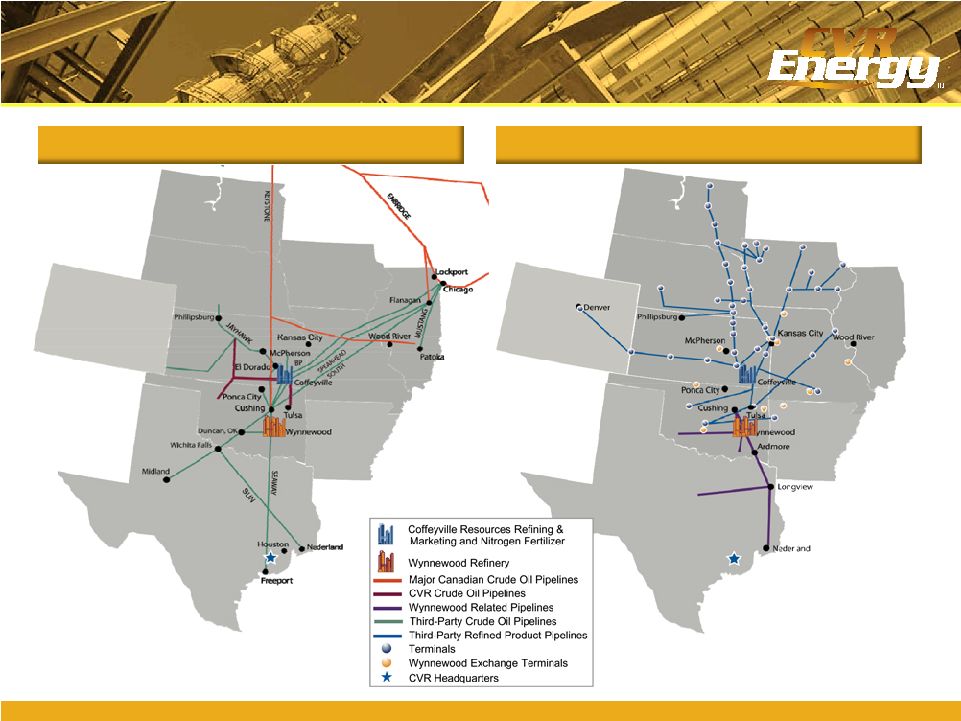
Consolidated Supply Network
Consolidated Marketing Network
Extensive Crude Oil Supply and
Product Distribution Network |
 12
12
12
12
12
Logistics Overview
Operations Map
Logistics Drives Profitability
(a)
Under construction.
Located 100 miles from the global crude hub of
Cushing, CVR has access to global crudes with
storage to optimize purchasing and crude slates
Shipper status of 35,000 bpd on Spearhead and
Keystone Pipelines
40,000+ bpd crude oil gathering system serving
Kansas, Oklahoma, Missouri and Nebraska
145,000 bpd proprietary pipeline system to
transport crude to the Coffeyville refinery
Currently constructing an additional one million
barrel storage facility in Cushing |
 13
13
13
13
13
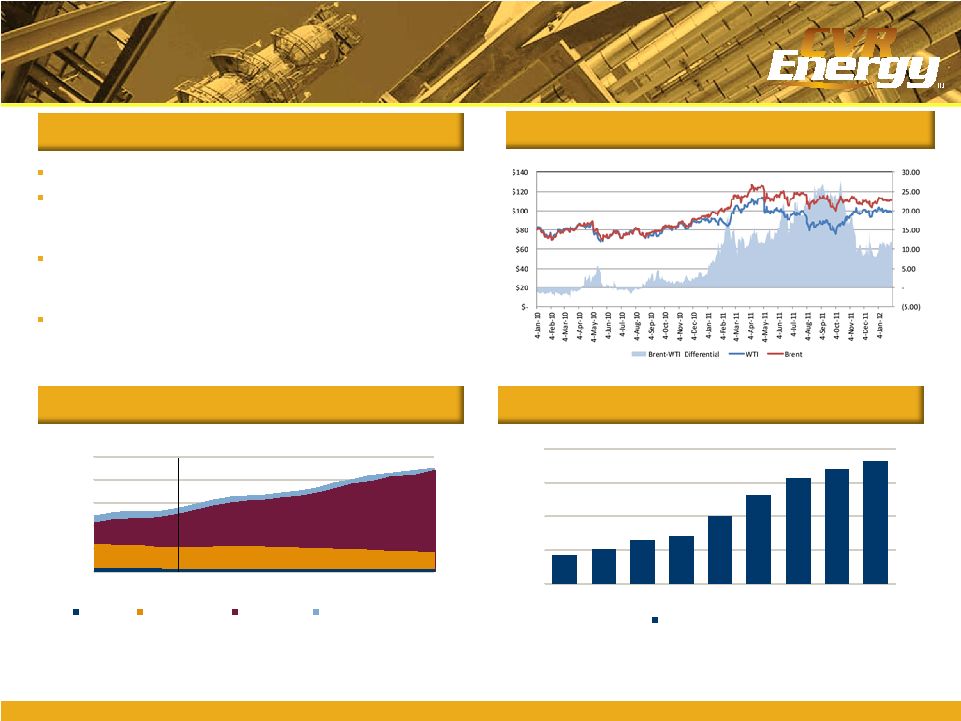
Overview
Historical & Projected Canadian Production
Historical & Projected Bakken Crude Production
Access to WTI Priced Crudes
(a)
Source: Canadian Association of Petroleum Producers June 2011 publication.
Source: Wood Mackenzie Upstream Service database
Both refineries benefit from the current WTI-Brent spread
WTI price-linked crudes are currently trading at
historically wide discounts to crudes, such as Brent
and
LLS
Growing production from the U.S. Bakken and Canada
flowing into Cushing, OK is contributing to this
differential
Expected pipeline capacity (Seaway reversal) necessary
to move production from Cushing to the Gulf Coast
projected to move 250k bpd heavy/sour by 2013
0
1,000
2,000
3,000
4,000
5,000
2005
2007
2009
2011
2013
2015
2017
2019
2021
2023
2025
Other
Conventional
Oil Sands
Atlantic Canada Offshore
(thousand barrels per day)
Actual
Forecast
87.6
102.1
132.7
142.3
201.8
262.9
313.1
340.0
362.4
0
100
200
300
400
2006
2007
2008
2009
2010
2011
2012
2013
2014
Bakken Crude Production
(thousand barrels per day)
Historical WTI-Brent Spread ($/bbl) |
 14
14
14
14
14
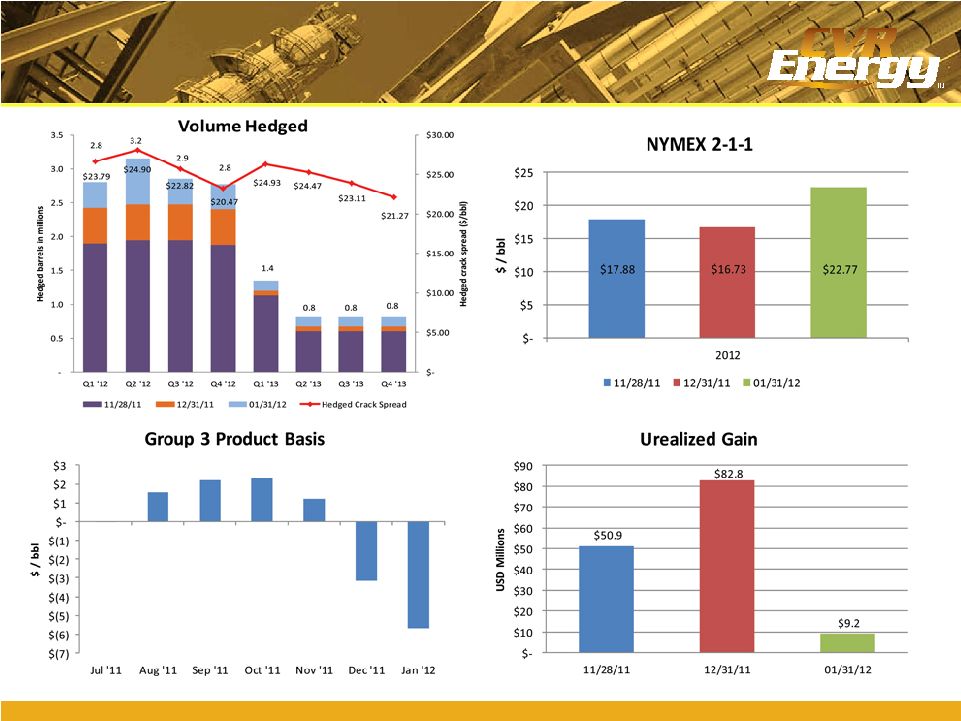
Hedging Activity |
 15
15
15
15
15
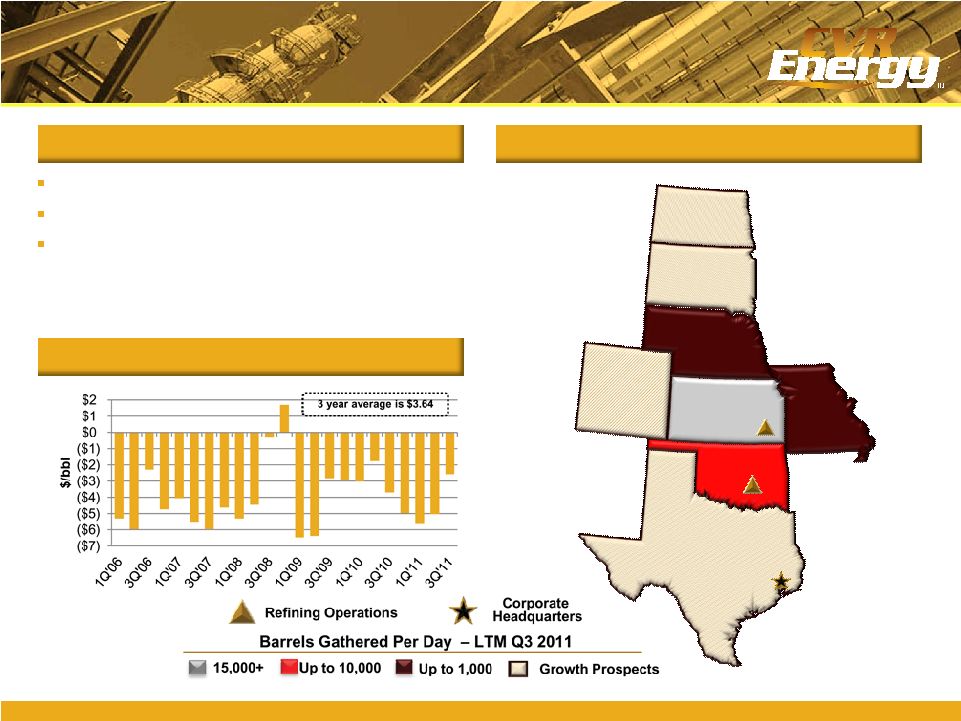
Overview
Asset Map
Total Consumed Crude Discount to WTI
Crude Gathering
Gathered 7,000 bpd in 2005
Today gathering over 40,000+ bpd
Growth target 10% –
20% per year for the
next 2 –
5 years
Texas
Oklahoma
Missouri
Nebraska
Kansas
Colorado
South Dakota
North Dakota |
 16
16
16
16
16
Phillipsburg
Valley Center
Station
Winfield
(Gathering South)
Plainville
(Gathering North)
Hooser
Station
Broome
Station
Humboldt
(Gathering South)
Coffeyville
East Tank Farm
Cushing
Plains/TEPPCO
Bartlesville
(Gathering South)
Shidler
(Gathering South)
55k
2,700k
Capacity 17,900 bpd w/DRA
Capacity 4,800 bpd
Capacity 24,000 bpd w/DRA
Capacity 110,000 bpd
Capacity 5,100 bpd
Capacity 4,700 bpd
Capacity 38,000 bpd
660k
160k
75k
200k
10k
40k
20k
20k
Jayhawk/Kaw
Pipeline system
150 miles
67 miles
23 miles
100 miles
Plains Pipeline
20 miles
19 miles
42 miles
1.6 miles
62.5 miles
Capacity 107,000 bpd
18 miles
156,000 b/d
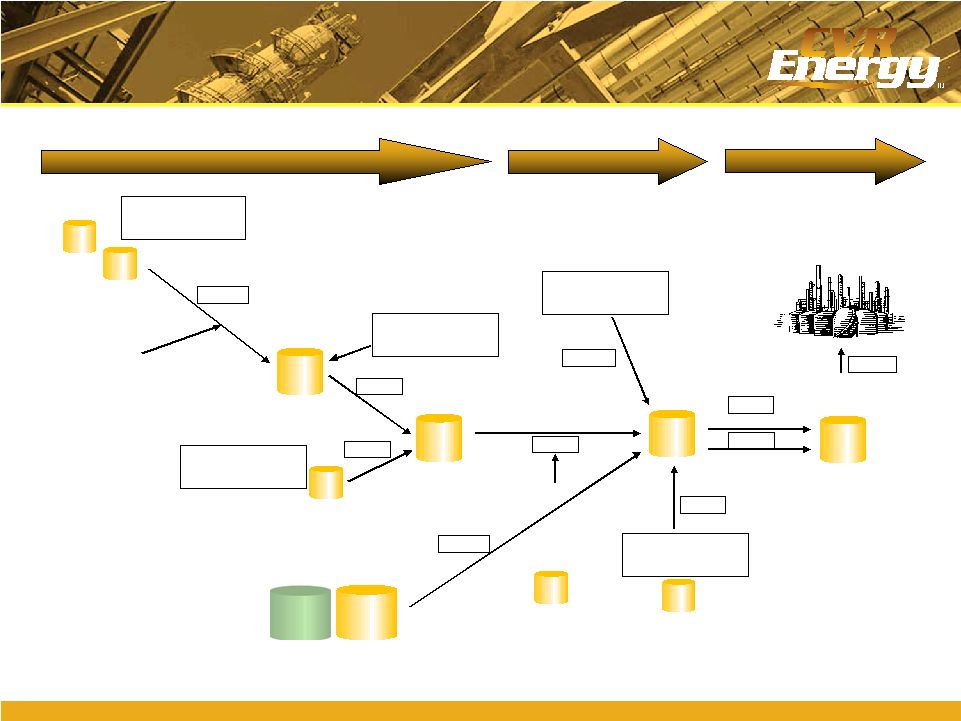
Crude Gathering System
“No Barrel Left Behind”
Gathered
Blended
Refined
Osage Station
1,000k |
 Nitrogen Fertilizer MLP |
 18
18
18
18
18
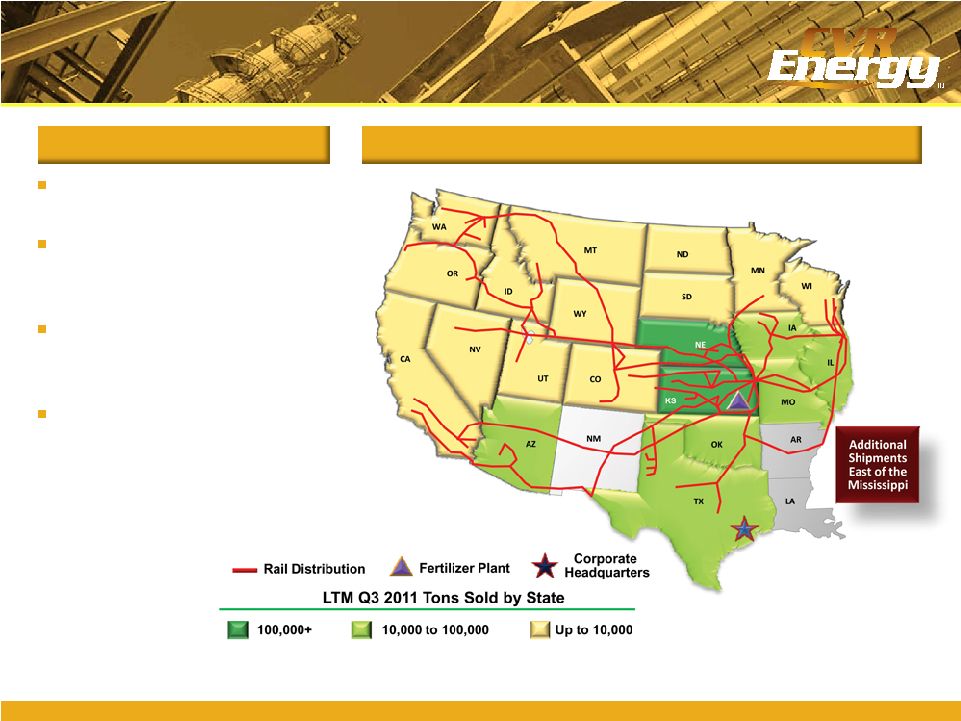
Overview
Fertilizer Operations
Strategically Located Assets and Logistics
Located in the corn belt
(on Union Pacific
mainline)
45% of corn planted in
2010 was within $35/UAN
ton freight rate of our plant
$25/ton transportation
advantage to corn belt vs.
US Gulf
Coast
No intermediate transfer,
storage, barge freight or
pipeline freight charges
LTM Q3 2011 Total Tons Sold ~ 731,500 |
 19
19
19
19
19
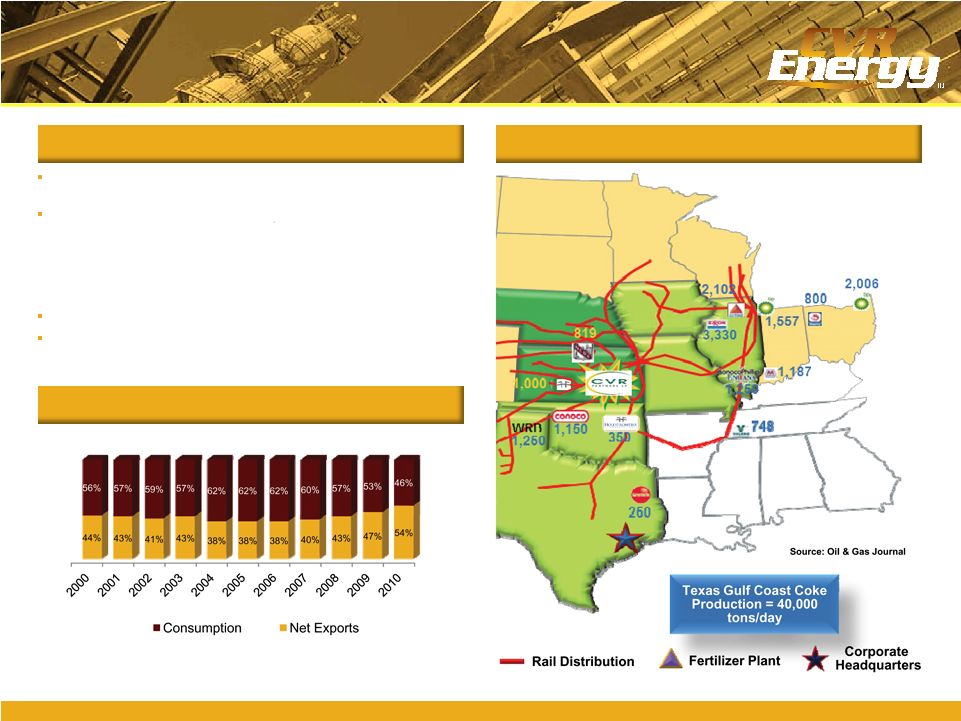
Overview
Abundant Supply of Third-party Pet Coke
US Pet Coke Exports and Consumption
Stable & Economic Feedstock
Source: EIA
CVR Partners LP 2008 –
2010 average daily coke demand ~ 1,378
tons/day
Coke gasification technology uses petroleum coke as a feedstock
–
Pet coke costs lower than natural gas costs per ton of ammonia
produced, and pet coke prices are significantly more stable than
natural gas prices
–
Over 70% of pet coke supplied by refinery through long-term
contract
Dual train gasifier configuration ensures reliability
Ammonia synthesis loop and UAN synthesis use same processes as
natural gas based producers |
 20
20
20
20
20
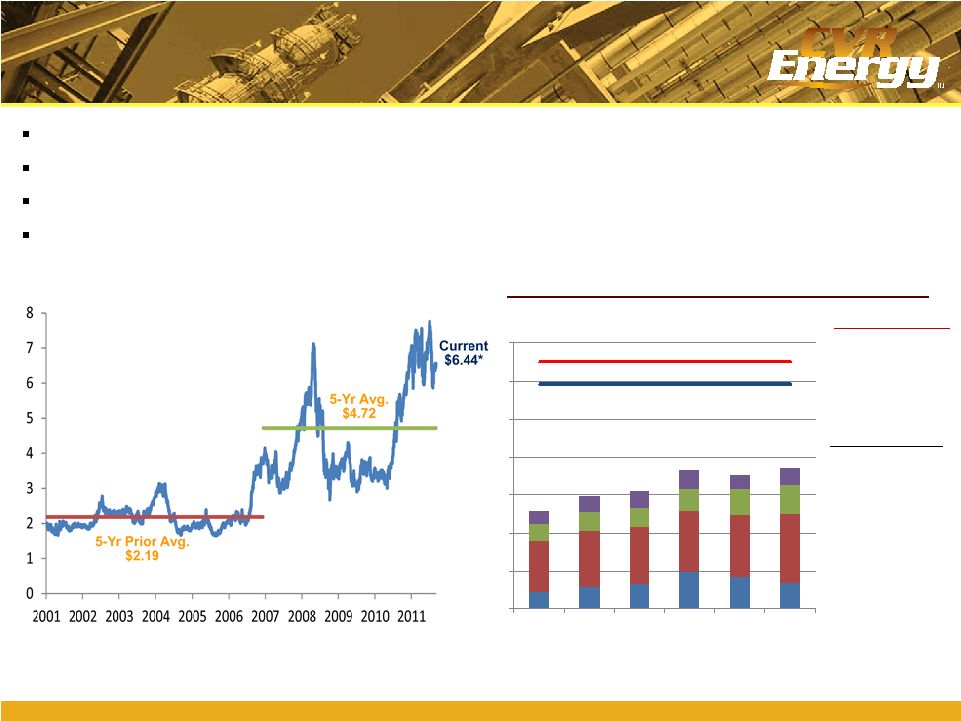
Market Fundamentals
Farmer Profitability Supports Fertilizer Pricing
Corn consumes the largest amount of nitrogen fertilizer
Farmers are expected to generate substantial proceeds at currently forecasted corn
prices Farmers are still incentivized to apply nitrogen fertilizer at corn
prices lower than current spot Nitrogen fertilizer represents a small
percentage of a farmer’s input costs Corn Spot Prices
Breakdown of U.S. Farmer Total Input Costs
Input Costs and Prices per Bushel ($)
Other Variable Costs 13%
Seed and Chemicals 18%
Fixed Costs 48%
Avg. % Total of Cost:
Corn Futures Prices*:
30 Day: $6.52
12 Month: $5.93
Note: Fixed Costs include labor, machinery, land, taxes, insurance, and other.
Fertilizers 21%
*As of Feb. 4, 2012
Source: CIQ
*As of Feb .4, 2012
Source: CIQ, USDA
2.60
2.97
3.10
3.68
3.53
3.71
-
1
2
3
4
5
6
7
2005
2006
2007
2008
2009
2010 |
 21
21
21
21
21
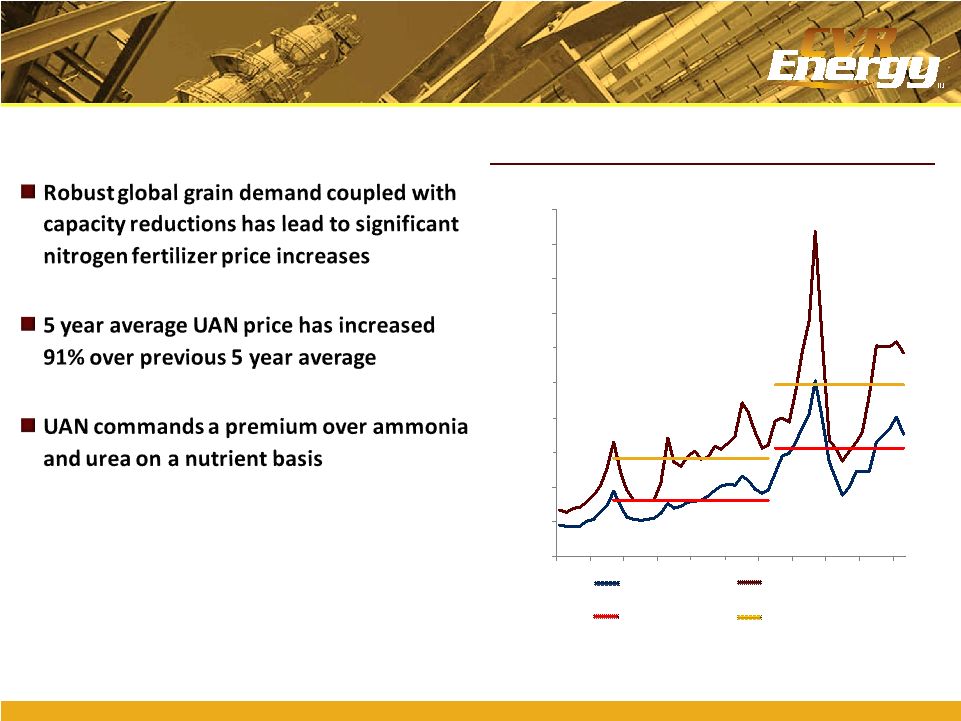
Market Fundamentals
Strong Pricing Environment
($ per Ton)
Historical U.S. Nitrogen Fertilizer Prices
0
100
200
300
400
500
600
700
800
900
1,000
1999
2000
2001
2002
2004
2005
2006
2007
2009
2010
2011
Ammonia
$686
UAN
$352
Southern Plains
Ammonia
Corn Belt UAN
5-Yr Average Southern
Plains Ammonia
Source:
Green Markets Data, Fertecon
5 Yr. Avg.
UAN $163
5-Yr Average
Corn Belt UAN
5 Yr. Avg.
Ammonia $283
5 Yr. Avg.
Ammonia $493
5 Yr. Avg.
UAN $312 |
 Financial Highlights |
 23
23
23
23
23
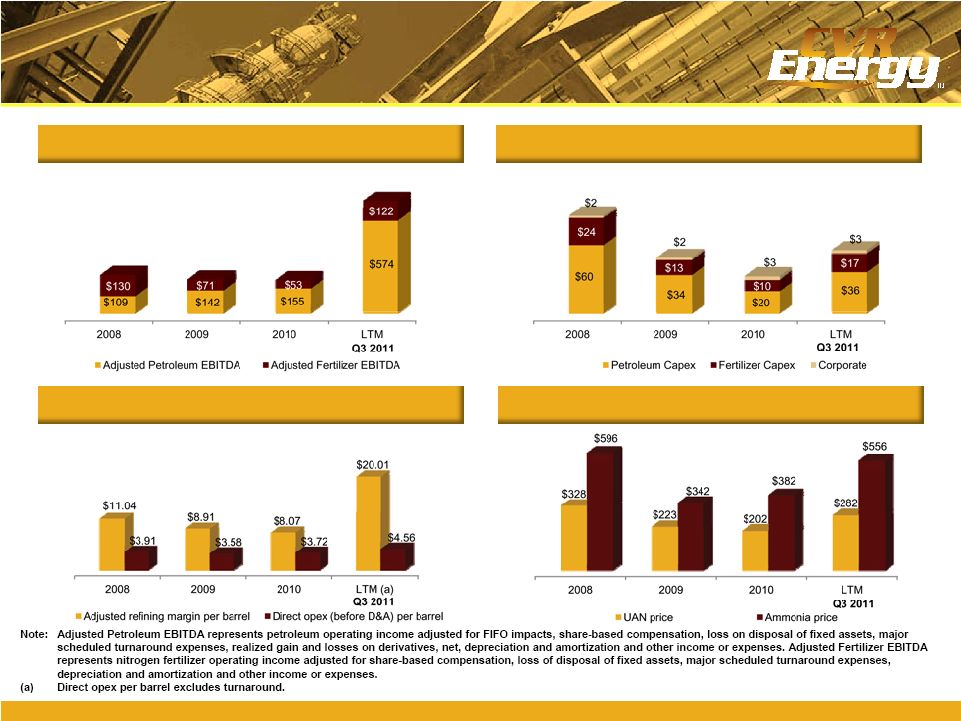
EBITDA by Operating Segment ($mm)
Capital Expenditures ($mm)
Refining Margins and Expenses ($/bbl)
Fertilizer Prices ($/Ton)
Key Historical Financial Statistics
CVR Energy Standalone |
 24
24
24
24
24
Adjusted EBITDA ($mm)
(a)
Capital Expenditures ($mm)
Refining Margins and Expenses ($/bbl)
Total Throughput (bpd)
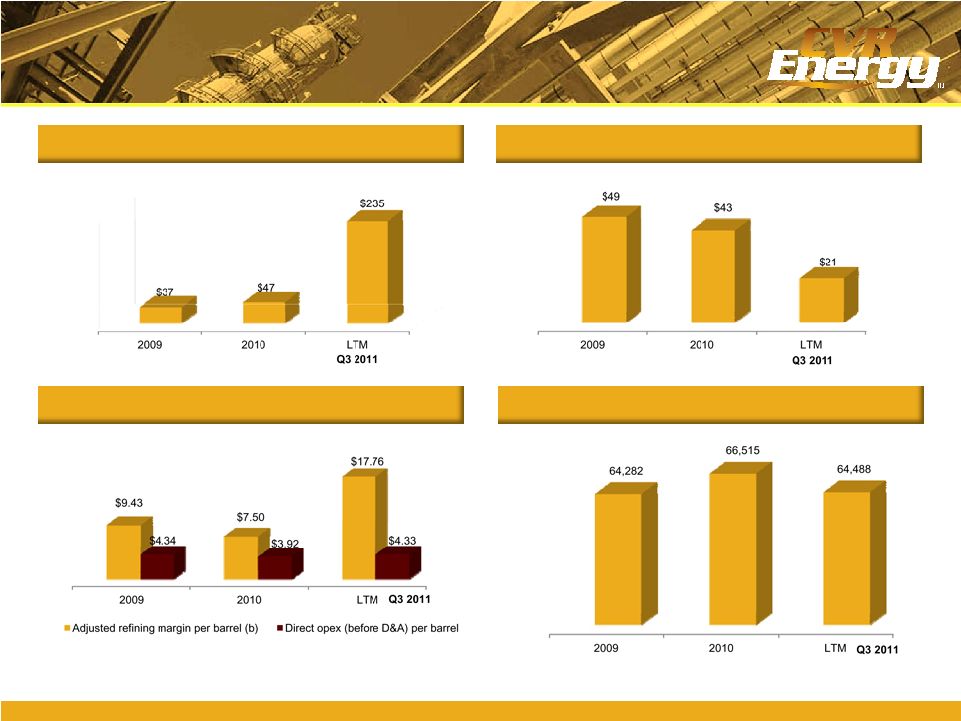
Key Historical Financial Statistics
Gary Williams Standalone
(a)
Adjusted EBITDA represents GWEC operating income adjusted for FIFO impacts, major
scheduled turnaround expenses, realized gain and losses on derivatives, net,
depreciation and amortization and other income or expenses.
(b)
Adjusted refining margin per barrel is equal to gross operating margin adjusted for
FIFO inventory gains or losses divided by crude throughput. |
 25
25
25
25
25
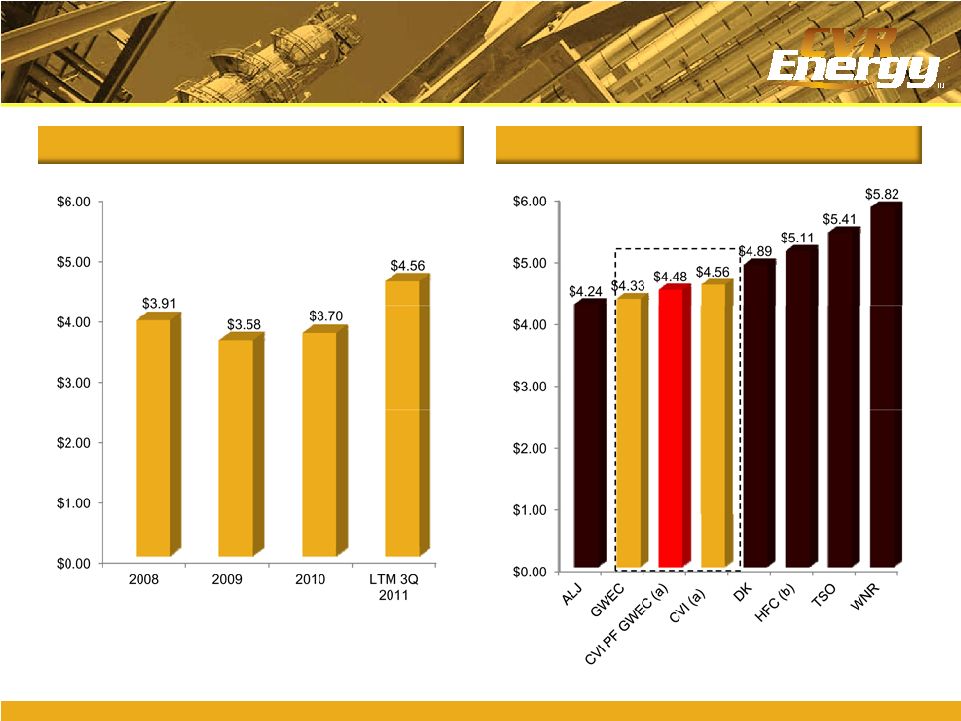
CVI Operating Expenses
(a)
($/bbl)
LTM Q3 ‘11 Operating Expense ($/bbl)
Combined Company –
Controlled Operating Expenses
(a)
Excludes
turnaround.
CVI
PF
GWEC
based
on
weighted
average
crude
throughput.
(b)
HFC
combined
results
from
legacy
companies
3Q
2011
report. |
 Appendix |
 27
27
27
27
27
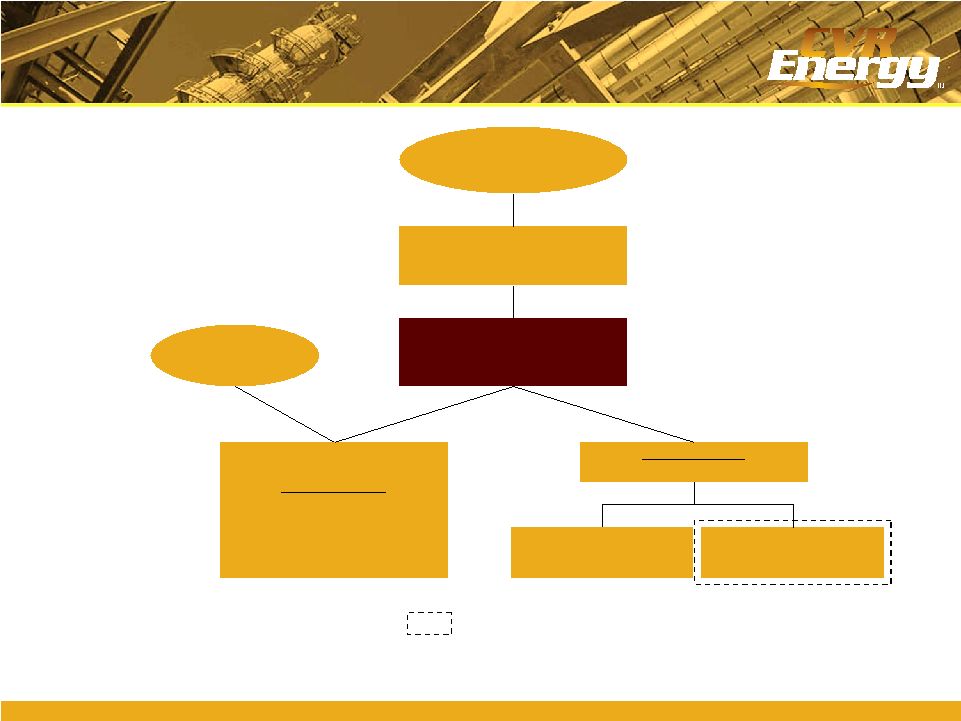
Pro Forma Organizational Structure
CVR Energy, Inc.
NYSE: CVI
Market cap: ~$2.2 bn
Coffeyville Resources, LLC
Fertilizer business
CVR Partners, LP
NYSE: UAN
Market cap: ~$1.8 bn
Refining business
~$809 mm LTM EBITDA
Public shareholders
Public unitholders
100%
100%
100% GP
69.7% LP
30.3% LP
Wynnewood Refinery (GWEC)
(Wynnewood, OK)
Coffeyville Refinery
(Coffeyville, KS)
100%
100%
Represents Acquisition
$400m ABL due ’15
$447m 9% 1
st
Lien notes due ‘15
$223m 10
7/8
% 2
nd
Lien notes due ‘17
$25m cash flow revolver due ’16
$125m term loan due ‘16 |
 28
28
28
28
28
Non-GAAP Financial Measures
To
supplement
the
actual
results
in
accordance
with
U.S.
generally
accepted
accounting
principles
(GAAP),
for
the
applicable
periods,
the
Company
also
uses
certain
non-GAAP
financial
measures
as
discussed
below,
which
are
adjusted
for
GAAP-based
results.
The
use
of
non-GAAP
adjustments
are
not
in
accordance
with
or
an
alternative
for
GAAP.
The
adjustments
are
provided
to
enhance
the
overall
understanding
of
the
Company’s
financial
performance
for
the
applicable
periods
and
are
also
indicators
that
management
utilizes
for
planning
and
forecasting
future
periods.
The
non-GAAP
measures
utilized
by
the
Company
are
not
necessarily
comparable
to
similarly
titled
measures
of
other
companies.
The
Company
believes
that
the
presentation
of
non-GAAP
financial
measures
provides
useful
information
to
investors
regarding
the
Company’s
financial
condition
and
results
of
operations
because
these
measures,
when
used
in
conjunction
with
related
GAAP
financial
measures
(i)
together
provide
a
more
comprehensive
view
of
the
Company’s
core
operations
and
ability
to
generate
cash
flow,
(ii)
provide
investors
with
the
financial
analytical
framework
upon
which
management
bases
financial
and
operational
planning
decisions,
and
(iii)
presents
measurements
that
investors
and
rating
agencies
have
indicated
to
management
are
useful
to
them
in
assessing
the
Company
and
its
results
of
operations. |
 29
29
29
29
29
Non-GAAP Financial Measures (cont’d)
EBITDA:
EBITDA
represents
net
income
before
the
effect
of
interest
expense,
interest
income,
income
tax
expense
(benefit)
and
depreciation
and
amortization.
EBITDA
is
not
a
calculation
based
upon
GAAP;
however,
the
amounts
included
in
EBITDA
are
derived
from
amounts
included
in
the
consolidated
statement
of
operations
of
the
Company.
Adjusted
EBITDA
by
operating
segment
results
from
operating
income
by
segment
adjusted
for
items
that
the
company
believes
are
needed
in
order
to
evaluate
results
in
a
more
comparative
analysis
from
period
to
period.
Additional
adjustments
to
EBITDA
include
major
scheduled
turnaround
expense,
the
impact
of
the
Company’s
use
of
accounting
for
its
inventory
under
first-in,
first-out
(FIFO),
net
unrealized
gains/losses
on
derivative
activities,
share-based
compensation
expense,
loss
on
extinguishment
of
debt,
and
other
income
(expense).
Adjusted
EBITDA
is
not
a
recognized
term
under
GAAP
and
should
not
be
substituted
for
operating
income
or
net
income
as
a
measure
of
performance
but
should
be
utilized
as
a
supplemental
measure
of
financial
performance
in
evaluating
our
business.
First-in,
first-out
(FIFO):
The
Company’s
basis
for
determining
inventory
value
on
a
GAAP
basis.
Changes
in
crude
oil
prices
can
cause
fluctuations
in
the
inventory
valuation
of
our
crude
oil,
work
in
process
and
finished
goods,
thereby
resulting
in
favorable
FIFO
impacts
when
crude
oil
prices
increase
and
unfavorable
FIFO
impacts
when
crude
oil
prices
decrease.
The
FIFO
impact
is
calculated
based
upon
inventory
values
at
the
beginning
of
the
accounting
period
and
at
the
end
of
the
accounting
period. |
 30
30
30
30
30
Non-GAAP Financial Measures (cont’d)
CVR 9/30/11 LTM Adjusted EBITDA ($mm)
LTM 9/30/2011
Consolidated Net Income
$282.2
Interest expense, net of interest income
53.8
Depreciation and amortization
88.1
Income tax expense
181.5
EBITDA adjustments included in NCI
(3.4)
Unrealized (gain)/loss on derivatives
9.8
Loss on disposal of fixed assets
2.9
FIFO impact (favorable), unfavorable
(30.4)
Share based compensation
52.4
Loss on extinguishment of debt
3.6
Major turnaround expense
16.5
Other non-cash expenses
-
Consolidated Adjusted EBITDA
$657.0
Fertilizer Adjusted EBITDA
121.7
Adjusted EBITDA excl. Fertilizer
$535.3 |
 31
31
31
31
31
Non-GAAP Financial Measures (cont’d)
CVR Adjusted EBITDA ($mm)
Petroleum:
2008
2009
2010
LTM 9/30/2011
Petroleum operating income
$31.9
$170.2
$104.6
$529.5
FIFO impact (favorable) unfavorable
102.5
(67.9)
(31.7)
(30.4)
Share-based compensation
(10.8)
(3.7)
11.5
17.1
Loss on disposal of fixed assets
-
-
1.3
1.5
Major scheduled turnaround
-
-
1.2
12.8
Realized gain (loss) on derivatives, net
(121.0)
(21.0)
0.7
(24.7)
Goodwill impairment
42.8
-
-
-
Depreciation and amortization
62.7
64.4
66.4
67.8
Other income (expense)
1.0
0.3
0.7
0.5
Adjusted EBITDA
$109.1
$142.3
$154.7
$574.1
Fertilizer:
2008
2009
2010
LTM 9/30/2011
Fertilizer operating income
$116.8
$48.9
$20.4
$84.0
Share-based compensation
(10.6)
3.2
9.0
14.1
Loss on disposal of fixed assets
2.3
-
1.4
1.4
Major scheduled turnaround
3.3
-
3.5
3.5
Depreciation and amortization
18.0
18.7
18.5
18.5
Other income (expense)
0.1
-
-
0.2
Adjusted EBITDA
$129.9
$70.8
$52.8
$121.7 |
 32
32
32
32
32
Non-GAAP Financial Measures (cont’d)
(a)
Includes disposal of assets, asset impairments, discontinued operations and fire
related adjustments. GWEC Adjusted EBITDA ($mm)
GWEC:
2009
2010
LTM 9/30/2011
Net income (loss)
$52.5
$16.1
$161.6
Income taxes
-
-
-
Interest expense (net)
12.9
22.4
28.6
Depreciation and amortization
13.8
14.7
17.2
Hedge mark to market loss (gain)
-
-
37.9
Turnaround amortization
15.4
13.8
13.1
Non-cash inventory loss (gain)
(57.9)
(19.6)
(23.1)
Other unusual or non-recurring items
(a)
0.1
-
(0.2)
Adjusted EBITDA
$36.8
$47.4
$235.1 |