Attached files
| file | filename |
|---|---|
| EX-31.1 - EX-31.1 - CVR ENERGY INC | cvi201510-kxexhibit311.htm |
| EX-31.2 - EX-31.2 - CVR ENERGY INC | cvi201510-kxexhibit312.htm |
| EX-23.1 - EX-23.1 - CVR ENERGY INC | cvi201510-kxexhibit231.htm |
| EX-32.1 - EX-32.1 - CVR ENERGY INC | cvi201510-kxexhibit321.htm |
UNITED STATES SECURITIES AND EXCHANGE COMMISSION
Washington, D.C. 20549
_____________________________________________________________
Form 10-K
(Mark One) | |
þ | ANNUAL REPORT PURSUANT TO SECTION 13 OR 15(d) OF THE SECURITIES EXCHANGE ACT OF 1934 |
For the fiscal year ended December 31, 2015 | |
OR | |
o | TRANSITION REPORT PURSUANT TO SECTION 13 OR 15(d) OF THE SECURITIES EXCHANGE ACT OF 1934 |
For the transition period from to . | |
Commission file number: 001-33492
_____________________________________________________________
CVR Energy, Inc.
(Exact name of registrant as specified in its charter)
Delaware (State or Other Jurisdiction of Incorporation or Organization) | 61-1512186 (I.R.S. Employer Identification No.) |
2277 Plaza Drive, Suite 500 Sugar Land, Texas (Address of Principal Executive Offices) | 77479 (Zip Code) |
Registrant's Telephone Number, including Area Code:
(281) 207-3200
_____________________________________________________________
Securities registered pursuant to Section 12(b) of the Act:
Title of Each Class | Name of Each Exchange on Which Registered |
Common Stock, $0.01 par value per share | The New York Stock Exchange |
Securities registered pursuant to Section 12(g) of the Act:
None
Indicate by check mark if the registrant is a well-known seasoned issuer, as defined in Rule 405 of the Securities Act. Yes o No þ
Indicate by check mark if the registrant is not required to file reports pursuant to Section 13 or Section 15(d) of the Act. Yes o No þ
Indicate by check mark whether the registrant (1) has filed all reports required to be filed by Section 13 or 15(d) of the Securities Exchange Act of 1934 during the preceding 12 months (or for such shorter period that the registrant was required to file such reports), and (2) has been subject to such filing requirements for the past 90 days. Yes þ No o
Indicate by check mark whether the registrant has submitted electronically and posted on its corporate Web site, if any, every Interactive Data File required to be submitted and posted pursuant to Rule 405 or Regulation S-T (§232.405 of this chapter) during the preceding 12 months (or for such shorter period that the registrant was required to submit and post such files). Yes þ No o
Indicate by check mark if disclosure of delinquent filers pursuant to Item 405 of Regulation S-K (§229.405 of this chapter) is not contained herein, and will not be contained, to the best of registrant's knowledge, in definitive proxy or information statements incorporated by reference in Part III of this Form 10-K or any amendment to this Form 10-K. þ
Indicate by check mark whether the registrant is a large accelerated filer, an accelerated filer, a non-accelerated filer, or a smaller reporting company. See the definitions of "large accelerated filer," "accelerated filer" and "smaller reporting company" in Rule 12b-2 of the Exchange Act.
Large accelerated filer þ | Accelerated filer o | Non-accelerated filer o | Smaller reporting company o |
(Do not check if a smaller reporting company) | |||
Indicate by check mark whether the registrant is a shell company (as defined in Rule 12b-2 of the Exchange Act). Yes o No þ
The aggregate market value of the voting and non-voting common equity held by non-affiliates of the registrant computed based on the New York Stock Exchange closing price on June 30, 2015 (the last business day of the registrant's second fiscal quarter) was $588,400,939. Shares of the registrant's common stock held by each executive officer and director and by each entity or person that, to the registrant's knowledge, owned 10% or more of the registrant's outstanding common stock as of June 30, 2015 have been excluded from this number in that these persons may be deemed affiliates of the registrant. This determination of possible affiliate status is not necessarily a conclusive determination for other purposes.
Indicate the number of shares outstanding of each of the registrant's classes of common stock, as of the latest practicable date.
Class | Outstanding at February 16, 2016 |
Common Stock, par value $0.01 per share | 86,831,050 shares |
Documents Incorporated By Reference
Document | Parts Incorporated |
Proxy Statement for the 2016 Annual Meeting of Stockholders | Items 10, 11, 12, 13 and 14 of Part III |
TABLE OF CONTENTS
Page | ||
1
GLOSSARY OF SELECTED TERMS
The following are definitions of certain terms used in this Annual Report on Form 10-K for the year ended December 31, 2015 (this "Report").
2-1-1 crack spread — The approximate gross margin resulting from processing two barrels of crude oil to produce one barrel of gasoline and one barrel of distillate. The 2-1-1 crack spread is expressed in dollars per barrel.
ammonia — Ammonia is a direct application fertilizer and is primarily used as a building block for other nitrogen products for industrial applications and finished fertilizer products.
backwardation market — Market situation in which futures prices are lower in succeeding delivery months. Also known as an inverted market. The opposite of contango market.
barrel — Common unit of measure in the oil industry which equates to 42 gallons.
blendstocks — Various compounds that are combined with gasoline or diesel from the crude oil refining process to make finished gasoline and diesel fuel; these may include natural gasoline, fluid catalytic cracking unit or FCCU gasoline, ethanol, reformate or butane, among others.
bpd — Abbreviation for barrels per day.
bpcd — Abbreviation for barrels per calendar day, which refers to the total number of barrels processed in a refinery within a year, divided by 365 days, thus reflecting all operational and logistical limitations.
bulk sales — Volume sales through third-party pipelines, in contrast to tanker truck quantity rack sales.
capacity — Capacity is defined as the throughput a process unit is capable of sustaining, either on a calendar or stream day basis. The throughput may be expressed in terms of maximum sustainable, nameplate or economic capacity. The maximum sustainable or nameplate capacities may not be the most economical. The economic capacity is the throughput that generally provides the greatest economic benefit based on considerations such as feedstock costs, product values and downstream unit constraints.
catalyst — A substance that alters, accelerates, or instigates chemical changes, but is neither produced, consumed nor altered in the process.
contango market — Market situation in which prices for future delivery are higher than the current or spot market price of the commodity. The opposite of backwardation market.
corn belt — The primary corn producing region of the United States, which includes Illinois, Indiana, Iowa, Minnesota, Missouri, Nebraska, Ohio and Wisconsin.
crack spread — A simplified calculation that measures the difference between the price for light products and crude oil. For example, the 2-1-1 crack spread is often referenced and represents the approximate gross margin resulting from processing two barrels of crude oil to produce one barrel of gasoline and one barrel of distillate.
distillates — Primarily diesel fuel, kerosene and jet fuel.
ethanol — A clear, colorless, flammable oxygenated hydrocarbon. Ethanol is typically produced chemically from ethylene, or biologically from fermentation of various sugars from carbohydrates found in agricultural crops and cellulosic residues from crops or wood. It is used in the United States as a gasoline octane enhancer and oxygenate.
farm belt — Refers to the states of Illinois, Indiana, Iowa, Kansas, Minnesota, Missouri, Nebraska, North Dakota, Ohio, Oklahoma, South Dakota, Texas and Wisconsin.
feedstocks — Petroleum products, such as crude oil and natural gas liquids, that are processed and blended into refined products, such as gasoline, diesel fuel and jet fuel during the refining process.
2
Group 3 — A geographic subset of the PADD II region comprising refineries in Oklahoma, Kansas, Missouri, Nebraska and Iowa. Current Group 3 refineries include the Refining Partnership's Coffeyville and Wynnewood refineries; the Valero Ardmore refinery in Ardmore, OK; HollyFrontier's Tulsa refinery in Tulsa, OK and El Dorado refinery in El Dorado, KS; Phillips 66's Ponca City refinery in Ponca City, OK; and CHS' refinery in McPherson, KS.
heavy crude oil — A relatively inexpensive crude oil characterized by high relative density and viscosity. Heavy crude oils require greater levels of processing to produce high value products such as gasoline and diesel fuel.
independent petroleum refiner — A refiner that does not have crude oil exploration or production operations. An independent refiner purchases the crude oil used as feedstock in its refinery operations from third parties.
light crude oil — A relatively expensive crude oil characterized by low relative density and viscosity. Light crude oils require lower levels of processing to produce high value products such as gasoline and diesel fuel.
Magellan — Magellan Midstream Partners L.P., a publicly traded company, whose business is the transportation, storage and distribution of refined petroleum products.
MMBtu — One million British thermal units or Btu: a measure of energy. One Btu of heat is required to raise the temperature of one pound of water one degree Fahrenheit.
MSCF — One thousand standard cubic feet, a customary gas measurement unit.
natural gas liquids — Natural gas liquids, often referred to as NGLs, are both feedstocks used in the manufacture of refined fuels and products of the refining process. Common NGLs used include propane, isobutane, normal butane and natural gasoline.
Nitrogen Fertilizer Partnership IPO — The initial public offering of 22,080,000 common units representing limited partner interests of CVR Partners, LP (the "Nitrogen Fertilizer Partnership"), which closed on April 13, 2011.
PADD II — Midwest Petroleum Area for Defense District which includes Illinois, Indiana, Iowa, Kansas, Kentucky, Michigan, Minnesota, Missouri, Nebraska, North Dakota, Ohio, Oklahoma, South Dakota, Tennessee, and Wisconsin.
petroleum coke (pet coke) — A coal-like substance that is produced during the refining process.
product pricing at gate — Product pricing at gate represents net sales less freight revenue divided by product sales volume in tons. Product pricing at gate is also referred to as netback.
rack sales — Sales which are made at terminals into third-party tanker trucks.
refined products — Petroleum products, such as gasoline, diesel fuel and jet fuel, that are produced by a refinery.
Refining Partnership IPO — The initial public offering of 27,600,000 common units representing limited partner interests of CVR Refining, LP (the "Refining Partnership"), which closed on January 23, 2013 (which includes the underwriters' subsequently-exercised option to purchase additional common units).
Secondary Offering — The registered public offering of 12,000,000 common units representing limited partner interests of the Nitrogen Fertilizer Partnership, which closed on May 28, 2013.
Second Underwritten Offering — The second underwritten offering of 7,475,000 common units of the Refining Partnership, which closed on June 30, 2014 (which includes the underwriters' subsequently-exercised option to purchase additional common units).
sour crude oil — A crude oil that is relatively high in sulfur content, requiring additional processing to remove the sulfur. Sour crude oil is typically less expensive than sweet crude oil.
spot market — A market in which commodities are bought and sold for cash and delivered immediately.
sweet crude oil — A crude oil that is relatively low in sulfur content, requiring less processing to remove the sulfur. Sweet crude oil is typically more expensive than sour crude oil.
3
throughput — The volume processed through a unit or a refinery or transported on a pipeline.
turnaround — A periodically required standard procedure to inspect, refurbish, repair and maintain the refinery or nitrogen fertilizer plant assets. This process involves the shutdown and inspection of major processing units and occurs every four to five years for the refineries and every two to three years for the nitrogen fertilizer plant.
UAN — An aqueous solution of urea and ammonium nitrate used as a fertilizer.
Underwritten Offering — The underwritten offering of 13,209,236 common units of the Refining Partnership, which closed on May 20, 2013 (which includes the underwriters' subsequently-exercised option to purchase additional common units).
WCS — Western Canadian Select crude oil, a medium to heavy, sour crude oil, characterized by an American Petroleum Institute gravity ("API gravity") of between 20 and 22 degrees and a sulfur content of approximately 3.3 weight percent.
WEC — Gary-Williams Energy Corporation, subsequently converted to Gary-Williams Energy Company, LLC and now known as Wynnewood Energy Company, LLC.
WRC — Wynnewood Refining Company, LLC, the owner of the Wynnewood, Oklahoma refinery and related assets with a rated capacity of 70,000 bpcd.
WTI — West Texas Intermediate crude oil, a light, sweet crude oil, characterized by an API gravity between 39 and 41 degrees and a sulfur content of approximately 0.4 weight percent that is used as a benchmark for other crude oils.
WTS — West Texas Sour crude oil, a relatively light, sour crude oil characterized by an API gravity of between 30 and 32 degrees and a sulfur content of approximately 2.0 weight percent.
Wynnewood Acquisition — The acquisition by the Company of all the outstanding shares of WEC and its subsidiaries, which owned the Wynnewood, Oklahoma refinery with a rated capacity of 70,000 bpcd and 2.0 million barrels of storage tanks, on December 15, 2011. As of January 2013, WRC became a wholly-owned subsidiary of CVR Refining, LLC. It was previously a wholly-owned subsidiary of WEC.
yield — The percentage of refined products that is produced from crude oil and other feedstocks.
4
PART I
Item 1. Business
Overview
CVR Energy, Inc. and, unless the context otherwise requires, its subsidiaries ("CVR Energy," the "Company," "we," "us," or "our") is a diversified holding company primarily engaged in the petroleum refining and nitrogen fertilizer manufacturing industries through its holdings in CVR Refining, LP ("CVR Refining" or the "Refining Partnership") and CVR Partners, LP ("CVR Partners" or the "Nitrogen Fertilizer Partnership"). The Refining Partnership is an independent petroleum refiner and marketer of high value transportation fuels. The Nitrogen Fertilizer Partnership produces and markets nitrogen fertilizers in the form of UAN and ammonia. We own the general partner and a majority of the common units representing limited partner interests in each of the Refining Partnership and the Nitrogen Fertilizer Partnership. CVR Energy's common stock is listed on the New York Stock Exchange ("NYSE") under the symbol "CVI," the Refining Partnership's common units are listed on the NYSE under the symbol "CVRR" and the Nitrogen Fertilizer Partnership's common units are listed on the NYSE under the symbol "UAN."
We operate under two business segments: petroleum (the petroleum and related businesses operated by the Refining Partnership) and nitrogen fertilizer (the nitrogen fertilizer business operated by the Nitrogen Fertilizer Partnership). Throughout the remainder of this document, our business segments are referred to as the "petroleum business" and the "nitrogen fertilizer business," respectively.
For the fiscal years ended December 31, 2015, 2014 and 2013, we generated consolidated net sales of $5.4 billion, $9.1 billion and $9.0 billion, respectively, and operating income of $421.6 million, $264.3 million and $710.5 million, respectively. The petroleum business generated $5.2 billion, $8.8 billion and $8.7 billion of net sales and the nitrogen fertilizer business generated $289.2 million, $298.7 million and $323.7 million of net sales, in each case, for the years ended December 31, 2015, 2014 and 2013, respectively. The petroleum business generated operating income of $361.7 million, $207.2 million and $603.0 million and the nitrogen fertilizer business generated operating income of $68.7 million, $82.8 million and $124.9 million, in each case, for the years ended December 31, 2015, 2014 and 2013, respectively. Our consolidated results of operations include certain other unallocated corporate activities and the elimination of intercompany transactions and, therefore, are not a sum of the operating results of the petroleum and nitrogen fertilizer businesses.
Refer to Item 1, "Petroleum Business" and Item 1, "Nitrogen Fertilizer Business" for further details on our business segments.
Our History
The Coffeyville refinery, which began operations in 1906, and the nitrogen fertilizer plant, built in 2000, were operated as components of Farmland Industries, Inc. ("Farmland") until March 3, 2004, the date on which Coffeyville Resources, LLC ("CRLLC") completed the acquisition of these assets through a bankruptcy court auction.
On June 24, 2005, Coffeyville Acquisition LLC ("CALLC"), which was formed by certain funds affiliated with Goldman, Sachs & Co. and Kelso & Company, L.P. (the "Goldman Sachs Funds" and the "Kelso Funds," respectively), acquired these businesses. CALLC operated our business from June 24, 2005 until CVR Energy's initial public offering in October 2007.
CVR Energy was formed in September 2006 as a subsidiary of CALLC in order to consummate an initial public offering of its businesses. CVR Energy consummated its initial public offering on October 26, 2007. The Goldman Sachs Funds and the Kelso Funds completely sold their ownership interests by February 2011 and May 2011, respectively.
On April 13, 2011, the Nitrogen Fertilizer Partnership completed the Nitrogen Fertilizer Partnership IPO. The Nitrogen Fertilizer Partnership sold 22,080,000 common units at a price of $16.00 per common unit, resulting in gross proceeds of $353.3 million. The Nitrogen Fertilizer Partnership's common units are listed on the NYSE and are traded under the symbol "UAN." In connection with the Nitrogen Fertilizer Partnership IPO, the Nitrogen Fertilizer Partnership paid approximately $24.7 million in underwriting fees and incurred approximately $4.4 million of other offering costs. As a result of the Nitrogen Fertilizer Partnership IPO and through May 27, 2013, CVR Energy indirectly owned approximately 70% of the Nitrogen Fertilizer Partnership's outstanding common units and 100% of the Nitrogen Fertilizer Partnership's general partner with its non-economic general partner interest.
5
On December 15, 2011, CVR Energy acquired all of the issued and outstanding shares of WEC. Assets acquired include a 70,000 bpcd rated capacity refinery in Wynnewood, Oklahoma and approximately 2.0 million barrels of company-owned storage tanks.
On April 18, 2012, CVR Energy entered into a Transaction Agreement (the "Transaction Agreement") with an affiliate of Icahn Enterprises L.P. ("IEP"). Pursuant to the Transaction Agreement, IEP's affiliate offered (the "Offer") to purchase all of the issued and outstanding shares of CVR Energy's common stock for a price of $30.00 per share in cash, without interest, less any applicable withholding taxes, plus one non-transferable contingent cash payment ("CCP") right for each share, which represented the contractual right to receive an additional cash payment per share if a definitive agreement for the sale of CVR Energy was executed on or before August 18, 2013 and such transaction closed. As no sale of the Company was executed by the date outlined in the Transaction Agreement, the CCPs expired on August 19, 2013.
In May 2012, IEP's affiliate acquired a majority of the common stock of CVR Energy through the Offer. As of December 31, 2015, IEP and its affiliates owned approximately 82% of CVR Energy’s outstanding common stock.
On January 23, 2013, the Refining Partnership completed the Refining Partnership IPO. The Refining Partnership sold 24,000,000 common units at a price of $25.00 per unit, resulting in gross proceeds of $600.0 million. Of the common units issued, 4,000,000 units were purchased by an affiliate of IEP. Additionally, on January 30, 2013, the underwriters closed their option to purchase an additional 3,600,000 common units at a price of $25.00 per unit resulting in gross proceeds of $90.0 million. The common units, which are listed on the NYSE, began trading on January 17, 2013 under the symbol "CVRR." In connection with the Refining Partnership IPO, the Refining Partnership paid approximately $32.5 million in underwriting fees and incurred approximately $3.9 million of other offering costs.
Immediately following the Refining Partnership IPO and through May 19, 2013, CVR Energy indirectly owned approximately 81% of the total Refining Partnership common units and 100% of the Refining Partnership's general partner, which holds a non-economic general partner interest. Prior to the Refining Partnership IPO, CVR Energy owned 100% of the Refining Partnership and net income earned during this period was fully attributable to the Company.
On May 20, 2013, the Refining Partnership completed an underwritten offering (the "Underwritten Offering") by selling 12,000,000 common units to the public at a price of $30.75 per unit. American Entertainment Properties Corporation ("AEPC"), an affiliate of IEP, also purchased an additional 2,000,000 common units at the public offering price in a privately negotiated transaction with a subsidiary of CVR Energy, which was completed on May 29, 2013. In connection with the Underwritten Offering, on June 10, 2013, the Refining Partnership sold an additional 1,209,236 common units to the public at a price of $30.75 per unit in connection with a partial exercise by the underwriters of their option to purchase additional common units. The transactions described in this paragraph are collectively referred to as the "Transactions." In connection with the Transactions, the Refining Partnership paid approximately $12.2 million in underwriting fees and approximately $0.4 million in offering costs.
The Refining Partnership utilized net proceeds of approximately $394.0 million from the Underwritten Offering (including the underwriters' option) to redeem 13,209,236 common units from CVR Refining Holdings, LLC ("CVR Refining Holdings"), an indirect wholly-owned subsidiary of CVR Energy. The net proceeds to a subsidiary of CVR Energy from the sale of 2,000,000 common units to AEPC were approximately $61.5 million. The Refining Partnership did not receive any of the proceeds from the sale of common units by CVR Energy to AEPC.
Immediately following the closing of the Transactions and prior to June 30, 2014, public security holders held approximately 29% of the total Refining Partnership common units (including units owned by affiliates of IEP representing 4% of total Refining Partnership common units), and CVR Refining Holdings held approximately 71% of the total Refining Partnership common units.
On May 28, 2013, CRLLC completed a registered public offering (the "Secondary Offering") whereby it sold 12,000,000 Nitrogen Fertilizer Partnership common units to the public at a price of $25.15 per unit. The net proceeds to CRLLC from the Secondary Offering were approximately $292.6 million, after deducting approximately $9.2 million in underwriting discounts and commissions. The Nitrogen Fertilizer Partnership did not receive any of the proceeds from the sale of common units by CRLLC. In connection with the Secondary Offering, the Nitrogen Fertilizer Partnership incurred approximately $0.5 million in offering costs.
Immediately subsequent to the closing of the Secondary Offering and as of December 31, 2015, public security holders held approximately 47% of the total Nitrogen Fertilizer Partnership common units, and CRLLC held approximately 53% of the
6
total Nitrogen Fertilizer Partnership common units. In addition, CRLLC owns 100% of the Nitrogen Fertilizer Partnership’s general partner, CVR GP, LLC, which only holds a non-economic general partner interest.
On June 30, 2014, the Refining Partnership completed a second underwritten offering (the "Second Underwritten Offering") by selling 6,500,000 common units to the public at a price of $26.07 per unit. The Refining Partnership paid approximately $5.3 million in underwriting fees and approximately $0.5 million in offering costs. The Refining Partnership utilized net proceeds of approximately $164.1 million from the Second Underwritten Offering to redeem 6,500,000 common units from CVR Refining Holdings. Immediately subsequent to the closing of the Second Underwritten Offering and through July 23, 2014, public security holders held approximately 33% of the total Refining Partnership common units, and CVR Refining Holdings held approximately 67% of the total Refining Partnership common units.
On July 24, 2014, the Refining Partnership sold an additional 589,100 common units to the public at a price of $26.07 per unit in connection with the underwriters' exercise of their option to purchase additional common units. The Refining Partnership utilized net proceeds of approximately $14.9 million from the underwriters' exercise of their option to purchase additional common units to redeem an equal amount of common units from CVR Refining Holdings. Additionally, on July 24, 2014, CVR Refining Holdings sold 385,900 common units to the public at a price of $26.07 per unit in connection with the underwriters' exercise of their remaining option to purchase additional common units. CVR Refining Holdings received net proceeds of $9.7 million.
Immediately subsequent to the closing of the underwriters' option for the Second Underwritten Offering and as of December 31, 2015, public security holders held approximately 34% of the total Refining Partnership common units (including units owned by affiliates of IEP, representing 4% of the total Refining Partnership common units), and CVR Refining Holdings held approximately 66% of the total Refining Partnership common units, in addition to owning 100% of the Refining Partnership's general partner.
On August 9, 2015, CVR Partners entered into an Agreement and Plan of Merger (the "Merger Agreement") with Rentech Nitrogen Partners, L.P. ("Rentech Nitrogen") and Rentech Nitrogen GP, LLC ("Rentech Nitrogen GP"), pursuant to which CVR Partners would acquire Rentech Nitrogen and Rentech Nitrogen GP by merging two newly-created direct wholly-owned subsidiaries of CVR Partners with and into those entities with Rentech Nitrogen and Rentech Nitrogen GP continuing as surviving entities and wholly-owned subsidiaries of CVR Partners (together, the "mergers"). Refer to Part II, Item 8, Note 1 ("Organization and History of the Company") of this Report for further discussion of the mergers.
7
Organizational Structure and Related Ownership
The following chart illustrates our organizational structure and the organizational structure of the Refining Partnership and the Nitrogen Fertilizer Partnership as of the date of this Report.
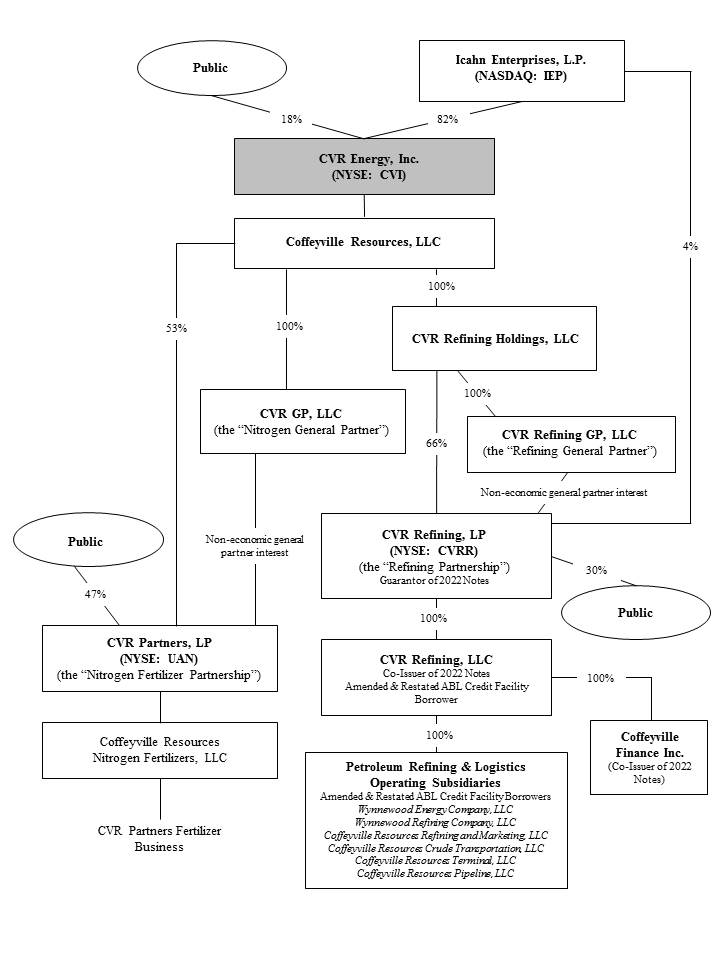
8
Petroleum Business
The petroleum business, operated by the Refining Partnership, includes a complex full coking medium-sour crude oil refinery in Coffeyville, Kansas with a rated capacity of 115,000 bpcd and a complex crude oil refinery in Wynnewood, Oklahoma with a rated capacity of 70,000 bpcd capable of processing 20,000 bpcd of light sour crude oil (within its rated capacity of 70,000 bpcd). The combined crude capacity represents approximately 22% of the region's refining capacity. The Coffeyville refinery located in southeast Kansas is approximately 100 miles from Cushing, Oklahoma, a major crude oil trading and storage hub. The Wynnewood refinery is located approximately 65 miles south of Oklahoma City, Oklahoma and approximately 130 miles from Cushing, Oklahoma.
For the year ended December 31, 2015, the Coffeyville refinery's product yield included gasoline (46%), diesel fuel (primarily ultra-low sulfur diesel) (43%), and pet coke and other refined products such as natural gas liquids ("NGL") (propane and butane), slurry, sulfur and gas oil (11%). The Wynnewood refinery's product yield included gasoline (52%), diesel fuel (primarily ultra-low sulfur diesel) (36%), asphalt (5%), jet fuel (4%) and other products (3%).
The petroleum business also includes the following auxiliary operating assets:
• | Crude Oil Gathering System. The petroleum business owns and operates a crude oil gathering system serving Kansas, Nebraska, Oklahoma, Missouri, Colorado and Texas. The system has field offices in Bartlesville and Pauls Valley, Oklahoma and Plainville, Winfield and Iola, Kansas. The gathering system includes approximately 336 miles of active owned and leased pipelines and approximately 150 crude oil transports and associated storage facilities, which allows it to gather crude oils from independent crude oil producers. The crude oil gathering system has a gathering capacity of over 65,000 bpd. Gathered crude oil provides an attractive and competitive base supply of crude oil for the Coffeyville and Wynnewood refineries. During 2015, the petroleum business gathered an average of approximately 69,000 bpd. The petroleum business also has 35,000 bpd of contracted capacity on the Keystone and Spearhead pipelines that allow it to supply price-advantaged Canadian and Bakken crudes to its refineries. It also has contracted capacity on the Pony Express and White Cliffs pipelines, which both became in-service during 2015. Both the Pony Express and White Cliffs pipelines originate in Colorado and extend to Cushing, Oklahoma. |
• | Pipelines and Storage Tanks. The petroleum business owns a proprietary pipeline system capable of transporting approximately 170,000 bpd of crude oil from its Broome Station facility located near Caney, Kansas to its Coffeyville refinery. Crude oils sourced outside of the proprietary gathering system are delivered by common carrier pipelines into various terminals in Cushing, Oklahoma, where they are blended and then delivered to the Broome Station tank farm via a pipeline owned by Plains Pipeline L.P. ("Plains"). The petroleum business owns approximately (i) 1.5 million barrels of crude oil storage capacity that supports the gathering system and the Coffeyville refinery, (ii) 0.9 million barrels of crude oil storage capacity at the Wynnewood refinery and (iii) 1.5 million barrels of crude oil storage capacity in Cushing, Oklahoma. The petroleum business also leases additional crude oil storage capacity of approximately (iv) 2.8 million barrels in Cushing, (v) 0.2 million barrels in Duncan, Oklahoma and (vi) 0.1 million barrels at the Wynnewood refinery. In addition to crude oil storage, the petroleum business owns over 4.5 million barrels of combined refined products and feedstocks storage capacity. |
• | Marketing and Product Supply. The petroleum business also has a rack marketing division supplying product through tanker trucks directly to customers located in close geographic proximity to Coffeyville, Kansas and Wynnewood, Oklahoma and to customers at throughput terminals on Magellan Midstream Partners, L.P. ("Magellan") and NuStar Energy, LP's ("NuStar") refined products distribution systems. |
The refineries' complexity allows the petroleum business to optimize the yields (the percentage of refined product that is produced from crude oil and other feedstocks) of higher value transportation fuels (gasoline and diesel). Complexity is a measure of a refinery's ability to process lower quality crude oil and feedstocks in an economic manner. The two refineries' capacity weighted average complexity is 13.0. As a result of key investments in its refining assets and the addition of process units to comply with gasoline quality regulations, both of the refinery's complexities have increased. The Coffeyville refinery's complexity score is 13.3, and the Wynnewood refinery's complexity score is 12.6. The petroleum business' higher complexity provides it the flexibility to increase its refining margin over comparable refiners with lower complexities. The petroleum business has achieved significant increases in its refinery crude throughput rates over historical levels. As a result of the increasing complexities, the petroleum business is capable of processing a variety of crudes, including WTS, WTI, sweet and sour Canadian, and locally gathered crudes.
9
Crude and Feedstock Supply
The Coffeyville refinery has the capability to process blends of a variety of crude oil ranging from heavy sour to light sweet crude oil. Currently, the Coffeyville refinery crude oil slate consists of a blend of mid-continent domestic grades and various Canadian medium and heavy sours, and it has recently introduced North Dakota Bakken and other similarly sourced crudes into its crude slate. While crude oil has historically constituted over 90% of the Coffeyville refinery's total throughput over the last five years, other feedstock inputs include normal butane, natural gasoline, alkylation feeds, naphtha, gas oil and vacuum tower bottoms.
The Wynnewood refinery has the capability to process blends of a variety of crude oil ranging from medium sour to light sweet crude oil, although isobutane, gasoline components, and normal butane are also typically used. Historically most of the Wynnewood refinery's crude oil has been acquired domestically, mainly from Texas and Oklahoma, but it can also access and process various light and medium Canadian grades.
Crude oil is supplied to the Coffeyville and Wynnewood refineries through the wholly-owned gathering system and by pipeline. The petroleum business has continued to increase the number of barrels of crude oil supplied through its crude oil gathering system in 2015 and it now has the capacity of supplying over 65,000 bpd of crude oil to the refineries. For the year ended December 31, 2015, the gathering system supplied approximately 39% of both of the Coffeyville and Wynnewood refineries' crude oil demand. Locally produced crude oils are delivered to the refineries at a discount to WTI, and although sometimes slightly heavier and more sour, offer good economics to the refineries. These crude oils are light and sweet enough to allow the refineries to blend higher percentages of lower cost crude oils such as heavy sour Canadian crude oil while maintaining their target medium sour blend with an API gravity of between 28 and 36 degrees and between 0.9% and 1.2% sulfur. Crude oils sourced outside of the proprietary gathering system are delivered to Cushing, Oklahoma by various pipelines including the Keystone and Spearhead pipelines, and subsequently to the Broome Station facility via the Plains pipeline. In May 2015 and November 2015, the petroleum business' contracted capacity included the Pony Express and White Cliffs pipelines, respectively. From the Broome Station facility, crude oil is delivered to the Coffeyville refinery via the petroleum business' 170,000 bpd proprietary pipeline system. Crude oils are delivered to the Wynnewood refinery by three separate pipelines, and received into storage tanks at terminals located on or near the refinery.
For the year ended December 31, 2015, the Coffeyville refinery's crude oil supply blend was comprised of approximately 85.4% light sweet crude oil, 12.8% heavy sour crude oil and 1.8% light/medium sour crude oil. For the year ended December 31, 2015, the Wynnewood refinery's crude oil supply blend was comprised of approximately 99.5% light sweet crude oil and 0.5% light/medium sour crude oil. The light sweet crude oil supply blend includes its locally gathered crude oil.
The Coffeyville refinery is connected to the mid-continent natural gas liquids commercial hub of Conway, Kansas by the inbound Enterprise Pipeline Blue Line. Natural gas liquids feedstock supplies such as butanes and natural gasoline are sourced and delivered directly into the refinery. In addition, Coffeyville's proximity to Conway provides access to the natural gas liquid and liquid petroleum gas fractionation and storage capabilities as well as the commercial markets available at Conway.
Crude Oil Supply Agreement
On August 31, 2012, Coffeyville Resources Refining and Marketing, LLC ("CRRM") and Vitol Inc. ("Vitol") entered into an Amended and Restated Crude Oil Supply Agreement (as amended, the "Vitol Agreement"). Under the Vitol Agreement, Vitol supplies the petroleum business with crude oil and intermediation logistics, which helps the petroleum business to reduce its inventory position and mitigate crude oil pricing risk. The Vitol Agreement will automatically renew for successive one-year terms (each such term, a "Renewal Term") unless either party provides the other with notice of nonrenewal at least 180 days prior to expiration of any Renewal Term. The Vitol Agreement currently extends through December 31, 2016.
Marketing and Distribution
The petroleum business focuses its Coffeyville petroleum product marketing efforts in the central mid-continent area, because of its relative proximity to the refinery and pipeline access. Coffeyville also has access to the Rocky Mountain area. Coffeyville engages in rack marketing, which is the supply of product through tanker trucks directly to customers located in close geographic proximity to the refinery and to customers at throughput terminals on the refined products distribution systems of Magellan and NuStar. Coffeyville also makes bulk sales (sales into third-party pipelines) into the mid-continent markets and other destinations utilizing the product pipeline networks owned by Magellan, Enterprise and NuStar. The outbound Enterprise Pipeline Red Line provides Coffeyville with access to the NuStar Refined Products Pipeline system. This allows gasoline and ULSD product sales from Kansas up into North Dakota.
10
The Wynnewood refinery ships its finished product via pipeline, railcar, and truck. It focuses its efforts in the southern portion of the Magellan system which covers all of Oklahoma, parts of Arkansas as well as eastern Missouri, and all other Magellan terminals. The pipeline system is also able to flow in the opposite direction, providing access to Texas markets as well as some adjoining states with pipeline connections. Wynnewood also sells jet fuel to the U.S. Department of Defense via its segregated truck rack and can offer asphalts, solvents and other specialty products via both truck and rail.
Customers
Customers for the refined petroleum products primarily include retailers, railroads, and farm cooperatives and other refiners/marketers in Group 3 of the PADD II region because of their relative proximity to the refineries and pipeline access. The petroleum business sells bulk products to long-standing customers at spot market prices based on a Group 3 basis differential to prices quoted on the New York Mercantile Exchange ("NYMEX"), which are reported by industry market-related indices such as Platts and Oil Price Information Service.
The petroleum business also has a rack marketing business supplying product through tanker trucks directly to customers located in proximity to the Coffeyville and Wynnewood refineries, as well as to customers located at throughput terminals on refined products distribution systems run by Magellan and NuStar. Rack sales are at posted prices that are influenced by competitor pricing and Group 3 spot market differentials. Additionally, the Wynnewood refinery supplies jet fuel to the U.S. Department of Defense. For the year ended December 31, 2015, the two largest customers accounted for approximately 14% and 9% of the petroleum business net sales and approximately 53% of the petroleum business net sales were made to its ten largest customers.
Competition
The petroleum business competes primarily on the basis of price, reliability of supply, availability of multiple grades of products and location. The principal competitive factors affecting its refining operations are cost of crude oil and other feedstock costs, refinery complexity, refinery efficiency, refinery product mix and product distribution and transportation costs. The location of the refineries provides the petroleum business with a reliable supply of crude oil and a transportation cost advantage over its competitors. The petroleum business primarily competes against five refineries operated in the mid-continent region. In addition to these refineries, the refineries compete against trading companies, as well as other refineries located outside the region that are linked to the mid-continent market through an extensive product pipeline system. These competitors include refineries located near the Gulf Coast and the Texas panhandle region. The petroleum business refinery competition also includes branded, integrated and independent oil refining companies, such as Phillips 66, HollyFrontier, CHS, Valero and Flint Hills Resources.
Seasonality
The petroleum business experiences seasonal effects as demand for gasoline products is generally higher during the summer months than during the winter months due to seasonal increases in highway traffic and road construction work. Demand for diesel fuel is higher during the planting and harvesting seasons. As a result, the petroleum business' results of operations for the first and fourth calendar quarters are generally lower compared to its results for the second and third calendar quarters. In addition, unseasonably cool weather in the summer months and/or unseasonably warm weather in the winter months in the markets in which the petroleum business sells its petroleum products can impact the demand for gasoline and diesel fuel. The demand for asphalt is also seasonal and is generally higher during the months of March through October.
Nitrogen Fertilizer Business
The nitrogen fertilizer business, operated by the Nitrogen Fertilizer Partnership, is the only nitrogen fertilizer plant in North America that utilizes a pet coke gasification process to produce nitrogen fertilizer products, which are used primarily by farmers to improve the yield and quality of their crops. The nitrogen fertilizer facility includes a 1,300 ton-per-day ammonia unit, a 3,000 ton-per-day UAN unit and a gasifier complex having a capacity of 89 million standard cubic feet per day of hydrogen. The nitrogen fertilizer business' principal products are UAN and ammonia. These products are manufactured at its facility in Coffeyville, Kansas. The nitrogen fertilizer business' product sales are heavily weighted toward UAN and all of its products are sold on a wholesale basis.
11
Raw Material Supply
The nitrogen fertilizer facility's primary input is pet coke. In contrast, substantially all of the nitrogen fertilizer business' competitors use natural gas as their primary raw material feedstock. Historically, pet coke has been less expensive than natural gas on a per ton of fertilizer produced basis. The nitrogen fertilizer facility's pet coke gasification process results in a significantly higher percentage of fixed costs than a natural gas-based fertilizer plant.
During the past five years, over 70% of the nitrogen fertilizer business' pet coke requirements on average were supplied by CVR Refining's adjacent crude oil refinery pursuant to a renewable long-term agreement. Historically the nitrogen fertilizer business has obtained the remainder of its pet coke requirements from third parties such as other Midwestern refineries or pet coke brokers at spot-prices. The Nitrogen Fertilizer Partnership is party to a pet coke supply agreement with HollyFrontier Corporation. The term of this agreement expires in December 2016. If necessary, the gasification process can be modified to operate on coal as an alternative, which provides an additional raw material source. There are significant supplies of coal within a 60-mile radius of the nitrogen fertilizer plant.
Linde LLC ("Linde") owns, operates, and maintains the air separation plant that provides contract volumes of oxygen, nitrogen, and compressed dry air to the facility for a monthly fee. The nitrogen fertilizer business provides and pays for all utilities required for operation of the air separation plant. The agreement with Linde expires in 2020.
Although the nitrogen fertilizer plant has its own boiler that is used to create start-up steam, it also has the ability to import start-up steam for the nitrogen fertilizer plant from the adjacent Coffeyville crude oil refinery and then export steam back to the crude oil refinery once all units in the nitrogen fertilizer plant are in service. Monthly charges and credits are recorded with the steam valued at the natural gas price for the month.
Nitrogen Production Process
The nitrogen fertilizer plant was built in 2000 with two separate gasifiers to provide redundancy and reliability. The plant uses a gasification process to convert pet coke to high purity hydrogen for subsequent conversion to ammonia. The nitrogen fertilizer plant is capable of producing approximately 1,300 tons per day of ammonia. Substantially all of the ammonia produced is converted to approximately 3,000 tons per day of UAN, which has historically commanded a premium price over ammonia. Typically, approximately 0.41 tons of ammonia is required to produce one ton of UAN. The nitrogen fertilizer business completed a significant two-year plant expansion in February 2013, which increased UAN production capacity by 400,000 tons or approximately 50%, per year. The expanded facility was operating at full rates at the end of the first quarter of 2013. In 2015, the nitrogen fertilizer business produced 928,600 tons of UAN and 385,400 tons of ammonia. Approximately 96% of the produced ammonia tons and the majority of the purchased ammonia were upgraded into UAN.
The nitrogen fertilizer business schedules and provides routine maintenance to its critical equipment using its own maintenance technicians. Pursuant to a Technical Services Agreement with an affiliate of the General Electric Company ("General Electric"), which licenses the gasification technology to the nitrogen fertilizer business, General Electric provides technical advice and technological updates from their ongoing research as well as other licensees' operating experiences. The pet coke gasification process is licensed from General Electric pursuant to a perpetual license agreement that is fully paid. The license grants the nitrogen fertilizer business perpetual rights to use the pet coke gasification process on specified terms and conditions.
Distribution, Sales and Marketing
The primary geographic markets for the nitrogen fertilizer business' fertilizer products are Kansas, Missouri, Nebraska, Iowa, Illinois, Colorado and Texas. The nitrogen fertilizer business markets the UAN products to agricultural customers and the ammonia products to industrial and agricultural customers.
UAN and ammonia are distributed by truck or by railcar. If delivered by truck, products are sold on a freight-on-board basis, and freight is normally arranged by the customer. The nitrogen fertilizer business leases and owns a fleet of railcars for use in product delivery. The nitrogen fertilizer business incurs costs to maintain and repair its railcar fleet that include expenses related to regulatory inspections and repairs. For example, many of the nitrogen fertilizer business' railcars require specific regulatory inspections and repairs due on ten-year intervals. The extent and frequency of railcar fleet maintenance and repair costs are generally expected to change based partially on when regulatory inspections and repairs are due for its railcars under the relevant regulations. The nitrogen fertilizer business operates eight rail loading and two truck loading racks for UAN. It also operates four rail loading and two truck loading racks for ammonia.
12
The nitrogen fertilizer business owns all of the truck and rail loading equipment at the nitrogen fertilizer facility. The nitrogen fertilizer business also utilizes two separate UAN storage tanks and related truck and railcar load-out facilities. Each of these facilities, located in Phillipsburg and Dartmouth, Kansas, has a UAN storage tank that has a capacity of two million gallons, or approximately 10,000 tons. The Phillipsburg property that the terminal was constructed on is owned by a subsidiary of CVR Refining, which operates the terminal. The Dartmouth terminal is located on leased property owned by the Pawnee County Cooperative Association, which operates the terminal. The purpose of the UAN terminals is to collectively distribute approximately 40,000 tons of UAN fertilizer annually.
The nitrogen fertilizer business markets agricultural products to destinations that produce strong margins. The UAN market is primarily located near the Union Pacific Railroad lines or destinations that can be supplied by truck. The ammonia market is primarily located near the Burlington Northern Santa Fe or Kansas City Southern Railroad lines or destinations that can be supplied by truck.
The nitrogen fertilizer business often uses forward sales of fertilizer products to optimize its asset utilization, planning process and production scheduling. These sales are made by offering customers the opportunity to purchase product on a forward basis at prices and delivery dates that it proposes. The nitrogen fertilizer business uses this program to varying degrees during the year and between years depending on market conditions and has the flexibility to increase or decrease forward sales depending on management's view as to whether price environments will be increasing or decreasing. Fixing the selling prices of nitrogen fertilizer products months in advance of their ultimate delivery to customers typically causes the nitrogen fertilizer business reported selling prices and margins to differ from spot market prices and margins available at the time of shipment. Cash received as a result of prepayments is recognized as deferred revenue on the Consolidated Balance Sheet upon receipt, and revenue and resultant net income and EBITDA are recorded as the product is delivered to the customer.
Customers
The nitrogen fertilizer business sells UAN products to retailers and distributors. In addition, it sells ammonia to agricultural and industrial customers. Some of its larger customers include Crop Production Services, Inc., Gavilon Fertilizer, LLC, Interchem, J.R. Simplot, Inc., MFA and United Suppliers, Inc. Given the nature of its business, and consistent with industry practice, the nitrogen fertilizer business does not have long-term minimum purchase contracts with its UAN and ammonia customers.
For the year ended December 31, 2015, the top five customers in the aggregate represented 39% of the nitrogen fertilizer business' net sales. The nitrogen fertilizer business' top two customers on a consolidated basis accounted for approximately 14% and 10%, respectively, of the nitrogen fertilizer business' net sales.
Competition
Competition in the nitrogen fertilizer industry is dominated by price considerations. However, during the spring and fall application seasons, farming activities intensify and delivery capacity is a significant competitive factor. The nitrogen fertilizer business maintains a large fleet of leased and owned railcars and seasonally adjusts inventory to enhance its manufacturing and distribution operations.
The nitrogen fertilizer business' major competitors include Agrium, Inc.; Koch Nitrogen Company, LLC; Potash Corporation of Saskatchewan, Inc.; CF Industries Holdings, Inc. and Terra Nitrogen Company, LP. Domestic competition is intense due to customers' sophisticated buying tendencies and competitor strategies that focus on cost and service. The nitrogen fertilizer business also encounters competition from producers of fertilizer products manufactured in foreign countries. In certain cases, foreign producers of fertilizer who export to the United States may be subsidized by their respective governments.
Based on third-party expert data regarding total United States demand for UAN and ammonia, we estimate that the nitrogen fertilizer plant's UAN capacity in 2015 represented approximately 7% of total U.S. UAN demand and that the net ammonia produced and marketed at its facility represented less than 1% of total U.S. ammonia demand.
Seasonality
Because the nitrogen fertilizer business primarily sells agricultural commodity products, its business is exposed to seasonal fluctuations in demand for nitrogen fertilizer products in the agricultural industry. As a result, the nitrogen fertilizer business typically generates greater net sales in the first half of each calendar year, which is referred to as the planting season, and its net sales tend to be lower during the second half of each calendar year, which is referred to as the fill season.
13
Environmental Matters
The petroleum and nitrogen fertilizer businesses are subject to extensive and frequently changing federal, state and local, environmental and health and safety laws and regulations governing the emission and release of hazardous substances into the environment, the treatment and discharge of waste water, the storage, handling, use and transportation of petroleum and nitrogen products, and the characteristics and composition of gasoline and diesel fuels. These laws and regulations, their underlying regulatory requirements and the enforcement thereof impact the petroleum business and operations and the nitrogen fertilizer business and operations by imposing:
• | restrictions on operations or the need to install enhanced or additional controls; |
• | the need to obtain and comply with permits, licenses and authorizations; |
• | requirements for the investigation and remediation of contaminated soil and groundwater at current and former facilities (if any) and liability for off-site waste disposal locations; and |
• | specifications for the products marketed by the petroleum business and the nitrogen fertilizer business, primarily gasoline, diesel fuel, UAN and ammonia. |
Our operations require numerous permits, licenses and authorizations. Failure to comply with these permits or environmental laws and regulations could result in fines, penalties or other sanctions or a revocation of our permits. In addition, the laws and regulations to which we are subject are often evolving and many of them have become more stringent or have become subject to more stringent interpretation or enforcement by federal or state agencies. The ultimate impact on our business of complying with evolving laws and regulations is not always clearly known or determinable due in part to the fact that our operations may change over time and certain implementing regulations for laws, such as the federal Clean Air Act, have not yet been finalized, are under governmental or judicial review or are being revised. These laws and regulations could result in increased capital, operating and compliance costs.
The principal environmental risks associated with our businesses are outlined below with additional details included in Part I, Item 1A, Risk Factors and Part II, Item 8, Note 13 ("Commitments and Contingencies") of this Report.
The Federal Clean Air Act
The federal Clean Air Act and its implementing regulations, as well as the corresponding state laws and regulations that regulate emissions of pollutants into the air, affect the petroleum business and the nitrogen fertilizer business both directly and indirectly. Direct impacts may occur through the federal Clean Air Act's permitting requirements and/or emission control requirements relating to specific air pollutants, as well as the requirement to maintain a risk management program to help prevent accidental releases of certain regulated substances. The federal Clean Air Act indirectly affects the petroleum business and the nitrogen fertilizer business by extensively regulating the air emissions of sulfur dioxide ("SO2"), volatile organic compounds, nitrogen oxides and other substances, including those emitted by mobile sources, which are direct or indirect users of our products.
Some or all of the standards promulgated pursuant to the federal Clean Air Act, or any future promulgations of standards, may require the installation of controls or changes to the petroleum business or the nitrogen fertilizer facilities in order to comply. If new controls or changes to operations are needed, the costs could be material. These new requirements, other requirements of the federal Clean Air Act, or other presently existing or future environmental regulations could cause us to expend substantial amounts to comply and/or permit our facilities to produce products that meet applicable requirements.
The regulation of air emissions under the federal Clean Air Act requires that we obtain various construction and operating permits and incur capital expenditures for the installation of certain air pollution control devices at the petroleum and nitrogen fertilizer operations when regulations change or we add new equipment or modify existing equipment. Various regulations specific to our operations have been implemented, such as National Emission Standard for Hazardous Air Pollutants ("NESHAP"), New Source Performance Standards ("NSPS") and New Source Review/Prevention of Significant Deterioration ("PSD"). We have incurred, and expect to continue to have to make, substantial capital expenditures to attain or maintain compliance with these and other air emission regulations that have been promulgated or may be promulgated or revised in the future.
14
On September 12, 2012, the U.S. Environmental Protection Agency (the "EPA") published in the Federal Register final revisions to its NSPS for process heaters and flares at petroleum refineries. The EPA originally issued final standards in June 2008, but the portions of the rule relating to process heaters and flares were stayed pending reconsideration of certain provisions. The final standards regulate emissions of nitrogen oxide from process heaters and emissions of SO2 from flares, as well as require certain work practice and monitoring standards for flares. We do not believe that the costs of complying with the rule will be material.
On August 14, 2012, the EPA sent both the Wynnewood and Coffeyville refineries letters regarding the EPA's 2012 enforcement alert entitled EPA Enforcement Targets Flaring Efficiency Violations signaling the agency's intention to begin a national enforcement program to conduct compliance evaluations and take enforcement actions against petroleum refining companies that operate flares that are not in compliance with standards articulated in the Enforcement Alert. The Enforcement Alert identified new standards that refiners are required to meet for flaring combustion efficiency. The EPA entered into consent decrees with several refining companies. Because the EPA has not specifically told us that our operations are not in compliance, we cannot say with certainty whether or when we may become an enforcement target under this initiative.
Refer to Part II, Item 8, Note 13 ("Commitments and Contingencies") of this Report for further discussion of recent environmental matters related to the Clean Air Act including the "Flood, Crude Oil Discharge and Insurance" and certain "Environmental, Health and Safety ("EHS") Matters," such as the "Coffeyville Second Consent Decree," "Wynnewood Clean Air Act Compliance" and other compliance evaluations.
The Coffeyville refinery's Clean Air Act Title V operating permit has expired, and has not yet been re-issued. The Coffeyville refinery timely submitted an application for renewal, and therefore is authorized under the regulations to operate under the current permit until the permit is re-issued. The permit renewal process has begun, and capital costs or expenses, if any, related to changes to these permits are not known yet, but are not expected to be material.
The Federal Clean Water Act
The federal Clean Water Act ("CWA") and its implementing regulations, as well as the corresponding state laws and regulations that regulate the discharge of pollutants into the water, affect the petroleum business and the nitrogen fertilizer business. Direct impacts occur through the CWA's permitting requirements, which establish discharge limitations based on technology standards, water quality standards, and restrictions on the total maximum daily load of pollutants that may be released to a particular water body based on its use. In addition, water resources are becoming and in the future may become scarcer, and many refiners, including CRRM and Wynnewood Refining Company, LLC ("WRC"), are subject to restrictions on their ability to use water in the event of low availability conditions. Both CRRM and WRC have contracts in place to receive additional water during low-flow conditions, but these conditions could change over time if water becomes scarce.
The Wynnewood refinery's CWA permit ("OPDES permit") has expired. The refinery timely submitted their renewal application, and therefore is authorized to continue discharging under the expired permit until the Oklahoma Department of Environmental Quality ("ODEQ") re-issues the permit. The permit renewal process has begun, and capital costs or expenses related to changes to this permit, if any, are not expected to be material.
Release Reporting
The release of hazardous substances or extremely hazardous substances into the environment is subject to release reporting requirements under federal and state environmental laws. Our facilities periodically experience releases of hazardous substances and extremely hazardous substances. For example, the nitrogen fertilizer facility periodically experiences minor releases of hazardous and extremely hazardous substances from its equipment. Our facilities periodically have excess emission events from flaring and other planned and unplanned start-up, shutdown and malfunction events. Such releases are reported to the EPA and relevant state and local agencies. From time to time, the EPA has conducted inspections and issued information requests to us with respect to our compliance with release reporting requirements under the Comprehensive Environmental Response, Compensation and Liability Act ("CERCLA") and the Emergency Planning and Community Right-to-Know Act. If we fail to timely or properly report a release, or if the release violates the law or our permits, it could cause us to become the subject of a governmental enforcement action or third-party claims. Government enforcement or third-party claims relating to releases of hazardous or extremely hazardous substances could result in significant expenditures and liability.
15
Fuel Regulations
Tier 2, Low Sulfur Fuels. In February 2000, the EPA promulgated the Tier 2 Motor Vehicle Emission Standards Final Rule for all passenger vehicles, establishing standards for sulfur content in gasoline that were required to be met by 2006. In addition, in January 2001, the EPA promulgated its on-road diesel regulations, which required a 97% reduction in the sulfur content of diesel fuel sold for highway use by June 1, 2006, with full compliance by January 1, 2010. The refineries are in compliance with the EPA's low sulfur gasoline and diesel fuel standards.
Tier 3. In April 2014, the EPA promulgated the Tier 3 Motor Vehicle Emission and Fuel Standards, which will require that gasoline contain no more than ten parts per million of sulfur on an annual average basis. Refineries must be in compliance with the more stringent emission standards by January 1, 2017; however, compliance with the rule is extended until January 1, 2020 for approved small volume refineries and small refiners. In March 2015, the EPA approved the Wynnewood refinery's application requesting "small volume refinery" status; therefore, it's compliance deadline is January 1, 2020. It is not anticipated that the refineries will require additional controls or capital expenditures to meet the anticipated new standard.
Mobile Source Air Toxic II Emissions
In 2007, the EPA promulgated the Mobile Source Air Toxic II ("MSAT II") rule that requires the reduction of benzene in gasoline by 2011. The MSAT II projects for CRRM and WRC were completed within the compliance deadline of November 1, 2014. The projects were completed at a total cost of approximately $48.3 million and $89.0 million, excluding capitalized interest, by CRRM and WRC, respectively.
Renewable Fuel Standards
Refer to Part I, Item 1A, Risk Factors, If sufficient RINs are unavailable for purchase, if the petroleum business has to pay a significantly higher price for RINs or if the petroleum business is otherwise unable to meet the EPA's Renewable Fuels Standard (RFS) mandates, the petroleum business' financial condition and results of operations could be materially adversely affected, and Part II, Item 8, Note 13 ("Commitments and Contingencies"), "Environmental, Health and Safety ("EHS") Matters" of this Report for further discussion of the "Renewable Fuel Standards."
Greenhouse Gas Emissions
Refer to Part I, Item 1A, Risk Factors, Climate change laws and regulations could have a material adverse effect on our results of operations, financial condition and cash flows, of this Report for further discussion of the Greenhouse Gas ("GHG") Emissions regulations.
RCRA
Our operations are subject to the Resource Conservation and Recovery Act ("RCRA") requirements for the generation, transportation, treatment, storage and disposal of solid and hazardous wastes. When feasible, RCRA-regulated materials are recycled instead of being disposed of on-site or off-site. RCRA establishes standards for the management of solid and hazardous wastes. Besides governing current waste disposal practices, RCRA also addresses the environmental effects of certain past waste disposal practices, the recycling of wastes and the regulation of underground storage tanks containing regulated substances. Refer to Part II, Item 8, Note 13 ("Commitments and Contingencies"), "Environmental, Health and Safety ("EHS") Matters" for further discussion of "RCRA Compliance Matters."
Waste Management. There are two closed hazardous waste units at the Coffeyville refinery and eight other hazardous waste units in the process of being closed pending state agency approval. There is one closed hazardous waste unit and one active hazardous waste storage tank at the Wynnewood refinery. In addition, one closed interim status hazardous waste land farm located at the now-closed Phillipsburg terminal is under long-term post closure care.
Impacts of Past Manufacturing. The 2004 Consent Decree that CRRM signed with the EPA and the Kansas Department of Health and Environment (the "KDHE") required us to assume two RCRA corrective action orders issued to Farmland, the prior owner of the Coffeyville refinery. We are subject to a 1994 EPA administrative order related to investigation of possible past releases of hazardous materials to the environment at the Coffeyville refinery. In accordance with the order, we have documented existing soil and groundwater conditions, which require investigation or remediation projects. The now-closed Phillipsburg terminal is subject to a 1996 EPA administrative order related to investigation of releases of hazardous materials to the environment at the Phillipsburg terminal, which operated as a refinery until 1991. Remediation at both sites, if necessary, will be based on the results of the investigations. The Wynnewood refinery operates under a RCRA permit. A RCRA facility
16
investigation has been completed in accordance with the terms of the permit. Based on the facility investigation and other available information, ODEQ and WRC have entered into a Consent Order requiring further investigations of groundwater conditions and enhancements of existing remediation systems. Additional remediation, if necessary, will be based upon the results of the further investigation.
The anticipated investigation and remediation costs through 2019 were estimated, as of December 31, 2015, to be as follows:
Facility | Site Investigation Costs | Capital Costs | Total Operation & Maintenance Costs Through 2019 | Total Estimated Costs Through 2019 | |||||||||||
(in millions) | |||||||||||||||
Coffeyville Refinery | $ | 0.3 | $ | — | $ | 0.9 | $ | 1.2 | |||||||
Phillipsburg Terminal | 0.4 | — | 1.1 | 1.5 | |||||||||||
Wynnewood Refinery | 0.3 | — | 1.8 | 2.1 | |||||||||||
Total Estimated Costs | $ | 1.0 | $ | — | $ | 3.8 | $ | 4.8 | |||||||
These estimates are based on current information and could increase or decrease as additional information becomes available through our ongoing remediation and investigation activities. At this point, we have estimated that, over ten years starting in 2016, we will spend approximately $7.3 million to remedy impacts from past manufacturing activity at the Coffeyville refinery and to address existing soil and groundwater contamination at the now-closed Phillipsburg terminal and at the Wynnewood refinery. It is possible that additional costs will be required after this ten year period. We spent approximately $2.1 million in 2015 associated with related remediation.
Financial Assurance. We are required under the 2004 Consent Decree to establish financial assurance to secure the projected clean-up costs posed by the Coffeyville and the now-closed Phillipsburg facilities in the event we fail to fulfill our clean-up obligations. In accordance with the 2004 Consent Decree as modified by a 2010 agreement between CRRM, Coffeyville Resources Terminal, LLC, the EPA and the KDHE, this financial assurance is currently provided by a bond in the amount of $4.3 million for clean-up obligations at the Phillipsburg terminal and a letter of credit in the amount of $0.2 million for estimated costs to close regulated hazardous waste management units at the Coffeyville refinery. Additional self-funded financial assurance of approximately $4.9 million and $2.4 million is required by our post-closure care obligations and the 2004 Consent Decree for clean-up costs at the Coffeyville refinery and Phillipsburg terminal, respectively. The $4.3 million bond amount is reduced each year based on actual expenditures for corrective actions and the letter of credit and the self-funded mechanisms are re-evaluated and adjusted on an annual basis. Current RCRA financial assurance requirements for the Wynnewood refinery total $0.2 million for hazardous waste storage tank closure and post-closure monitoring of a closed storm water retention pond.
Environmental Remediation
Under the CERCLA, RCRA, and related state laws, certain persons may be liable for the release or threatened release of hazardous substances. These persons include the current owner or operator of property where a release or threatened release occurred, any persons who owned or operated the property when the release occurred, and any persons who disposed of, or arranged for the transportation or disposal of, hazardous substances at a contaminated property. Liability under CERCLA is strict, and under certain circumstances, joint and several, so that any responsible party may be held liable for the entire cost of investigating and remediating the release of hazardous substances. Similarly, the Oil Pollution Act of 1990 generally subjects owners and operators of facilities to strict, joint and several liability for all containment and clean-up costs, natural resource damages, and potential governmental oversight costs arising from oil spills into the waters of the United States, which has been broadly interpreted to include most water bodies including intermittent streams.
As is the case with all companies engaged in similar industries, we face potential exposure from future claims and lawsuits involving environmental matters, including soil and water contamination, personal injury or property damage allegedly caused by crude oil or hazardous substances that we manufactured, handled, used, stored, transported, spilled, disposed of or released. We cannot assure you that we will not become involved in future proceedings related to our release of hazardous or extremely hazardous substances or crude oil or that, if we were held responsible for damages in any existing or future proceedings, such costs would be covered by insurance or would not be material. Refer to Part II, Item 8, Note 13 ("Commitments and Contingencies"), "Flood, Crude Oil Discharge and Insurance" of this Report for discussion of the environmental remediation associated with the discharge of crude oil on July 1, 2007 at the Coffeyville refinery.
17
Environmental Insurance
We are covered by a site pollution legal liability insurance policy with an aggregate limit of $50.0 million per pollution condition, subject to a self-insured retention of $1.0 million. The policy includes business interruption coverage, subject to a 5-day waiting period deductible. This insurance expires on March 1, 2016 and is expected to be renewed without any material changes in terms. The policy insures any location owned, leased or rented or operated by the Company, including the Coffeyville refinery, the Wynnewood refinery and the nitrogen fertilizer facility. The policy insures certain pollution conditions at or migrating from a covered location, certain waste transportation and disposal activities and business interruption.
In addition to the site pollution legal liability insurance policy, we maintain umbrella and excess casualty insurance policies having an aggregate and occurrence limit of $200.0 million, subject to a self-insured retention of $2.0 million. This insurance provides coverage due to named perils for claims involving pollutants where the discharge is sudden and accidental and first commenced at a specific day and time during the policy period. The casualty insurance policies, including umbrella and excess policies, expire on March 1, 2016 and are expected to be renewed or replaced by insurance policies containing materially equivalent sudden and accidental pollution coverage with no reduction in limits.
The site pollution legal liability policy and the pollution coverage provided in the casualty insurance policies contain discovery requirements, reporting requirements, exclusions, definitions, conditions and limitations that could apply to a particular pollution claim, and there can be no assurance such claim will be adequately insured for all potential damages.
Safety, Health and Security Matters
We are subject to a number of federal and state laws and regulations related to safety, including the Occupational Safety and Health Act ("OSHA") and comparable state statutes, the purpose of which are to protect the health and safety of workers. We also are subject to OSHA Process Safety Management regulations, which are designed to prevent or minimize the consequences of catastrophic releases of toxic, reactive, flammable or explosive chemicals.
We operate a comprehensive safety, health and security program, with participation by employees at all levels of the organization. We have developed comprehensive safety programs aimed at preventing OSHA recordable incidents. Despite our efforts to achieve excellence in our safety and health performance, there can be no assurances that there will not be accidents resulting in injuries or even fatalities. We routinely audit our programs and consider improvements in our management systems.
The Wynnewood refinery has been the subject of a number of OSHA inspections since 2006. As a result of these inspections, the Wynnewood refinery has entered into four OSHA settlement agreements in 2008, pursuant to which it has agreed to undertake certain studies, conduct abatement activities, and revise and enhance certain OSHA compliance programs. The remaining costs associated with implementing these studies, abatement activities and program revisions are not expected to exceed $1.0 million.
Refer to Part II, Item 8, Note 13 ("Commitments and Contingencies"), "Wynnewood Refinery Incident" of this Report for further discussion of OSHA matters related to the Wynnewood refinery boiler explosion.
Process Safety Management. We maintain a process safety management ("PSM") program. This program is designed to address all aspects of the OSHA guidelines for developing and maintaining a comprehensive PSM program. We will continue to audit our programs and consider improvements in our management systems as well as our operations.
Emergency Planning and Response. We have an emergency response plan that describes the organization, responsibilities and plans for responding to emergencies in our facilities. This plan is communicated to local regulatory and community groups. We have on-site warning siren systems and personal radios. We will continue to audit our programs and consider improvements in our management systems and equipment.
18
Employees
As of December 31, 2015, 968 employees were employed by the petroleum business, 149 employees were employed by the nitrogen fertilizer business and 215 employees were employed by the Company at our offices in Sugar Land, Texas and Kansas City, Kansas. As of December 31, 2015, these employees are covered by health insurance, disability and retirement plans established by the Company. We believe that our relationship with our employees is good.
As of December 31, 2015, the Coffeyville refinery employed 610 of the petroleum business' employees, about 54% of whom were covered by a collective bargaining agreement. These employees are affiliated with five unions of the Metal Trades Department of the AFL-CIO ("Metal Trade Unions") and the United Steel, Paper and Forestry, Rubber, Manufacturing, Energy, Allied Industrial and Service Workers International Union, AFL-CIO-CLC ("United Steelworkers"). The petroleum business is a party to a collective bargaining agreement with the Metal Trade Unions covering union members who work directly at the Coffeyville refinery. The agreement expires in March 2019. In addition, a collective bargaining agreement with the United Steelworkers, which covers the balance of the petroleum business' unionized employees who work in crude transportation, expires in March 2017 and automatically renews on an annual basis thereafter unless a written notice is received sixty days in advance of the relevant expiration date.
As of December 31, 2015, the Wynnewood refinery employed 317 of the petroleum business' employees, about 59% of whom were represented by the International Union of Operating Engineers. The collective bargaining agreement with the International Union of Operating Engineers with respect to the Wynnewood refinery expires in June 2017.
Available Information
Our website address is www.cvrenergy.com. Our annual reports on Form 10-K, quarterly reports on Form 10-Q, current reports on Form 8-K, and all amendments to those reports, are available free of charge through our website under "Investor Relations," as soon as reasonably practicable after the electronic filing of these reports is made with the Securities and Exchange Commission (the "SEC"). In addition, our Corporate Governance Guidelines, Codes of Ethics and Charters of the Audit Committee, the Nominating and Corporate Governance Committee and the Compensation Committee of the Board of Directors are available on our website. These guidelines, policies and charters are also available in print without charge to any stockholder requesting them. We do not intend for information contained in our website to be part of this Report.
Trademarks, Trade Names and Service Marks
This Report may include our and our affiliates' trademarks, including the CVR Energy logo, Coffeyville Resources, the Coffeyville Resources logo, the CVR Refining, LP logo and the CVR Partners, LP logo, each of which is registered or for which we are applying for federal registration with the United States Patent and Trademark Office. This Report may also contain trademarks, service marks, copyrights and trade names of other companies.
19
Item 1A. Risk Factors
You should carefully consider each of the following risks together with the other information contained in this Report and all of the information set forth in our filings with the SEC. If any of the following risks and uncertainties develops into actual events, our business, financial condition or results of operations could be materially adversely affected.
Risks Related to the Petroleum Business
The price volatility of crude oil and other feedstocks, refined products and utility services may have a material adverse effect on the petroleum business' earnings, profitability and cash flows.
The petroleum business' financial results are primarily affected by the relationship, or margin, between refined product prices and the prices for crude oil and other feedstocks. When the margin between refined product prices and crude oil and other feedstock prices tightens, the petroleum business' earnings, profitability and cash flows are negatively affected. Refining margins historically have been volatile and are likely to continue to be volatile, as a result of a variety of factors including fluctuations in prices of crude oil, other feedstocks and refined products. Continued future volatility in refining industry margins may cause a decline in the petroleum business' results of operations, since the margin between refined product prices and crude oil and other feedstock prices may decrease below the amount needed for the petroleum business to generate net cash flow sufficient for its needs. The effect of changes in crude oil prices on the petroleum business' results of operations therefore depends in part on how quickly and how fully refined product prices adjust to reflect these changes. A substantial or prolonged increase in crude oil prices without a corresponding increase in refined product prices, or a substantial or prolonged decrease in refined product prices without a corresponding decrease in crude oil prices, could have a significant negative impact on the petroleum business' earnings, results of operations and cash flows.
Profitability is also impacted by the ability to purchase crude oil at a discount to benchmark crude oils, such as WTI, as the petroleum business does not produce any crude oil and must purchase all of the crude oil it refines. Crude oil differentials can fluctuate significantly based upon overall economic and crude oil market conditions. Adverse changes in crude oil differentials can adversely impact refining margins, earnings and cash flows. In addition, the petroleum business' purchases of crude oil, although based on WTI prices, have historically been at a discount to WTI because of the proximity of the refineries to the sources, existing logistics infrastructure and quality differences. Any change in the sources of crude oil, infrastructure or logistical improvements or quality differences could result in a reduction of the petroleum business' historical discount to WTI and may result in a reduction of the petroleum business' cost advantage.
Refining margins are also impacted by domestic and global refining capacity. Downturns in the economy reduce the demand for refined fuels and, in turn, generate excess capacity. In addition, the expansion and construction of refineries domestically and globally can increase refined fuel production capacity. Excess capacity can adversely impact refining margins, earnings and cash flows. The Arabian Gulf and Far East regions have added refining capacity in 2015 and 2016.
The petroleum business is significantly affected by developments in the markets in which it operates. For example, numerous pipeline projects in 2014 expanded the connectivity of the Cushing and Permian Basin markets to the gulf coast, resulting in a decrease in the domestic crude advantage.
Volatile prices for natural gas and electricity also affect the petroleum business' manufacturing and operating costs. Natural gas and electricity prices have been, and will continue to be, affected by supply and demand for fuel and utility services in both local and regional markets.
If the petroleum business is required to obtain its crude oil supply without the benefit of a crude oil supply agreement, its exposure to the risks associated with volatile crude oil prices may increase and its liquidity may be reduced.
Since December 31, 2009, the petroleum business has obtained substantially all of its crude oil supply for the Coffeyville refinery, other than the crude oil it gathers, through the Vitol Agreement. The Vitol Agreement was amended and restated on August 31, 2012 to include the provision of crude oil intermediation services to the Wynnewood refinery. The agreement, which currently extends through December 31, 2016, minimizes the amount of in-transit inventory and mitigates crude oil pricing risk by ensuring pricing takes place close to the time the crude oil is refined and the yielded products are sold. If the petroleum business were required to obtain its crude oil supply without the benefit of a supply intermediation agreement, its exposure to crude oil pricing risk may increase, despite any hedging activity in which it may engage, and its liquidity could be negatively impacted due to increased inventory, potential need to post letters of credit and negative impacts of market volatility. There is no assurance that the petroleum business will be able to renew or extend the Vitol Agreement beyond December 31, 2016.
20
Disruption of the petroleum business' ability to obtain an adequate supply of crude oil could reduce its liquidity and increase its costs.
In addition to the crude oil the petroleum business gathers locally in Kansas, Nebraska, Oklahoma, Missouri, Colorado and Texas, it also purchased additional crude oil to be refined into liquid fuels in 2015. In 2015, the Coffeyville refinery purchased an additional 65,000 to 70,000 bpd of crude oil while the Wynnewood refinery purchased approximately 45,000 to 50,000 bpd of crude oil. The Wynnewood refinery has historically acquired most of its crude oil from Texas and Oklahoma with smaller amounts purchased from other regions. The Coffeyville refinery and Wynnewood refinery obtained a portion of its non-gathered crude oil, approximately 23% and 1%, respectively, in 2015, from Canada. The actual amount of Canadian crude oil the petroleum business purchases is dependent on market conditions and will vary from year to year. The petroleum business is subject to the political, geographic, and economic risks attendant to doing business with Canada. Disruption of production for any reason could have a material impact on the petroleum business. In the event that one or more of its traditional suppliers becomes unavailable, the petroleum business may be unable to obtain an adequate supply of crude oil, or it may only be able to obtain crude oil at unfavorable prices. As a result, the petroleum business may experience a reduction in its liquidity and its results of operations could be materially adversely affected.
If our access to the pipelines on which the petroleum business relies for the supply of its crude oil and the distribution of its products is interrupted, its inventory and costs may increase and it may be unable to efficiently distribute its products.
If one of the pipelines on which either of the Coffeyville or Wynnewood refineries relies for supply of crude oil becomes inoperative, the petroleum business would be required to obtain crude oil through alternative pipelines or from additional tanker trucks, which could increase its costs and result in lower production levels and profitability. Similarly, if a major refined fuels pipeline becomes inoperative, the petroleum business would be required to keep refined fuels in inventory or supply refined fuels to its customers through an alternative pipeline or by additional tanker trucks, which could increase the petroleum business' costs and result in a decline in profitability.
The geographic concentration of the petroleum business' refineries and related assets creates an exposure to the risks of the local economy in which we operate and other local adverse conditions. The location of its refineries also creates the risk of increased transportation costs should the supply/demand balance change in its region such that regional supply exceeds regional demand for refined products.
As the petroleum business' refineries are both located in the southern portion of Group 3 of the PADD II region, the petroleum business primarily markets its refined products in a relatively limited geographic area. As a result, it is more susceptible to regional economic conditions than the operations of more geographically diversified competitors, and any unforeseen events or circumstances that affect its operating area could also materially adversely affect its revenues and cash flows. These factors include, among other things, changes in the economy, weather conditions, demographics and population, increased supply of refined products from competitors and reductions in the supply of crude oil.
Should the supply/demand balance shift in its region as a result of changes in the local economy, an increase in refining capacity or other reasons, resulting in supply in the region exceeding demand, the petroleum business may have to deliver refined products to customers outside of the region and thus incur considerably higher transportation costs, resulting in lower refining margins, if any.
If sufficient RINs are unavailable for purchase, if the petroleum business has to pay a significantly higher price for RINs or if the petroleum business is otherwise unable to meet the EPA's Renewable Fuels Standard (RFS) mandates, the petroleum business' financial condition and results of operations could be materially adversely affected.
Pursuant to the Energy Independence and Security Act of 2007, the EPA has promulgated the Renewable Fuel Standards ("RFS"), which requires refiners to either blend "renewable fuels," such as ethanol and biodiesel, into their transportation fuels or purchase renewable fuel credits, known as RINs, in lieu of blending. Under the RFS, the volume of renewable fuels refineries like Coffeyville and Wynnewood are obligated to blend into their finished petroleum products is adjusted annually. The petroleum business is not able to blend the substantial majority of its transportation fuels and has to purchase RINs on the open market as well as waiver credits for cellulosic biofuels from the EPA, in order to comply with the RFS. The price of RINs has been extremely volatile as the EPA's proposed renewable fuel volume mandates approached the "blend wall." The blend wall refers to the point at which the amount of ethanol blended into the transportation fuel supply exceeds the demand for transportation fuel containing such levels of ethanol. The blend wall is generally considered to be reached when more than 10% ethanol by volume ("E10 gasoline") is blended into transportation fuel.
21
On December 14, 2015, the EPA published in the Federal Register a final rule establishing the renewable fuel volume mandates for 2014, 2015 and 2016, and the biomass-based diesel mandate for 2017. The volumes included in the EPA's final rule increase each year, but are lower, with the exception of the volumes for biomass-based diesel, than the volumes required by the Clean Air Act. The EPA used its waiver authority to lower the volumes, but its decision to do so has been challenged in the U.S. Court of Appeals for the District of Columbia Circuit. In addition, in the final rule establishing the renewable volume obligations for 2014-2016 and bio-mass based diesel for 2017, the EPA articulated a policy to incentivize additional investments in renewable fuel blending and distribution infrastructure by increasing the price of RINs.
The petroleum business cannot predict the future prices of RINs or waiver credits. The price of RINs has been extremely volatile and has increased over the last year. Additionally, the cost of RINs is dependent upon a variety of factors, which include the availability of RINs for purchase, the price at which RINs can be purchased, transportation fuel production levels, the mix of the petroleum business' petroleum products, as well as the fuel blending performed at the refineries and downstream terminals, all of which can vary significantly from period to period. However, the costs to obtain the necessary number of RINs and waiver credits could be material, if the price for RINs continues to increase. Additionally, because the petroleum business does not produce renewable fuels, increasing the volume of renewable fuels that must be blended into its products displaces an increasing volume of the refineries' product pool, potentially resulting in lower earnings and materially adversely affecting the petroleum business' cash flows. If the demand for the petroleum business' transportation fuel decreases as a result of the use of increasing volumes of renewable fuels, increased fuel economy as a result of new EPA fuel economy standards, or other factors, the impact on its business could be material. If sufficient RINs are unavailable for purchase, if the petroleum business has to pay a significantly higher price for RINs or if the petroleum business is otherwise unable to meet the EPA's RFS mandates, its business, financial condition and results of operations could be materially adversely affected.
The petroleum business faces significant competition, both within and outside of its industry. Competitors who produce their own supply of crude oil or other feedstocks, have extensive retail outlets, make alternative fuels or have greater financial resources than it does may have a competitive advantage.
The refining industry is highly competitive with respect to both crude oil and other feedstock supply and refined product markets. The petroleum business may be unable to compete effectively with competitors within and outside of the industry, which could result in reduced profitability. The petroleum business competes with numerous other companies for available supplies of crude oil and other feedstocks and for outlets for its refined products. The petroleum business is not engaged in the petroleum exploration and production business and therefore it does not produce any of its crude oil feedstocks. It does not have a retail business and therefore is dependent upon others for outlets for its refined products. It does not have long-term arrangements (those exceeding more than a twelve-month period) for much of its output. Many of its competitors obtain significant portions of their crude oil and other feedstocks from company-owned production and have extensive retail outlets. Competitors that have their own production or extensive retail outlets with brand-name recognition are at times able to offset losses from refining operations with profits from producing or retailing operations, and may be better positioned to withstand periods of depressed refining margins or feedstock shortages.
A number of the petroleum business' competitors also have materially greater financial and other resources than it does. These competitors may have a greater ability to bear the economic risks inherent in all aspects of the refining industry. An expansion or upgrade of its competitors' facilities, price volatility, international political and economic developments and other factors are likely to continue to play an important role in refining industry economics and may add additional competitive pressure.
In addition, the petroleum business competes with other industries that provide alternative means to satisfy the energy and fuel requirements of its industrial, commercial and individual customers. There are presently significant governmental incentives and consumer pressures to increase the use of alternative fuels in the United States. The more successful these alternatives become as a result of governmental incentives or regulations, technological advances, consumer demand, improved pricing or otherwise, the greater the negative impact on pricing and demand for the petroleum business' products and profitability.
Changes in the petroleum business' credit profile may affect its relationship with its suppliers, which could have a material adverse effect on its liquidity and its ability to operate the refineries at full capacity.
Changes in the petroleum business' credit profile may affect the way crude oil suppliers view its ability to make payments and may induce them to shorten the payment terms for purchases or require it to post security prior to payment. Given the large dollar amounts and volume of the petroleum business' crude oil and other feedstock purchases, a burdensome change in payment terms may have a material adverse effect on the petroleum business' liquidity and its ability to make payments to its
22
suppliers. This, in turn, could cause it to be unable to operate the refineries at full capacity. A failure to operate the refineries at full capacity could adversely affect the petroleum business' profitability and cash flows.
The petroleum business' commodity derivative contracts may limit its potential gains, exacerbate potential losses and involve other risks.
The petroleum business enters into commodity derivatives contracts to mitigate crack spread risk with respect to a portion of its expected refined products production. However, its hedging arrangements may fail to fully achieve this objective for a variety of reasons, including its failure to have adequate hedging contracts, if any, in effect at any particular time and the failure of its hedging arrangements to produce the anticipated results. The petroleum business may not be able to procure adequate hedging arrangements due to a variety of factors. Moreover, such transactions may limit its ability to benefit from favorable changes in margins. In addition, the petroleum business' hedging activities may expose it to the risk of financial loss in certain circumstances, including instances in which:
• | the volumes of its actual use of crude oil or production of the applicable refined products is less than the volumes subject to the hedging arrangement; |
• | accidents, interruptions in transportation, inclement weather or other events cause unscheduled shutdowns or otherwise adversely affect its refinery or suppliers or customers; |
• | the counterparties to its futures contracts fail to perform under the contracts; or |
• | a sudden, unexpected event materially impacts the commodity or crack spread subject to the hedging arrangement. |
As a result, the effectiveness of the petroleum business' risk mitigation strategy could have a material adverse impact on the petroleum business' financial results and cash flows.
The adoption of derivatives legislation by the U.S. Congress could have an adverse effect on the petroleum business' ability to hedge risks associated with its business.
The U.S. Congress has adopted the Dodd-Frank Act, comprehensive financial reform legislation that establishes federal oversight and regulation of the over-the-counter derivatives market and entities, such as the petroleum business, that participate in that market, and requires the Commodities Futures Trading Commission ("CFTC") to institute broad new position limits for futures and options traded on regulated exchanges. The Dodd-Frank Act requires the CFTC, the SEC and other regulators to promulgate rules and regulations implementing the new legislation. The Dodd-Frank Act and implementing rules and regulations also require certain swap participants to comply with, among other things, certain margin requirements and clearing and trade-execution requirements in connection with certain derivative activities. The rulemaking process is still ongoing, and the petroleum business cannot predict the ultimate outcome of the rulemakings. New regulations in this area may result in increased costs and cash collateral requirements for derivative instruments the petroleum business may use to hedge and otherwise manage its financial risks related to volatility in oil and gas commodity prices.
If the petroleum business reduces its use of derivatives as a result of the Dodd-Frank Act and any new rules and regulations, its results of operations may become more volatile and its cash flows may be less predictable, which could adversely affect its ability to satisfy its debt obligations or plan for and fund capital expenditures. Increased volatility may make the petroleum business less attractive to certain types of investors. Finally, the Dodd-Frank Act was intended, in part, to reduce the volatility of oil and natural gas prices. If the Dodd-Frank Act and any new regulations result in lower commodity prices, the petroleum business' revenues could be adversely affected. Any of these consequences could adversely affect the petroleum business' financial condition and results of operations and therefore could have an adverse effect on its ability to satisfy its debt obligations.
The petroleum business' commodity derivative activities could result in period-to-period volatility.
The petroleum business does not apply hedge accounting to its commodity derivative contracts and, as a result, unrealized gains and losses are charged to its earnings based on the increase or decrease in the market value of the unsettled position. Such gains and losses are reflected in its income statement in periods that differ from when the underlying hedged items (i.e., gross margins) are reflected in its income statement. Such derivative gains or losses in earnings may produce significant period-to-period earnings volatility that is not necessarily reflective of the petroleum business' operational performance.
23
Existing design, operational, and maintenance issues associated with acquisitions may not be identified immediately and may require unanticipated capital expenditures that could adversely impact our financial condition, results of operations or cash flows.
Our due diligence associated with acquisitions may result in our assuming liabilities associated with unknown conditions or deficiencies, as well as known but undisclosed conditions and deficiencies, where we may have limited, if any, recourse for cost recovery. Such conditions and deficiencies may not become evident until sometime after cost recovery provisions, if any, have expired.
The petroleum business must make substantial capital expenditures on its refineries and other facilities to maintain their reliability and efficiency. If the petroleum business is unable to complete capital projects at their expected costs and/or in a timely manner, or if the market conditions assumed in project economics deteriorate, the petroleum business' financial condition, results of operations or cash flows could be adversely affected.
Delays or cost increases related to the engineering, procurement and construction of new facilities, or improvements and repairs to the petroleum business' existing facilities and equipment, could have a material adverse effect on the petroleum business' financial condition, results of operations or cash flows. Such delays or cost increases may arise as a result of unpredictable factors in the marketplace, many of which are beyond its control, including:
• | denial or delay in obtaining regulatory approvals and/or permits; |
• | unplanned increases in the cost of equipment, materials or labor; |
• | disruptions in transportation of equipment and materials; |
• | severe adverse weather conditions, natural disasters or other events (such as equipment malfunctions, explosions, fires or spills) affecting the petroleum business' facilities, or those of its vendors and suppliers; |
• | shortages of sufficiently skilled labor, or labor disagreements resulting in unplanned work stoppages; |
• | market-related increases in a project's debt or equity financing costs; and/or |
• | nonperformance or force majeure by, or disputes with, the petroleum business' vendors, suppliers, contractors or sub-contractors. |
The Coffeyville and Wynnewood refineries have been in operation for many years. Equipment, even if properly maintained, may require significant capital expenditures and expenses to keep it operating at optimum efficiency. For example, the petroleum business incurred approximately $101.5 million with the first phase of the Coffeyville refinery turnaround completed in mid-November 2015 and incurred approximately $102.5 million associated with the turnaround for the Wynnewood refinery completed in December 2012. During the outage at the Coffeyville refinery as a result of the isomerization unit fire in the third quarter of 2014, the petroleum business accelerated certain planned 2015 turnaround activities and incurred approximately $5.5 million in turnaround expenses. During the fluid catalytic cracking unit ("FCCU") outage at the Wynnewood refinery in the fourth quarter of 2014, the petroleum business accelerated certain planned turnaround activities and incurred approximately $1.3 million in turnaround expenses. These costs do not result in increases in unit capacities, but rather are focused on trying to maintain safe, reliable operations. The second phase of the Coffeyville refinery turnaround is scheduled to begin in late February 2016 at a total estimated cost of approximately $35.0 million to $38.0 million (of which approximately $0.7 million was incurred in the fourth quarter of 2015). The next turnaround for the Wynnewood refinery is scheduled to occur in the spring of 2017.
Any one or more of these occurrences noted above could have a significant impact on the petroleum business. If the petroleum business was unable to make up for the delays or to recover the related costs, or if market conditions change, it could materially and adversely affect the petroleum business' financial position, results of operations or cash flows.
The petroleum business' plans to expand its gathering and logistics assets, which assist it in reducing costs and increasing processing margins, may expose it to significant additional risks, compliance costs and liabilities.
The petroleum business plans to continue to make investments to enhance the operating flexibility of its refineries and to improve its crude oil sourcing advantage through additional investments in gathering and logistics assets. If it is able to successfully increase the effectiveness of the supporting gathering and logistics assets, including the crude oil gathering
24
operations, the petroleum business believes it will be able to enhance crude oil sourcing flexibility and reduce related crude oil purchasing and delivery costs. However, the acquisition of infrastructure assets to expand crude oil gathering may expose the petroleum business to risks in the future that are different than or incremental to the risks it faces with respect to its refineries and existing gathering and logistics assets. The storage and transportation of liquid hydrocarbons, including crude oil and refined products, are subject to stringent federal, state, and local laws and regulations governing the discharge of materials into the environment, operational safety and related matters. Compliance with these laws and regulations could adversely affect the petroleum business' operating results, financial condition and cash flows. Moreover, failure to comply with these laws and regulations may result in the assessment of administrative, civil, and criminal penalties, the imposition of investigatory and remedial liabilities, the issuance of injunctions that may restrict or prohibit the petroleum business' operations, or claims of damages to property or persons resulting from its operations.
Any businesses or assets that the petroleum business may acquire in connection with an expansion of its crude oil gathering could expose it to the risk of releasing hazardous materials into the environment. These releases would expose the petroleum business to potentially substantial expenses, including clean-up and remediation costs, fines and penalties, and third-party claims for personal injury or property damage related to past or future releases. Accordingly, if the petroleum business does acquire any such businesses or assets, it could also incur additional expenses not covered by insurance which could be material.
More stringent trucking regulations may increase the petroleum business' costs and negatively impact its results of operations.
In connection with the trucking operations conducted by its crude gathering division, the petroleum business operates as a motor carrier and therefore is subject to regulation by the U.S. Department of Transportation and various state agencies. These regulatory authorities exercise broad powers, governing activities such as the authorization to engage in motor carrier operations and regulatory safety, and hazardous materials labeling, placarding and marking. There are additional regulations specifically relating to the trucking industry, including testing and specification of equipment and product handling requirements. The trucking industry is subject to possible regulatory and legislative changes that may affect the economics of the industry by requiring changes in operating practices or by changing the demand for common or contract carrier services or the cost of providing truckload services. Some of these possible changes include increasingly stringent environmental regulations, changes in the hours of service regulations that govern the amount of time a driver may drive in any specific period, onboard black box recorder devices or limits on vehicle weight and size.
To a large degree, intrastate motor carrier operations are subject to state safety regulations that mirror federal regulations. Such matters as weight and dimension of equipment are also subject to federal and state regulations. Furthermore, from time to time, various legislative proposals are introduced, such as proposals to increase federal, state or local taxes, including taxes on motor fuels, which may increase the petroleum business' costs or adversely impact the recruitment of drivers. The petroleum business cannot predict whether, or in what form, any increase in such taxes will be enacted or the extent to which they will apply to the petroleum business and its operations.
Risks Related to the Nitrogen Fertilizer Business
The nitrogen fertilizer business is, and nitrogen fertilizer prices are, cyclical and highly volatile, and the nitrogen fertilizer business has experienced substantial downturns in the past. Cycles in demand and pricing could potentially expose the nitrogen fertilizer business to significant fluctuations in its operating and financial results and have a material adverse effect on the nitrogen fertilizer business' results of operations, financial condition and cash flows.
The nitrogen fertilizer business is exposed to fluctuations in nitrogen fertilizer demand in the agricultural industry. These fluctuations historically have had and could in the future have significant effects on prices across all nitrogen fertilizer products and, in turn, our results of operations, financial condition and cash flows.
Nitrogen fertilizer products are commodities, the price of which can be highly volatile. The prices of nitrogen fertilizer products depend on a number of factors, including general economic conditions, cyclical trends in end-user markets, supply and demand imbalances, governmental policies and weather conditions, which have a greater relevance because of the seasonal nature of fertilizer application. If seasonal demand exceeds the projections on which the nitrogen fertilizer business bases production, customers may acquire nitrogen fertilizer products from competitors, and the profitability of the nitrogen fertilizer business will be negatively impacted. If seasonal demand is less than expected, the nitrogen fertilizer business will be left with excess inventory that will have to be stored or liquidated.
25
Demand for nitrogen fertilizer products is dependent on demand for crop nutrients by the global agricultural industry. The international market for nitrogen fertilizers is influenced by such factors as the relative value of the U.S. dollar and its impact upon the cost of importing nitrogen fertilizers, foreign agricultural policies, the existence of, or changes in, import or foreign currency exchange barriers in certain foreign markets, changes in the hard currency demands of certain countries and other regulatory policies of foreign governments, as well as the laws and policies of the United States affecting foreign trade and investment. Nitrogen-based fertilizers remain solidly in demand, driven by a growing world population, changes in dietary habits and an expanded use of corn for the production of ethanol. Supply is affected by available capacity and operating rates, raw material costs, government policies and global trade. A decrease in nitrogen fertilizer prices would have a material adverse effect on the nitrogen fertilizer business' results of operations, financial condition and cash flows.
The costs associated with operating the nitrogen fertilizer plant are largely fixed. If nitrogen fertilizer prices fall below a certain level, the nitrogen fertilizer business may not generate sufficient revenue to operate profitably or cover its costs.
Unlike our competitors, whose primary costs are related to the purchase of natural gas and whose costs are therefore largely variable, the nitrogen fertilizer business has largely fixed costs. As a result of the fixed cost nature of its operations, downtime, interruptions or low productivity due to reduced demand, adverse weather conditions, equipment failure, a decrease in nitrogen fertilizer prices or other causes can result in significant operating losses which could have a material adverse effect on the nitrogen fertilizer business' results of operations, financial condition and cash flows.
Continued low natural gas prices could impact the nitrogen fertilizer business' relative competitive position when compared to other nitrogen fertilizer producers.
Most nitrogen fertilizer manufacturers rely on natural gas as their primary feedstock, and the cost of natural gas is a large component of the total production cost for natural gas-based nitrogen fertilizer manufacturers. Low natural gas prices benefit the nitrogen fertilizer business' competitors and disproportionately impact our operations by making the nitrogen fertilizer business less competitive with natural gas-based nitrogen fertilizer manufacturers. Continued low natural gas prices could impair the nitrogen fertilizer business' ability to compete with other nitrogen fertilizer producers who utilize natural gas as their primary feedstock if nitrogen fertilizer pricing drops as a result of low natural gas prices, and therefore have a material adverse impact on the cash flows of the nitrogen fertilizer business.
Any decline in U.S. agricultural production or limitations on the use of nitrogen fertilizer for agricultural purposes could have a material adverse effect on the sales of nitrogen fertilizer, and on the nitrogen fertilizer business' results of operations, financial condition and cash flows.
Conditions in the U.S. agricultural industry significantly impact the operating results of the nitrogen fertilizer business. The U.S. agricultural industry can be affected by a number of factors, including weather patterns and field conditions, current and projected grain inventories and prices, domestic and international population changes, demand for U.S. agricultural products and U.S. and foreign policies regarding trade in agricultural products.
The Agricultural Act of 2014 (the "2014 Farm Bill") ends direct subsidies to agricultural producers for owning farmland, and funds a new crop insurance program in its place. As part of the conservation title of the 2014 Farm Bill, agricultural producers must meet a minimum standard of environmental protection in order to receive federal crop insurance on sensitive lands. The 2014 Farm Bill also discourages producers from converting native grasslands to farmland by limiting crop insurance subsidies for the first few years for newly converted lands. These changes may have a negative impact on fertilizer sales and on the nitrogen fertilizer business’ results of operations, financial condition and cash flows.
State and federal governmental policies, including farm and biofuel subsidies and commodity support programs, as well as the prices of fertilizer products, may also directly or indirectly influence the number of acres planted, the mix of crops planted and the use of fertilizers for particular agricultural applications. Developments in crop technology, such as nitrogen fixation (the conversion of atmospheric nitrogen into compounds that plants can assimilate), could also reduce the use of chemical fertilizers and adversely affect the demand for nitrogen fertilizer. In addition, from time to time various state legislatures have considered limitations on the use and application of chemical fertilizers due to concerns about the impact of these products on the environment. Unfavorable state and federal governmental policies could negatively affect nitrogen fertilizer prices and therefore have a material adverse effect on the nitrogen fertilizer business' results of operations, financial condition and cash flows.
26
A major factor underlying the current high level of demand for nitrogen-based fertilizer products is the production of ethanol. A decrease in ethanol production, an increase in ethanol imports or a shift away from corn as a principal raw material used to produce ethanol could have a material adverse effect on the nitrogen fertilizer business' results of operations, financial condition and cash flows.
A major factor underlying the solid level of demand for nitrogen-based fertilizer products produced by the nitrogen fertilizer business is the production of ethanol in the United States and the use of corn in ethanol production. Ethanol production in the United States is highly dependent upon a myriad of federal statutes and regulations, and is made significantly more competitive by various federal and state incentives and mandated usage of renewable fuels pursuant to the RFS. To date, the RFS has been satisfied primarily with fuel ethanol blended into gasoline. However, a number of factors, including the continuing "food versus fuel" debate and studies showing that expanded ethanol usage may increase the level of greenhouse gases in the environment as well as be unsuitable for small engine use, have resulted in calls to reduce subsidies for ethanol, allow increased ethanol imports and to repeal or waive (in whole or in part) the current RFS, any of which could have an adverse effect on corn-based ethanol production, planted corn acreage and fertilizer demand. Therefore, ethanol incentive programs may not be renewed, or if renewed, they may be renewed on terms significantly less favorable to ethanol producers than current incentive programs.
Recently, the volume of ethanol required by the RFS standards to be blended into transportation fuel has approached the "blend wall." The blend wall is the maximum amount of ethanol that can be blended into the transportation fuel supply because of limitations like the ability of cars to use higher ethanol blended fuels and limitations on the blending and distribution infrastructure. The blend wall is generally considered to be reached when more than 10% ethanol by volume ("E10 gasoline") is blended into transportation fuel. On December 14, 2015, the EPA published in the Federal Register a final rule establishing the renewable fuel volume mandates for 2014, 2015 and 2016, and the biomass-based diesel mandate for 2017. The volumes included in EPA's final rule increase each year, but are lower, with the exception of the volumes for biomass-based diesel, than the volumes required by the Clean Air Act. The EPA used its waiver authority to lower the volumes, but its decision to do so has been challenged in the U.S. Court of Appeals for the District of Columbia Circuit by corn growers and renewable fuels producers. The renewable fuel volume mandate for 2016 is expected to breach the blend wall, forcing higher ethanol fuel blends, including fuels with 15% or 85% ethanol, or non-ethanol renewable fuel that is not constrained by the blend wall. In addition, in the final rule establishing the renewable volume obligations for 2014-2016 and bio-mass based diesel for 2017, the EPA articulated a policy to incentivize additional investments in renewable fuel blending and distribution infrastructure by increasing the price of RINs. Any substantial decrease in future volume obligations under RFS could have a material adverse effect on ethanol production in the United States, which could have a material adverse effect on the nitrogen fertilizer business' results of operations, financial condition and ability to make cash distributions.
Further, while most ethanol is currently produced from corn and other raw grains, such as milo or sorghum, the current RFS mandate requires a portion of the overall RFS mandate to come from advanced biofuels, including cellulose-based biomass, such as agricultural waste, forest residue, municipal solid waste and energy crops (plants grown for use to make biofuels or directly exploited for their energy content) and biomass-based diesel. In addition, there is a continuing trend to encourage the use of products other than corn and raw grains for ethanol production. If this trend is successful, the demand for corn may decrease significantly, which could reduce demand for nitrogen fertilizer products and have an adverse effect on the nitrogen fertilizer business' results of operations, financial condition and cash flows. This potential impact on the demand for nitrogen fertilizer products, however, could be slightly offset by the potential market for nitrogen fertilizer product usage in connection with the production of cellulosic biofuels.
Nitrogen fertilizer products are global commodities, and the nitrogen fertilizer business faces intense competition from other nitrogen fertilizer producers.
The nitrogen fertilizer business is subject to intense price competition from both U.S. and foreign sources, including competitors operating in the Middle East, the Asia-Pacific region, the Caribbean, Russia and the Ukraine. Fertilizers are global commodities, with little or no product differentiation, and customers make their purchasing decisions principally on the basis of delivered price and availability of the product. Increased global supply may put downward pressure on fertilizer prices. Furthermore, in recent years the price of nitrogen fertilizer in the United States has been substantially driven by pricing in the global fertilizer market. The nitrogen fertilizer business competes with a number of U.S. producers and producers in other countries, including state-owned and government-subsidized entities. Some competitors have greater total resources and are less dependent on earnings from fertilizer sales, which makes them less vulnerable to industry downturns and better positioned to pursue new expansion and development opportunities. Increased domestic supply may put downward pressure on fertilizer prices. Additionally, the nitrogen fertilizer business' competitors utilizing different corporate structures may be better able to withstand lower cash flows than the nitrogen fertilizer business can as a limited partnership. The nitrogen fertilizer business'
27
competitive position could suffer to the extent it is not able to expand its resources either through investments in new or existing operations or through acquisitions, joint ventures or partnerships. An inability to compete successfully could result in a loss of customers, which could adversely affect the sales, profitability and the cash flows of the nitrogen fertilizer business and therefore have a material adverse effect on the nitrogen fertilizer business' results of operations, financial condition and cash flows.
The nitrogen fertilizer business is seasonal, which may result in it carrying significant amounts of inventory and seasonal variations in working capital. Our inability to predict future seasonal nitrogen fertilizer demand accurately may result in excess inventory or product shortages.
The nitrogen fertilizer business is seasonal. Farmers tend to apply nitrogen fertilizer during two short application periods, one in the spring and the other in the fall. The strongest demand for nitrogen fertilizer products typically occurs during the spring planting season. In contrast, the nitrogen fertilizer business and other nitrogen fertilizer producers generally produce products throughout the year. As a result, the nitrogen fertilizer business and its customers generally build inventories during the low demand periods of the year in order to ensure timely product availability during the peak sales seasons. The seasonality of nitrogen fertilizer demand results in sales volumes and net sales being highest during the North American spring season and working capital requirements typically being highest just prior to the start of the spring season.
If seasonal demand exceeds projections, the nitrogen fertilizer business will not have enough product and its customers may acquire products from its competitors, which would negatively impact profitability. If seasonal demand is less than expected, the nitrogen fertilizer business will be left with excess inventory and higher working capital and liquidity requirements.
The degree of seasonality of the nitrogen fertilizer business can change significantly from year to year due to conditions in the agricultural industry and other factors. As a consequence of such seasonality, it is expected that the distributions we receive from the nitrogen fertilizer business will be volatile and will vary quarterly and annually.
Adverse weather conditions during peak fertilizer application periods may have a material adverse effect on the nitrogen fertilizer business' results of operations, financial condition and cash flows, because the agricultural customers of the nitrogen fertilizer business are geographically concentrated.
The nitrogen fertilizer business' sales to agricultural customers are concentrated in the Great Plains and Midwest states and are seasonal in nature. The nitrogen fertilizer business' quarterly results may vary significantly from one year to the next due largely to weather-related shifts in planting schedules and purchase patterns. For example, the nitrogen fertilizer business generates greater net sales and operating income in the first half of the year, which is referred to herein as the planting season, compared to the second half of the year. Accordingly, an adverse weather pattern affecting agriculture in these regions or during the planting season could have a negative effect on fertilizer demand, which could, in turn, result in a material decline in the nitrogen fertilizer business' net sales and margins and otherwise have a material adverse effect on the nitrogen fertilizer business' results of operations, financial condition and cash flows. The nitrogen fertilizer business' quarterly results may vary significantly from one year to the next due largely to weather-related shifts in planting schedules and purchase patterns. As a result, it is expected that the nitrogen fertilizer business' distributions to holders of its common units (including us) will be volatile and will vary quarterly and annually.
The nitrogen fertilizer business' operations are dependent on third-party suppliers, including Linde, which owns an air separation plant that provides oxygen, nitrogen and compressed dry air to its facility, and the City of Coffeyville, which supplies the nitrogen fertilizer business with electricity. A deterioration in the financial condition of a third- party supplier, a mechanical problem with the air separation plant, or the inability of a third-party supplier to perform in accordance with its contractual obligations could have a material adverse effect on the nitrogen fertilizer business' results of operations, financial condition and cash flows.
The operations of the nitrogen fertilizer business depend in large part on the performance of third-party suppliers, including Linde for the supply of oxygen, nitrogen and compressed dry air, and the City of Coffeyville for the supply of electricity. With respect to Linde, operations could be adversely affected if there were a deterioration in Linde's financial condition such that the operation of the air separation plant located adjacent to the nitrogen fertilizer plant was disrupted. Additionally, this air separation plant in the past has experienced numerous short-term interruptions, causing interruptions in gasifier operations. With respect to electricity, in 2010, the nitrogen fertilizer business entered into an amended and restated electric services agreement with the City of Coffeyville, Kansas, which gives the nitrogen fertilizer business an option to extend the term of such agreement through June 30, 2024. Should Linde, the City of Coffeyville or any of its other third-party suppliers fail to perform in accordance with existing contractual arrangements, operations could be forced to halt. Alternative
28
sources of supply could be difficult to obtain. Any shutdown of operations at the nitrogen fertilizer plant, even for a limited period, could have a material adverse effect on the nitrogen fertilizer business' results of operations, financial condition and cash flows.
The nitrogen fertilizer business' results of operations, financial condition and cash flows may be adversely affected by the supply and price levels of pet coke.
The profitability of the nitrogen fertilizer business is directly affected by the price and availability of pet coke obtained from the Coffeyville refinery pursuant to a long-term agreement and pet coke purchased from third parties, both of which vary based on market prices. Pet coke is a key raw material used by the nitrogen fertilizer business in the manufacture of nitrogen fertilizer products. If pet coke costs increase, the nitrogen fertilizer business may not be able to increase its prices to recover these increased costs, because market prices for nitrogen fertilizer products are not correlated with pet coke prices.
The nitrogen fertilizer business may not be able to maintain an adequate supply of pet coke. In addition, it could experience production delays or cost increases if alternative sources of supply prove to be more expensive or difficult to obtain. The nitrogen fertilizer business currently purchases 100% of the pet coke the Coffeyville refinery produces. Accordingly, if the nitrogen fertilizer business increases production, it will be more dependent on pet coke purchases from third-party suppliers at open market prices. The nitrogen fertilizer business is party to a pet coke supply agreement with HollyFrontier Corporation. The term of this agreement ends in December 2016. There is no assurance that the nitrogen fertilizer business would be able to purchase pet coke on comparable terms from third parties or at all.
The nitrogen fertilizer business relies on third-party providers of transportation services and equipment, which subjects it to risks and uncertainties beyond its control that may have a material adverse effect on the nitrogen fertilizer business' results of operations, financial condition and cash flows.
The nitrogen fertilizer business relies on railroad and trucking companies to ship finished products to its customers. The nitrogen fertilizer business also leases railcars from railcar owners in order to ship its finished products. These transportation operations, equipment and services are subject to various hazards, including extreme weather conditions, work stoppages, delays, spills, derailments and other accidents and other operating hazards.
These transportation operations, equipment and services are also subject to environmental, safety and other regulatory oversight. Due to concerns related to terrorism or accidents, local, state and federal governments could implement new regulations affecting the transportation of the nitrogen fertilizer business' finished products. In addition, new regulations could be implemented affecting the equipment used to ship its finished products.
Any delay in the nitrogen fertilizer business' ability to ship its finished products as a result of these transportation companies' failure to operate properly, the implementation of new and more stringent regulatory requirements affecting transportation operations or equipment, or significant increases in the cost of these services or equipment could have a material adverse effect on the nitrogen fertilizer business' results of operations, financial condition and cash flows.
Ammonia can be very volatile and extremely hazardous. Any liability for accidents involving ammonia or other products the nitrogen fertilizer business produces or transports that cause severe damage to property or injury to the environment and human health could have a material adverse effect on the nitrogen fertilizer business' results of operations, financial condition and cash flows. In addition, the costs of transporting ammonia could increase significantly in the future.
The nitrogen fertilizer business manufactures, processes, stores, handles, distributes and transports ammonia, which can be very volatile and extremely hazardous. Major accidents or releases involving ammonia could cause severe damage or injury to property, the environment and human health, as well as a possible disruption of supplies and markets. Such an event could result in civil lawsuits, fines, penalties and regulatory enforcement proceedings, all of which could lead to significant liabilities. Any damage to persons, equipment or property or other disruption of the ability of the nitrogen fertilizer business to produce or distribute its products could result in a significant decrease in operating revenues and significant additional cost to replace or repair and insure its assets, which could have a material adverse effect on the nitrogen fertilizer business' results of operations, financial condition and cash flows. The nitrogen fertilizer facility periodically experiences minor releases of ammonia related to leaks from its equipment. Similar events may occur in the future and could have a material adverse effect on the nitrogen fertilizer business' results of operations, financial condition and cash flows.
In addition, the nitrogen fertilizer business may incur significant losses or costs relating to the operation of railcars used for the purpose of carrying various products, including ammonia. Due to the dangerous and potentially toxic nature of the cargo, in particular ammonia, on board railcars, a railcar accident may result in fires, explosions and pollution. These circumstances may
29
result in sudden, severe damage or injury to property, the environment and human health. In the event of pollution, the nitrogen fertilizer business may be held responsible even if it is not at fault and it complied with the laws and regulations in effect at the time of the accident. Litigation arising from accidents involving ammonia and other products the nitrogen fertilizer business produces or transports may result in the nitrogen fertilizer business or us being named as a defendant in lawsuits asserting claims for large amounts of damages, which could have a material adverse effect on the nitrogen fertilizer business' results of operations, financial condition and cash flows.
Given the risks inherent in transporting ammonia, the costs of transporting ammonia could increase significantly in the future. Ammonia is most typically transported by pipeline and railcar. A number of initiatives are underway in the railroad and chemical industries that may result in changes to railcar design in order to minimize railway accidents involving hazardous materials. In addition, in the future, laws may more severely restrict or eliminate the ability of the nitrogen fertilizer business to transport ammonia via railcar. If any railcar design changes are implemented, or if accidents involving hazardous freight increase the insurance and other costs of railcars, freight costs of the nitrogen fertilizer business could significantly increase.
Environmental laws and regulations on fertilizer end-use and application and numeric nutrient water quality criteria could have a material adverse impact on fertilizer demand in the future.
Future environmental laws and regulations on the end-use and application of fertilizers could cause changes in demand for the nitrogen fertilizer business' products. In addition, future environmental laws and regulations, or new interpretations of existing laws or regulations, could limit the ability of the nitrogen fertilizer business to market and sell its products to end users. From time to time, various state legislatures have proposed bans or other limitations on fertilizer products. The EPA is encouraging states to adopt state-wide numeric water quality criteria for total nitrogen and total phosphorus, which are present in the nitrogen fertilizer business' fertilizer products. A number of states have adopted or proposed numeric nutrient water quality criteria for nitrogen and phosphorus. The adoption of stringent state criteria for nitrogen and phosphorus could reduce the demand for nitrogen fertilizer products in those states. If such laws, rules, regulations or interpretations to significantly curb the end-use or application of fertilizers were promulgated in the nitrogen fertilizer business' marketing areas, it could result in decreased demand for its products and have a material adverse effect on the nitrogen fertilizer business' results of operations, financial condition and cash flows.
If licensed technology were no longer available, the nitrogen fertilizer business may be adversely affected.
The nitrogen fertilizer business has licensed, and may in the future license, a combination of patent, trade secret and other intellectual property rights of third parties for use in its business. In particular, the gasification process it uses to convert pet coke to high purity hydrogen for subsequent conversion to ammonia is licensed from General Electric. The license, which is fully paid, grants the nitrogen fertilizer business perpetual rights to use the pet coke gasification process on specified terms and conditions and is integral to the operations of the nitrogen fertilizer facility. If this license or any other license agreements on which the nitrogen fertilizer business' operations rely, were to be terminated, licenses to alternative technology may not be available, or may only be available on terms that are not commercially reasonable or acceptable. In addition, any substitution of new technology for currently-licensed technology may require substantial changes to manufacturing processes or equipment and may have a material adverse effect on the nitrogen fertilizer business' results of operations, financial condition and cash flows.
The nitrogen fertilizer business may face third-party claims of intellectual property infringement, which if successful could result in significant costs.
Although there are currently no pending claims relating to the infringement of any third-party intellectual property rights, in the future the nitrogen fertilizer business may face claims of infringement that could interfere with its ability to use technology that is material to its business operations. Any litigation of this type, whether successful or unsuccessful, could result in substantial costs and diversions of resources, either of which could have a material adverse effect on the nitrogen fertilizer business' results of operations, financial condition and cash flows. In the event a claim of infringement against the nitrogen fertilizer business is successful, it may be required to pay royalties or license fees for past or continued use of the infringing technology, or it may be prohibited from using the infringing technology altogether. If it is prohibited from using any technology as a result of such a claim, it may not be able to obtain licenses to alternative technology adequate to substitute for the technology it can no longer use, or licenses for such alternative technology may only be available on terms that are not commercially reasonable or acceptable. In addition, any substitution of new technology for currently licensed technology may require the nitrogen fertilizer business to make substantial changes to its manufacturing processes or equipment or to its products, and could have a material adverse effect on the nitrogen fertilizer business' results of operations, financial condition and cash flows.
30
There can be no assurance that the transportation costs of the nitrogen fertilizer business' competitors will not decline.
The nitrogen fertilizer plant is located within the U.S. farm belt, where the majority of the end users of its nitrogen fertilizer products grow their crops. Many of its competitors produce fertilizer outside of this region and incur greater costs in transporting their products over longer distances via rail, ships and pipelines. There can be no assurance that competitors' transportation costs will not decline or that additional pipelines will not be built, lowering the price at which competitors can sell their products, which would have a material adverse effect on the nitrogen fertilizer business' results of operations, financial condition and cash flows.
Risks Related to Our Entire Business
Instability and volatility in the capital, credit and commodity markets in the global economy could negatively impact our business, financial condition, results of operations and cash flows.
Our business, financial condition and results of operations could be negatively impacted by difficult conditions and volatility in the capital, credit and commodities markets and in the global economy. For example:
• | Although we believe the petroleum business has sufficient liquidity under its ABL credit facility and the intercompany credit facility to operate both the Coffeyville and Wynnewood refineries, and that the nitrogen fertilizer business has sufficient liquidity under its revolving credit facility to run the nitrogen fertilizer business, under extreme market conditions there can be no assurance that such funds would be available or sufficient, and in such a case, we may not be able to successfully obtain additional financing on favorable terms, or at all. Furthermore, the nitrogen fertilizer business' credit facility matures in April 2016 and there can be no assurance that it will be able to refinance its $125.0 million of outstanding term loan debt or obtain a new revolving credit facility on similar terms or at all. |
• | Market volatility could exert downward pressure on the price of the Refining Partnership's or the Nitrogen Fertilizer Partnership's common units, which may make it more difficult for either or both of them to raise additional capital and thereby limit their ability to grow, which could in turn cause our stock price to drop. |
• | The petroleum business' and nitrogen fertilizer business' credit facilities contain various covenants that must be complied with, and if either business is not in compliance, there can be no assurance that either business would be able to successfully amend the agreement in the future. Further, any such amendment may be expensive. In addition, any new credit facility the petroleum business or nitrogen fertilizer business may enter into may require them to agree to additional covenants. |
• | Market conditions could result in significant customers experiencing financial difficulties. We are exposed to the credit risk of our customers, and their failure to meet their financial obligations when due because of bankruptcy, lack of liquidity, operational failure or other reasons could result in decreased sales and earnings for us. |
The refineries and nitrogen fertilizer facility face significant risks due to physical damage hazards, environmental liability risk exposure, and unplanned or emergency partial or total plant shutdowns resulting in business interruptions. We could incur potentially significant costs to the extent there are unforeseen events which cause property damage and a material decline in production which are not fully insured. The commercial insurance industry engaged in underwriting energy industry risk is specialized and there is finite capacity; therefore, the industry may limit or curtail coverage, may modify the coverage provided or may substantially increase premiums in the future.
If any of our production plants, logistics assets, key pipeline operations serving our plants, or key suppliers sustains a catastrophic loss and operations are shutdown or significantly impaired, it would have a material adverse impact on our operations, financial condition and cash flows. In addition, the risk exposures we have at the Coffeyville, Kansas plant complex are greater due to production facilities for refinery and fertilizer production, distribution and storage being in relatively close proximity and potentially exposed to damage from one incident, such as resulting damages from the perils of explosion, windstorm, fire, or flood. Operations at either or both of the refineries and the nitrogen fertilizer plant could be curtailed, limited or completely shut down for an extended period of time as the result of one or more unforeseen events and circumstances, which may not be within our control, including:
• | major unplanned maintenance requirements |
31
• | catastrophic events caused by mechanical breakdown, electrical injury, pressure vessel rupture, explosion, contamination, fire, or natural disasters, including, floods, windstorms and other similar events; |
• | labor supply shortages, or labor difficulties that result in a work stoppage or slowdown; |
• | cessation or suspension of a plant or specific operations dictated by environmental authorities; and |
• | an event or incident involving a large clean-up, decontamination, or the imposition of laws and ordinances regulating the cost and schedule of demolition or reconstruction, which can cause significant delays in restoring property to its pre-loss condition. |
We have sustained losses over the past ten-year period at our plants, which are illustrative of the types of risks and hazards that exist. These losses or events resulted in costs assumed by us that were not fully insured due to policy retentions or applicable exclusions. These events were as follows:
•June 2007: Coffeyville refinery and nitrogen fertilizer plant; flood
•September 2010: Nitrogen fertilizer plant; secondary urea reactor rupture
•December 2010: Coffeyville refinery; FCCU fire
•December 2010: Wynnewood refinery; hydrocracker unit fire
•September 2012: Wynnewood refinery; boiler explosion
•July/August 2013: Coffeyville refinery; FCCU outage
•July 2014: Coffeyville refinery; isomerization unit fire
Currently, we are insured under casualty, environmental, property and business interruption insurance policies. The property and business interruption coverage has a combined policy limit of $1.25 billion. The property and business interruption insurance policies contain limits and sub-limits which insure all CVR Energy assets. There is potential for a common occurrence to impact both the nitrogen fertilizer plant and Coffeyville refinery in which case the insurance limitations would apply to all damages combined. Under this insurance program, there is a $10.0 million property damage retention for all properties ($2.5 million in respect of the nitrogen fertilizer plant). For business interruption losses, the insurance program has a 45-day waiting period retention for any one occurrence. In addition, the insurance policies contain a schedule of sub-limits which apply to certain specific perils or areas of coverage. Sub-limits which may be of importance depending on the nature and extent of a particular insured occurrence are: flood, earthquake, contingent business interruption insuring key suppliers, pipelines and customers, debris removal, decontamination, demolition and increased cost of construction due to law and ordinance, and others. Such conditions, limits and sub-limits could materially impact insurance recoveries and potentially cause us to assume losses which could impair earnings.
There is finite capacity in the commercial insurance industry engaged in underwriting energy industry risk, and there are risks associated with the commercial insurance industry reducing capacity, changing the scope of insurance coverage offered, and substantially increasing premiums due to adverse loss experience or other financial circumstances. Factors that impact insurance cost and availability include, but are not limited to: industry wide losses, natural disasters, specific losses incurred by us and the investment returns earned by the insurance industry. If the supply of commercial insurance is curtailed due to highly adverse financial results, we may not be able to continue our present limits of insurance coverage or obtain sufficient insurance capacity to adequately insure our risks for property damage or business interruption.
Environmental laws and regulations could require us to make substantial capital expenditures to remain in compliance or to remediate current or future contamination that could give rise to material liabilities.
Our operations are subject to a variety of federal, state and local environmental laws and regulations relating to the protection of the environment, including those governing the emission or discharge of pollutants into the environment, product specifications and the generation, treatment, storage, transportation, disposal and remediation of solid and hazardous wastes. Violations of these laws and regulations or permit conditions can result in substantial penalties, injunctive orders compelling installation of additional controls, civil and criminal sanctions, permit revocations and/or facility shutdowns.
32
In addition, new environmental laws and regulations, new interpretations of existing laws and regulations, increased governmental enforcement of laws and regulations or other developments could require us to make additional unforeseen expenditures. Many of these laws and regulations are becoming increasingly stringent, and the cost of compliance with these requirements can be expected to increase over time. The requirements to be met, as well as the technology and length of time available to meet those requirements, continue to develop and change. These expenditures or costs for environmental compliance could have a material adverse effect on our business' results of operations, financial condition and profitability.
Our facilities operate under a number of federal and state permits, licenses and approvals with terms and conditions containing a significant number of prescriptive limits and performance standards in order to operate. All of these permits, licenses, approvals, limits and standards require a significant amount of monitoring, record keeping and reporting in order to demonstrate compliance with the underlying permit, license, approval, limit or standard. Non-compliance or incomplete documentation of our compliance status may result in the imposition of fines, penalties and injunctive relief. Additionally, due to the nature of our manufacturing and refining processes, there may be times when we are unable to meet the standards and terms and conditions of our permits, licenses and approvals due to operational upsets or malfunctions, which may lead to the imposition of fines and penalties or operating restrictions that may have a material adverse effect on our ability to operate our facilities and accordingly our financial performance. For a discussion of environmental laws and regulations and their impact on our business and operations, please see "Business — Environmental Matters."
We could incur significant cost in cleaning up contamination at our refineries, terminals, fertilizer plant and off-site locations.
Our businesses are subject to the occurrence of accidental spills, discharges or other releases of petroleum or hazardous substances into the environment. Past or future spills related to any of our current or former operations, including the refineries, pipelines, product terminals, fertilizer plant or transportation of products or hazardous substances from those facilities, may give rise to liability (including strict liability, or liability without fault, and potential clean-up responsibility) to governmental entities or private parties under federal, state or local environmental laws, as well as under common law. For example, we could be held strictly liable under CERCLA, and similar state statutes for past or future spills without regard to fault or whether our actions were in compliance with the law at the time of the spills. Pursuant to CERCLA and similar state statutes, we could be held liable for contamination associated with facilities we currently own or operate (whether or not such contamination occurred prior to our acquisition thereof), facilities we formerly owned or operated (if any) and facilities to which we transported or arranged for the transportation of wastes or byproducts containing hazardous substances for treatment, storage, or disposal.
The potential penalties and clean-up costs for past or future releases or spills, liability to third parties for damage to their property or exposure to hazardous substances, or the need to address newly discovered information or conditions that may require response actions could be significant and could have a material adverse effect on our results of operations, financial condition and cash flows. In addition, we may incur liability for alleged personal injury or property damage due to exposure to chemicals or other hazardous substances located at or released from our facilities. We may also face liability for personal injury, property damage, natural resource damage or for clean-up costs for the alleged migration of contamination or other hazardous substances from our facilities to adjacent and other nearby properties.
Four of our facilities, including the Coffeyville refinery, the now-closed Phillipsburg terminal (which operated as a refinery until 1991), the Wynnewood refinery and the nitrogen fertilizer plant, have environmental contamination. We have assumed Farmland's responsibilities under certain administrative orders under the RCRA related to contamination at or that originated from the Coffeyville refinery and the Phillipsburg terminal. The Coffeyville refinery has agreed to assume liability for contamination that migrated from the refinery onto the nitrogen fertilizer plant property while Farmland owned and operated the properties. At the Wynnewood refinery, known areas of contamination have been partially addressed but corrective action has not been completed (refer to "RCRA Compliance Matters" in Part II, Item 8, Note 13 ("Commitments and Contingencies") of this Report), and some portions of the Wynnewood refinery have not yet been investigated to determine whether corrective action is necessary. If significant unknown liabilities are identified at or migrating from any of our facilities, that liability could have a material adverse effect on our results of operations, financial condition and cash flows and may not be covered by insurance.
We may incur future liability relating to the off-site disposal of hazardous wastes. Companies that dispose of, or arrange for the treatment, transportation or disposal of, hazardous substances at off-site locations may be held jointly and severally liable for the costs of investigation and remediation of contamination at those off-site locations, regardless of fault. We could become involved in litigation or other proceedings involving off-site waste disposal and the damages or costs in any such proceedings could be material.
33
We may be unable to obtain or renew permits necessary for our operations, which could inhibit our ability to do business.
Our businesses hold numerous environmental and other governmental permits and approvals authorizing operations at our facilities. Future expansion of our operations is predicated upon securing the necessary environmental or other permits or approvals. A decision by a government agency to deny or delay issuing a new or renewed material permit or approval, or to revoke or substantially modify an existing permit or approval, could have a material adverse effect on our ability to continue operations and on our financial condition, results of operations and cash flows. For example, WRC's OPDES permit has expired and is in the renewal process. The refinery timely submitted their renewal application; and therefore, the refinery is authorized to operate under expired permit terms and conditions until the state regulatory agency renews the permit. The renewal permit may contain different terms and conditions that would require unplanned or unanticipated costs.
Climate change laws and regulations could have a material adverse effect on our results of operations, financial condition and cash flows.
The EPA regulates GHG emissions under the Clean Air Act. In October 2009, the EPA finalized a rule requiring certain large emitters of GHGs to inventory and report their GHG emissions to the EPA. In accordance with the rule, we have begun monitoring and reporting our GHG emissions to the EPA. In May 2010, the EPA finalized the "Greenhouse Gas Tailoring Rule," which established new GHG emissions thresholds that determine when stationary sources, such as the refineries and the nitrogen fertilizer plant, must obtain permits under PSD and Title V programs of the federal Clean Air Act. Under the rule, facilities already subject to the PSD and Title V programs that increase their emissions of GHGs by a significant amount are required to undergo PSD review and to evaluate and implement air pollution control technology, known as "best available control technology," to reduce GHG emissions.
In the meantime, in December 2010, the EPA reached a settlement agreement with numerous parties under which it agreed to promulgate NSPS to regulate GHG emissions from petroleum refineries and electric utilities by November 2012. In September 2014, the EPA indicated that the petroleum refining sector risk rule, proposed in June 2014 to address air toxics and volatile organic compounds from refineries, may make it unnecessary for the EPA to regulate GHG emissions from petroleum refineries at this time. The final rule, which was published in the Federal Register on December 1, 2015, places additional emission control requirements and work practice standards on FCCUs, storage tanks, flares, coking units and other equipment at petroleum refineries. Therefore, we expect that the EPA will not be issuing NSPS standards to regulate GHG from the refineries at this time but that it may do so in the future.
During the State of the Union address in each of the last three years, President Obama indicated that the United States should take action to address climate change. At the federal legislative level, this could mean Congressional passage of legislation adopting some form of federal mandatory GHG emission reduction, such as a nationwide cap-and-trade program. It is also possible that Congress may pass alternative climate change bills that do not mandate a nationwide cap-and-trade program and instead focus on promoting renewable energy and energy efficiency.
In addition to potential federal legislation, a number of states have adopted regional greenhouse gas initiatives to reduce carbon dioxide and other GHG emissions. In 2007, a group of Midwest states, including Kansas (where the Coffeyville refinery and the nitrogen fertilizer facility are located), formed the Midwestern Greenhouse Gas Reduction Accord, which calls for the development of a cap-and-trade system to control GHG emissions and for the inventory of such emissions. However, the individual states that have signed on to the accord must adopt laws or regulations implementing the trading scheme before it becomes effective. To date, Kansas has taken no meaningful action to implement the accord, and it's unclear whether Kansas intends to do so in the future.
Alternatively, the EPA may take further steps to regulate GHG emissions. The implementation of EPA regulations and/or the passage of federal or state climate change legislation may result in increased costs to (i) operate and maintain our facilities, (ii) install new emission controls on our facilities and (iii) administer and manage any GHG emissions program. Increased costs associated with compliance with any current or future legislation or regulation of GHG emissions, if it occurs, may have a material adverse effect on our results of operations, financial condition and cash flows.
In addition, climate change legislation and regulations may result in increased costs not only for our business but also users of our refined and fertilizer products, thereby potentially decreasing demand for our products. Decreased demand for our products may have a material adverse effect on our results of operations, financial condition and cash flows.
34
We are subject to strict laws and regulations regarding employee and process safety, and failure to comply with these laws and regulations could have a material adverse effect on our results of operations, financial condition and profitability.
We are subject to the requirements of OSHA and comparable state statutes that regulate the protection of the health and safety of workers, and the proper design, operation and maintenance of our equipment. In addition, OSHA and certain environmental regulations require that we maintain information about hazardous materials used or produced in our operations and that we provide this information to employees and state and local governmental authorities. Failure to comply with these requirements, including general industry standards, record keeping requirements and monitoring and control of occupational exposure to regulated substances, may result in significant fines or compliance costs, which could have a material adverse effect on our results of operations, financial condition and cash flows.
We are subject to cybersecurity risks and other cyber incidents resulting in disruption.
Threats to information technology systems associated with cybersecurity risks and cyber incidents or attacks continue to grow. We depend on information technology systems. In addition, we collect, process and retain sensitive and confidential customer information in the normal course of business. Despite the security measures we have in place and any additional measures we may implement in the future, our facilities and systems, and those of our third-party service providers, could be vulnerable to security breaches, computer viruses, lost or misplaced data, programming errors, human errors, acts of vandalism or other events. Any disruption of our systems or security breach or event resulting in the misappropriation, loss or other unauthorized disclosure of confidential information, whether by us directly or our third-party service providers, could damage our reputation, expose us to the risks of litigation and liability, disrupt our business or otherwise affect our results of operations.
Deliberate, malicious acts, including terrorism, could damage our facilities, disrupt our operations or injure employees, contractors, customers or the public and result in liability to us.
Intentional acts of destruction could hinder our sales or production and disrupt our supply chain. Our facilities could be damaged or destroyed, reducing our operational production capacity and requiring us to repair or replace our facilities at substantial cost. Employees, contractors and the public could suffer substantial physical injury for which we could be liable. Governmental authorities may impose security or other requirements that could make our operations more difficult or costly. The consequences of any such actions could adversely affect our operating results, financial condition and cash flows.
Both the petroleum and nitrogen fertilizer businesses depend on significant customers and the loss of several significant customers may have a material adverse impact on our results of operations, financial condition and cash flows.
The petroleum and nitrogen fertilizer businesses both have a significant concentration of customers. The five largest customers of the petroleum business represented 39% of its petroleum net sales for the year ended December 31, 2015. The five largest customers of the nitrogen fertilizer business also represented approximately 39% of its net sales for the year ended December 31, 2015. One significant petroleum customer and two significant nitrogen fertilizer customers each account for more than 10% of petroleum and nitrogen fertilizer net sales. Given the nature of our businesses, and consistent with industry practice, we do not have long-term minimum purchase contracts with our customers. The loss of several of these significant customers, or a significant reduction in purchase volume by several of them, could have a material adverse effect on our results of operations, financial condition and cash flows.
The acquisition and expansion strategy of the petroleum business and the nitrogen fertilizer business involves significant risks.
Both the petroleum business and the nitrogen fertilizer business will consider pursuing acquisitions and expansion projects in order to continue to grow and increase profitability. However, we may not be able to consummate such acquisitions or expansions, due to intense competition for suitable acquisition targets, the potential unavailability of financial resources necessary to consummate acquisitions and expansions, difficulties in identifying suitable acquisition targets and expansion projects or in completing any transactions identified on sufficiently favorable terms and the failure to obtain requisite regulatory or other governmental approvals. In addition, any future acquisitions and expansions may entail significant transaction costs and risks associated with entry into new markets and lines of business.
In addition to the risks involved in identifying and completing acquisitions described above, even when acquisitions are completed, integration of acquired entities can involve significant difficulties, such as:
• | unforeseen difficulties in the integration of the acquired operations and disruption of the ongoing operations of our business; |
35
• | failure to achieve cost savings or other financial or operating objectives contributing to the accretive nature of an acquisition; |
• | strain on the operational and managerial controls and procedures of the petroleum business and the nitrogen fertilizer business, and the need to modify systems or to add management resources; |
• | difficulties in the integration and retention of customers or personnel and the integration and effective deployment of operations or technologies; |
• | assumption of unknown material liabilities or regulatory non-compliance issues; |
• | amortization of acquired assets, which would reduce future reported earnings; |
• | possible adverse short-term effects on our cash flows or operating results; and |
• | diversion of management's attention from the ongoing operations of our business. |
In addition, in connection with any potential acquisition or expansion project, each of the Refining Partnership and the Nitrogen Fertilizer Partnership (as applicable) will need to consider whether a business it intends to acquire or expansion project it intends to pursue could affect its tax treatment as a partnership for federal income tax purposes. If the petroleum business or the nitrogen fertilizer business is otherwise unable to conclude that the activities of the business being acquired or the expansion project would not affect its treatment as a partnership for federal income tax purposes, it may elect to seek a ruling from the Internal Revenue Service ("IRS"). Seeking such a ruling could be costly or, in the case of competitive acquisitions, place the business in a competitive disadvantage compared to other potential acquirers who do not seek such a ruling. If the petroleum business or the nitrogen fertilizer business is unable to conclude that an activity would not affect its treatment as a partnership for federal income tax purposes, and is unable or unwilling to obtain an IRS ruling, the petroleum business or the nitrogen fertilizer business may choose to acquire such business or develop such expansion project in a corporate subsidiary, which would subject the income related to such activity to entity-level taxation, which would reduce the amount of cash available for distribution to its unitholders and would likely cause a substantial reduction in the value of its common units.
Failure to manage these acquisition and expansion growth risks could have a material adverse effect on our results of operations, financial condition and cash flows. There can be no assurance that we will be able to consummate any acquisitions or expansions, successfully integrate acquired entities, or generate positive cash flow at any acquired company or expansion project.
We are a holding company and depend upon our subsidiaries for our cash flow.
Our two principal subsidiaries are publicly traded partnerships, and a portion of their common units trade on the NYSE. We are a holding company, and these subsidiaries conduct all of our operations and own substantially all of our assets. Consequently, our cash flow and our ability to meet our obligations or to pay dividends or make other distributions in the future will depend upon the cash flow of our subsidiaries and the payment of funds by our subsidiaries to us in the form of distributions on their common units. The ability of the Refining Partnership and the Nitrogen Fertilizer Partnership to make any payments to us will depend on, among other things, their earnings, the terms of their indebtedness, tax considerations and legal restrictions.
In particular, the indenture governing the Refining Partnership's 6.5% senior notes prohibits it from making distributions to unitholders (including us) if any default or event of default (as defined in the indenture) exists. In addition, the indenture governing the Refining Partnership's 6.5% senior notes contains covenants limiting the Refining Partnership's ability to pay distributions to unitholders. The covenants will apply differently depending on the Refining Partnership's fixed charge coverage ratio (as defined in the indenture). If the fixed charge coverage ratio is not less than 2.5 to 1.0, the Refining Partnership will generally be permitted to make restricted payments, including distributions to its unitholders, without substantive restriction. If the fixed charge coverage ratio is less than 2.5 to 1.0, the Refining Partnership will generally be permitted to make restricted payments, including distributions to its unitholders, up to an aggregate $100.0 million basket plus certain other amounts referred to as "incremental funds" under the indenture. In addition, the Refining Partnership's Amended and Restated ABL Credit Facility requires it to maintain a minimum excess availability under the facility as a condition to the payment of distributions to its unitholders. The Nitrogen Fertilizer Partnership's credit facility requires that, before the Nitrogen Fertilizer
36
Partnership can make distributions to us, it must be in compliance with leverage ratio and interest coverage ratio tests. Any new indebtedness could have similar or greater restrictions.
Internally generated cash flows and other sources of liquidity may not be adequate for the capital needs of our businesses.
Our businesses are capital intensive, and working capital needs may vary significantly over relatively short periods of time. For instance, crude oil price volatility can significantly impact working capital on a week-to-week and month-to-month basis. If we cannot generate adequate cash flow or otherwise secure sufficient liquidity to meet our working capital needs or support our short-term and long-term capital requirements, we may be unable to meet our debt obligations, pursue our business strategies or comply with certain environmental standards, which would have a material adverse effect on our business and results of operations.
A substantial portion of our workforce is unionized and we are subject to the risk of labor disputes and adverse employee relations, which may disrupt our business and increase our costs.
As of December 31, 2015, approximately 54% of the employees at the Coffeyville refinery and 59% of the employees at the Wynnewood refinery were represented by labor unions under collective bargaining agreements. At Coffeyville, the collective bargaining agreement with five Metal Trades Unions (which covers union represented employees who work directly at the Coffeyville refinery) expires in March 2019. The collective bargaining agreement with the United Steelworkers (which covers the balance of the petroleum business' unionized employees, who work in crude transportation) expires in March 2017, and automatically renews on an annual basis thereafter unless a written notice is received sixty days in advance of the relevant expiration date. The collective bargaining agreement with the International Union of Operating Engineers with respect to the Wynnewood refinery expires in June 2017. We may not be able to renegotiate our collective bargaining agreements when they expire on satisfactory terms or at all. A failure to do so may increase our costs. In addition, our existing labor agreements may not prevent a strike or work stoppage at any of our facilities in the future, and any work stoppage could negatively affect our results of operations, financial condition and cash flows.
Our business may suffer if any of our key senior executives or other key employees unexpectedly discontinues employment with us. Furthermore, a shortage of skilled labor or disruptions in our labor force may make it difficult for us to maintain labor productivity.
Our future success depends to a large extent on the services of our key senior executives and key senior employees. Our business depends on our continuing ability to recruit, train and retain highly qualified employees in all areas of our operations, including accounting, business operations, finance and other key back-office and mid-office personnel. Furthermore, our operations require skilled and experienced employees with proficiency in multiple tasks. In particular, the nitrogen fertilizer facility relies on gasification technology that requires special expertise to operate efficiently and effectively. The competition for these employees is intense, and the loss of these executives or employees could harm our business. If any of these executives or other key personnel resign unexpectedly or become unable to continue in their present roles and are not adequately replaced, our business operations could be materially adversely affected. We do not maintain any "key man" life insurance for any executives.
New regulations concerning the transportation, storage and handling of hazardous chemicals, risks of terrorism and the security of chemical manufacturing facilities could result in higher operating costs.
The costs of complying with future regulations relating to the transportation, storage and handling of hazardous chemicals and security associated with the refining and nitrogen fertilizer facilities may have a material adverse effect on our results of operations, financial condition and cash flows. Targets such as refining and chemical manufacturing facilities may be at greater risk of future terrorist attacks than other targets in the United States. As a result, the petroleum and chemical industries have responded to the issues that arose due to the terrorist attacks on September 11, 2001 by starting new initiatives relating to the security of petroleum and chemical industry facilities and the transportation of hazardous chemicals in the United States. Future terrorist attacks could lead to even stronger, more costly initiatives that could result in a material adverse effect on our results of operations, financial condition and cash flows. The 2013 fertilizer plant explosion in West, Texas has generated consideration of more restrictive measures in storage, handling and transportation of crop production materials, including fertilizers.
Compliance with and changes in the tax laws could adversely affect our performance.
We are subject to extensive tax liabilities, including United States and state income taxes and transactional taxes such as excise, sales/use, payroll, franchise and withholding taxes. New tax laws and regulations are continuously being enacted or proposed that could result in increased expenditures for tax liabilities in the future.
37
The Refining Partnership's and the Nitrogen Fertilizer Partnership's level of indebtedness may increase, which would reduce their financial flexibility and the distributions they make on their common units.
As of the date of this Report, the Refining Partnership had (i) $500.0 million aggregate principal amount of 6.5% senior notes due 2022 (the "2022 Notes") outstanding, (ii) availability under the Amended and Restated ABL Credit Facility of $262.1 million, with letters of credit outstanding of approximately $27.8 million and (iii) $31.5 million borrowed under an intercompany credit facility with availability under the intercompany credit facility of $218.5 million. Availability under the Amended and Restated ABL Credit Facility was limited by borrowing base conditions. As of the date of this Report, the Nitrogen Fertilizer Partnership had $125.0 million of outstanding term loan borrowings, with availability of up to $25.0 million under its revolving credit facility. In the future, the Refining Partnership and the Nitrogen Fertilizer Partnership may incur additional significant indebtedness in order to make future acquisitions, expand their businesses or develop their properties. Their level of indebtedness could affect their operations in several ways, including the following:
• | a significant portion of their cash flows could be used to service their indebtedness, reducing available cash and their ability to make distributions on their common units (including distributions to us); |
• | a high level of debt would increase their vulnerability to general adverse economic and industry conditions; |
• | the covenants contained in their debt agreements will limit their ability to borrow additional funds, dispose of assets, pay distributions and make certain investments; |
• | a high level of debt may place them at a competitive disadvantage compared to competitors that are less leveraged and who therefore may be able to take advantage of opportunities that their indebtedness would prevent them from pursuing; |
• | their debt covenants may also affect flexibility in planning for, and reacting to, changes in the economy and in their industries; |
• | a high level of debt may make it more likely that a reduction in the petroleum business' borrowing base following a periodic redetermination could require the Refining Partnership to repay a portion of its then-outstanding bank borrowings under its ABL credit facility; and |
• | a high level of debt may impair their ability to obtain additional financing in the future for working capital, capital expenditures, debt service requirements, acquisitions, general corporate or other purposes. |
In addition, borrowings under their respective credit facilities and other credit facilities they may enter into in the future will bear interest at variable rates. If market interest rates increase, such variable-rate debt will create higher debt service requirements, which could adversely affect their ability to make distributions to common unitholders (including us).
In addition to debt service obligations, their operations require substantial investments on a continuing basis. Their ability to make scheduled debt payments, to refinance debt obligations and to fund capital and non-capital expenditures necessary to maintain the condition of operating assets, properties and systems software, as well as to provide capacity for the growth of their businesses, depends on their respective financial and operating performance. General economic conditions and financial, business and other factors affect their operations and their future performance. Many of these factors are beyond their control. They may not be able to generate sufficient cash flows to pay the interest on their debt, and future working capital, borrowings or equity financing may not be available to pay or refinance such debt.
In addition, the bank borrowing base under the Refining Partnership's Amended and Restated ABL Credit Facility will be subject to periodic redeterminations. It could be forced to repay a portion of its bank borrowings due to redeterminations of its borrowing base. If it is forced to do so, it may not have sufficient funds to make such repayments. If the Refining Partnership does not have sufficient funds and is otherwise unable to negotiate renewals of its borrowings or arrange new financing, it may have to sell significant assets. Any such sale could have a material adverse effect on the Refining Partnership's business and financial condition and, as a result, its ability to make distributions to common unitholders (including us).
38
The Refining Partnership and the Nitrogen Fertilizer Partnership may not be able to generate sufficient cash to service all of their indebtedness and may be forced to take other actions to satisfy their debt obligations that may not be successful.
The Refining Partnership's and the Nitrogen Fertilizer Partnership's ability to satisfy their debt obligations will depend upon, among other things:
• | their future financial and operating performance, which will be affected by prevailing economic conditions and financial, business, regulatory and other factors, many of which are beyond our control; and |
• | the Refining Partnership's ability to borrow under its Amended and Restated ABL Credit Facility and the intercompany credit facility between the Refining Partnership and us, and the Nitrogen Fertilizer Partnership's ability to borrow under its revolving credit facility, the availability of which depends on, among other things, compliance with their respective covenants. |
We cannot offer any assurance that our businesses will generate sufficient cash flow from operations, or that the Refining Partnership will be able to draw under its Amended and Restated ABL Credit Facility or the intercompany credit facility, or that the Nitrogen Fertilizer Partnership will be able to draw under its revolving credit facility, or from other sources of financing, in an amount sufficient to fund their respective liquidity needs.
If cash flows and capital resources are insufficient to service their indebtedness, the Refining Partnership or the Nitrogen Fertilizer Partnership may be forced to reduce or delay capital expenditures, sell assets, seek additional capital or restructure or refinance their indebtedness. These alternative measures may not be successful and may not permit them to meet their scheduled debt service obligations. Their ability to restructure or refinance debt will depend on the condition of the capital markets and their financial condition at such time. Any refinancing of their debt could be at higher interest rates and may require them to comply with more onerous covenants, which could further restrict their business operations, and the terms of existing or future debt agreements may restrict us from adopting some of these alternatives. In addition, in the absence of adequate cash flows or capital resources, they could face substantial liquidity problems and might be required to dispose of material assets or operations, or sell equity, in order to meet their debt service and other obligations. They may not be able to consummate those dispositions for fair market value or at all. The Refining Partnership's Amended and Restated ABL Credit Facility and the indenture governing its 6.5% senior notes and the Nitrogen Fertilizer Partnership's credit facility may restrict, or market or business conditions may limit, their ability to avail themselves of some or all of these options. Furthermore, any proceeds that we realize from any such dispositions may not be adequate to meet their debt service obligations when due. None of the Company's stockholders or any of their respective affiliates has any continuing obligation to provide us with debt or equity financing.
The borrowings under the Refining Partnership's Amended and Restated ABL Credit Facility and intercompany credit facility and the Nitrogen Fertilizer Partnership's revolving credit facility bear interest at variable rates and other debt we or they incur could likewise be variable-rate debt. If market interest rates increase, variable-rate debt will create higher debt service requirements, which could adversely affect their respective distributions to us. The Refining Partnership or the Nitrogen Fertilizer Partnership may enter into agreements limiting their exposure to higher interest rates, but any such agreements may not offer complete protection from this risk.
Covenants in our subsidiaries' debt instruments could limit their ability to incur additional indebtedness and engage in certain transactions, which could adversely affect our liquidity and our ability to pursue our business strategies.
The indenture governing the Refining Partnership's 2022 Notes and the Amended and Restated ABL Credit Facility and the Nitrogen Fertilizer Partnership's credit facility contain a number of restrictive covenants that will impose significant operating and financial restrictions on them and their subsidiaries and may limit their ability to engage in acts that may be in their long-term best interest, including restrictions on their ability, among other things, to:
• | incur, assume or guarantee additional debt or issue redeemable or preferred units |
• | make distributions or prepay, redeem, or repurchase certain debt; |
• | enter into agreements that restrict distributions from restricted subsidiaries; |
• | incur liens; |
39
• | sell or otherwise dispose of assets, including capital stock of subsidiaries; |
• | enter into transactions with affiliates; and |
• | merge, consolidate or sell substantially all of their assets. |
In particular, the indenture governing the Refining Partnership's 2022 Notes prohibits it from making distributions to unitholders (including us) if any default or event of default (as defined in the indenture) exists. In addition, the indenture governing the Refining Partnership's 2022 Notes contains covenants limiting the Refining Partnership's ability to pay distributions to unitholders. The covenants will apply differently depending on the Refining Partnership's fixed charge coverage ratio (as defined in the indenture). If the fixed charge coverage ratio is not less than 2.5 to 1.0, the Refining Partnership will generally be permitted to make restricted payments, including distributions to its unitholders, without substantive restriction. If the fixed charge coverage ratio is less than 2.5 to 1.0, the Refining Partnership will generally be permitted to make restricted payments, including distributions to its unitholders, up to an aggregate $100.0 million basket plus certain other amounts referred to as "incremental funds" under the indenture. In addition, the Refining Partnership's Amended and Restated ABL Credit Facility requires it to maintain a minimum excess availability under the facility as a condition to the payment of distributions to its unitholders. The Nitrogen Fertilizer Partnership's credit facility requires that, before the Nitrogen Fertilizer Partnership can make distributions to us, it must be in compliance with leverage ratio and interest coverage ratio tests. Any new indebtedness could have similar or greater restrictions.
A breach of the covenants under the foregoing debt instruments could result in an event of default. Upon a default, unless waived, the holders of the Refining Partnership's 2022 Notes and lenders under the Refining Partnership's Amended and Restated ABL Credit Facility and the Nitrogen Fertilizer Partnership's credit facility would have all remedies available to a secured lender, and could elect to terminate their commitments, cease making further loans, institute foreclosure proceedings against the Refining Partnership or the Nitrogen Fertilizer Partnership (as applicable) or its respective subsidiaries' assets, and force it and its subsidiaries into bankruptcy or liquidation, subject to intercreditor agreements. In addition, any defaults could trigger cross defaults under other or future credit agreements or indentures. The Refining Partnership's or Nitrogen Fertilizer Partnership's operating results may not be sufficient to service their indebtedness or to fund our other expenditures and they may not be able to obtain financing to meet these requirements. As a result of these restrictions, they may be limited in how they conduct their respective businesses, unable to raise additional debt or equity financing to operate during general economic or business downturns or unable to compete effectively or to take advantage of new business opportunities.
Despite their indebtedness, the Refining Partnership and the Nitrogen Fertilizer Partnership may still be able to incur significantly more debt, including secured indebtedness. This could intensify the risks described above.
The Refining Partnership and the Nitrogen Fertilizer Partnership may be able to incur substantially more debt in the future, including secured indebtedness. Although the Refining Partnership's Amended and Restated ABL Credit Facility and its 2022 Notes and the Nitrogen Fertilizer Partnership's credit facility contain restrictions on the incurrence of additional indebtedness, these restrictions are subject to a number of qualifications and exceptions and, under certain circumstances, indebtedness incurred in compliance with these restrictions could be substantial. Also, these restrictions may not prevent them from incurring obligations that do not constitute indebtedness. To the extent such new debt or new obligations are added to their existing indebtedness, the risks described above could substantially increase.
Mr. Carl C. Icahn exerts significant influence over the Company and his interests may conflict with the interest of the Company's other stockholders.
Mr. Carl C. Icahn indirectly controls approximately 82% of the voting power of the Company's capital stock and, by virtue of such stock ownership, is able to control or exert substantial influence over the Company, including:
• | the election and appointment of directors; |
• | business strategy and policies; |
• | mergers or other business combinations; |
• | acquisition or disposition of assets; |
• | future issuances of common stock, common units or other securities; |
40
• | incurrence of debt or obtaining other sources of financing; and |
• | the payment of dividends on the Company's common stock and distributions on the common units of the Refining Partnership and the Nitrogen Fertilizer Partnership. |
The existence of a controlling stockholder may have the effect of making it difficult for, or may discourage or delay, a third party from seeking to acquire a majority of the Company's outstanding common stock, which may adversely affect the market price of the Company's common stock.
Mr. Icahn's interests may not always be consistent with the Company's interests or with the interests of the Company's other stockholders. Mr. Icahn and entities controlled by him may also pursue acquisitions or business opportunities in industries in which we compete, and there is no requirement that any additional business opportunities be presented to us. We also have and may in the future enter into transactions to purchase goods or services with affiliates of Mr. Icahn. To the extent that conflicts of interest may arise between the Company and Mr. Icahn and his affiliates, those conflicts may be resolved in a manner adverse to the Company or its other stockholders.
In addition, if Mr. Icahn were to sell, or otherwise transfer, some or all of his interests in us to an unrelated party or group, a change of control could be deemed to have occurred under the terms of the indentures governing the Refining Partnership's 6.5% senior notes, which would require it to offer to repurchase all outstanding notes at 101% of their principal amount plus accrued interest to the date of repurchase, and an event of default could be deemed to have occurred under the Refining Partnership's Amended and Restated ABL Credit Facility, which would allow lenders to accelerate indebtedness owed to them. However, it is possible that the Refining Partnership will not have sufficient funds at the time of the change of control to make the required repurchase of notes or repay amounts outstanding under the Refining Partnership's Amended and Restated ABL Credit Facility, if any.
The Company's common stock price may decline due to sales of shares by Mr. Carl C. Icahn.
Sales of substantial amounts of the Company's common stock, or the perception that these sales may occur, may adversely affect the price of the Company's common stock and impede its ability to raise capital through the issuance of equity securities in the future. Mr. Icahn could elect in the future to request that the Company file a registration statement to enable him to sell shares of the Company's common stock. If Mr. Icahn were to sell a large number of shares into the public markets, Mr. Icahn could cause the price of the Company's common stock to decline.
We are a "controlled company" within the meaning of the NYSE rules and, as a result, qualify for, and are relying on, exemptions from certain corporate governance requirements.
A company of which more than 50% of the voting power is held by an individual, a group or another company is a "controlled company" within the meaning of the NYSE rules and may elect not to comply with certain corporate governance requirements of the NYSE, including:
• | the requirement that a majority of our board of directors consist of independent directors; |
• | the requirement that we have a nominating/corporate governance committee that is composed entirely of independent directors; and |
• | the requirement that we have a compensation committee that is composed entirely of independent directors. |
We are relying on all of these exemptions as a controlled company. Accordingly, you may not have the same protections afforded to stockholders of companies that are subject to all of the corporate governance requirements of the NYSE. In addition, both the Refining Partnership and the Nitrogen Fertilizer Partnership are relying on exemptions from the same NYSE corporate governance requirements described above.
We may be subject to the pension liabilities of our affiliates.
Mr. Icahn, through certain affiliates, owns approximately 82% of the Company's capital stock. Applicable pension and tax laws make each member of a “controlled group” of entities, generally defined as entities in which there is at least an 80% common ownership interest, jointly and severally liable for certain pension plan obligations of any member of the controlled group. These pension obligations include ongoing contributions to fund the plan, as well as liability for any unfunded liabilities that may exist at the time the plan is terminated. In addition, the failure to pay these pension obligations when due may result in
41
the creation of liens in favor of the pension plan or the Pension Benefit Guaranty Corporation ("PBGC") against the assets of each member of the controlled group.
As a result of the more than 80% ownership interest in us by Mr. Icahn's affiliates, we are subject to the pension liabilities of all entities in which Mr. Icahn has a direct or indirect ownership interest of at least 80%. Two such entities, ACF Industries LLC ("ACF") and Federal-Mogul, are the sponsors of several pension plans. All the minimum funding requirements of the Code and the Employee Retirement Income Security Act of 1974, as amended by the Pension Protection Act of 2006, for these plans have been met as of December 31, 2015. If the ACF and Federal-Mogul plans were voluntarily terminated, they would be collectively underfunded by approximately $589.2 million and $473.8 million as of December 31, 2015 and 2014, respectively. These results are based on the most recent information provided to us by Mr. Icahn's affiliates based on information from the plans' actuaries. These liabilities could increase or decrease, depending on a number of factors, including future changes in benefits, investment returns, and the assumptions used to calculate the liability. As members of the controlled group, we would be liable for any failure of ACF and Federal-Mogul to make ongoing pension contributions or to pay the unfunded liabilities upon a termination of their respective pension plans. In addition, other entities now or in the future within the controlled group that includes us may have pension plan obligations that are, or may become, underfunded, and we would be liable for any failure of such entities to make ongoing pension contributions or to pay the unfunded liabilities upon a termination of such plans. The current underfunded status of the ACF and Federal-Mogul pension plans requires such entities to notify the PBGC of certain "reportable events," such as if we cease to be a member of the controlled group, or if we make certain extraordinary dividends or stock redemptions. The obligation to report could cause us to seek to delay or reconsider the occurrence of such reportable events.
Risks Related to Our Common Stock
We have various mechanisms in place to discourage takeover attempts, which may reduce or eliminate our stockholders' ability to sell their shares for a premium in a change of control transaction.
Various provisions of our certificate of incorporation and bylaws and of Delaware corporate law may discourage, delay or prevent a change in control or takeover attempt of our Company by a third party that our management and board of directors determines is not in the best interest of our Company and its stockholders. Public stockholders who might desire to participate in such a transaction may not have the opportunity to do so. These anti-takeover provisions could substantially impede the ability of public stockholders to benefit from a change of control or change in our management and board of directors. These provisions include:
• | preferred stock that could be issued by our board of directors to make it more difficult for a third party to acquire, or to discourage a third party from acquiring, a majority of our outstanding voting stock; |
• | limitations on the ability of stockholders to call special meetings of stockholders; |
• | limitations on the ability of stockholders to act by written consent in lieu of a stockholders' meeting; and |
• | advance notice requirements for nominations of candidates for election to our board of directors or for proposing matters that can be acted upon by our stockholders at stockholder meetings. |
We are authorized to issue up to a total of 350 million shares of common stock and 50 million shares of preferred stock, potentially diluting equity ownership of current holders and the share price of our common stock.
We believe that it is necessary to maintain a sufficient number of available authorized shares of our common stock and preferred stock in order to provide us with the flexibility to issue common stock or preferred stock for business purposes that may arise as deemed advisable by our board of directors. These purposes could include, among other things, (i) future stock dividends or stock splits, which may increase the liquidity of our shares; (ii) the sale of stock to obtain additional capital or to acquire other companies or businesses, which could enhance our growth strategy or allow us to reduce debt if needed; (iii) for use in additional stock incentive programs and (iv) for other bona fide purposes. Our board of directors may authorize the Company to issue the available authorized shares of common stock or preferred stock without notice to, or further action by, our stockholders, unless stockholder approval is required by law or the rules of the NYSE. The issuance of additional shares of common stock or preferred stock may significantly dilute the equity ownership of the current holders of our common stock.
42
Our ability to pay dividends on our common stock is subject to market conditions and numerous other factors.
In January 2013, our board of directors adopted a quarterly dividend policy. We began paying regular quarterly dividends in the second quarter of 2013. Dividends are subject to change at the discretion of the board of directors and may change from quarter to quarter. Our ability to continue paying dividends is subject to our ability to continue to generate sufficient cash flow, and the amount of dividends we are able to pay each year may vary, possibly substantially, based on market conditions, crack spreads, our capital expenditure and other business needs, covenants contained in any debt agreements we may enter into in the future, covenants contained in the debt agreements of CVR Partners and CVR Refining, and the amount of distributions we receive from CVR Partners and CVR Refining. We may not be able to continue paying dividends at the rate we currently pay dividends, or at all. If the amount of our dividends decreases, the trading price of our common stock could be materially adversely affected as a result.
Risks Inherent In the Limited Partnership Structures Through Which
We Currently Hold Our Interests in the Refinery Business and the Nitrogen Fertilizer Business
Both the Refining Partnership and the Nitrogen Fertilizer Partnership have in place policies to distribute an amount equal to the "available cash" each generates each quarter, which could limit their ability to grow and make acquisitions.
The current policies of both the board of directors of the Refining Partnership's general partner and the Nitrogen Fertilizer Partnership's general partner is to distribute an amount equal to the available cash generated by each partnership each quarter to their respective unitholders. As a result of their respective cash distribution policies, the Refining Partnership and the Nitrogen Fertilizer Partnership will rely primarily upon external financing sources, including commercial bank borrowings and the issuance of debt and equity securities, to fund acquisitions and expansion capital expenditures. As such, to the extent they are unable to finance growth externally, their respective cash distribution policies will significantly impair their ability to grow. The board of directors of the general partner of either the Refining Partnership or the Nitrogen Fertilizer Partnership may modify or revoke its cash distribution policy at any time at its discretion, including in such a manner that would result in an elimination of cash distributions regardless of the amount of available cash they generate. Each board of directors will determine the cash distribution policy it deems advisable for them on an independent basis.
In addition, because of their respective distribution policies, their growth, if any, may not be as robust as that of businesses that reinvest their available cash to expand ongoing operations. To the extent either issues additional units in connection with any acquisitions or expansion capital expenditures or as in-kind distributions, current unitholders will experience dilution and the payment of distributions on those additional units will decrease the amount each distributes in respect of each of its outstanding units. There are no limitations in their respective partnership agreements on either the Refining Partnership's or the Nitrogen Fertilizer Partnership's ability to issue additional units, including units ranking senior to the outstanding common units. The incurrence of additional commercial borrowings or other debt to finance their growth strategy would result in increased interest expense, which, in turn, would reduce the available cash they have to distribute to unitholders (including us).
Each of the Refining Partnership and the Nitrogen Fertilizer Partnership may not have sufficient available cash to pay any quarterly distribution on their respective common units. Furthermore, neither is required to make distributions to holders of its common units on a quarterly basis or otherwise, and both may elect to distribute less than all of their respective available cash.
Either or both of the Refining Partnership or the Nitrogen Fertilizer Partnership may not have sufficient available cash each quarter to enable the payment of distributions to common unitholders. The Refining Partnership and the Nitrogen Fertilizer Partnership are separate public companies, and available cash generated by one of them will not be used to make distributions to common unitholders of the other. Furthermore, their respective partnership agreements do not require either to pay distributions on a quarterly basis or otherwise. The board of directors of the general partner of either the Refining Partnership or the Nitrogen Fertilizer Partnership may at any time, for any reason, change its cash distribution policy or decide not to make any distribution. The amount of cash they will be able to distribute in respect of their common units principally depends on the amount of cash they generate from operations, which is directly dependent upon the margins each business generates. Please see "— Risks Related to the Petroleum Business — The price volatility of crude oil and other feedstocks, refined products and utility services may have a material adverse effect on our profitability and our ability to pay distributions to unitholders" and "— Risks Related to the Nitrogen Fertilizer Business — The nitrogen fertilizer business is, and nitrogen fertilizer prices are, cyclical and highly volatile, and the nitrogen fertilizer business has experienced substantial downturns in the past. Cycles in demand and pricing could potentially expose the nitrogen fertilizer business to significant fluctuations in its operating and financial results and have a material adverse effect on our results of operations, financial condition and cash flows."
43
If either the Refining Partnership or the Nitrogen Fertilizer Partnership were to be treated as a corporation, rather than as a partnership, for U.S. federal income tax purposes or if either partnership were otherwise subject to entity-level taxation, such entity's cash available for distribution to its common unitholders, including to us, would be reduced, likely causing a substantial reduction in the value of such entity's common units, including the common units held by us.
Current law requires the Refining Partnership and the Nitrogen Fertilizer Partnership to derive at least 90% of their respective annual gross income from certain specified activities in order to continue to be treated as a partnership, rather than as a corporation, for U.S. federal income tax purposes. One or both of them may not find it possible to meet this qualifying income requirement, or may inadvertently fail to meet this qualifying income requirement. If either the Refining Partnership or the Nitrogen Fertilizer Partnership were to be treated as a corporation for U.S. federal income tax purposes, they would pay U.S. federal income tax on all of their taxable income at the corporate tax rate, which is currently a maximum of 35%, they would likely pay additional state and local income taxes at varying rates, and distributions to their common unitholders, including to us, would generally be taxed as corporate distributions.
If the Refining Partnership and the Nitrogen Fertilizer Partnership were to be treated as corporations, rather than as partnerships, for U.S. federal income tax purposes or if they were otherwise subject to entity-level taxation, their cash available for distribution to their common unitholders, including to us, and the value of their common units, including the common units held by us, could be substantially reduced.
Increases in interest rates could adversely impact the price of the Refining Partnership's or the Nitrogen Fertilizer Partnership's common units and the Refining Partnership's or the Nitrogen Fertilizer Partnership's ability to issue additional equity to make acquisitions, incur debt or for other purposes.
We expect that the price of the Refining Partnership's or the Nitrogen Fertilizer Partnership's common units will be impacted by the level of the Refining Partnership's or the Nitrogen Fertilizer Partnership's quarterly cash distributions and implied distribution yield. The distribution yield is often used by investors to compare and rank related yield-oriented securities for investment decision-making purposes. Therefore, changes in interest rates may affect the yield requirements of investors who invest in the Refining Partnership's or the Nitrogen Fertilizer Partnership's common units, and a rising interest rate environment could have a material adverse impact on the price of the Refining Partnership's or the Nitrogen Fertilizer Partnership's common units (and therefore the value of our investment in the Refining Partnership and/or the Nitrogen Fertilizer Partnership) as well as the Refining Partnership's or the Nitrogen Fertilizer Partnership's ability to issue additional equity to make acquisitions or to incur debt.
We may have liability to repay distributions that are wrongfully distributed to us.
Under certain circumstances, we may, as a holder of common units in the Refining Partnership and the Nitrogen Fertilizer Partnership, have to repay amounts wrongfully returned or distributed to us. Under the Delaware Revised Uniform Limited Partnership Act, a partnership may not make distributions to its unitholders if the distribution would cause its liabilities to exceed the fair value of its assets. Delaware law provides that for a period of three years from the date of an impermissible distribution, limited partners who received the distribution and who knew at the time of the distribution that it violated Delaware law will be liable to the company for the distribution amount.
Public investors own approximately 47% of the nitrogen fertilizer business through the Nitrogen Fertilizer Partnership and approximately 34% of the petroleum business through the Refining Partnership. Although we own the majority of the common units and the general partner of both the Refining Partnership and the Nitrogen Fertilizer Partnership, the general partners owe a duty of good faith to public unitholders, which could cause them to manage their respective businesses differently than if there were no public unitholders.
Public investors own approximately 47% of the Nitrogen Fertilizer Partnership's common units and approximately 34% of the Refining Partnership's common units. We are not entitled to receive all of the cash generated by the nitrogen fertilizer business or the petroleum business or freely transfer money from the nitrogen fertilizer business to finance operations at the petroleum business or vice versa. Furthermore, although we continue to own the majority of the common units and the general partner of both the Refining Partnership and the Nitrogen Fertilizer Partnership, the general partners are subject to certain fiduciary duties, which may require the general partners to manage their respective businesses in a way that may differ from our best interests.
44
The general partners of the Refining Partnership and the Nitrogen Fertilizer Partnership have limited their liability, replaced default fiduciary duties and restricted the remedies available to common unitholders, including us, for actions that, without these limitations and reductions might otherwise constitute breaches of fiduciary duty.
The respective partnership agreements of the Refining Partnership and the Nitrogen Fertilizer Partnership limit the liability and replace the fiduciary duties of their respective general partner, while also restricting the remedies available to each partnership's common unitholders, including us, for actions that, without these limitations and reductions, might constitute breaches of fiduciary duty. Delaware partnership law permits such contractual reductions of fiduciary duty. The partnership agreements contain provisions that replace the standards to which each general partner would otherwise be held by state fiduciary duty law. For example:
• | The partnership agreements permit each partnership's general partner to make a number of decisions in its individual capacity, as opposed to its capacity as general partner. This entitles its general partner to consider only the interests and factors that it desires, and means that it has no duty or obligation to give any consideration to any interest of, or factors affecting, any limited partner. |
• | The partnership agreements provide that each partnership's general partner will not have any liability to unitholders for decisions made in its capacity as general partner so long as (i) in the case of the Nitrogen Fertilizer Partnership, it acted in good faith, meaning it believed that the decision was in the best interest of the Nitrogen Fertilizer Partnership and (ii) in the case of the Refining Partnership, it did not make such decisions in bad faith, meaning it believed that the decisions were adverse to the Refining Partnership's interests. |
• | The partnership agreements provide that each partnership's general partner and the officers and directors of its general partner will not be liable for monetary damages to common unitholders, including us, for any acts or omissions unless there has been a final and non-appealable judgment entered by a court of competent jurisdiction determining that (i) in the case of the Nitrogen Fertilizer Partnership, the general partner or its officers or directors acted in bad faith or engaged in fraud or willful misconduct, or in, the case of a criminal matter, acted with knowledge that the conduct was criminal and (ii) in the case of the Refining Partnership, such losses or liabilities were the result of the conduct of our general partner or such officer or director engaged in by it in bad faith or with respect to any criminal conduct, with the knowledge that its conduct was unlawful. |
In addition, the Refining Partnership's partnership agreement provides that its general partner will not be in breach of its obligations thereunder or its duties to the Refining Partnership or its limited partners if a transaction with an affiliate or the resolution of a conflict of interest is either (i) approved by the conflicts committee of its board of directors of the general partner, although the general partner is not obligated to seek such approval; or (ii) approved by the vote of a majority of the outstanding units, excluding any units owned by the general partner and its affiliates. In addition, the Nitrogen Fertilizer Partnership's partnership agreement (i) generally provides that affiliated transactions and resolutions of conflicts of interest not approved by the conflicts committee of the board of directors of its general partner and not involving a vote of unitholders must be on terms no less favorable to the Nitrogen Fertilizer Partnership than those generally being provided to or available from unrelated third parties or be "fair and reasonable" to the Nitrogen Fertilizer Partnership, as determined by its general partner in good faith, and that, in determining whether a transaction or resolution is "fair and reasonable," the general partner may consider the totality of the relationships between the parties involved, including other transactions that may be particularly advantageous or beneficial to affiliated parties, including us and (ii) provides that in resolving conflicts of interest, it will be presumed that in making its decision, the general partner or its conflicts committee acted in good faith, and in any proceeding brought by or on behalf of any holder of common units, the person bringing or prosecuting such proceeding will have the burden of overcoming such presumption.
With respect to the common units that we own, we have agreed to be bound by the provisions set forth in each partnership agreement, including the provisions described above.
The Refining Partnership and the Nitrogen Fertilizer Partnership are managed by the executive officers of their general partners, some of whom are employed by and serve as part of the senior management team of the Company. Conflicts of interest could arise as a result of this arrangement.
The Refining Partnership and the Nitrogen Fertilizer Partnership is each managed by the executive officers of their general partners, some of whom are employed by and serve as part of the senior management team of the Company. Furthermore, although both the Refining Partnership and the Nitrogen Fertilizer Partnership have entered into services agreements with the Company under which they compensate the Company for the services of its management, the Company's management is not required to devote any specific amount of time to the petroleum business or the nitrogen fertilizer business and may devote a
45
substantial majority of their time to the business of the Company. Moreover the Company may terminate the services agreement with the Refining Partnership and/or the Nitrogen Fertilizer Partnership at any time, in each case subject to a 180-day notice period. In addition, key executive officers of the Company, including its president and chief executive officer, chief financial officer and general counsel, will face conflicts of interest if decisions arise in which the Refining Partnership or the Nitrogen Fertilizer Partnership and the Company have conflicting points of view or interests.
Item 1B. Unresolved Staff Comments
None.
Item 2. Properties
The following table contains certain information regarding our principal properties:
Location | Acres | Own/Lease | Use | ||||
Coffeyville, KS | 440 | Own | Refining Partnership: oil refinery and office buildings | ||||
Nitrogen Fertilizer Partnership: fertilizer plant | |||||||
Wynnewood, OK | 400 | Own | Oil refinery, office buildings, refined oil storage | ||||
Montgomery County, KS (Coffeyville Station) | 20 | Own | Crude oil storage | ||||
Montgomery County, KS (Broome Station) | 20 | Own | Crude oil storage | ||||
Cowley County, KS (Hooser Station) | 80 | Own | Crude oil storage | ||||
Cushing, OK | 138 | Own | Crude oil storage | ||||
We also lease property for our executive office which is located at 2277 Plaza Drive in Sugar Land, Texas. Additionally, other corporate office space is leased in Kansas City, Kansas.
As of December 31, 2015, the petroleum business owns crude oil storage capacity of approximately (i) 1.5 million barrels that supports the gathering system and the Coffeyville refinery, (ii) 0.9 million barrels at the Wynnewood refinery and (iii) 1.5 million barrels in Cushing, Oklahoma. The petroleum business leases additional crude oil storage capacity of approximately (iv) 2.8 million barrels in Cushing, (v) 0.2 million barrels in Duncan, Oklahoma and (vi) 0.1 million barrels at the Wynnewood refinery. In addition to crude oil storage, the petroleum business owns over 4.5 million barrels of combined refined products and feedstocks storage capacity.
Item 3. Legal Proceedings
We are, and will continue to be, subject to litigation from time to time in the ordinary course of our business, including matters such as those described under "Business — Environmental Matters." We also incorporate by reference into this Part I, Item 3 of this Report, the information regarding the lawsuits and proceedings described and referenced in Note 13 ("Commitments and Contingencies") to our Consolidated Financial Statements as set forth in Part II, Item 8 of this Report. In accordance with Generally Accepted Accounting Principles ("GAAP"), we record a liability when it is both probable that a liability has been incurred and the amount of the loss can be reasonably estimated. These provisions are reviewed at least quarterly and adjusted to reflect the impacts of negotiations, settlements, rulings, advice of legal counsel, and other information and events pertaining to a particular case. Although we cannot predict with certainty the ultimate resolution of lawsuits, investigations or claims asserted against us, we do not believe that any currently pending legal proceeding or proceedings to which we are a party will have a material adverse effect on our business, financial condition or results of operations.
Item 4. Mine Safety Disclosures
Not applicable.
46
PART II
Item 5. Market For Registrant's Common Equity, Related Stockholder Matters and Issuer Purchases of Equity Securities
Market Information
Our common stock, which is listed on the NYSE under the symbol "CVI" commenced trading on October 23, 2007. The table below sets forth, for the quarter indicated, the high and low sales prices per share of our common stock for our most recent fiscal years:
2015 | High | Low | |||||
First Quarter | $ | 43.21 | $ | 33.02 | |||
Second Quarter | 43.46 | 36.43 | |||||
Third Quarter | 43.63 | 36.02 | |||||
Fourth Quarter | 48.37 | 38.45 | |||||
2014 | High | Low | |||||
First Quarter | $ | 43.96 | $ | 34.89 | |||
Second Quarter | 51.44 | 41.06 | |||||
Third Quarter | 50.99 | 44.25 | |||||
Fourth Quarter | 49.64 | 36.70 | |||||
Holders of Record
As of February 16, 2016, there were 127 holders of record of our common stock. Because many of our shares of common stock are held by brokers and other institutions on behalf of stockholders, we are unable to estimate the total number of beneficial owners represented by these record holders.
CVR Energy, Inc. Dividend Policy
On January 24, 2013, the board of directors of the Company adopted a quarterly cash dividend policy. Dividends are subject to change at the discretion of the board of directors. The Company began paying regular quarterly dividends in the second quarter of 2013. Additionally, the Company declared and paid one special cash dividend during the year ended December 31, 2014.
The following is a summary of the quarterly and special dividends paid to stockholders during the years ended December 31, 2015 and 2014:
December 31, 2014 | March 31, 2015 | June 30, 2015 | September 30, 2015 | Total Dividends Paid in 2015 | |||||||||||||||
(in millions, except per share data) | |||||||||||||||||||
Dividend type | Quarterly | Quarterly | Quarterly | Quarterly | |||||||||||||||
Amount paid to IEP | $ | 35.6 | $ | 35.6 | $ | 35.6 | $ | 35.6 | $ | 142.4 | |||||||||
Amounts paid to public stockholders | 7.8 | 7.8 | 7.8 | 7.8 | 31.3 | ||||||||||||||
Total amount paid | $ | 43.4 | $ | 43.4 | $ | 43.4 | $ | 43.4 | $ | 173.7 | |||||||||
Per common share | $ | 0.50 | $ | 0.50 | $ | 0.50 | $ | 0.50 | $ | 2.00 | |||||||||
Shares outstanding | 86.8 | 86.8 | 86.8 | 86.8 | |||||||||||||||
47
December 31, 2013 | March 31, 2014 | June 30, 2014 | July 17, 2014 | September 30, 2014 | Total Dividends Paid in 2014 | ||||||||||||||||||
(in millions, except per share data) | |||||||||||||||||||||||
Dividend type | Quarterly | Quarterly | Quarterly | Special | Quarterly | ||||||||||||||||||
Amount paid to IEP | $ | 53.4 | $ | 53.4 | $ | 53.4 | $ | 142.4 | $ | 53.4 | $ | 356.0 | |||||||||||
Amounts paid to public stockholders | 11.7 | 11.7 | 11.7 | 31.3 | 11.7 | 78.2 | |||||||||||||||||
Total amount paid | $ | 65.1 | $ | 65.1 | $ | 65.1 | $ | 173.7 | $ | 65.1 | $ | 434.2 | |||||||||||
Per common share | $ | 0.75 | $ | 0.75 | $ | 0.75 | $ | 2.00 | $ | 0.75 | $ | 5.00 | |||||||||||
Shares outstanding | 86.8 | 86.8 | 86.8 | 86.8 | 86.8 | ||||||||||||||||||
On February 17, 2016, the board of directors of the Company declared a cash dividend for the fourth quarter of 2015 to the Company's stockholders of $0.50 per share, or $43.4 million in aggregate. The dividend will be paid on March 7, 2016 to stockholders of record at the close of business on February 29, 2016.
Our ability to pay cash dividends is dependent on the ability of our subsidiaries to make distributions to us. The cash distribution policies of the Nitrogen Fertilizer Partnership and the Refining Partnership are described below. Furthermore, the ability of the Nitrogen Fertilizer Partnership and the Refining Partnership to make distributions to us is limited by the Refining Partnership's Amended and Restated ABL Credit Facility and the indenture governing the 2022 Notes. See Part II, Item 7, "Management's Discussion and Analysis of Financial Condition and Results of Operations — Liquidity and Capital Resources" for a discussion of those limitations.
CVR Partners, LP Cash Distribution Policy
The current policy of the board of directors of the Nitrogen Fertilizer Partnership's general partner is to distribute all available cash the Nitrogen Fertilizer Partnership generates each quarter. Available cash for each quarter is determined by the board of directors of the Nitrogen Fertilizer Partnership's general partner following the end of such quarter, subject to the limitations discussed below. The board of directors of the Nitrogen Fertilizer Partnership's general partner calculates available cash for distribution starting with Adjusted Nitrogen Fertilizer EBITDA reduced for cash needed for (i) net cash interest expense (excluding capitalized interest) and debt service and other contractual obligations, (ii) maintenance capital expenditures, (iii) to the extent applicable, major scheduled turnaround expenses and reserves for future operating or capital needs that the board of directors of the Nitrogen Fertilizer Partnership's general partner deems necessary or appropriate, and (iv) expenses associated with the Rentech Nitrogen mergers, if any. Available cash for distribution may be increased by the release of previously established cash reserves, if any, at the discretion of the board of directors of the Nitrogen Fertilizer Partnership's general partner. The Nitrogen Fertilizer Partnership does not intend to maintain excess distribution coverage for the purpose of maintaining stability or growth in its quarterly distribution or otherwise to reserve cash for distributions, nor does the Nitrogen Fertilizer Partnership intend to incur debt to pay quarterly distributions. As of the date of this Report, we own approximately 53% of the Nitrogen Fertilizer Partnership's common units, and are entitled to a pro rata percentage of the Nitrogen Fertilizer Partnership's distributions in respect of its common units. The board of directors of the Nitrogen Fertilizer Partnership may modify the cash distribution policy at any time, and the partnership agreement does not require the Nitrogen Fertilizer Partnership to make distributions at all.
The Merger Agreement with Rentech Nitrogen and Rentech Nitrogen GP includes customary restrictions on the conduct of the Nitrogen Fertilizer Partnership's business prior to the completion of the mergers, generally requiring the Nitrogen Fertilizer Partnership to conduct its business in the ordinary course and subjecting the Nitrogen Fertilizer Partnership to a variety of specified limitations. In accordance with the terms of the Merger Agreement, beginning with the distribution for the third quarter of 2015 and until the closing of the mergers, the Nitrogen Fertilizer Partnership may not make or declare distributions in excess of available cash for distribution in respect of any quarter. Refer to Part II, Item 8, Note 1 ("Organization and History of the Company") of this Report for further discussion of the pending mergers.
48
The following is a summary of cash distributions paid by the Nitrogen Fertilizer Partnership to unitholders during the years ended December 31, 2015 and 2014 for the respective quarters to which the distributions relate:
December 31, 2014 | March 31, 2015 | June 30, 2015 | September 30, 2015 | Total Cash Distributions Paid in 2015 | |||||||||||||||
(in millions, except per common unit data) | |||||||||||||||||||
Amount paid to CRLLC | $ | 16.0 | $ | 17.5 | $ | 15.2 | $ | — | $ | 48.6 | |||||||||
Amounts paid to public unitholders | 14.0 | 15.4 | 13.3 | — | 42.8 | ||||||||||||||
Total amount paid | $ | 30.0 | $ | 32.9 | $ | 28.5 | $ | — | $ | 91.4 | |||||||||
Per common unit | $ | 0.41 | $ | 0.45 | $ | 0.39 | $ | — | $ | 1.25 | |||||||||
Common units outstanding | 73.1 | 73.1 | 73.1 | 73.1 | |||||||||||||||
December 31, 2013 | March 31, 2014 | June 30, 2014 | September 30, 2014 | Total Cash Distributions Paid in 2014 | |||||||||||||||
(in millions, except per common unit data) | |||||||||||||||||||
Amount paid to CRLLC | $ | 16.7 | $ | 14.8 | $ | 12.8 | $ | 10.5 | $ | 54.9 | |||||||||
Amounts paid to public unitholders | 14.7 | 13.0 | 11.3 | 9.2 | 48.2 | ||||||||||||||
Total amount paid | $ | 31.4 | $ | 27.8 | $ | 24.1 | $ | 19.7 | $ | 103.1 | |||||||||
Per common unit | $ | 0.43 | $ | 0.38 | $ | 0.33 | $ | 0.27 | $ | 1.41 | |||||||||
Common units outstanding | 73.1 | 73.1 | 73.1 | 73.1 | |||||||||||||||
On February 17, 2016, the board of directors of the Nitrogen Fertilizer Partnership's general partner declared a cash distribution for the fourth quarter of 2015 to the Nitrogen Fertilizer Partnership's unitholders of $0.27 per unit, or $19.7 million in aggregate. The cash distribution will be paid on March 7, 2016 to unitholders of record at the close of business on February 29, 2016. Total cash distributions paid and to be paid based upon available cash for 2015 were $1.11 per common unit.
CVR Refining, LP Cash Distribution Policy
The current policy of the board of directors of the Refining Partnership's general partner is to distribute all of the available cash the Refining Partnership generates each quarter. Available cash for each quarter will be determined by the board of directors of the Refining Partnership's general partner following the end of such quarter and will generally equal Adjusted Petroleum EBITDA reduced for (i) cash needed for debt service, (ii) reserves for environmental and maintenance capital expenditures, (iii) reserves for future major scheduled turnaround expenses and, (iv) to the extent applicable, reserves for future operating or capital needs that the board of directors of the Refining Partnership's general partner deems necessary or appropriate, if any. Available cash for distributions may be increased by the release of previously established cash reserves, if any, and other excess cash, at the discretion of the board of directors of the Refining Partnership's general partner. The Refining Partnership does not intend to maintain excess distribution coverage for the purpose of maintaining stability or growth in its quarterly distribution or otherwise to reserve cash for distributions, nor do they intend to incur debt to pay quarterly distributions. Further, it is the Refining Partnership's intent, subject to market conditions, to finance growth capital externally, and not to reserve cash for unspecified potential future needs. As of the date of this Report, we own approximately 66% of the Refining Partnership's common units, and are entitled to a pro rata percentage of the Refining Partnership's distributions in respect of its common units. The board of directors of the Refining Partnership's general partner may modify the cash distribution policy at any time, and the partnership agreement does not require the Refining Partnership to make distributions at all.
49
The following is a summary of cash distributions paid by the Refining Partnership to unitholders during the years ended December 31, 2015 and 2014 for the respective quarters to which the distributions relate:
December 31, 2014 | March 31, 2015 | June 30, 2015 | September 30, 2015 | Total Cash Distributions Paid in 2015 | |||||||||||||||
(in millions, except per common unit data) | |||||||||||||||||||
Amount paid to CVR Refining Holdings, LLC | $ | 36.0 | $ | 74.0 | $ | 95.4 | $ | 98.3 | $ | 303.6 | |||||||||
Amounts paid to public unitholders | 18.6 | 38.2 | 49.2 | 50.8 | 156.9 | ||||||||||||||
Total amount paid | $ | 54.6 | $ | 112.2 | $ | 144.6 | $ | 149.1 | $ | 460.5 | |||||||||
Per common unit | $ | 0.37 | $ | 0.76 | $ | 0.98 | $ | 1.01 | $ | 3.12 | |||||||||
Common units outstanding | 147.6 | 147.6 | 147.6 | 147.6 | |||||||||||||||
December 31, 2013 | March 31, 2014 | June 30, 2014 | September 30, 2014 | Total Cash Distributions Paid in 2014 | |||||||||||||||
(in millions, except per common unit data) | |||||||||||||||||||
Amount paid to CVR Refining Holdings, LLC | $ | 47.1 | $ | 102.8 | $ | 93.4 | $ | 52.5 | $ | 295.8 | |||||||||
Amounts paid to public unitholders | 19.3 | 41.9 | 48.3 | 27.2 | 136.7 | ||||||||||||||
Total amount paid | $ | 66.4 | $ | 144.7 | $ | 141.7 | $ | 79.7 | $ | 432.5 | |||||||||
Per common unit | $ | 0.45 | $ | 0.98 | $ | 0.96 | $ | 0.54 | $ | 2.93 | |||||||||
Common units outstanding | 147.6 | 147.6 | 147.6 | 147.6 | |||||||||||||||
Total cash distributions paid based upon available cash for 2015 were $2.75 per common unit.
Stock Performance Graph
The following graph sets forth the cumulative return on our common stock between January 1, 2011 and December 31, 2015, as compared to the cumulative return of the Russell 2000 Index and an industry peer group consisting of Alon USA Energy, Inc., Delek US Holdings, Inc., HollyFrontier Corporation, Tesoro Corporation, Valero Energy Corporation and Western Refining, Inc. The graph assumes an investment of $100 on January 1, 2011 in our common stock, the Russell 2000 Index and the industry peer group, and assumes the reinvestment of dividends where applicable. The closing market price for our common stock on December 31, 2015 was $39.35. The stock price performance shown on the graph is not intended to forecast and does not necessarily indicate future price performance.
50
COMPARISON OF CUMULATIVE TOTAL RETURN
BETWEEN JANUARY 1, 2011 AND DECEMBER 31, 2015
among CVR Energy, Inc., Russell 2000 Index and a peer group
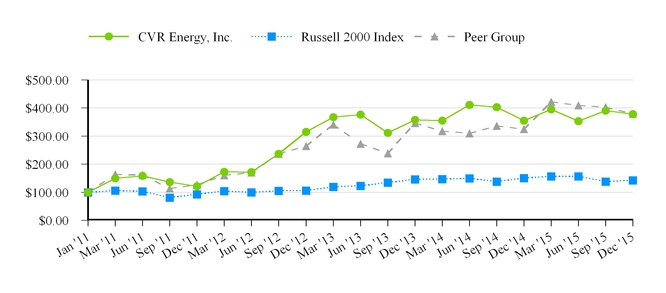
This performance graph shall not be deemed "filed" for purposes of Section 18 of the Exchange Act, or otherwise subject to the liabilities under that Section, and shall not be deemed to be incorporated by reference into any filing under the Securities Act of 1933, as amended (the "Securities Act"), or the Exchange Act.
Jan '11 | Mar '11 | Jun '11 | Sep '11 | Dec '11 | Mar '12 | Jun '12 | Sep '12 | Dec '12 | Mar '13 | Jun '13 | ||||||||||||||||||||||
CVR Energy, Inc. | 100.00 | 149.32 | 158.74 | 136.30 | 120.76 | 172.47 | 171.37 | 236.94 | 314.57 | 367.19 | 376.65 | |||||||||||||||||||||
Russell 2000 Index | 100.00 | 105.63 | 103.62 | 80.67 | 92.78 | 103.97 | 99.99 | 104.87 | 106.36 | 119.16 | 122.41 | |||||||||||||||||||||
Peer Group | 100.00 | 163.79 | 160.94 | 113.17 | 126.61 | 160.27 | 170.08 | 236.91 | 264.52 | 340.64 | 272.72 | |||||||||||||||||||||
Sep '13 | Dec '13 | Mar '14 | Jun '14 | Sep '14 | Dec '14 | Mar '15 | Jun '15 | Sep '15 | Dec '15 | ||||||||||||||||||||
CVR Energy, Inc. | 311.10 | 358.04 | 354.65 | 410.78 | 403.40 | 354.60 | 394.66 | 353.48 | 390.39 | 378.31 | |||||||||||||||||||
Russell 2000 Index | 134.47 | 145.72 | 146.89 | 149.39 | 137.96 | 150.86 | 156.88 | 157.03 | 137.83 | 142.24 | |||||||||||||||||||
Peer Group | 238.60 | 346.24 | 317.43 | 309.92 | 336.54 | 324.45 | 421.99 | 408.97 | 402.89 | 378.74 | |||||||||||||||||||
Purchases of Equity Securities by the Issuer
We did not repurchase any of our common stock during the fiscal quarter ended December 31, 2015.
51
Item 6. Selected Financial Data
You should read the selected historical consolidated financial data presented below in conjunction with "Management's Discussion and Analysis of Financial Condition and Results of Operations" and our consolidated financial statements and the related notes included elsewhere in this Report.
The selected consolidated financial information presented below under the captions "Statements of Operations Data" and "Cash Flow Data" for the years ended December 31, 2015, 2014 and 2013 and the selected consolidated financial information presented below under the caption "Balance Sheet Data" as of December 31, 2015 and 2014 has been derived from our audited consolidated financial statements included elsewhere in this Report, which financial statements have been audited by Grant Thornton LLP, our independent registered public accounting firm. The selected consolidated financial information presented below under the captions "Statements of Operations Data" and "Cash Flow Data" for the years ended December 31, 2012 and 2011 and the selected consolidated financial information presented below under the caption "Balance Sheet Data" at December 31, 2013, 2012 and 2011 is derived from our audited consolidated financial statements that are not included in this Report.
Year Ended December 31, | |||||||||||||||||||
2015 | 2014 | 2013 | 2012 | 2011(1) | |||||||||||||||
(in millions, except per share data) | |||||||||||||||||||
Statements of Operations Data | |||||||||||||||||||
Net sales | $ | 5,432.5 | $ | 9,109.5 | $ | 8,985.8 | $ | 8,567.3 | $ | 5,029.1 | |||||||||
Cost of product sold(2) | 4,190.4 | 8,066.0 | 7,563.2 | 6,696.9 | 3,943.5 | ||||||||||||||
Direct operating expenses(2) | 584.7 | 515.1 | 455.8 | 522.1 | 334.1 | ||||||||||||||
Flood insurance recovery | (27.3 | ) | — | — | — | — | |||||||||||||
Insurance recovery-business interruption | — | — | — | — | (3.4 | ) | |||||||||||||
Selling, general and administrative expenses(2) | 99.0 | 109.7 | 113.5 | 183.4 | 98.0 | ||||||||||||||
Depreciation and amortization | 164.1 | 154.4 | 142.8 | 130.0 | 90.3 | ||||||||||||||
Operating income | $ | 421.6 | $ | 264.3 | $ | 710.5 | $ | 1,034.9 | $ | 566.6 | |||||||||
Interest expense and other financing costs | (48.4 | ) | (40.0 | ) | (50.5 | ) | (75.4 | ) | (55.8 | ) | |||||||||
Interest income | 1.0 | 0.9 | 1.2 | 0.9 | 0.5 | ||||||||||||||
Gain (loss) on derivatives, net | (28.6 | ) | 185.6 | 57.1 | (285.6 | ) | 78.1 | ||||||||||||
Loss on extinguishment of debt | — | — | (26.1 | ) | (37.5 | ) | (2.1 | ) | |||||||||||
Other income (expense), net | 36.7 | (3.7 | ) | 13.5 | 0.9 | 0.8 | |||||||||||||
Income before income tax expense | $ | 382.3 | $ | 407.1 | $ | 705.7 | $ | 638.2 | $ | 588.1 | |||||||||
Income tax expense | 84.5 | 97.7 | 183.7 | 225.6 | 209.5 | ||||||||||||||
Net income | 297.8 | 309.4 | 522.0 | 412.6 | 378.6 | ||||||||||||||
Less: Net income attributable to noncontrolling interest | 128.2 | 135.5 | 151.3 | 34.0 | 32.8 | ||||||||||||||
Net income attributable to CVR Energy stockholders | $ | 169.6 | $ | 173.9 | $ | 370.7 | $ | 378.6 | $ | 345.8 | |||||||||
Basic earnings per share | $ | 1.95 | $ | 2.00 | $ | 4.27 | $ | 4.36 | $ | 4.00 | |||||||||
Diluted earnings per share | $ | 1.95 | $ | 2.00 | $ | 4.27 | $ | 4.33 | $ | 3.94 | |||||||||
Dividends declared per share | $ | 2.00 | $ | 5.00 | $ | 14.25 | $ | — | $ | — | |||||||||
Weighted-average common shares outstanding: | |||||||||||||||||||
Basic | 86.8 | 86.8 | 86.8 | 86.8 | 86.5 | ||||||||||||||
Diluted | 86.8 | 86.8 | 86.8 | 87.4 | 87.8 | ||||||||||||||
52
Year Ended December 31, | |||||||||||||||||||
2015 | 2014 | 2013 | 2012 | 2011(1) | |||||||||||||||
(in millions) | |||||||||||||||||||
Balance Sheet Data | |||||||||||||||||||
Cash and cash equivalents | $ | 765.1 | $ | 753.7 | $ | 842.1 | $ | 896.0 | $ | 388.3 | |||||||||
Working capital | 789.9 | 1,033.0 | 1,230.2 | 1,135.4 | 769.2 | ||||||||||||||
Total assets | 3,305.8 | 3,462.5 | 3,665.8 | 3,610.9 | 3,119.3 | ||||||||||||||
Total debt, including current portion | 673.5 | 674.9 | 676.2 | 898.2 | 863.8 | ||||||||||||||
Total CVR stockholders' equity | 984.1 | 988.1 | 1,188.6 | 1,525.1 | 1,151.6 | ||||||||||||||
Cash Flow Data | |||||||||||||||||||
Net cash flow provided by (used in): | |||||||||||||||||||
Operating activities | $ | 536.8 | $ | 640.3 | $ | 440.1 | $ | 762.6 | $ | 278.6 | |||||||||
Investing activities | (150.6 | ) | (296.6 | ) | (250.3 | ) | (210.7 | ) | (674.4 | ) | |||||||||
Financing activities | (374.8 | ) | (432.1 | ) | (243.7 | ) | (44.2 | ) | 584.1 | ||||||||||
Net cash flow | $ | 11.4 | $ | (88.4 | ) | $ | (53.9 | ) | $ | 507.7 | $ | 188.3 | |||||||
Capital expenditures for property, plant and equipment | $ | 218.7 | $ | 218.4 | $ | 256.5 | $ | 212.2 | $ | 91.2 | |||||||||
_______________________________________
(1) | We acquired WEC on December 15, 2011 and its results of operations are included from the date of acquisition. |
(2) | Amounts are shown exclusive of depreciation and amortization. |
53
Item 7. Management's Discussion and Analysis of Financial Condition and Results of Operations
You should read the following discussion and analysis of our financial condition and results of operations in conjunction with our consolidated financial statements and related notes included elsewhere in this Report.
Forward-Looking Statements
This Report, including, without limitation, the sections captioned "Business" and "Management's Discussion and Analysis of Financial Condition and Results of Operations," contains "forward-looking statements" as defined by the SEC, including statements concerning contemplated transactions and strategic plans, expectations and objectives for future operations. Forward-looking statements include, without limitation:
• | statements, other than statements of historical fact, that address activities, events or developments that we expect, believe or anticipate will or may occur in the future; |
• | statements relating to future financial or operational performance, future dividends, future capital sources and capital expenditures; and |
• | any other statements preceded by, followed by or that include the words "anticipates," "believes," "expects," "plans," "intends," "estimates," "projects," "could," "should," "may," or similar expressions. |
Although we believe that our plans, intentions and expectations reflected in or suggested by the forward-looking statements we make in this Report, including this Management's Discussion and Analysis of Financial Condition and Results of Operations, are reasonable, we can give no assurance that such plans, intentions or expectations will be achieved. These statements are based on assumptions made by us based on our experience and perception of historical trends, current conditions, expected future developments and other factors that we believe are appropriate in the circumstances. Such statements are subject to a number of risks and uncertainties, many of which are beyond our control. You are cautioned that any such statements are not guarantees of future performance and that actual results or developments may differ materially from those projected in the forward-looking statements as a result of various factors, including but not limited to those set forth under the section captioned "Risk Factors" and contained elsewhere in this Report. Such factors include, among others:
• | volatile margins in the refining industry and exposure to the risks associated with volatile crude oil prices; |
• | the availability of adequate cash and other sources of liquidity for the capital needs of our businesses; |
• | the ability to forecast future financial condition or results of operations and future revenues and expenses of our businesses; |
• | the effects of transactions involving forward and derivative instruments; |
• | disruption of the petroleum business' ability to obtain an adequate supply of crude oil; |
• | changes in laws, regulations and policies with respect to the export of crude oil or other hydrocarbons; |
• | interruption of the pipelines supplying feedstock and in the distribution of the petroleum business' products; |
• | competition in the petroleum and nitrogen fertilizer businesses; |
• | capital expenditures and potential liabilities arising from environmental laws and regulations; |
• | changes in ours or the Refining Partnership's or Nitrogen Fertilizer Partnership's credit profile; |
• | the cyclical nature of the nitrogen fertilizer business; |
• | the seasonal nature of the petroleum business; |
• | the supply and price levels of essential raw materials of our businesses; |
• | the risk of a material decline in production at our refineries and nitrogen fertilizer plant; |
54
• | potential operating hazards from accidents, fire, severe weather, floods or other natural disasters; |
• | the risk associated with governmental policies affecting the agricultural industry; |
• | the volatile nature of ammonia, potential liability for accidents involving ammonia that cause interruption to the nitrogen fertilizer business, severe damage to property and/or injury to the environment and human health and potential increased costs relating to the transport of ammonia; |
• | the dependence of the nitrogen fertilizer business on a few third-party suppliers, including providers of transportation services and equipment; |
• | new regulations concerning the transportation of hazardous chemicals, risks of terrorism and the security of chemical manufacturing facilities; |
• | the risk of security breaches; |
• | the petroleum business' and the nitrogen fertilizer business' dependence on significant customers; |
• | the potential loss of the nitrogen fertilizer business' transportation cost advantage over its competitors; |
• | the potential inability to successfully implement our business strategies, including the completion of significant capital programs; |
• | our ability to continue to license the technology used in the petroleum business and nitrogen fertilizer business operations; |
• | our petroleum business' ability to purchase gasoline and diesel RINs on a timely and cost effective basis; |
• | our petroleum business' continued ability to secure environmental and other governmental permits necessary for the operation of its business; |
• | existing and proposed environmental laws and regulations, including those relating to climate change, alternative energy or fuel sources, and existing and future regulations related to the end-use and application of fertilizers; |
• | refinery and nitrogen fertilizer facility operating hazards and interruptions, including unscheduled maintenance or downtime, and the availability of adequate insurance coverage; |
• | instability and volatility in the capital and credit markets; and |
• | potential exposure to underfunded pension obligations of affiliates as a member of the controlled group of Mr. Icahn. |
All forward-looking statements contained in this Report only speak as of the date of this Report. We undertake no obligation to publicly update or revise any forward-looking statements to reflect events or circumstances that occur after the date of this Report, or to reflect the occurrence of unanticipated events, except to the extent required by law.
Overview and Executive Summary
We are a diversified holding company primarily engaged in the petroleum refining and nitrogen fertilizer manufacturing industries through our holdings in the Refining Partnership and the Nitrogen Fertilizer Partnership. The Refining Partnership is an independent petroleum refiner and marketer of high value transportation fuels. The Nitrogen Fertilizer Partnership produces nitrogen fertilizers in the form of UAN and ammonia. We own the general partner and approximately 66% and 53%, respectively, of the outstanding common units representing limited partner interests in each of the Refining Partnership and the Nitrogen Fertilizer Partnership.
We operate under two business segments: petroleum and nitrogen fertilizer. For the fiscal years ended December 31, 2015, 2014 and 2013, we generated consolidated net sales of $5.4 billion, $9.1 billion and $9.0 billion, respectively, and operating income of $421.6 million, $264.3 million and $710.5 million, respectively. The petroleum business generated net sales of $5.2
55
billion, $8.8 billion and $8.7 billion, and the nitrogen fertilizer business generated net sales of $289.2 million, $298.7 million and $323.7 million, in each case, for the years ended December 31, 2015, 2014 and 2013, respectively. The petroleum business generated operating income of $361.7 million, $207.2 million and $603.0 million for the years ended December 31, 2015, 2014 and 2013, respectively. The nitrogen fertilizer business generated operating income of $68.7 million, $82.8 million and $124.9 million for the years ended December 31, 2015, 2014 and 2013, respectively.
Refer to Part I, Item 1, Business, of this Report for a detailed discussion of our business and the petroleum and nitrogen fertilizer segments.
Pending Mergers
On August 9, 2015, CVR Partners entered into an Agreement and Plan of Merger (the "Merger Agreement") with Rentech Nitrogen Partners, L.P. ("Rentech Nitrogen") and Rentech Nitrogen GP, LLC ("Rentech Nitrogen GP"), pursuant to which CVR Partners would acquire Rentech Nitrogen and Rentech Nitrogen GP by merging two newly-created direct wholly-owned subsidiaries of CVR Partners with and into those entities with Rentech Nitrogen and Rentech Nitrogen GP continuing as surviving entities and wholly-owned subsidiaries of CVR Partners (together, the "mergers"). In accordance with accounting principles generally accepted in the United States and in accordance with the Financial Accounting Standards Board's Accounting Standards Codification Topic 805 - Business Combinations, the Nitrogen Fertilizer Partnership anticipates accounting for the mergers as an acquisition of a business with CVR Partners as the acquirer. Refer to Part II, Item 8, Note 1 ("Organization and History of the Company") of this Report for further discussion of the mergers.
Refining Partnership Initial Public Offering
On January 23, 2013, the Refining Partnership completed the Refining Partnership IPO. The Refining Partnership sold 24,000,000 common units at a price of $25.00 per unit, resulting in gross proceeds of $600.0 million. Of the common units issued, 4,000,000 units were purchased by an affiliate of Icahn Enterprises L.P. ("IEP"). Additionally, on January 30, 2013, the underwriters closed their option to purchase an additional 3,600,000 common units at a price of $25.00 per unit resulting in gross proceeds of $90.0 million. The common units, which are listed on the NYSE, began trading on January 17, 2013 under the symbol "CVRR." In connection with the Refining Partnership IPO, the Refining Partnership paid approximately $32.5 million in underwriting fees and incurred approximately $3.9 million of other offering costs.
Prior to the Refining Partnership IPO, CVR owned 100% of the Refining Partnership and net income earned during this period was fully attributable to the Company. Immediately following the Refining Partnership IPO and through May 19, 2013, CVR Energy indirectly owned approximately 81% of the Refining Partnership's outstanding common units and 100% of the Refining Partnership's general partner, which holds a non-economic general partner interest.
Refining Partnership Underwritten Offering
On May 20, 2013, the Refining Partnership completed the Underwritten Offering by selling 12,000,000 common units to the public at a price of $30.75 per unit. American Entertainment Properties Corporation ("AEPC"), an affiliate of IEP, also purchased an additional 2,000,000 common units at the public offering price in a privately negotiated transaction with a subsidiary of CVR Energy, which was completed on May 29, 2013. In connection with the Underwritten Offering, on June 10, 2013, the Refining Partnership sold an additional 1,209,236 common units to the public at a price of $30.75 per unit in connection with the exercise by the underwriters of their option to purchase additional common units. The transactions described in this paragraph are collectively referred to as the "Transactions."
The Refining Partnership utilized net proceeds of approximately $394.0 million from the Underwritten Offering (including the underwriters' option) to redeem 13,209,236 common units from CVR Refining Holdings, LLC ("CVR Refining Holdings"), an indirect wholly-owned subsidiary of CVR Energy. The net proceeds to a subsidiary of CVR Energy from the sale of 2,000,000 common units to AEPC were approximately $61.5 million. The Refining Partnership did not receive any of the proceeds from the sale of common units by CVR Energy to AEPC.
Immediately following the closing of the Transactions and prior to June 30, 2014, public security holders held approximately 29% of total Refining Partnership common units (including units owned by affiliates of IEP, representing approximately 4% of total Refining Partnership common units), and CVR Refining Holdings held approximately 71% of total Refining Partnership common units.
56
Refining Partnership Second Underwritten Offering
On June 30, 2014, the Refining Partnership completed a second underwritten offering (the "Second Underwritten Offering") by selling 6,500,000 common units to the public at a price of $26.07 per unit. The Refining Partnership paid approximately $5.3 million in underwriting fees and approximately $0.5 million in offering costs. The Refining Partnership utilized net proceeds of approximately $164.1 million from the Second Underwritten Offering to redeem 6,500,000 common units from CVR Refining Holdings. Immediately subsequent to the closing of the Second Underwritten Offering and through July 23, 2014, public security holders held approximately 33% of the total Refining Partnership common units, and CVR Refining Holdings held approximately 67% of the total Refining Partnership common units.
On July 24, 2014, the Refining Partnership sold an additional 589,100 common units to the public at a price of $26.07 per unit in connection with the underwriters' exercise of their option to purchase additional common units. The Refining Partnership utilized net proceeds of approximately $14.9 million from the underwriters' exercise of their option to purchase additional common units to redeem an equal amount of common units from CVR Refining Holdings. Additionally, on July 24, 2014, CVR Refining Holdings sold 385,900 common units to the public at a price of $26.07 per unit in connection with the underwriters' exercise of their remaining option to purchase additional common units. CVR Refining Holdings received net proceeds of $9.7 million.
Immediately subsequent to the closing of the underwriters' option for the Second Underwritten Offering and as of December 31, 2015, public security holders held approximately 34% of total Refining Partnership common units (including units held by affiliates of IEP, representing approximately 4% of total Refining Partnership common units), and CVR Refining Holdings held approximately 66% of total Refining Partnership common units in addition to owning 100% of the Refining Partnership's general partner.
Nitrogen Fertilizer Partnership Secondary Offering
On May 28, 2013, Coffeyville Resources, LLC ("CRLLC"), a wholly-owned subsidiary of CVR Energy, completed the Secondary Offering in which it sold 12,000,000 Nitrogen Fertilizer Partnership common units to the public at a price of $25.15 per unit. The net proceeds to CRLLC from the Secondary Offering were approximately $292.6 million, after deducting approximately $9.2 million in underwriting discounts and commissions. The Nitrogen Fertilizer Partnership did not receive any of the proceeds from the sale of common units by CRLLC.
Immediately following the closing of the Secondary Offering and as of December 31, 2015, public security holders held approximately 47% of total Nitrogen Fertilizer Partnership common units, and CRLLC held approximately 53% of total Nitrogen Fertilizer Partnership common units in addition to owning 100% of the Nitrogen Fertilizer Partnership's general partner.
Major Influences on Results of Operations
Petroleum Business
The earnings and cash flows of the petroleum business are primarily affected by the relationship between refined product prices and the prices for crude oil and other feedstocks that are processed and blended into refined products. The cost to acquire crude oil and other feedstocks and the price for which refined products are ultimately sold depend on factors beyond the petroleum business' control, including the supply of and demand for crude oil, as well as gasoline and other refined products which, in turn, depend on, among other factors, changes in domestic and foreign economies, weather conditions, domestic and foreign political affairs, production levels, the availability of imports, the marketing of competitive fuels and the extent of government regulation. Because the petroleum business applies first-in, first-out ("FIFO") accounting to value its inventory, crude oil price movements may impact net income in the short term because of changes in the value of its unhedged on-hand inventory. The effect of changes in crude oil prices on our results of operations is influenced by the rate at which the prices of refined products adjust to reflect these changes.
The prices of crude oil and other feedstocks and refined product prices are also affected by other factors, such as product pipeline capacity, local market conditions and the operating levels of competing refineries. Crude oil costs and the prices of refined products have historically been subject to wide fluctuations. Widespread expansion or upgrades of competitors' facilities, price volatility, international political and economic developments and other factors are likely to continue to play an important role in refining industry economics. These factors can impact, among other things, the level of inventories in the market, resulting in price volatility and a reduction in product margins. Moreover, the refining industry typically experiences seasonal fluctuations in demand for refined products, such as increases in the demand for gasoline during the summer driving
57
season and for home heating oil during the winter, primarily in the Northeast. In addition to current market conditions, there are long-term factors that may impact the demand for refined products. These factors include mandated renewable fuels standards, proposed climate change laws and regulations, and increased mileage standards for vehicles. The petroleum business is also subject to the Renewable Fuel Standard ("RFS") of the United States Environmental Protection Agency (the "EPA"), which requires it to either blend "renewable fuels" in with its transportation fuels or purchase renewable fuel credits, known as renewable identification numbers ("RINs"), in lieu of blending.
Refer to Part I, Item 1A, Risk Factors, If sufficient RINs are unavailable for purchase, if the petroleum business has to pay a significantly higher price for RINs or if the petroleum business is otherwise unable to meet the EPA's Renewable Fuels Standard (RFS) mandates, the petroleum business' financial condition and results of operations could be materially adversely affected, and Part II, Item 8, Note 13 ("Commitments and Contingencies"), "Environmental, Health and Safety ("EHS") Matters" of this Report for further discussion of RFS.
The cost of RINs for the years ended December 31, 2015, 2014 and 2013 was approximately $123.9 million, $127.2 million and $180.5 million, respectively. The price of RINs has been extremely volatile and has increased over the last year. The future cost of RINs for the petroleum business is difficult to estimate. Additionally, the cost of RINs is dependent upon a variety of factors, which include the availability of RINs for purchase, the price at which RINs can be purchased, transportation fuel production levels, the mix of the petroleum business’ petroleum products, as well as the fuel blending performed at its refineries and downstream terminals, all of which can vary significantly from period to period. Based upon recent market prices of RINs and current estimates related to the other variable factors, the petroleum business estimates that the total cost of RINs will be approximately $140.0 million to $190.0 million for the year ending December 31, 2016.
In order to assess the operating performance of the petroleum business, we compare net sales, less cost of product sold (exclusive of depreciation and amortization), or the refining margin, against an industry refining margin benchmark. The industry refining margin benchmark is calculated by assuming that two barrels of benchmark light sweet crude oil are converted into one barrel of conventional gasoline and one barrel of distillate. This benchmark is referred to as the 2-1-1 crack spread. Because we calculate the benchmark margin using the market value of NYMEX gasoline and heating oil against the market value of NYMEX WTI, we refer to the benchmark as the NYMEX 2-1-1 crack spread, or simply, the 2-1-1 crack spread. The 2-1-1 crack spread is expressed in dollars per barrel and is a proxy for the per barrel margin that a sweet crude oil refinery would earn assuming it produced and sold the benchmark production of gasoline and distillate.
Although the 2-1-1 crack spread is a benchmark for the refinery margin, because the refineries have certain feedstock costs and logistical advantages as compared to a benchmark refinery and their product yield is less than total refinery throughput, the crack spread does not account for all the factors that affect refinery margin. The Coffeyville refinery is able to process a blend of crude oil that includes quantities of heavy and medium sour crude oil that has historically cost less than WTI. The Wynnewood refinery has the capability to process blends of a variety of crude oil ranging from medium sour to light sweet crude oil, although isobutene, gasoline components, and normal butane are also typically used. We measure the cost advantage of the crude oil slate by calculating the spread between the price of the delivered crude oil and the price of WTI. The spread is referred to as the consumed crude oil differential. The refinery margin can be impacted significantly by the consumed crude oil differential. The consumed crude oil differential will move directionally with changes in the WTS differential to WTI and the WCS differential to WTI as both these differentials indicate the relative price of heavier, more sour, slate to WTI. The correlation between the consumed crude oil differential and published differentials will vary depending on the volume of light medium sour crude oil and heavy sour crude oil the petroleum business purchases as a percent of its total crude oil volume and will correlate more closely with such published differentials the heavier and more sour the crude oil slate. The consumed crude oil cost discount to WTI for 2015 was $1.12 per barrel compared to consumed crude oil cost discounts of $0.54 per barrel in 2014 and $2.57 per barrel in 2013.
The petroleum business produces a high volume of high value products, such as gasoline and distillates. The fact that the actual product specifications used to determine the NYMEX 2-1-1 crack spread are different from the actual production in its refineries is because the prices the petroleum business realizes are different than those used in determining the 2-1-1 crack spread. The difference between its price and the price used to calculate the 2-1-1 crack spread is referred to as gasoline PADD II, Group 3 vs. NYMEX basis, or gasoline basis, and Ultra-Low Sulfur Diesel PADD II, Group 3 vs. NYMEX basis, or Ultra-Low Sulfur Diesel basis. If both gasoline and Ultra-Low Sulfur Diesel basis are greater than zero, this means that prices in its marketing area exceed those used in the 2-1-1 crack spread.
The petroleum business is significantly affected by developments in the markets in which it operates. For example, numerous pipeline projects in 2014 expanded the connectivity of the Cushing and Permian Basin markets to the gulf coast, resulting in a decrease in the domestic crude advantage. The refining industry is directly impacted by these events and could see a downward movement in refining margins as a result.
58
The direct operating expense structure is also important to the petroleum business' profitability. Major direct operating expenses include energy, employee labor, maintenance, contract labor, and environmental compliance. The predominant variable cost is energy, which is comprised primarily of electrical cost and natural gas. The petroleum business is therefore sensitive to the movements of natural gas prices. Assuming the same rate of consumption of natural gas for the year ended December 31, 2015, a $1.00 change in natural gas prices would have increased or decreased the petroleum business' natural gas costs by approximately $11.1 million.
Because crude oil and other feedstocks and refined products are commodities, the petroleum business has no control over the changing market. Therefore, the lower target inventory it is able to maintain significantly reduces the impact of commodity price volatility on its petroleum product inventory position relative to other refiners. This target inventory position is generally not hedged. To the extent its inventory position deviates from the target level, the petroleum business considers risk mitigation activities usually through the purchase or sale of futures contracts on the NYMEX. Its hedging activities carry customary time, location and product grade basis risks generally associated with hedging activities. Because most of its titled inventory is valued under the FIFO costing method, price fluctuations on its target level of titled inventory have a major effect on the petroleum business' financial results.
Safe and reliable operations at the refineries are key to the petroleum business' financial performance and results of operations. Unplanned downtime at the refineries may result in lost margin opportunity, increased maintenance expense and a temporary increase in working capital investment and related inventory position. The petroleum business seeks to mitigate the financial impact of planned downtime, such as major turnaround maintenance, through a diligent planning process that takes into account the margin environment, the availability of resources to perform the needed maintenance, feedstock logistics and other factors. The refineries generally require a facility turnaround every four to five years. The length of the turnaround is contingent upon the scope of work to be completed. During the outage at the Coffeyville refinery in the third quarter of 2014 as discussed further below, the petroleum business accelerated certain planned 2015 turnaround activities and incurred approximately $5.5 million of turnaround expenses for the year ended December 31, 2014. The first phase of its current turnaround was completed in mid-November 2015 at a total cost of approximately $101.5 million. The second phase is scheduled to begin in late February 2016 at a total estimated cost of approximately $35.0 million to $38.0 million (of which approximately $0.7 million was incurred in the fourth quarter of 2015). The Wynnewood Refinery completed a turnaround in December 2012. During the outage at the Wynnewood refinery in the fourth quarter of 2014 as discussed further below, the petroleum business accelerated certain planned turnaround activities and incurred approximately $1.3 million of turnaround expenses for the year ended December 31, 2014. The next turnaround for the Wynnewood refinery is scheduled to occur in the spring of 2017.
During the third quarter of 2013, the fluid catalytic cracking unit ("FCCU") at the Coffeyville refinery was offline for approximately 55 days for necessary repairs. As a result of the FCCU outage, crude throughput and production at the Coffeyville refinery was significantly reduced during the third quarter of 2013. Additionally, the Refining Partnership incurred approximately $21.1 million in costs to repair the FCCU for the year ended December 31, 2013. These costs are included in direct operating expenses (exclusive of depreciation and amortization) in the Consolidated Statements of Operations.
On July 29, 2014, the Coffeyville refinery experienced a fire at its isomerization unit. Four employees were injured in the fire, including one employee who was fatally injured. The fire was extinguished, and the refinery was subsequently shut down due to a failure of its plant-wide Distributed Control System, which was directly caused by the fire. The Coffeyville refinery returned to operations in mid-August, with all units except the isomerization unit in operation by August 23, 2014. The isomerization unit started operating on October 12, 2014. This interruption adversely impacted production of refined products for the petroleum business in the third quarter of 2014. Total gross repair and other costs recorded related to the incident for the year ended December 31, 2014 were approximately $6.3 million.
The Refining Partnership is covered by property damage insurance policies at the time of the incident, which had an associated deductible of $5.0 million for the Coffeyville refinery. The Refining Partnership anticipates amounts in excess of the $5.0 million deductible related to the isomerization unit fire incident will be recoverable under the property insurance policies. As of December 31, 2015 and 2014, the Refining Partnership had an insurance receivable related to the incident of approximately $1.2 million and $1.3 million, respectively, which is included in prepaid expenses and other current assets in the Consolidated Balance Sheets. The recording of the receivable resulted in a reduction of direct operating expenses (exclusive of depreciation and amortization).
During the fourth quarter of 2014, the FCCU at the Wynnewood refinery was offline for approximately 16 days for necessary repairs. As a result of the FCCU outage, crude throughput and production at the Wynnewood refinery was significantly reduced during the fourth quarter of 2014. Additionally, the Refining Partnership incurred approximately $8.5
59
million in costs to repair the FCCU for the year ended December 31, 2014. These costs are included in direct operating expenses (exclusive of depreciation and amortization) in the Consolidated Statements of Operations.
Nitrogen Fertilizer Business
In the nitrogen fertilizer business, earnings and cash flows from operations are primarily affected by the relationship between nitrogen fertilizer product prices, on-stream factors and direct operating expenses. Natural gas is the most significant raw material required in its competitors' production of nitrogen fertilizer. Unlike its competitors, the nitrogen fertilizer business does not use natural gas as a feedstock and uses a minimal amount of natural gas as an energy source in its operations. Instead, the adjacent Coffeyville refinery supplies the nitrogen fertilizer business with most of the pet coke feedstock it needs pursuant to a 20-year pet coke supply agreement entered into in October 2007. The price at which nitrogen fertilizer products are ultimately sold depends on numerous factors, including the global supply and demand for nitrogen fertilizer products which, in turn, depends on, among other factors, world grain demand and production levels, changes in world population, the cost and availability of fertilizer transportation infrastructure, weather conditions, the availability of imports, and the extent of government intervention in agriculture markets.
Nitrogen fertilizer prices are also affected by local factors, including local market conditions and the operating levels of competing facilities. An expansion or upgrade of competitors' facilities, political and economic developments and other factors are likely to continue to play an important role in nitrogen fertilizer industry economics. These factors can impact, among other things, the level of inventories in the market, resulting in price volatility and a reduction in product margins. Moreover, the industry typically experiences seasonal fluctuations in demand for nitrogen fertilizer products.
As a result of a favorable global demand environment for grains, nitrogen fertilizer prices rose to near historic levels beginning in 2011. In addition, North American producers began to benefit from lower natural gas prices due to the significant increase in shale basin and other non-conventional production in the region. The combination of higher nitrogen fertilizer prices globally and a feedstock cost advantage led to high margins for North American nitrogen fertilizer producers. This resulted in numerous announcements for expansion plans for existing plants as well as new facility development in the corn belt and the gulf coast. The majority of the additional supply from this expansion phase in North America is expected to come online in 2016. The nitrogen fertilizer business expects product pricing may experience volatility as the new supply displaces imports into the gulf coast and corn belt. However, over the longer-term the U.S. is expected to remain a net importer of nitrogen fertilizer with domestic prices influenced by the higher cost of imported tons into the U.S.
Since mid-2013, global nitrogen fertilizer prices have trended down as global grain supply increased and growth in grain demand slowed due to more challenging worldwide economic considerations. During 2015, there were announced transactions for further consolidation in the North American nitrogen fertilizer market, including the nitrogen fertilizer business' definitive merger agreement under which it will acquire all outstanding units of Rentech Nitrogen. Refer to Part II, Item 8, Note 1 ("Organization and History of the Company") of this Report for further discussion of the mergers.
While there is risk of short-term volatility given the inherent nature of the commodity cycle, the longer-term fundamentals for the U.S. nitrogen fertilizer industry remain intact. The nitrogen fertilizer business views the anticipated combination of (i) increasing global population, (ii) decreasing arable land per capita, (iii) continued evolution to more protein-based diets in developing countries, (iv) sustained use of corn as feedstock for the domestic production of ethanol and (v) positioning at the lower end of the global cost curve will continue to provide a solid foundation for nitrogen fertilizer producers in the U.S.
In order to assess the operating performance of the nitrogen fertilizer business, the nitrogen fertilizer business calculates the product pricing at gate as an input to determine its operating margin. Product pricing at gate represents net sales less freight revenue divided by product sales volume in tons. The nitrogen fertilizer business believes product pricing at gate is a meaningful measure because it sells products at its plant gate and terminal locations' gates (sold gate) and delivered to the customer's designated delivery site (sold delivered). The relative percentage of sold gate versus sold delivered can change period to period. The product pricing at gate provides a measure that is consistently comparable period to period.
The nitrogen fertilizer business and other competitors in the U.S. farm belt share a significant transportation cost advantage when compared to out-of-region competitors in serving the U.S. farm belt agricultural market; therefore, the nitrogen fertilizer business is able to cost-effectively sell substantially all of its products in the higher margin agricultural market. Further, the nitrogen fertilizer business believes that a significant portion of its competitors' revenues are derived from the lower margin industrial market. The nitrogen fertilizer business' products leave the plant either in railcars for destinations located principally on the Union Pacific Railroad or in trucks for direct shipment to customers. The nitrogen fertilizer business does not currently incur significant intermediate transfer, storage, barge freight or pipeline freight charges; however, it does incur costs to maintain
60
and repair its railcar fleet. Selling products to customers within economic rail transportation limits of the nitrogen fertilizer plant and keeping transportation costs low are keys to maintaining profitability.
As a result of the UAN expansion project completed in 2013, the nitrogen fertilizer business will continue to upgrade substantially all of its ammonia production into UAN for as long as it makes economic sense to do so. The value of nitrogen fertilizer products is also an important consideration in understanding the nitrogen fertilizer business' results. For the years ended December 31, 2015, 2014 and 2013, the nitrogen fertilizer business upgraded approximately 96%, 97% and 95%, respectively, of its ammonia production into UAN, a product that presently generates greater profit than ammonia.
The high fixed cost of the nitrogen fertilizer business' direct operating expense structure also directly affects its profitability. Using a pet coke gasification process, the nitrogen fertilizer business has a significantly higher percentage of fixed costs than a natural gas-based fertilizer plant. Major fixed operating expenses include a large portion of electrical energy, employee labor, maintenance, including contract labor, and outside services. The nitrogen fertilizer business estimates fixed costs averaged approximately 80% of direct operating expenses over the 24 months ended December 31, 2015.
The nitrogen fertilizer business' largest raw material expense used in the production of ammonia is pet coke, which it purchases from the petroleum business and third parties. For the years ended December 31, 2015, 2014 and 2013, the nitrogen fertilizer business incurred approximately $11.9 million, $13.6 million and $14.6 million, respectively, for pet coke, which equaled an average cost per ton of $25, $28 and $30, respectively.
The nitrogen fertilizer business obtains most (over 70% on average during the last five years) of the pet coke it needs from the adjacent Coffeyville crude oil refinery pursuant to the pet coke supply agreement, and procures the remainder on the open market. The price the nitrogen fertilizer business pays pursuant to the pet coke supply agreement is based on the lesser of a pet coke price derived from the price received for UAN (the "UAN-based price") or a pet coke price index. The UAN-based price begins with a pet coke price of $25 per ton based on a price per ton for UAN that excludes transportation cost ("netback price") of $205 per ton, and adjusts up or down $0.50 per ton for every $1.00 change in the netback price. The UAN-based price has a ceiling of $40 per ton and a floor of $5 per ton.
Safe and reliable operations at the nitrogen fertilizer plant are critical to its financial performance and results of operations. Unplanned downtime of the nitrogen fertilizer plant may result in lost margin opportunity, increased maintenance expense and a temporary increase in working capital investment and related inventory position. The financial impact of planned downtime, such as major turnaround maintenance, is mitigated through a diligent planning process that takes into account margin environment, the availability of resources to perform the needed maintenance, feedstock logistics and other factors. The nitrogen fertilizer plant generally undergoes a full facility turnaround every two to three years. Turnarounds are expected to last 14-21 days. A less involved facility shutdown was performed during the second quarter of 2014 and included both the installation of a waste heat boiler and the completion of several key tasks in order to upgrade the pressure swing adsorption ("PSA") unit. The Nitrogen Fertilizer Partnership underwent a full facility turnaround in the third quarter of 2015, and the gasification, ammonia and UAN units were down for between 17 to 20 days each at a cost, exclusive of the impacts due to the lost production during the downtime, of approximately $7.0 million for the year ended December 31, 2015, respectively. The Nitrogen Fertilizer Partnership is planning to undergo the next scheduled full facility turnaround in the second half of 2017.
Agreements With the Refining Partnership and the Nitrogen Fertilizer Partnership
We are party to several agreements with the Nitrogen Fertilizer Partnership that govern the business relations among the Nitrogen Fertilizer Partnership and its affiliates on the one hand and us and our other affiliates on the other hand. In connection with the Refining Partnership IPO in January 2013, some of our subsidiaries party to these agreements became subsidiaries of the Refining Partnership.
These intercompany agreements include (i) the pet coke supply agreement mentioned above, under which the petroleum business sells pet coke to the nitrogen fertilizer business; (ii) a services agreement, pursuant to which our management operates the nitrogen fertilizer business; (iii) a feedstock and shared services agreement, which governs the provision of feedstocks, including, but not limited to, hydrogen, high-pressure steam, nitrogen, instrument air, oxygen and natural gas; (iv) a raw water and facilities sharing agreement, which allocates raw water resources between the two businesses; (v) an easement agreement; (vi) an environmental agreement; and (vii) a lease agreement pursuant to which the petroleum business leases office space and laboratory space to the Nitrogen Fertilizer Partnership. These agreements were not the result of arm's-length negotiations and the terms of these agreements are not necessarily at least as favorable to the parties to these agreements as terms which could have been obtained from unaffiliated third parties.
61
In connection with the Refining Partnership IPO, we entered into a number of agreements with the Refining Partnership, including (i) a $250.0 million intercompany credit facility between CRLLC and the Refining Partnership and (ii) a services agreement, pursuant to which our management operates the petroleum business.
Simultaneously with the execution of the Merger Agreement discussed in Part II, Item 8, Note 1 ("Organization and History of the Company") of this Report, the Nitrogen Fertilizer Partnership entered into a commitment letter (the "commitment letter") with CRLLC. Refer to Part II, Item 7, "Liquidity and Capital Resources" of this Report for further discussion of the commitment letter.
On February 9, 2016, CRLLC and the Nitrogen Fertilizer Partnership entered into a guaranty, pursuant to which CRLLC agreed to guaranty the indebtedness outstanding under the Nitrogen Fertilizer Partnership's credit facility. Refer to Part II, Item 7, "Liquidity and Capital Resources" of this Report for further discussion of the guaranty terms.
Crude Oil Supply Agreement
On August 31, 2012, Coffeyville Resources Refining and Marketing, LLC ("CRRM") and Vitol Inc. ("Vitol") entered into an Amended and Restated Crude Oil Supply Agreement (as amended, the "Vitol Agreement"). Under the Vitol Agreement, Vitol supplies the petroleum business with crude oil and intermediation logistics, which helps the petroleum business to reduce its inventory position and mitigate crude oil pricing risk. The Vitol Agreement will automatically renew for successive one-year terms (each such term, a "Renewal Term") unless either party provides the other with notice of nonrenewal at least 180 days prior to expiration of any Renewal Term. The Vitol Agreement currently extends through December 31, 2016.
Factors Affecting Comparability
Our historical results of operations for the periods presented may not be comparable with prior periods or to our results of operations in the future for the reasons presented and discussed below.
Year Ended December 31, | ||||||||||||
2015 | 2014 | 2013 | ||||||||||
(in millions) | ||||||||||||
Loss on extinguishment of debt(1) | $ | — | $ | — | $ | 26.1 | ||||||
Share-based compensation(2) | 12.8 | 12.3 | 18.4 | |||||||||
(Gain) loss on derivatives, net | 28.6 | (185.6 | ) | (57.1 | ) | |||||||
Major scheduled turnaround expenses(3) | 109.2 | 6.8 | — | |||||||||
Flood insurance recovery(4) | (27.3 | ) | — | — | ||||||||
_______________________________________
(1) | Represents the write-off of previously deferred financing costs, unamortized original issue discount and the premium paid related to the extinguishment of the 10.875% Second Lien Senior Secured Notes due 2017 (the "Old Second Lien Notes"). |
(2) | Represents impact of share-based compensation awards. |
(3) | Represents expense associated with major scheduled turnaround activities performed at the Coffeyville refinery ($102.2 million in 2015 and $5.5 million in 2014), the Wynnewood refinery ($1.3 million in 2014) and the nitrogen fertilizer plant ($7.0 million in 2015). |
(4) | Represents an insurance recovery from CRRM's environmental insurance carriers as a result of the flood and crude oil discharge at the Coffeyville refinery on June/July 2007. Refer to Part II, Item 8, Note 13 ("Commitments and Contingencies") of this Report for further details. |
Noncontrolling Interest
Prior to the Refining Partnership IPO on January 23, 2013, the noncontrolling interest reflected in our consolidated financial statements represented the approximately 30% interest in the Nitrogen Fertilizer Partnership held by public common unitholders, which was adjusted each reporting period for the noncontrolling ownership percentage of the Nitrogen Fertilizer Partnership's net income and related distributions. As a result of the Refining Partnership IPO, CVR Energy recorded an additional noncontrolling interest for the Refining Partnership common units sold to the public, which represented an
62
approximately 19% interest of the Refining Partnership. Effective with the Refining Partnership's IPO, the noncontrolling interest reflected on the Consolidated Balance Sheets was impacted additionally by the noncontrolling ownership percentage of the net income of the Refining Partnership and related distributions for each future reporting period. As a result of the Refining Partnership's closing of the Underwritten Offering, the noncontrolling interest related to the Refining Partnership reflected in our consolidated financial statements subsequent to the completion of the offering in the second quarter of 2013 and prior to June 30, 2014 was approximately 29%. Upon completion of the Second Underwritten Offering on June 30, 2014 and through July 23, 2014, the non-controlling interest reflected in our consolidated financial statements was approximately 33%. On July 24, 2014, upon exercise of the underwriters' option associated with the Second Underwritten Offering, the noncontrolling interest reflected in our consolidated financial statements is approximately 34%. Additionally, as a result of the Nitrogen Fertilizer Partnership's Secondary Offering, the noncontrolling interest related to the Nitrogen Fertilizer Partnership reflected in our consolidated financial statements subsequent to the completion of the Secondary Offering on May 28, 2013 and as of December 31, 2015 is approximately 47%.
The revenue and expenses from the Refining Partnership and Nitrogen Fertilizer Partnership are consolidated with CVR Energy's Consolidated Statements of Operations because each of the general partners is owned by CVR Refining Holdings and CRLLC, respectively, wholly-owned subsidiaries of CVR Energy. Therefore, CVR Energy has the ability to control the activities of the Refining Partnership and Nitrogen Fertilizer Partnership. However, the percentage of ownership held by the public unitholders for the Refining Partnership and the Nitrogen Fertilizer Partnership is reflected as net income attributable to noncontrolling interest in our Consolidated Statements of Operations and reduces consolidated net income to derive net income attributable to CVR Energy.
Distributions to CVR Partners Unitholders
Refer to Part II, Item 5, "CVR Partners, LP Cash Distribution Policy," of this Report for a summary of CVR Partners' distribution policy and the cash distributions paid to the Nitrogen Fertilizer Partnership unitholders during the years ended December 31, 2015 and 2014.
Distributions to CVR Refining Unitholders
Refer to Part II, Item 5, "CVR Refining, LP Cash Distribution Policy," of this Report for a summary of CVR Refining's distribution policy and the cash distributions paid to the Refining Partnership unitholders during the years ended December 31, 2015 and 2014.
CVR Energy Dividends
Refer to Part II, Item 5, "CVR Energy, Inc. Dividend Policy," of this Report for a summary of our dividend policy and the cash dividends paid to our stockholders during the years ended December 31, 2015 and 2014.
Industry Factors
Petroleum Business
Earnings for the petroleum business depend largely on its refining margins, which have been and continue to be volatile. Refining margins are impacted primarily by the relationship or spread between crude oil and refined product prices. The petroleum business' refineries reside in the Group 3 marketing region and are supplied with advantaged domestic and Canadian crudes.
Crude oil discounts are a major contributor to the petroleum business earnings. Canadian heavy sour crude oil production continues to grow and with limited export capacity provides an advantaged crude to the mid-continent refiners. As a result of an expansion project, the petroleum business increased its ability to process higher volumes of heavy sour crude oil and take advantage of this opportunity.
Additionally, the relationship between current spot prices and future prices can impact profitability. As such, the petroleum business believes that its approximately 7.0 million barrels of crude oil storage in Cushing, Oklahoma and other locations allows it to take advantage of the contango market when such conditions exist. Contango markets are generally characterized by prices for future delivery that are higher than the current, or spot, price of a commodity. This condition provides economic incentive to hold or carry a commodity in inventory.
63
Nitrogen Fertilizer Business
Global demand for fertilizers is driven primarily by population growth, dietary changes in the developing world and increased consumption of bio-fuels. According to the International Fertilizer Industry Association, from 1973 to 2013, global fertilizer demand grew 1.9% annually. Fertilizer use is projected to increase by 45% between 2005 and 2030 to meet global food demand according to a study funded by the Food and Agricultural Organization of the United Nations. Currently, the developed world uses fertilizer more intensively than the developing world, but sustained economic growth in emerging markets is increasing food demand and fertilizer use. As an example, China's wheat and coarse grains production increased 51% between 2005 and 2015, but still failed to keep pace with increases in demand, prompting China to grow its grain imports by more than 200% over the same period, according to the United States Department of Agriculture ("USDA").
World grain demand increased 9%, from 2012 to 2015, according to the USDA, leading to a tighter grain supply environment and significant increases in grain prices that is supportive of fertilizer prices.
Nitrogen fertilizer prices have decoupled from their historical correlation with natural gas prices and are now driven primarily by demand dynamics. At existing grain prices and prices implied by futures markets, farmers are expected to generate profits leading to relatively inelastic demand for fertilizers.
The United States is the world's largest exporter of coarse grains, accounting for 33% of world exports and 29% of world production during the 2014-2015 marketing year, according to the USDA. Fertecon estimates the United States is the world's third largest consumer of nitrogen fertilizer and historically the world's first or second largest importer of nitrogen fertilizer, importing approximately 42% of its nitrogen fertilizer needs during the 2014-2015 marketing year. North American producers have a significant and sustainable cost advantage over the majority of producers that export to the U.S. market.
The three primary forms of nitrogen fertilizer used in the U.S. are ammonia, urea and UAN. Unlike ammonia and urea, UAN can be applied throughout the growing season and can be applied in tandem with pesticides and herbicides, providing farmers with flexibility and cost savings. As a result of these factors, UAN typically commands a premium price to urea and ammonia, on a nitrogen equivalent basis.
64
Results of Operations
In this "Results of Operations" section, we first review our business on a consolidated basis, and then separately review the results of operations of each of our petroleum and nitrogen fertilizer businesses on a standalone basis.
Consolidated Results of Operations
The period to period comparisons of our results of operations have been prepared using the historical periods included in our consolidated financial statements. This "Results of Operations" section compares the year ended December 31, 2015 with the year ended December 31, 2014 and the year ended December 31, 2014 with the year ended December 31, 2013.
Net sales consist principally of sales of refined fuel and nitrogen fertilizer products. For the petroleum business, net sales are mainly affected by crude oil and refined product prices, changes to the input mix and volume changes caused by operations. Product mix refers to the percentage of production represented by higher value light products, such as gasoline, rather than lower value finished products, such as pet coke. In the nitrogen fertilizer business, net sales are primarily impacted by manufactured tons and nitrogen fertilizer prices.
Industry-wide petroleum results are driven and measured by the relationship, or margin, between refined products and the prices for crude oil referred to as crack spreads. See " — Major Influences on Results of Operations." We discuss the results of the petroleum business in the context of per barrel consumed crack spreads and the relationship between net sales and cost of product sold.
Our consolidated results of operations include certain other unallocated corporate activities and the elimination of intercompany transactions and therefore do not equal the sum of the operating results of the petroleum and nitrogen fertilizer businesses.
65
The following table provides an overview of our results of operations during the past three fiscal years:
Year Ended December 31, | |||||||||||
2015 | 2014 | 2013 | |||||||||
(in millions, except per share data) | |||||||||||
Statements of Operations Data | |||||||||||
Net sales | $ | 5,432.5 | $ | 9,109.5 | $ | 8,985.8 | |||||
Cost of product sold(1) | 4,190.4 | 8,066.0 | 7,563.2 | ||||||||
Direct operating expenses(1) | 584.7 | 515.1 | 455.8 | ||||||||
Flood insurance recovery | (27.3 | ) | — | — | |||||||
Selling, general and administrative expenses(1) | 99.0 | 109.7 | 113.5 | ||||||||
Depreciation and amortization | 164.1 | 154.4 | 142.8 | ||||||||
Operating income | 421.6 | 264.3 | 710.5 | ||||||||
Interest expense and other financing costs | (48.4 | ) | (40.0 | ) | (50.5 | ) | |||||
Interest income | 1.0 | 0.9 | 1.2 | ||||||||
Gain (loss) on derivatives, net | (28.6 | ) | 185.6 | 57.1 | |||||||
Loss on extinguishment of debt | — | — | (26.1 | ) | |||||||
Other income (expense), net | 36.7 | (3.7 | ) | 13.5 | |||||||
Income before income tax expense | 382.3 | 407.1 | 705.7 | ||||||||
Income tax expense | 84.5 | 97.7 | 183.7 | ||||||||
Net income | 297.8 | 309.4 | 522.0 | ||||||||
Less: Net income attributable to noncontrolling interest | 128.2 | 135.5 | 151.3 | ||||||||
Net income attributable to CVR Energy stockholders | $ | 169.6 | $ | 173.9 | $ | 370.7 | |||||
Basic earnings per share | $ | 1.95 | $ | 2.00 | $ | 4.27 | |||||
Diluted earnings per share | $ | 1.95 | $ | 2.00 | $ | 4.27 | |||||
Dividends declared per share | $ | 2.00 | $ | 5.00 | $ | 14.25 | |||||
Adjusted EBITDA(2) | $ | 498.8 | $ | 473.5 | $ | 659.7 | |||||
Weighted-average common shares outstanding: | |||||||||||
Basic | 86.8 | 86.8 | 86.8 | ||||||||
Diluted | 86.8 | 86.8 | 86.8 | ||||||||
_______________________________________
(1) | Amounts are shown exclusive of depreciation and amortization. |
Depreciation and amortization is comprised of the following components as excluded from cost of product sold, direct operating expense and selling, general and administrative expense:
Year Ended December 31, | |||||||||||
2015 | 2014 | 2013 | |||||||||
(in millions) | |||||||||||
Depreciation and amortization excluded from cost of product sold | $ | 6.7 | $ | 6.3 | $ | 5.0 | |||||
Depreciation and amortization excluded from direct operating expenses | 149.7 | 141.8 | 134.5 | ||||||||
Depreciation and amortization excluded from selling, general and administrative expense | 7.7 | 6.3 | 3.3 | ||||||||
Total depreciation and amortization | $ | 164.1 | $ | 154.4 | $ | 142.8 | |||||
66
(2) | EBITDA and Adjusted EBITDA. EBITDA represents net income before (i) interest expense and other financing costs, net of interest income, (ii) income tax expense and (iii) depreciation and amortization. Adjusted EBITDA represents EBITDA adjusted for (i) FIFO impact (favorable) unfavorable, (ii) share-based compensation, (iii) loss on extinguishment of debt, (iv) major scheduled turnaround expenses, (v) gain (loss) on derivatives, net, (vi) current period settlements on derivative contracts, (vii) flood insurance recovery and (viii) expenses associated with the pending Rentech Nitrogen mergers. EBITDA and Adjusted EBITDA are not recognized terms under GAAP and should not be substituted for net income or cash flow from operations. Management believes that EBITDA and Adjusted EBITDA enable investors to better understand and evaluate our ongoing operating results and allows for greater transparency in reviewing our overall financial, operational and economic performance. EBITDA and Adjusted EBITDA presented by other companies may not be comparable to our presentation, since each company may define these terms differently. Below is a reconciliation of net income to EBITDA and EBITDA to Adjusted EBITDA for the years ended December 31, 2015, 2014 and 2013: |
Year Ended December 31, | |||||||||||
2015 | 2014 | 2013 | |||||||||
(in millions) | |||||||||||
(unaudited) | |||||||||||
Net income attributable to CVR Energy stockholders | $ | 169.6 | $ | 173.9 | $ | 370.7 | |||||
Add: | |||||||||||
Interest expense and other financing costs, net of interest income | 47.4 | 39.1 | 49.3 | ||||||||
Income tax expense | 84.5 | 97.7 | 183.7 | ||||||||
Depreciation and amortization | 164.1 | 154.4 | 142.8 | ||||||||
EBITDA adjustments included in noncontrolling interest | (75.2 | ) | (65.2 | ) | (50.1 | ) | |||||
EBITDA | 390.4 | 399.9 | 696.4 | ||||||||
Add: | |||||||||||
FIFO impact (favorable) unfavorable | 60.3 | 160.8 | (21.3 | ) | |||||||
Share-based compensation | 12.8 | 12.3 | 18.4 | ||||||||
Loss on extinguishment of debt | — | — | 26.1 | ||||||||
Major scheduled turnaround expenses | 109.2 | 6.8 | — | ||||||||
(Gain) loss on derivatives, net | 28.6 | (185.6 | ) | (57.1 | ) | ||||||
Current period settlement on derivative contracts(a) | (26.0 | ) | 122.2 | 6.4 | |||||||
Flood insurance recovery(b) | (27.3 | ) | — | — | |||||||
Expenses associated with the Rentech Nitrogen mergers(c) | 2.3 | — | — | ||||||||
Adjustments included in noncontrolling interest | (51.5 | ) | (42.9 | ) | (9.2 | ) | |||||
Adjusted EBITDA | $ | 498.8 | $ | 473.5 | $ | 659.7 | |||||
_______________________________________
(a) | Represents the portion of gain (loss) on derivatives, net related to contracts that matured during the respective periods and settled with counterparties. There are no premiums paid or received at inception of the derivative contracts and upon settlement, there is no cost recovery associated with these contracts. |
(b) | Represents an insurance recovery from CRRM's environmental insurance carriers as a result of the flood and crude oil discharge at the Coffeyville refinery on June/July 2007. Refer to Part II, Item 8, Note 13 ("Commitments and Contingencies") of this Report for further details. |
(c) | Represents legal and other professional fees and other merger-related expenses incurred by the Nitrogen Fertilizer Partnership in regards to the pending Rentech Nitrogen mergers. Refer to Part II, Item 8, Note 1 ("Organization and History of the Company") of this Report for further details. |
67
Year Ended December 31, 2015 Compared to the Year Ended December 31, 2014 (Consolidated)
Net Sales. Consolidated net sales were $5,432.5 million for the year ended December 31, 2015, compared to $9,109.5 million for the year ended December 31, 2014. The decrease of $3,677.0 million was largely the result of a decrease in our petroleum segment's net sales of $3,667.8 million due to significantly lower sales prices. The petroleum segment's average sales price per gallon for the year ended December 31, 2015 of $1.61 for gasoline and $1.62 for distillate decreased by 36.4% and 42.3%, respectively, as compared to the year ended December 31, 2014. The nitrogen fertilizer segment net sales decreased by $9.5 million due to lower UAN sales prices and volumes, partially offset by higher ammonia sales volumes.
Cost of Product Sold (Exclusive of Depreciation and Amortization). Consolidated cost of product sold (exclusive of depreciation and amortization) was $4,190.4 million for the year ended December 31, 2015, as compared to $8,066.0 million for the year ended December 31, 2014. The decrease of $3,875.6 million primarily resulted from a decrease of $3,869.8 million in cost of product sold at the petroleum segment. The decrease at the petroleum segment was due to a decrease in the cost of consumed crude and purchased products for resale. The decrease in consumed crude oil costs was due to a 47.5% decrease in crude oil prices. The nitrogen fertilizer segment cost of product sold (exclusive of depreciation and amortization) also decreased by $6.8 million primarily as a result of lower freight and distribution costs and lower consumption and lower pricing of pet coke.
Direct Operating Expenses (Exclusive of Depreciation and Amortization). Consolidated direct operating expenses (exclusive of depreciation and amortization) were $584.7 million for the year ended December 31, 2015, as compared to $515.1 million for the year ended December 31, 2014. The increase of $69.6 million was primarily due to an increase of $62.5 million at the petroleum segment as a result of the major scheduled turnaround activities performed at the Coffeyville refinery, partially offset by decreases in repair and maintenance and energy and utility costs. The nitrogen fertilizer segment also had an increase in direct operating expenses (exclusive of depreciation and amortization), which was primarily the result of higher major scheduled turnaround expenses.
Selling, General and Administrative Expenses (Exclusive of Depreciation and Amortization). Consolidated selling, general and administrative expenses (exclusive of depreciation and amortization) were $99.0 million for the year ended December 31, 2015, as compared to $109.7 million for the year ended December 31, 2014. The decrease of $10.7 million was primarily the result of lower legal expenses, IT-related costs and consulting costs, partially offset by higher personnel costs.
Operating Income. Consolidated operating income was $421.6 million for the year ended December 31, 2015, as compared to operating income of $264.3 million for the year ended December 31, 2014, an increase of $157.3 million. Petroleum segment operating income increased $154.5 million primarily due to higher refining margins and the flood insurance recovery, partially offset by increased direct operating expenses. Nitrogen fertilizer segment operating income decreased $14.1 million primarily as a result of lower net sales and higher direct operating expenses, partially offset by lower cost of product sold.
Interest Expense. Consolidated interest expense for the year ended December 31, 2015 was $48.4 million as compared to $40.0 million for the year ended December 31, 2014. The increase of $8.4 million resulted primarily from lower capitalized interest for the year ended December 31, 2015 as compared to the year ended December 31, 2014, following the completion of several larger capital projects in late 2014.
Gain (Loss) on Derivatives, Net. For the year ended December 31, 2015, the petroleum segment recorded a $28.6 million net loss on derivatives compared to a $185.6 million net gain on derivatives for the year ended December 31, 2014. This change was primarily due to changes in crack spreads during the period. The petroleum segment enters into over-the-counter commodity swap contracts to fix the margin on a portion of its future gasoline and distillate production.
Income Tax Expense. Income tax expense for the year ended December 31, 2015 was $84.5 million or 22.1% of income before income taxes, as compared to income tax expense for the year ended December 31, 2014 of $97.7 million or 24.0% of income before income taxes. This is in comparison to a combined federal and state expected statutory rate of 39.5% for 2015 and 39.6% for 2014. Our 2015 effective tax rate is lower than the expected statutory rate primarily due to the reduction of income subject to tax associated with the noncontrolling ownership interests in CVR Refining's and CVR Partners' earnings and the benefits related to the domestic production activities deduction and state income tax credits.
Net Income Attributable to Noncontrolling Interest. Net income attributable to noncontrolling interest represents the 47% interest in the Nitrogen Fertilizer Partnership held by public unitholders as of and for the years ended December 31, 2015 and 2014. Additionally, it represents the 34% interest in the Refining Partnership held by public unitholders from July 24, 2014
68
through December 31, 2015, the 33% interest held by public unitholders from June 30, 2014 through July 23, 2014 and the 29% interest held by public unitholders from May 20, 2013 through June 29, 2014.
Net Income Attributable to CVR Stockholders. For the year ended December 31, 2015, net income attributable to CVR stockholders decreased to $169.6 million as compared to net income of $173.9 million for the year ended December 31, 2014.
Year Ended December 31, 2014 Compared to the Year Ended December 31, 2013 (Consolidated)
Net Sales. Consolidated net sales were $9,109.5 million for the year ended December 31, 2014, compared to $8,985.8 million for the year ended December 31, 2013. The increase of $123.7 million was primarily the result of an increase in petroleum net sales of $146.2 million due to higher overall sales volumes largely offset by lower sales prices for gasoline and distillates. The petroleum segment's average sales price per gallon for the year ended December 31, 2014 of $2.53 for gasoline and $2.81 for distillates each decreased by 7.0%, as compared to the year ended December 31, 2013. The nitrogen fertilizer segment net sales decreased by $25.0 million due to lower UAN sales prices and lower ammonia sales volumes, partially offset by high UAN sales volumes.
Cost of Product Sold (Exclusive of Depreciation and Amortization). Consolidated cost of product sold (exclusive of depreciation and amortization) was $8,066.0 million for the year ended December 31, 2014, as compared to $7,563.2 million for the year ended December 31, 2013. The increase of $502.8 million primarily resulted from an increase of $486.7 million in cost of product sold at the petroleum segment. The increase at the petroleum segment was due to increases in the cost of consumed crude oil and higher refined fuels purchased for resale. The increase in consumed crude costs was due to higher consumed volumes, partially offset by lower crude oil prices. The nitrogen fertilizer segment cost of product sold (exclusive of depreciation and amortization) also increased $13.9 million primarily as a result of increased distribution costs due to increased railcar regulatory inspections and repairs and increased ammonia purchases.
Direct Operating Expenses (Exclusive of Depreciation and Amortization). Consolidated direct operating expenses (exclusive of depreciation and amortization) were $515.1 million for the year ended December 31, 2014, as compared to $455.8 million for the year ended December 31, 2013. The increase of $59.3 million was primarily due to an increase at the petroleum segment for expenses related to energy and utility costs, repairs and maintenance and labor. The nitrogen fertilizer segment also had an increase in direct operating expenses (exclusive of depreciation and amortization), which was primarily the result of higher energy and utility costs and refractory brick amortization.
Selling, General and Administrative Expenses (Exclusive of Depreciation and Amortization). Consolidated selling, general and administrative expenses (exclusive of depreciation and amortization) were $109.7 million for the year ended December 31, 2014, as compared to $113.5 million for the year ended December 31, 2013. The decrease of $3.8 million was primarily the result of lower share-based compensation and personnel costs, IT-related costs and consulting, partially offset by higher legal costs.
Operating Income. Consolidated operating income was $264.3 million for the year ended December 31, 2014, as compared to operating income of $710.5 million for the year ended December 31, 2013, a decrease of $446.2 million. Petroleum segment operating income decreased $395.8 million primarily due to lower refining margins and higher direct operating expenses. Nitrogen fertilizer segment operating income decreased $42.1 million primarily as a result of lower net sales and higher cost of product sold.
Interest Expense. Consolidated interest expense for the year ended December 31, 2014 was $40.0 million as compared to $50.5 million for the year ended December 31, 2013. The decrease of $10.5 million resulted primarily from interest expense on the outstanding 2022 Notes (as defined below) for the year ended December 31, 2014 as compared to interest expense for the year ended December 31, 2013 related to both the Second Lien Notes (prior to their extinguishment in the first quarter of 2013) and the 2022 Notes and higher capitalized interest for the year ended December 31, 2014.
Gain on Derivatives, Net. For the year ended December 31, 2014, the petroleum segment recorded a $185.6 million net gain on derivatives compared to a $57.1 million net gain on derivatives for the year ended December 31, 2013. This change was primarily due to changes in crack spreads during the period. The petroleum segment enters into over-the-counter commodity swap contracts to fix the margin on a portion of its future gasoline and distillate production.
Loss on Extinguishment of Debt. For the year ended December 31, 2013, the petroleum segment incurred a $26.1 million loss on extinguishment of debt. The loss on extinguishment of debt was the result of the extinguishment of the Second Lien Notes and included amounts related to the premium paid, the write-off of previously deferred financing costs and the write-off of the unamortized original issue discount.
69
Income Tax Expense. Income tax expense for the year ended December 31, 2014 was $97.7 million or 24.0% of income before income taxes, as compared to income tax expense for the year ended December 31, 2013 of $183.7 million or 26.0% of income before income taxes. This is in comparison to a combined federal and state expected statutory rate of 39.6% for both 2014 and 2013. Our 2014 effective tax rate is lower than the expected statutory rate primarily due to the reduction of income subject to tax associated with our noncontrolling ownership interest in CVR Refining's and CVR Partners' earnings and the benefits related to the domestic production activities deduction and state income tax credits.
Net Income Attributable to Noncontrolling Interest. Net income attributable to noncontrolling interest represents the 47% interest in the Nitrogen Fertilizer Partnership held by public unitholders from May 28, 2013 through December 31, 2014. Prior to May 28, 2013, public unitholders held a 30% interest in the Nitrogen Fertilizer Partnership. Additionally, it represents the 34% interest in the Refining Partnership held by public unitholders from July 24, 2014 through December 31, 2014, the 33% interest held by public unitholders from June 30, 2014 through July 23, 2014, the 29% interest held by public unitholders from May 20, 2013 through June 29, 2014 and the 19% interest held by public unitholders from the Refining Partnership IPO through May 19, 2013.
Net Income Attributable to CVR Stockholders. For the year ended December 31, 2014, net income attributable to CVR stockholders decreased to $173.9 million as compared to net income of $370.7 million for the year ended December 31, 2013.
Petroleum Business Results of Operations
The petroleum business includes the operations of both the Coffeyville and Wynnewood refineries. The following tables below provide an overview of the petroleum business' results of operations, relevant market indicators and its key operating statistics for the years ended December 31, 2015, 2014 and 2013:
Year Ended December 31, | |||||||||||
2015 | 2014 | 2013 | |||||||||
(in millions) | |||||||||||
Consolidated Petroleum Business Financial Results | |||||||||||
Net sales | $ | 5,161.9 | $ | 8,829.7 | $ | 8,683.5 | |||||
Cost of product sold(1) | 4,143.6 | 8,013.4 | 7,526.7 | ||||||||
Direct operating expenses(1)(2) | 376.3 | 409.2 | 361.7 | ||||||||
Major scheduled turnaround expenses | 102.2 | 6.8 | — | ||||||||
Flood insurance recovery | (27.3 | ) | — | — | |||||||
Selling, general and administrative expenses(1) | 75.2 | 70.6 | 77.8 | ||||||||
Depreciation and amortization | 130.2 | 122.5 | 114.3 | ||||||||
Operating income | 361.7 | 207.2 | 603.0 | ||||||||
Interest expense and other financing costs | (42.6 | ) | (34.2 | ) | (44.1 | ) | |||||
Interest income | 0.4 | 0.3 | 0.4 | ||||||||
Gain (loss) on derivatives, net | (28.6 | ) | 185.6 | 57.1 | |||||||
Loss on extinguishment of debt | — | — | (26.1 | ) | |||||||
Other income (expense), net | 0.3 | (0.2 | ) | 0.1 | |||||||
Income before income tax expense | 291.2 | 358.7 | 590.4 | ||||||||
Income tax expense | — | — | — | ||||||||
Net income | $ | 291.2 | $ | 358.7 | $ | 590.4 | |||||
Gross profit(3) | $ | 436.9 | $ | 277.8 | $ | 680.8 | |||||
Refining margin(4) | $ | 1,018.3 | $ | 816.3 | $ | 1,156.8 | |||||
Adjusted Petroleum EBITDA(5) | $ | 602.0 | $ | 621.6 | $ | 712.0 | |||||
70
Year Ended December 31, | |||||||||||
2015 | 2014 | 2013 | |||||||||
(dollars per barrel) | |||||||||||
Key Operating Statistics | |||||||||||
Per crude oil throughput barrel: | |||||||||||
Refining margin(4) | $ | 14.45 | $ | 11.38 | $ | 16.90 | |||||
Gross profit(3) | $ | 6.20 | $ | 3.87 | $ | 9.94 | |||||
Direct operating expenses and major scheduled turnaround expenses(1)(2) | $ | 6.79 | $ | 5.80 | $ | 5.28 | |||||
Direct operating expenses and major scheduled turnaround expenses per barrel sold(1)(6) | $ | 6.40 | $ | 5.44 | $ | 5.00 | |||||
Barrels sold (barrels per day)(6) | 204,708 | 209,669 | 198,142 | ||||||||
Year Ended December 31, | |||||||||||||||||
2015 | 2014 | 2013 | |||||||||||||||
% | % | % | |||||||||||||||
Refining Throughput and Production Data (bpd) | |||||||||||||||||
Throughput: | |||||||||||||||||
Sweet | 176,097 | 86.0 | 179,059 | 86.2 | 149,147 | 75.4 | |||||||||||
Medium | 2,460 | 1.2 | 2,022 | 1.0 | 19,151 | 9.7 | |||||||||||
Heavy sour | 14,520 | 7.1 | 15,464 | 7.4 | 19,270 | 9.8 | |||||||||||
Total crude oil throughput | 193,077 | 94.3 | 196,545 | 94.6 | 187,568 | 94.9 | |||||||||||
All other feedstocks and blendstocks | 11,672 | 5.7 | 11,284 | 5.4 | 10,121 | 5.1 | |||||||||||
Total throughput | 204,749 | 100.0 | 207,829 | 100.0 | 197,689 | 100.0 | |||||||||||
Production: | |||||||||||||||||
Gasoline | 99,961 | 48.5 | 102,275 | 48.9 | 94,561 | 47.7 | |||||||||||
Distillate | 85,953 | 41.7 | 87,639 | 41.9 | 82,089 | 41.4 | |||||||||||
Other (excluding internally produced fuel) | 20,074 | 9.8 | 19,149 | 9.2 | 21,617 | 10.9 | |||||||||||
Total refining production (excluding internally produced fuel) | 205,988 | 100.0 | 209,063 | 100.0 | 198,267 | 100.0 | |||||||||||
Product price (dollars per gallon): | |||||||||||||||||
Gasoline | $ | 1.61 | $ | 2.53 | $ | 2.72 | |||||||||||
Distillate | 1.62 | 2.81 | 3.02 | ||||||||||||||
71
Year Ended December 31, | |||||||||||
2015 | 2014 | 2013 | |||||||||
Market Indicators (dollars per barrel) | |||||||||||
West Texas Intermediate (WTI) NYMEX | $ | 48.76 | $ | 92.91 | $ | 98.05 | |||||
Crude Oil Differentials: | |||||||||||
WTI less WTS (light/medium sour) | (0.28 | ) | 5.95 | 2.64 | |||||||
WTI less WCS (heavy sour) | 13.20 | 18.48 | 24.58 | ||||||||
NYMEX Crack Spreads: | |||||||||||
Gasoline | 19.89 | 17.29 | 21.44 | ||||||||
Heating Oil | 20.93 | 23.59 | 27.60 | ||||||||
NYMEX 2-1-1 Crack Spread | 20.41 | 20.44 | 24.52 | ||||||||
PADD II Group 3 Product Basis: | |||||||||||
Gasoline | (2.12 | ) | (4.45 | ) | (4.54 | ) | |||||
Ultra-Low Sulfur Diesel | (2.02 | ) | 0.75 | 0.58 | |||||||
PADD II Group 3 Product Crack Spread: | |||||||||||
Gasoline | 17.76 | 12.84 | 16.90 | ||||||||
Ultra-Low Sulfur Diesel | 18.91 | 24.34 | 28.18 | ||||||||
PADD II Group 3 2-1-1 | 18.34 | 18.59 | 22.54 | ||||||||
_______________________________________
(1) | Amounts are shown exclusive of depreciation and amortization. |
(2) | Direct operating expense is presented on a per crude oil throughput barrel basis. In order to derive the direct operating expenses per crude oil throughput barrel, we utilize the total direct operating expenses, which do not include depreciation or amortization expense, and divide by the applicable number of crude oil throughput barrels for the period. |
(3) | Gross profit is a measurement calculated as the difference between net sales and cost of product sold (exclusive of depreciation and amortization), direct operating expenses (exclusive of depreciation and amortization), major scheduled turnaround expenses, flood insurance recovery and depreciation and amortization. Each of the components used in this calculation are taken directly from the petroleum business' financial results. In order to derive the gross profit per crude oil throughput barrel, we utilize the total dollar figures for gross profit as derived above and divide by the applicable number of crude oil throughput barrels for the period. |
(4) | Refining margin per crude oil throughput barrel is a measurement calculated as the difference between net sales and cost of product sold (exclusive of depreciation and amortization). Refining margin is a non-GAAP measure that we believe is important to investors in evaluating the refineries' performance as a general indication of the amount above the cost of product sold that it is able to sell refined products. Each of the components used in this calculation (net sales and cost of product sold (exclusive of depreciation and amortization)) are taken directly from the petroleum business' financial results. Our calculation of refining margin may differ from similar calculations of other companies in the industry, thereby limiting its usefulness as a comparative measure. In order to derive the refining margin per crude oil throughput barrel, we utilize the total dollar figures for refining margin as derived above and divide by the applicable number of crude oil throughput barrels for the period. We believe that refining margin and refining margin per crude oil throughput barrel is important to enable investors to better understand and evaluate the petroleum business' ongoing operating results and allow for greater transparency in the review of our overall financial, operational and economic performance. |
(5) | Petroleum EBITDA represents net income for the petroleum segment before (i) interest expense and other financing costs, net of interest income, (ii) income tax expense and (iii) depreciation and amortization. Adjusted Petroleum EBITDA represents Petroleum EBITDA adjusted for (i) FIFO impact (favorable) unfavorable, (ii) share-based compensation, non-cash, (iii) loss on extinguishment of debt, (iv) major scheduled turnaround expenses, (v) (gain) loss on derivatives, net, (vi) current period settlements on derivative contracts and (vii) flood insurance recovery. We present Adjusted Petroleum EBITDA because it is the starting point for the Refining Partnership's available cash for distribution. Petroleum EBITDA and Adjusted Petroleum EBITDA are not recognized terms under GAAP and should |
72
not be substituted for net income as a measure of performance. Management believes that Petroleum EBITDA and Adjusted Petroleum EBITDA enable investors to better understand the Refining Partnership's ability to make distributions to its common unitholders, help investors evaluate the petroleum segment's ongoing operating results and allow for greater transparency in reviewing our overall financial, operational and economic performance. Petroleum EBITDA and Adjusted Petroleum EBITDA presented by other companies may not be comparable to our presentation, since each company may define these terms differently. Below is a reconciliation of net income for the petroleum segment to Petroleum EBITDA and Petroleum EBITDA to Adjusted Petroleum EBITDA for the years ended December 31, 2015, 2014 and 2013:
Year Ended December 31, | |||||||||||
2015 | 2014 | 2013 | |||||||||
(in millions) | |||||||||||
Petroleum: | |||||||||||
Petroleum net income | $ | 291.2 | $ | 358.7 | $ | 590.4 | |||||
Add: | |||||||||||
Interest expense and other financing costs, net of interest income | 42.2 | 33.9 | 43.7 | ||||||||
Income tax expense | — | — | — | ||||||||
Depreciation and amortization | 130.2 | 122.5 | 114.3 | ||||||||
Petroleum EBITDA | 463.6 | 515.1 | 748.4 | ||||||||
Add: | |||||||||||
FIFO impact (favorable) unfavorable(a) | 60.3 | 160.8 | (21.3 | ) | |||||||
Share-based compensation, non-cash | 0.6 | 2.3 | 9.5 | ||||||||
Loss on extinguishment of debt | — | — | 26.1 | ||||||||
Major scheduled turnaround expenses(b) | 102.2 | 6.8 | — | ||||||||
(Gain) loss on derivatives, net | 28.6 | (185.6 | ) | (57.1 | ) | ||||||
Current period settlements on derivative contracts(c) | (26.0 | ) | 122.2 | 6.4 | |||||||
Flood insurance recovery(d) | (27.3 | ) | — | — | |||||||
Adjusted Petroleum EBITDA | $ | 602.0 | $ | 621.6 | $ | 712.0 | |||||
_______________________________________
(a) | FIFO is the petroleum business' basis for determining inventory value on a GAAP basis. Changes in crude oil prices can cause fluctuations in the inventory valuation of crude oil, work in process and finished goods, thereby resulting in a favorable FIFO impact when crude oil prices increase and an unfavorable FIFO impact when crude oil prices decrease. The FIFO impact is calculated based upon inventory values at the beginning of the accounting period and at the end of the accounting period. |
(b) | Represents expense associated with major scheduled turnaround activities performed at the Coffeyville refinery ($102.2 million in 2015 and $5.5 million in 2014) and the Wynnewood refinery ($1.3 million in 2014). |
(c) | Represents the portion of gain (loss) on derivatives, net related to contracts that matured during the respective periods and settled with counterparties. There are no premiums paid or received at the inception of the derivative contracts and upon settlement, there is no cost recovery associated with these contracts. |
(d) | Represents an insurance recovery from CRRM's environmental insurance carriers as a result of the flood and crude oil discharge at the Coffeyville refinery on June/July 2007. Refer to Part II, Item 8, Note 13 ("Commitments and Contingencies") of this Report for further details. |
(6) | Direct operating expense is presented on a per barrel sold basis. Barrels sold are derived from the barrels produced and shipped from the refineries. We utilize total direct operating expenses, which does not include depreciation or amortization expense, and divide by the applicable number of barrels sold for the period to derive the metric. |
73
Year Ended December 31, | |||||||||||
2015 | 2014 | 2013 | |||||||||
(in millions) | |||||||||||
Coffeyville Refinery Financial Results | |||||||||||
Net sales | $ | 3,220.6 | $ | 5,755.5 | $ | 5,370.8 | |||||
Cost of product sold (exclusive of depreciation and amortization) | 2,626.1 | 5,254.9 | 4,648.6 | ||||||||
Direct operating expenses (exclusive of depreciation and amortization) | 209.1 | 223.6 | 219.4 | ||||||||
Major scheduled turnaround expenses | 102.2 | 5.5 | — | ||||||||
Flood insurance recovery | (27.3 | ) | — | — | |||||||
Depreciation and amortization | 72.1 | 73.6 | 70.8 | ||||||||
Gross profit | $ | 238.4 | $ | 197.9 | $ | 432.0 | |||||
Plus: | |||||||||||
Direct operating expenses and major scheduled turnaround expenses (exclusive of depreciation and amortization) | 311.3 | 229.1 | 219.4 | ||||||||
Flood insurance recovery | (27.3 | ) | — | — | |||||||
Depreciation and amortization | 72.1 | 73.6 | 70.8 | ||||||||
Refining margin | $ | 594.5 | $ | 500.6 | $ | 722.2 | |||||
Year Ended December 31, | |||||||||||
2015 | 2014 | 2013 | |||||||||
(dollars per barrel) | |||||||||||
Coffeyville Refinery Key Operating Statistics | |||||||||||
Per crude oil throughput barrel: | |||||||||||
Refining margin | $ | 14.37 | $ | 11.46 | $ | 17.90 | |||||
Gross profit | $ | 5.77 | $ | 4.53 | $ | 10.71 | |||||
Direct operating expenses and major scheduled turnaround expenses (exclusive of depreciation and amortization) | $ | 7.53 | $ | 5.24 | $ | 5.44 | |||||
Direct operating expenses and major scheduled turnaround expenses (exclusive of depreciation and amortization) per barrel sold | $ | 6.92 | $ | 4.73 | $ | 5.00 | |||||
Barrels sold (barrels per day) | 123,279 | 132,791 | 120,166 | ||||||||
74
Year Ended December 31, | ||||||||||||||
2015 | 2014 | 2013 | ||||||||||||
% | % | % | ||||||||||||
Coffeyville Refinery Throughput and Production Data (bpd) | ||||||||||||||
Throughput: | ||||||||||||||
Sweet | 96,727 | 79.5 | 103,018 | 80.0 | 90,818 | 77.1 | ||||||||
Medium | 2,058 | 1.7 | 1,222 | 1.0 | 453 | 0.4 | ||||||||
Heavy sour | 14,520 | 11.9 | 15,464 | 12.0 | 19,270 | 16.3 | ||||||||
Total crude oil throughput | 113,305 | 93.1 | 119,704 | 93.0 | 110,541 | 93.8 | ||||||||
All other feedstocks and blendstocks | 8,400 | 6.9 | 9,047 | 7.0 | 7,253 | 6.2 | ||||||||
Total throughput | 121,705 | 100.0 | 128,751 | 100.0 | 117,794 | 100.0 | ||||||||
Production: | ||||||||||||||
Gasoline | 57,815 | 46.5 | 64,002 | 48.6 | 56,262 | 46.8 | ||||||||
Distillate | 53,136 | 42.7 | 56,381 | 42.8 | 50,353 | 41.9 | ||||||||
Other (excluding internally produced fuel) | 13,503 | 10.8 | 11,314 | 8.6 | 13,499 | 11.3 | ||||||||
Total refining production (excluding internally produced fuel) | 124,454 | 100.0 | 131,697 | 100.0 | 120,114 | 100.0 | ||||||||
Year Ended December 31, | |||||||||||
2015 | 2014 | 2013 | |||||||||
(in millions) | |||||||||||
Wynnewood Refinery Financial Results | |||||||||||
Net sales | $ | 1,936.9 | $ | 3,069.8 | $ | 3,308.4 | |||||
Cost of product sold (exclusive of depreciation and amortization) | 1,516.3 | 2,758.1 | 2,877.5 | ||||||||
Direct operating expenses (exclusive of depreciation and amortization) | 166.2 | 185.5 | 142.4 | ||||||||
Major scheduled turnaround expenses | — | 1.3 | — | ||||||||
Depreciation and amortization | 50.2 | 41.8 | 38.6 | ||||||||
Gross profit | $ | 204.2 | $ | 83.1 | $ | 249.9 | |||||
Plus: | |||||||||||
Direct operating expenses and major scheduled turnaround expenses (exclusive of depreciation and amortization) | 166.2 | 186.8 | 142.4 | ||||||||
Depreciation and amortization | 50.2 | 41.8 | 38.6 | ||||||||
Refining margin | $ | 420.6 | $ | 311.7 | $ | 430.9 | |||||
Year Ended December 31, | |||||||||||
2015 | 2014 | 2013 | |||||||||
(dollars per barrel) | |||||||||||
Wynnewood Refinery Key Operating Statistics | |||||||||||
Per crude oil throughput barrel: | |||||||||||
Refining margin | $ | 14.44 | $ | 11.11 | $ | 15.33 | |||||
Gross profit | $ | 7.01 | $ | 2.96 | $ | 8.89 | |||||
Direct operating expenses and major scheduled turnaround expenses (exclusive of depreciation and amortization) | $ | 5.71 | $ | 6.66 | $ | 5.06 | |||||
Direct operating expenses and major scheduled turnaround expenses (exclusive of depreciation and amortization) per barrel sold | $ | 5.59 | $ | 6.66 | $ | 5.00 | |||||
Barrels sold (barrels per day) | 81,429 | 76,878 | 77,976 | ||||||||
75
Year Ended December 31, | ||||||||||||||
2015 | 2014 | 2013 | ||||||||||||
% | % | % | ||||||||||||
Wynnewood Refinery Throughput and Production Data (bpd) | ||||||||||||||
Throughput: | ||||||||||||||
Sweet | 79,370 | 95.6 | 76,041 | 96.2 | 58,329 | 73.0 | ||||||||
Medium | 402 | 0.5 | 800 | 1.0 | 18,698 | 23.4 | ||||||||
Heavy sour | — | — | — | — | — | — | ||||||||
Total crude oil throughput | 79,772 | 96.1 | 76,841 | 97.2 | 77,027 | 96.4 | ||||||||
All other feedstocks and blendstocks | 3,272 | 3.9 | 2,237 | 2.8 | 2,868 | 3.6 | ||||||||
Total throughput | 83,044 | 100.0 | 79,078 | 100.0 | 79,895 | 100.0 | ||||||||
Production: | ||||||||||||||
Gasoline | 42,146 | 51.7 | 38,273 | 49.5 | 38,299 | 49.0 | ||||||||
Distillate | 32,817 | 40.2 | 31,258 | 40.4 | 31,736 | 40.6 | ||||||||
Other (excluding internally produced fuel) | 6,571 | 8.1 | 7,835 | 10.1 | 8,118 | 10.4 | ||||||||
Total refining production (excluding internally produced fuel) | 81,534 | 100.0 | 77,366 | 100.0 | 78,153 | 100.0 | ||||||||
Year Ended December 31, 2015 Compared to the Year Ended December 31, 2014 (Petroleum Business)
Net Sales. Petroleum net sales were $5,161.9 million for the year ended December 31, 2015, compared to $8,829.7 million for the year ended December 31, 2014. The decrease of $3,667.8 million was largely the result of significantly lower sales prices for transportation fuels and by-products. The average sales price per gallon for the year ended December 31, 2015 for gasoline of $1.61 and distillate of $1.62 decreased by approximately 36.4% and 42.3%, respectively, as compared to the year ended December 31, 2014. Overall sales volume decreased approximately 3.3% for the year ended December 31, 2015 compared to the year ended December 31, 2014. Sales volumes for 2015 were impacted by decreased production as a result of the major scheduled turnaround completed at the Coffeyville refinery in the fourth quarter of 2015 and lower purchased product volumes for resale. Sales volumes for 2014 were impacted by reduced crude oil throughput and production as a result of the Coffeyville refinery shutdown following the isomerization unit fire during the third quarter of 2014 and the FCCU outage at the Wynnewood refinery during the fourth quarter of 2014.
The following table demonstrates the impact of changes in sales volumes and sales prices for gasoline and distillates for the year ended December 31, 2015 compared to the year ended December 31, 2014:
Year Ended December 31, 2015 | Year Ended December 31, 2014 | Total Variance | ||||||||||||||||||||||||||||||||||
Volume(1) | $ per barrel | Sales $(2) | Volume(1) | $ per barrel | Sales $(2) | Volume(1) | Sales $(2) | Price Variance | Volume Variance | |||||||||||||||||||||||||||
(in millions) | ||||||||||||||||||||||||||||||||||||
Gasoline | 40.1 | $ | 67.52 | $ | 2,708.4 | 40.3 | $ | 106.21 | $ | 4,282.2 | (0.2 | ) | $ | (1,573.8 | ) | $ | (1,552.1 | ) | $ | (21.7 | ) | |||||||||||||||
Distillate | 33.1 | $ | 68.01 | $ | 2,248.2 | 34.9 | $ | 118.09 | $ | 4,122.3 | (1.8 | ) | $ | (1,874.1 | ) | $ | (1,656.4 | ) | $ | (217.7 | ) | |||||||||||||||
_______________________________________
(1) | Barrels in millions |
(2) | Sales dollars in millions |
Cost of Product Sold (Exclusive of Depreciation and Amortization). Cost of product sold (exclusive of depreciation and amortization) includes cost of crude oil, other feedstocks and blendstocks, purchased products for resale, RINs and transportation and distribution costs. Petroleum cost of product sold (exclusive of depreciation and amortization) was $4,143.6 million for the year ended December 31, 2015, compared to $8,013.4 million for the year ended December 31, 2014. The decrease of $3,869.8 million was primarily the result of a decrease in the cost of consumed crude and purchased products for resale. The decrease in consumed crude oil cost was due to a decrease in crude oil throughput volume and crude oil prices. The WTI benchmark crude oil price decreased 47.5% from the year ended December 31, 2015 as compared to the year ended December 31, 2014. The petroleum business' average cost per barrel of crude oil consumed for the year ended December 31,
76
2015 was $47.86 compared to $92.57 for the year ended December 31, 2014, a decrease of approximately 48.3%. Crude oil throughput volume decreased by approximately 1.8% for the year ended December 31, 2015 as compared to the equivalent period in 2014 due primarily to the major scheduled turnaround completed at the Coffeyville refinery in the fourth quarter of 2015. Sales volumes of refined fuels decreased by approximately 3.3% during the same period.
The impact of FIFO accounting also impacted cost of product sold during the comparable periods. Under the FIFO accounting method, changes in crude oil prices can cause fluctuations in the inventory valuation of crude oil, work in process and finished goods, thereby resulting in a favorable FIFO inventory impact when crude oil prices increase and an unfavorable FIFO inventory impact when crude oil prices decrease. For the years ended December 31, 2015 and 2014, the petroleum business had an unfavorable FIFO inventory impact of $60.3 million compared to an unfavorable FIFO inventory impact of $160.8 million, respectively. The major factor contributing to the unfavorable FIFO impact for the year ended December 31, 2014 was the decline in the market price of WTI from $95.44 at the beginning of 2014 to $53.27 on December 31, 2014. The FIFO inventory impact for 2014 included a lower of cost or market write-down of $36.8 million, which was recorded in the fourth quarter as a result of the significant decline in the market price of crude oil.
Refining margin per barrel of crude oil throughput increased to $14.45 for the year ended December 31, 2015 from $11.38 for the year ended December 31, 2014. Refining margin adjusted for FIFO impact was $15.31 per crude oil throughput barrel for the year ended December 31, 2015, as compared to $13.62 per crude oil throughput barrel for the year ended December 31, 2014. Gross profit per barrel increased to $6.20 for the year ended December 31, 2015, as compared to gross profit per barrel of $3.87 in the equivalent period in 2014. The increase in refining margin and gross profit per barrel was primarily due to the higher unfavorable FIFO impact in 2014 as result of the significant decline in the market price of crude oil.
Direct Operating Expenses (Exclusive of Depreciation and Amortization). Direct operating expenses (exclusive of depreciation and amortization) for the petroleum business include costs associated with the operations of the refineries, such as energy and utility costs, property taxes, catalyst and chemical costs, repairs and maintenance, labor and environmental compliance costs. Petroleum direct operating expenses and major scheduled turnaround expenses (exclusive of depreciation and amortization) were $478.5 million for the year ended December 31, 2015, compared to direct operating expenses and major scheduled turnaround expenses of $416.0 million for the year ended December 31, 2014. The increase of $62.5 million was primarily the result of major scheduled turnaround activities performed at the Coffeyville refinery ($95.4 million), partially offset by decreases in repair and maintenance costs ($22.1 million) and energy and utility costs ($18.9 million). The decrease in repairs and maintenance costs was due to opportunity maintenance performed at the Coffeyville refinery during the shutdown following the isomerization fire in the third quarter of 2014 and during the FCCU outage at the Wynnewood refinery during the fourth quarter of 2014. The decrease in energy and utility costs was due to a 27.6% decrease in natural gas cost per unit and a 14.7% decrease in natural gas consumption. Direct operating expenses per barrel of crude oil throughput for the year ended December 31, 2015 increased to $6.79 per barrel as compared to $5.80 per barrel for the year ended December 31, 2014. The increase in the direct operating expenses per barrel of crude oil throughput was primarily a function of higher overall expenses.
Operating Income. Petroleum operating income was $361.7 million for the year ended December 31, 2015, as compared to operating income of $207.2 million for the year ended December 31, 2014. The increase of $154.5 million was the result of an increase in the refining margin ($202.0 million) and the flood insurance recovery ($27.3 million), partially offset by increases in direct operating expenses ($62.5 million), depreciation and amortization ($7.7 million) and selling, general and administrative expenses ($4.6 million).
Year Ended December 31, 2014 Compared to the Year Ended December 31, 2013 (Petroleum Business)
Net Sales. Petroleum net sales were $8,829.7 million for the year ended December 31, 2014, compared to $8,683.5 million for the year ended December 31, 2013. The increase of $146.2 million was primarily the result of higher overall sales volumes largely offset by lower sales prices for gasoline and distillates. Overall sales volume increased 8.4% for the year ended December 31, 2014 compared to the year ended December 31, 2013. Sales volumes for 2014 were impacted by reduced crude oil throughput and production as a result of the Coffeyville refinery shutdown following the isomerization unit fire during the third quarter of 2014 and the FCCU outage at the Wynnewood refinery during the fourth quarter of 2014. Sales volumes for 2013 were impacted by downtime associated with the FCCU outage at the Coffeyville refinery in the third quarter of 2013. The average sales price per gallon for the year ended December 31, 2014 for gasoline of $2.53 and distillate of $2.81 each decreased by approximately 7.0%, as compared to the year ended December 31, 2013.
77
The following table demonstrates the impact of changes in sales volumes and sales prices for gasoline and distillates for the year ended December 31, 2014 compared to the year ended December 31, 2013:
Year Ended December 31, 2014 | Year Ended December 31, 2013 | Total Variance | ||||||||||||||||||||||||||||||||||
Volume(1) | $ per barrel | Sales $(2) | Volume(1) | $ per barrel | Sales $(2) | Volume(1) | Sales $(2) | Price Variance | Volume Variance | |||||||||||||||||||||||||||
(in millions) | ||||||||||||||||||||||||||||||||||||
Gasoline | 40.3 | $ | 106.21 | $ | 4,282.2 | 37.8 | $ | 114.29 | $ | 4,330.0 | 2.5 | $ | (47.8 | ) | $ | (325.9 | ) | $ | 278.1 | |||||||||||||||||
Distillate | 34.9 | $ | 118.09 | $ | 4,122.3 | 30.6 | $ | 126.79 | $ | 3,880.6 | 4.3 | $ | 241.7 | $ | (303.5 | ) | $ | 545.2 | ||||||||||||||||||
_______________________________________
(1) | Barrels in millions |
(2) | Sales dollars in millions |
Cost of Product Sold (Exclusive of Depreciation and Amortization). Cost of product sold (exclusive of depreciation and amortization) includes cost of crude oil, other feedstocks and blendstocks, purchased products for resale, RINs and transportation and distribution costs. Petroleum cost of product sold (exclusive of depreciation and amortization) was $8,013.4 million for the year ended December 31, 2014, compared to $7,526.7 million for the year ended December 31, 2013. The increase of $486.7 million was primarily the result of an increase in the cost of consumed crude oil and refined fuels purchased for resale. The increase in consumed crude oil cost was due to a 4.8% increase in consumed volumes, which was partially offset by lower crude oil prices. The average cost per barrel of crude oil consumed for the year ended December 31, 2014 was $92.57 compared to $95.05 for the year ended December 31, 2013, a decrease of approximately 2.6%. Sales volumes of refined fuels increased by approximately 8.4%. The impact of FIFO accounting also impacted cost of product sold during the comparable periods. Under the FIFO accounting method, changes in crude oil prices can cause fluctuations in the inventory valuation of crude oil, work in process and finished goods, thereby resulting in a favorable FIFO inventory impact when crude oil prices increase and an unfavorable FIFO inventory impact when crude oil prices decrease. For the years ended December 31, 2014 and 2013, the petroleum business had an unfavorable FIFO inventory impact of $160.8 million compared to a favorable FIFO inventory impact of $21.3 million, respectively. The major factor contributing to the unfavorable FIFO impact for the year ended December 31, 2014 was the decline in the market price of WTI from $95.44 at the beginning of 2014 to $53.27 on December 31, 2014. The FIFO inventory impact for 2014 includes a lower of cost or market write-down of $36.8 million, which was recorded in the fourth quarter as a result of the significant decline in the market price of crude oil.
Refining margin per barrel of crude oil throughput decreased to $11.38 for the year ended December 31, 2014 from $16.90 for the year ended December 31, 2013. Refining margin adjusted for FIFO impact was $13.62 per crude oil throughput barrel for the year ended December 31, 2014, as compared to $16.59 per crude oil throughput barrel for the year ended December 31, 2013. Gross profit per barrel decreased to $3.87 for the year ended December 31, 2014, as compared to gross profit per barrel of $9.94 in the equivalent period in 2013. The decrease in refining margin and gross profit per barrel was primarily due to a decrease in sales prices of gasoline and distillate. The average sales price for both gasoline and distillates declined approximately 7.0% for the year ended December 31, 2014 as compared to the same period last year.
Direct Operating Expenses (Exclusive of Depreciation and Amortization). Direct operating expenses (exclusive of depreciation and amortization) for the petroleum business include costs associated with the operations of the refineries, such as energy and utility costs, property taxes, catalyst and chemical costs, repairs and maintenance, labor and environmental compliance costs. Petroleum direct operating expenses and major scheduled turnaround expenses (exclusive of depreciation and amortization) were $416.0 million for the year ended December 31, 2014, compared to direct operating expenses of $361.7 million for the year ended December 31, 2013. The increase of $54.3 million was primarily the result of the increase in expenses associated with energy and utility costs ($18.1 million), repairs and maintenance ($10.2 million), labor ($8.9 million), certain turnaround activities performed at the Coffeyville and Wynnewood refineries ($6.8 million), production chemicals ($4.7 million) and rental costs ($4.5 million). The increase in energy and utility costs was primarily due to a 27.3% increase in natural gas cost per unit and a 12.5% increase in natural gas consumption. The increase in repairs and maintenance and turnaround costs was due to opportunity maintenance and turnaround activities performed at the Coffeyville refinery during the shutdown following the isomerization fire in the third quarter of 2014 and during the FCCU outage at the Wynnewood refinery during the fourth quarter of 2014. Direct operating expenses per barrel of crude oil throughput for the year ended December 31, 2014 increased to $5.80 per barrel as compared to $5.28 per barrel for the year ended December 31, 2013. The increase in the direct operating expenses per barrel of crude oil throughput was primarily a function of higher overall expenses.
Operating Income. Petroleum operating income was $207.2 million for the year ended December 31, 2014, as compared to operating income of $603.0 million for the year ended December 31, 2013. The decrease of $395.8 million was the result of
78
a decrease in the refining margin ($340.5 million) and increases in direct operating expenses ($54.3 million) and depreciation and amortization ($8.2 million), partially offset by a decrease in selling, general and administrative expenses ($7.2 million).
Nitrogen Fertilizer Business Results of Operations
The tables below provide an overview of the nitrogen fertilizer business' results of operations, relevant market indicators and its key operating statistics for the years ended December 31, 2015, 2014 and 2013:
Year Ended December 31, | |||||||||||
2015 | 2014 | 2013 | |||||||||
(in millions) | |||||||||||
Nitrogen Fertilizer Business Financial Results | |||||||||||
Net sales | $ | 289.2 | $ | 298.7 | $ | 323.7 | |||||
Cost of product sold(1) | 65.2 | 72.0 | 58.1 | ||||||||
Direct operating expenses(1) | 99.1 | 98.9 | 94.1 | ||||||||
Major scheduled turnaround expenses | 7.0 | — | — | ||||||||
Selling, general and administrative(1) | 20.8 | 17.7 | 21.0 | ||||||||
Depreciation and amortization | 28.4 | 27.3 | 25.6 | ||||||||
Operating income | 68.7 | 82.8 | 124.9 | ||||||||
Interest expense and other financing costs | (7.0 | ) | (6.7 | ) | (6.3 | ) | |||||
Other income, net | 0.3 | — | 0.1 | ||||||||
Income before income tax expense | 62.0 | 76.1 | 118.7 | ||||||||
Income tax expense | — | — | 0.1 | ||||||||
Net income | $ | 62.0 | $ | 76.1 | $ | 118.6 | |||||
Adjusted Nitrogen Fertilizer EBITDA(2) | $ | 106.8 | $ | 110.3 | $ | 152.8 | |||||
79
Year Ended December 31, | |||||||||||
2015 | 2014 | 2013 | |||||||||
Key Operating Statistics | |||||||||||
Production volume (thousand tons): | |||||||||||
Ammonia (gross produced)(3) | 385.4 | 388.9 | 402.0 | ||||||||
Ammonia (net available for sale)(3)(4) | 37.3 | 28.3 | 37.9 | ||||||||
UAN | 928.6 | 963.7 | 930.6 | ||||||||
Pet coke consumed (thousand tons) | 469.9 | 489.7 | 487.0 | ||||||||
Pet coke (cost per ton) | $ | 25 | $ | 28 | $ | 30 | |||||
Sales (thousand tons): | |||||||||||
Ammonia | 32.3 | 24.4 | 40.5 | ||||||||
UAN | 939.5 | 951.0 | 904.6 | ||||||||
Product pricing at gate (dollars per ton)(5): | |||||||||||
Ammonia | $ | 521 | $ | 518 | $ | 643 | |||||
UAN | $ | 247 | $ | 259 | $ | 282 | |||||
On-stream factors(6): | |||||||||||
Gasification | 90.2 | % | 96.8 | % | 95.6 | % | |||||
Ammonia | 87.5 | % | 92.6 | % | 94.4 | % | |||||
UAN | 87.3 | % | 92.0 | % | 91.9 | % | |||||
Reconciliation to net sales (dollars in millions): | |||||||||||
Sales net at gate | $ | 248.8 | $ | 259.3 | $ | 281.5 | |||||
Freight in revenue | 27.2 | 27.5 | 30.2 | ||||||||
Hydrogen revenue | 11.8 | 10.1 | 11.4 | ||||||||
Other revenue | 1.4 | 1.8 | 0.6 | ||||||||
Total net sales | $ | 289.2 | $ | 298.7 | $ | 323.7 | |||||
Year Ended December 31, | |||||||||||
2015 | 2014 | 2013 | |||||||||
Market Indicators | |||||||||||
Natural gas NYMEX (dollars per MMBtu) | $ | 2.63 | $ | 4.26 | $ | 3.73 | |||||
Ammonia — Southern Plains (dollars per ton) | 510 | 539 | 581 | ||||||||
UAN — Corn belt (dollars per ton) | 284 | 314 | 337 | ||||||||
_______________________________________
(1) | Amounts are shown exclusive of depreciation and amortization. |
(2) | Nitrogen Fertilizer EBITDA represents nitrogen fertilizer net income adjusted for (i) interest expense and other financing costs, net of interest income, (ii) income tax expense and (iii) depreciation and amortization. Adjusted Nitrogen Fertilizer EBITDA represents Nitrogen Fertilizer EBITDA adjusted for (i) share-based compensation, non-cash, (ii) major scheduled turnaround expenses, (iii) loss on extinguishment of debt and (iv) expenses associated with the pending Rentech Nitrogen mergers, as applicable. We present Adjusted Nitrogen Fertilizer EBITDA because we have found it helpful to consider an operating measure that excludes expenses, such as major scheduled turnaround expense, loss on extinguishment of debt and expenses associated with the pending Rentech Nitrogen mergers, relating to transactions not reflective of the Nitrogen Fertilizer Partnership's core operations. In addition, we believe that it is useful to exclude from Adjusted Nitrogen Fertilizer EBITDA share-based compensation, non-cash, although it is a |
80
recurring cost incurred in the ordinary course of business. We believe share-based compensation, non-cash, reflects a non-cash cost which may obscure, for a given period, trends in the underlying business, due to the timing and nature of the equity awards.
We also present Adjusted Nitrogen Fertilizer EBITDA because it is the starting point for calculating the Nitrogen Fertilizer Partnership's available cash for distribution. Adjusted Nitrogen Fertilizer EBITDA is not a recognized term under GAAP and should not be substituted for net income as a measure of performance. Management believes that Nitrogen Fertilizer EBITDA and Adjusted Nitrogen Fertilizer EBITDA enable investors and analysts to better understand the Nitrogen Fertilizer Partnership's ability to make distributions to its common unitholders, help investors and analysts evaluate its ongoing operating results and allow for greater transparency in reviewing our overall financial, operational and economic performance by allowing investors to evaluate the same information used by management. Nitrogen Fertilizer EBITDA and Adjusted Nitrogen Fertilizer EBITDA presented by other companies may not be comparable to our presentation, since each company may define these terms differently. Below is a reconciliation of net income for the nitrogen fertilizer segment to Nitrogen Fertilizer EBITDA and Adjusted Nitrogen Fertilizer EBITDA for the years ended December 31, 2015, 2014 and 2013:
Year Ended December 31, | |||||||||||
2015 | 2014 | 2013 | |||||||||
(in millions) | |||||||||||
Nitrogen Fertilizer: | |||||||||||
Nitrogen Fertilizer net income | $ | 62.0 | $ | 76.1 | $ | 118.6 | |||||
Add: | |||||||||||
Interest expense and other financing costs, net | 7.0 | 6.7 | 6.3 | ||||||||
Income tax expense | — | — | 0.1 | ||||||||
Depreciation and amortization | 28.4 | 27.3 | 25.6 | ||||||||
Nitrogen Fertilizer EBITDA | 97.4 | 110.1 | 150.6 | ||||||||
Add: | |||||||||||
Share-based compensation, non-cash | 0.1 | 0.2 | 2.2 | ||||||||
Major scheduled turnaround expenses | 7.0 | — | — | ||||||||
Expenses associated with the Rentech Nitrogen mergers | 2.3 | — | — | ||||||||
Adjusted Nitrogen Fertilizer EBITDA | $ | 106.8 | $ | 110.3 | $ | 152.8 | |||||
(3) | Gross tons produced for ammonia represent the total ammonia produced, including ammonia produced that was upgraded into UAN. Net tons available for sale represent the ammonia available for sale that was not upgraded into UAN. |
(4) | In addition to produced ammonia, the Nitrogen Fertilizer Partnership acquired approximately 29,300, 33,600 and 17,300 tons of ammonia during the years ended December 31, 2015, 2014 and 2013, respectively. |
(5) | Product pricing at gate represents net sales less freight revenue divided by product sales volume in tons and is shown in order to provide a pricing measure that is comparable across the fertilizer industry. |
(6) | On-stream factor is the total number of hours operated divided by the total number of hours in the reporting period and is a measure of operating efficiency. Excluding the impact of the full facility turnaround and the Linde air separation unit outages, (i) the on-stream factors in 2015 would have been 99.9% for gasification, 97.7% for ammonia and 97.6% for UAN. Excluding the impact of the downtime associated with the installation of the waste heat boiler, the PSA unit upgrade and the Linde air separation unit maintenance (ii) the on-stream factors in 2014 would have been 98.2% for gasification, 94.3% for ammonia and 93.7% for UAN. Excluding the impact of the UAN expansion coming online, the planned downtime associated with the replacement of damaged catalyst, the unplanned Linde air separation unit outages and the unplanned downtime associated with weather issues (iii) the on-stream factors in 2013 would have been 99.5% for gasification, 98.9% for ammonia and 98.0% for UAN. |
81
Year Ended December 31, 2015 compared to the Year Ended December 31, 2014 (Nitrogen Fertilizer Business)
Net Sales. Nitrogen fertilizer net sales were $289.2 million for the year ended December 31, 2015, compared to $298.7 million for the year ended December 31, 2014. The net sales decrease of $9.5 million for the year ended December 31, 2015 as compared to the year ended December 31, 2014 was primarily the result of lower UAN sales prices ($11.6 million), lower UAN sales volumes ($3.3 million) and lower hydrogen sales prices ($0.3 million), partially offset by higher ammonia sales volumes ($4.2 million) and higher hydrogen sales volumes ($2.0 million). For the year ended December 31, 2015, UAN, ammonia and hydrogen made up $258.8 million, $17.2 million and $11.8 million of the nitrogen fertilizer business' net sales, respectively. This compared to UAN, ammonia and hydrogen net sales of $273.7 million, $13.1 million and $10.1 million, respectively, for the year ended December 31, 2014. The following table demonstrates the impact of changes in sales volumes and sales price for UAN, ammonia and hydrogen for the year ended December 31, 2015 compared to the year ended December 31, 2014:
Year Ended December 31, 2015 | Year Ended December 31, 2014 | Total Variance | ||||||||||||||||||||||||||||||||||
Volume(1) | $ per ton(2) | Sales $(3) | Volume(1) | $ per ton(2) | Sales $(3) | Volume(1) | Sales $(3) | Price Variance | Volume Variance | |||||||||||||||||||||||||||
(in millions) | ||||||||||||||||||||||||||||||||||||
UAN | 939,547 | $ | 275 | $ | 258.8 | 951,043 | $ | 288 | $ | 273.7 | (11,496 | ) | $ | (14.9 | ) | $ | (11.6 | ) | $ | (3.3 | ) | |||||||||||||||
Ammonia | 32,326 | $ | 533 | $ | 17.2 | 24,378 | $ | 536 | $ | 13.1 | 7,948 | $ | 4.1 | $ | (0.1 | ) | $ | 4.2 | ||||||||||||||||||
Hydrogen | 1,196,320 | $ | 10 | $ | 11.8 | 996,516 | $ | 10 | $ | 10.1 | 199,804 | $ | 1.7 | $ | (0.3 | ) | $ | 2.0 | ||||||||||||||||||
_______________________________________
(1) | UAN and ammonia sales volumes are in tons. Hydrogen sales volumes are in MSCF. |
(2) | Includes freight charges. Hydrogen is reflected as $ per MSCF. |
(3) | Sales dollars in millions. |
For the year ended December 31, 2015 compared to the year ended December 31, 2014, the nitrogen fertilizer segment's operations experienced a decrease of 1.2% in UAN sales unit volumes and an increase of 32.6% in ammonia sales unit volumes. The decrease in UAN sales volumes for the year ended December 31, 2015 compared to the year ended December 31, 2014 was partially attributable to the 2015 turnaround and the Linde air separation unit related outages. The increase in ammonia sales for the year ended December 31, 2015 compared to the year ended December 31, 2014 was partially attributable to higher customer demand.
Product pricing at gate represents net sales less freight revenue divided by product sales volume in tons. Product pricing at gate for UAN decreased approximately 4.6% for the year ended December 31, 2015 as compared to the year ended December 31, 2014. Product pricing at gate for ammonia increased approximately 0.6% for the year ended December 31, 2015 as compared to the year ended December 31, 2014.
Cost of Product Sold (Exclusive of Depreciation and Amortization). Nitrogen fertilizer cost of product sold (exclusive of depreciation and amortization) includes cost of freight and distribution expenses, pet coke expenses, purchased ammonia and purchased hydrogen. Cost of product sold excluding depreciation and amortization for the year ended December 31, 2015 was $65.2 million, compared to $72.0 million for the year ended December 31, 2014. The $6.8 million decrease was primarily the result of lower consumption of pet coke mostly due to the decrease in production during the turnaround and the Linde air separation unit related downtime, lower pet coke pricing, decreased distribution costs, freight expenses and purchased ammonia. The lower distribution costs is due to a smaller portion of the nitrogen fertilizer business' fleet due for regulatory inspections and related repairs during the year ended December 31, 2015 as compared to the year ended December 31, 2014.
Direct Operating Expenses (Exclusive of Depreciation and Amortization). Direct operating expenses (exclusive of depreciation and amortization) for the nitrogen fertilizer business consist primarily of energy and utility costs, direct costs of labor, property taxes, plant-related maintenance services, including turnaround, and environmental and safety compliance costs as well as catalyst and chemical costs. Nitrogen fertilizer direct operating expenses (exclusive of depreciation and amortization) for the year ended December 31, 2015 were $106.1 million, as compared to $98.9 million for the year ended December 31, 2014. The total increase of $7.2 million for the year ended December 31, 2015, as compared to the year ended December 31, 2014, resulted primarily from higher turnaround expenses ($7.0 million), personnel costs ($2.9 million) and repairs and maintenance ($2.2 million), partially offset by lower utilities, net ($2.3 million), refractory brick amortization ($2.2 million) and outside services ($1.8 million). The increase in personnel costs is partially attributable to the increased efforts required to complete activities during downtime. The increase in repairs and maintenance is due to the nitrogen fertilizer business being able to perform an increased amount of normal repairs and maintenance during the downtime. The lower utilities, net are primarily the result of lower usage during the downtime from the turnaround and the Linde outages.
82
Operating Income. Nitrogen fertilizer operating income was $68.7 million for the year ended December 31, 2015, as compared to operating income of $82.8 million for the year ended December 31, 2014. The decrease of $14.1 million for the year ended December 31, 2015 as compared to the year ended December 31, 2014 was the result of the decrease in net sales ($9.5 million) and increases in direct operating expenses ($7.2 million), selling, general and administrative expenses ($3.1 million) and depreciation and amortization ($1.1 million), partially offset by a decrease in cost of product sold ($6.8 million).
Year Ended December 31, 2014 compared to the Year Ended December 31, 2013 (Nitrogen Fertilizer Business)
Net Sales. Nitrogen fertilizer net sales were $298.7 million for the year ended December 31, 2014, compared to $323.7 million for the year ended December 31, 2013. The net sales decrease of $25.0 million was the result of lower UAN sales prices ($25.8 million), lower ammonia sales volumes ($10.7 million) and lower ammonia sales prices ($3.0 million), partially offset by higher UAN sales volumes ($14.6 million). For the year ended December 31, 2014, UAN, ammonia and hydrogen made up $273.7 million, $13.1 million and $10.1 million of the nitrogen fertilizer business' net sales, respectively. This compared to UAN, ammonia and hydrogen net sales of $284.9 million, $26.8 million and $11.4 million, respectively, for the year ended December 31, 2013. The following table demonstrates the impact of changes in sales volumes and sales price for UAN, ammonia and hydrogen for the year ended December 31, 2014 compared to the year ended December 31, 2013:
Year Ended December 31, 2014 | Year Ended December 31, 2013 | Total Variance | ||||||||||||||||||||||||||||||||||
Volume(1) | $ per ton(2) | Sales $(3) | Volume(1) | $ per ton(2) | Sales $(3) | Volume(1) | Sales $(3) | Price Variance | Volume Variance | |||||||||||||||||||||||||||
(in millions) | ||||||||||||||||||||||||||||||||||||
UAN | 951,043 | $ | 288 | $ | 273.7 | 904,596 | $ | 315 | $ | 284.9 | 46,447 | $ | (11.2 | ) | $ | (25.8 | ) | $ | 14.6 | |||||||||||||||||
Ammonia | 24,378 | $ | 536 | $ | 13.1 | 40,535 | $ | 660 | $ | 26.8 | (16,157 | ) | $ | (13.7 | ) | $ | (3.0 | ) | $ | (10.7 | ) | |||||||||||||||
Hydrogen | 996,516 | $ | 10 | $ | 10.1 | 1,165,300 | $ | 10 | $ | 11.4 | (168,784 | ) | $ | (1.3 | ) | $ | 0.3 | $ | (1.6 | ) | ||||||||||||||||
_______________________________________
(1) | UAN and ammonia sales volumes are in tons. Hydrogen sales volumes are in MSCF. |
(2) | Includes freight charges. Hydrogen is reflected as $ per MSCF. |
(3) | Sales dollars in millions. |
For the year ended December 31, 2014, the nitrogen fertilizer segment's operations experienced an increase of 5.1% in UAN sales unit volumes and a decrease of 39.9% in ammonia sales unit volumes. The increase in UAN and decrease in ammonia sales volume for the year ended December 31, 2014 compared to the year ended December 31, 2013 was partially attributable to the UAN expansion being available for the full period in 2014.
Product pricing at gate represents net sales less freight revenue divided by product sales volume in tons. Product pricing at gate for the year ended December 31, 2014 compared to the year ended December 31, 2013 decreased approximately 8.2% for UAN and 19.4% for ammonia, respectively.
Cost of Product Sold (Exclusive of Depreciation and Amortization). Nitrogen fertilizer cost of product sold (exclusive of depreciation and amortization) includes cost of freight and distribution expenses, pet coke expenses, purchased ammonia and purchased hydrogen. Cost of product sold excluding depreciation and amortization for the year ended December 31, 2014 was $72.0 million, compared to $58.1 million for the year ended December 31, 2013. The $13.9 million increase resulted from $15.3 million in higher costs from transactions with third parties, which is offset by lower costs from transactions with affiliates of $1.4 million. The higher third-party costs incurred during the year ended December 31, 2014 were primarily the result of increased distribution costs ($10.5 million) mostly due to the increase in railcar regulatory inspections and repairs as well as increased ammonia purchases ($6.5 million), partially offset by lower freight and pet coke expenses. The increase in railcar regulatory inspections and repairs is related to a larger portion of the nitrogen fertilizer business' fleet due for regulatory inspections and related repairs during the year ended December 31, 2014 as compared to the prior year.
Direct Operating Expenses (Exclusive of Depreciation and Amortization). Direct operating expenses (exclusive of depreciation and amortization) for the nitrogen fertilizer business consist primarily of energy and utility costs, direct costs of labor, property taxes, plant-related maintenance services and environmental and safety compliance costs as well as catalyst and chemical costs. Nitrogen fertilizer direct operating expenses (exclusive of depreciation and amortization) for the year ended December 31, 2014 were $98.9 million, as compared to $94.1 million for the year ended December 31, 2013. The total increase of $4.8 million for the year ended December 31, 2014, as compared to the year ended December 31, 2013, was comprised of a $5.9 million increase in costs from transactions with third parties, partially offset by a $1.1 million decrease in direct operating
83
costs from affiliates. The increase resulted primarily from higher utilities, net ($1.3 million), refractory brick amortization ($2.7 million), repairs and maintenance ($1.2 million), partially offset by lower insurance costs ($1.1 million). The increased utility costs were largely due to higher electrical and natural gas prices, partially offset by lower electrical volumes. The increase in refractory brick amortization is primarily due to a decrease in the estimated useful life to reflect higher estimated rates of use in the production process.
Operating Income. Nitrogen fertilizer operating income was $82.8 million for the year ended December 31, 2014, as compared to operating income of $124.9 million for the year ended December 31, 2013. The decrease of $42.1 million for the year ended December 31, 2014 as compared to the year ended December 31, 2013 was the result of the decrease in net sales ($25.0 million) and increases in cost of products sold ($13.9 million), direct operating expenses ($4.8 million) and depreciation and amortization ($1.7 million), partially offset by a decrease in selling, general and administrative expense ($3.3 million).
Liquidity and Capital Resources
Although results are consolidated for financial reporting, CVR Energy, CVR Refining and CVR Partners are independent business entities and operate with independent capital structures. Since the Nitrogen Fertilizer Partnership's IPO in April 2011 and the Refining Partnership's IPO in January 2013, with the exception of cash distributions paid to us by the Nitrogen Fertilizer Partnership and the Refining Partnership, the cash needs of the Nitrogen Fertilizer Partnership and the Refining Partnership have been met independently from the cash needs of CVR Energy and each other with a combination of existing cash and cash equivalent balances, cash generated from operating activities and credit facility borrowings. The Refining Partnership's and the Nitrogen Fertilizer Partnership's ability to generate sufficient cash flows from their respective operating activities and to then make distributions on their common units, including to us (which we will need to pay salaries, reporting expenses and other expenses as well as dividends on our common stock) will continue to be primarily dependent on producing or purchasing, and selling, sufficient quantities of refined and nitrogen fertilizer products at margins sufficient to cover fixed and variable expenses.
We believe that the petroleum business and the nitrogen fertilizer business' cash flows from operations and existing cash and cash equivalents, along with borrowings under their respective existing credit facilities as necessary, will be sufficient to satisfy the anticipated cash requirements associated with their existing operations for at least the next twelve months, and that we have sufficient cash resources to fund our operations for at least the next twelve months. However, future capital expenditures and other cash requirements could be higher than we currently expect as a result of various factors. Additionally, the ability to generate sufficient cash from operating activities depends on future performance, which is subject to general economic, political, financial, competitive, and other factors outside our control.
Cash Balances and Other Liquidity
As of December 31, 2015, we had consolidated cash and cash equivalents of $765.1 million. Of that amount, $527.8 million was cash and cash equivalents of CVR Energy, $187.3 million was cash and cash equivalents of the Refining Partnership and $50.0 million was cash and cash equivalents of the Nitrogen Fertilizer Partnership. As of February 16, 2016, we had consolidated cash and cash equivalents of approximately $796.6 million.
The Amended and Restated ABL Credit Facility provides the Refining Partnership with borrowing availability of up to $400.0 million with an incremental facility, subject to compliance with a borrowing base. The Amended and Restated ABL Credit Facility is scheduled to mature on December 20, 2017. The proceeds of the loans may be used for capital expenditures and working capital and general corporate purposes of the Refining Partnership and the credit facility provides for loans and letters of credit in an amount up to the aggregate availability under the facility, subject to meeting certain borrowing base conditions, with sub-limits of 10% of the total facility commitment for swingline loans and 90% of the total facility commitment for letters of credit. As of February 16, 2016, the Refining Partnership had $262.1 million available under the Amended and Restated ABL Credit Facility. Availability under the Amended and Restated ABL Credit Facility was limited by borrowing base conditions.
The Nitrogen Fertilizer Partnership's credit facility includes a term loan facility of $125.0 million and a revolving credit facility of $25.0 million with an uncommitted incremental facility of up to $50.0 million. The Nitrogen Fertilizer Partnership's credit facility matures in April 2016. The Nitrogen Fertilizer Partnership's credit facility is used to finance on-going working capital, capital expenditures, letter of credit issuances and general needs of CRNF. As of February 16, 2016, the Nitrogen Fertilizer Partnership had $25.0 million available under the credit facility.
As discussed in Note 9 ("Long-Term Debt") to Part II, Item 8 of this Report, the Nitrogen Fertilizer Partnership's credit facility matures in April 2016, and the $125.0 million principal portion of the term loan facility is presented as a current
84
liability as of December 31, 2015. On February 9, 2016, CRLLC and the Nitrogen Fertilizer Partnership entered into a guaranty, pursuant to which CRLLC agreed to guaranty the indebtedness outstanding under the Nitrogen Fertilizer Partnership's credit facility. Refer to Note 9 ("Long-Term Debt") to Part II, Item 8 of this Report for discussion of the guaranty. The Nitrogen Fertilizer Partnership is considering various capital structure and refinancing options in regard to the credit facility and in contemplation of the Rentech Nitrogen mergers as discussed in "Pending Mergers." The Nitrogen Fertilizer Partnership anticipates these options will be adequate to fund the cash requirements of the maturing credit facility and the pending mergers.
Simultaneously with the execution of the Merger Agreement discussed in Part II, Item 8, Note 1 ("Organization and History of the Company") of this Report, the Nitrogen Fertilizer Partnership entered into a commitment letter with CRLLC, pursuant to which CRLLC has committed to, on the terms and subject to the conditions set forth in the commitment letter, make available to CVR Partners term loan financing of up to $150.0 million, which amounts would be available solely to fund the repayment of all of the loans outstanding under Rentech Nitrogen's existing $50.0 million credit facility with General Electric Capital Corporation, the cash consideration payable by the Nitrogen Fertilizer Partnership upon closing of the mergers and expenses associated with the mergers. The term loan facility will bear interest at a rate of three-month LIBOR plus 3.0% per annum. Calculation of interest shall be on the basis of the actual number of days elapsed over a 360-day year. Such term loan, if drawn, would have a one-year term.
The Refining Partnership and the Nitrogen Fertilizer Partnership have distribution policies in which they generally distribute all of their available cash each quarter, within 60 days after the end of each quarter. The Refining Partnership's distributions began with the quarter ended March 31, 2013 and were adjusted to exclude the period from January 1, 2013 through January 22, 2013 (the period preceding the closing of the Refining Partnership IPO). The distributions are made to all common unitholders. As of December 31, 2015, we held approximately 66% and 53% of the Refining Partnership's and the Nitrogen Fertilizer Partnership's common units outstanding, respectively. The amount of each distribution will be determined pursuant to each general partner's calculation of available cash for the applicable quarter. The general partner of each partnership, as a non-economic interest holder, is not entitled to receive cash distributions. As a result of each general partner's distribution policy, funds held by the Refining Partnership and the Nitrogen Fertilizer Partnership will not be available for our use, and we as a unitholder will receive our applicable percentage of the distribution of funds within 60 days following each quarter. The Refining Partnership and the Nitrogen Fertilizer Partnership do not have a legal obligation to pay distributions and there is no guarantee that they will pay any distributions on the units in any quarter.
Borrowing Activities
2022 Notes. On October 23, 2012, CVR Refining, LLC ("Refining LLC") and its wholly-owned subsidiary, Coffeyville Finance Inc. ("Coffeyville Finance"), issued $500.0 million aggregate principal amount of the 2022 Notes. The net proceeds from the offering of the 2022 Notes were used to purchase all of the First Lien Secured Notes due 2015 through a tender offer and settled redemption in the fourth quarter of 2012.
The debt issuance costs of the 2022 Notes totaled approximately $8.7 million and are being amortized over the term of the 2022 Notes as interest expense using the effective-interest amortization method. As of December 31, 2015, the 2022 Notes had an aggregate principal balance and a net carrying value of $500.0 million.
The 2022 Notes were issued by Refining LLC and Coffeyville Finance and are fully and unconditionally guaranteed by CVR Refining and each of Refining LLC's existing domestic subsidiaries (other than the co-issuer, Coffeyville Finance) on a joint and several basis. CVR Refining has no independent assets or operations and Refining LLC is a 100% owned finance subsidiary of CVR Refining. Prior to the satisfaction and discharge of the Second Lien Notes, which occurred on January 23, 2013, the 2022 Notes were also guaranteed by CRLLC. CVR Energy, CVR Partners and CRNF are not guarantors. The 2022 Notes were secured by substantially the same assets that secured the then outstanding Second Lien Notes, subject to exceptions, until such time that the outstanding Second Lien Notes were satisfied and discharged in full, which occurred on January 23, 2013. Accordingly, the 2022 Notes were no longer secured as of and after January 23, 2013.
On September 17, 2013, Refining LLC and Coffeyville Finance consummated a registered exchange offer, whereby all $500.0 million of the outstanding 2022 Notes were exchanged for an equal principal amount of notes with identical terms that were registered under the Securities Act of 1933. The exchange offer fulfilled the Refining Partnership's obligations contained in the registration rights agreement entered into in connection with the issuance of the 2022 Notes. The Refining Partnership incurred approximately $0.4 million of debt registration costs related to the registration and exchange offer during the year ended December 31, 2013, which are being amortized over the term of the 2022 Notes as interest expense using the effective-interest amortization method.
85
The 2022 Notes bear interest at a rate of 6.5% per annum and mature on November 1, 2022, unless earlier redeemed or repurchased by the issuers. Interest is payable on the 2022 Notes semi-annually on May 1 and November 1 of each year, to holders of record at the close of business on April 15 and October 15, as the case may be, immediately preceding each such interest payment date.
The issuers have the right to redeem the 2022 Notes at a redemption price of (i) 103.250% of the principal amount thereof, if redeemed during the twelve-month period beginning on November 1, 2017; (ii) 102.167% of the principal amount thereof, if redeemed during the twelve-month period beginning on November 1, 2018; (iii) 101.083% of the principal amount thereof, if redeemed during the twelve-month period beginning on November 1, 2019; and (iv) 100% of the principal amount, if redeemed on or after November 1, 2020, in each case, plus any accrued and unpaid interest. Prior to November 1, 2017, some or all of the 2022 Notes may be redeemed at a price equal to 100% of the principal amount thereof, plus a make-whole premium and any accrued and unpaid interest.
In the event of a "change of control," the issuers are required to offer to buy back all of the 2022 Notes at 101% of their principal amount. A change of control is generally defined as (i) the direct or indirect sale or transfer (other than by a merger) of all or substantially all of the assets of Refining LLC to any person other than qualifying owners (as defined in the indenture), (ii) liquidation or dissolution of Refining LLC, or (iii) any person, other than a qualifying owner, directly or indirectly acquiring 50% of the voting stock of Refining LLC.
The indenture governing the 2022 Notes imposes covenants that restrict the ability of the issuers and subsidiary guarantors to (i) issue debt, (ii) incur or otherwise cause liens to exist on any of their property or assets, (iii) declare or pay dividends, repurchase equity, or make payments on subordinated or unsecured debt, (iv) make certain investments, (v) sell certain assets, (vi) merge, consolidate with or into another entity, or sell all or substantially all of their assets, and (vii) enter into certain transactions with affiliates. Most of the foregoing covenants would cease to apply at such time that the 2022 Notes are rated investment grade by both Standard & Poor's Rating Services and Moody's Investors Services, Inc. However, such covenants would be reinstituted if the 2022 Notes subsequently lost their investment grade rating. In addition, the indenture contains customary events of default, the occurrence of which would result in, or permit the trustee or the holders of at least 25% of the 2022 Notes to cause, the acceleration of the 2022 Notes, in addition to the pursuit of other available remedies.
The indenture governing the 2022 Notes prohibits the Refining Partnership from making distributions to its unitholders if any default or event of default (as defined in the indenture) exists. In addition, the indenture limits the Refining Partnership's ability to pay distributions to unitholders. The covenants will apply differently depending on the Refining Partnership's fixed charge coverage ratio (as defined in the indenture). If the fixed charge coverage ratio is not less than 2.5 to 1.0, the Refining Partnership will generally be permitted to make restricted payments, including distributions to its unitholders, without substantive restriction. If the fixed charge coverage ratio is less than 2.5 to 1.0, the Refining Partnership will generally be permitted to make restricted payments, including distributions to its unitholders, up to an aggregate $100.0 million basket plus certain other amounts referred to as "incremental funds" under the indenture. The Refining Partnership was in compliance with the covenants as of December 31, 2015, and the ratio was satisfied (not less than 2.5 to 1.0).
Amended and Restated Asset Based (ABL) Credit Facility. On December 20, 2012, CRLLC and certain subsidiaries (collectively, the "Credit Parties") entered into the Amended and Restated ABL Credit Facility with Wells Fargo Bank, National Association, as administrative agent and collateral agent for a syndicate of lenders. The Amended and Restated ABL Credit Facility replaced our prior ABL credit facility. Under the Amended and Restated ABL Credit Facility, the Refining Partnership assumed our position as borrower and our obligations under the Amended and Restated ABL Credit Facility upon the closing of the Refining Partnership IPO on January 23, 2013. The Amended and Restated ABL Credit Facility is a $400.0 million asset-based revolving credit facility, with sub-limits for letters of credit and swing line loans of $360.0 million and $40.0 million, respectively. The Amended and Restated ABL Credit Facility also includes a $200.0 million uncommitted incremental facility. The Amended and Restated ABL Credit Facility permits the payment of distributions, subject to the following conditions: (i) no default or event of default exists, (ii) excess availability and projected excess availability at all times during the three-month period following the distribution exceeds 20% of the lesser of the borrowing base and the total commitments; provided, that, if excess availability and projected excess availability for the six-month period following the distribution is greater than 25% at all times, then the following condition in clause (iii) will not apply, and (iii) the fixed charge coverage ratio for the immediately preceding twelve-month period shall be equal to or greater than 1.10 to 1.00. The Amended and Restated ABL Credit Facility has a five-year maturity and may be used for working capital and other general corporate purposes (including permitted acquisitions).
Borrowings under the Amended and Restated ABL Credit Facility bear interest at either a base rate or LIBOR plus an applicable margin. The applicable margin is (i) (a) 1.75% for LIBOR borrowings and (b) 0.75% for prime rate borrowings, in each case if quarterly average excess availability exceeds 50% of the lesser of the borrowing base and the total commitments
86
and (ii) (a) 2.00% for LIBOR borrowings and (b) 1.00% for prime rate borrowings, in each case if quarterly average excess availability is less than or equal to 50% of the lesser of the borrowing base and the total commitments. The Amended and Restated ABL Credit Facility also requires the payment of customary fees, including an unused line fee of (i) 0.40% if the daily average amount of loans and letters of credit outstanding is less than 50% of the lesser of the borrowing base and the total commitments and (ii) 0.30% if the daily average amount of loans and letters of credit outstanding is equal to or greater than 50% of the lesser of the borrowing base and the total commitments. The Refining Partnership is also required to pay customary letter of credit fees equal to, for standby letters of credit, the applicable margin on LIBOR loans on the maximum amount available to be drawn under and, for commercial letters of credit, the applicable margin on LIBOR loans less 0.50% on the maximum amount available to be drawn under, and customary facing fees equal to 0.125% of the face amount of, each letter of credit.
The Amended and Restated ABL Credit Facility also contains customary covenants for a financing of this type that limit the ability of the Credit Parties and their subsidiaries to, among other things, incur liens, engage in a consolidation, merger, purchase or sale of assets, pay dividends, incur indebtedness, make advances, investment and loans, enter into affiliate transactions, issue equity interests, or create subsidiaries and unrestricted subsidiaries. The amended and restated facility also contains a fixed charge coverage ratio financial covenant, as defined under the facility. The Refining Partnership was in compliance with the covenants of the Amended and Restated ABL Credit Facility as of December 31, 2015.
Old Senior Secured Notes. On April 6, 2010, CRLLC and its then wholly-owned subsidiary, Coffeyville Finance completed the private offering of $225.0 million aggregate principal amount of Old Second Lien Notes. We redeemed all outstanding Old Second Lien Notes on January 23, 2013, following the closing of the Refining Partnership IPO, with a combination of proceeds from the Refining Partnership IPO and cash on hand.
Nitrogen Fertilizer Partnership Credit Facility. On April 13, 2011, CRNF, as borrower, and the Nitrogen Fertilizer Partnership, as guarantor, entered into a credit facility (the "Nitrogen Fertilizer Partnership credit facility") with a group of lenders including Goldman Sachs Lending Partners LLC, as administrative and collateral agent. The Nitrogen Fertilizer Partnership credit facility includes a term loan facility of $125.0 million and a revolving credit facility of $25.0 million with an uncommitted incremental facility of up to $50.0 million. There is no scheduled amortization and the Nitrogen Fertilizer Partnership credit facility matures in April 2016, as discussed above.
Borrowings under the Nitrogen Fertilizer Partnership credit facility bear interest based on a pricing grid determined by the trailing four quarter leverage ratio. The initial pricing for Eurodollar rate loans under the Nitrogen Fertilizer Partnership credit facility is the Eurodollar rate plus a margin of 3.50%, or for base rate loans, the prime rate plus 2.50%. Under its terms, the lenders under the Nitrogen Fertilizer Partnership credit facility were granted a perfected, first priority security interest (subject to certain customary exceptions) in substantially all of the assets of CRNF and the Nitrogen Fertilizer Partnership and all of the capital stock of CRNF and each domestic subsidiary owned by the Nitrogen Fertilizer Partnership or CRNF. CRNF is the borrower under the Nitrogen Fertilizer Partnership credit facility. All obligations under the Nitrogen Fertilizer Partnership credit facility are unconditionally guaranteed by the Nitrogen Fertilizer Partnership and substantially all of its future, direct and indirect, domestic subsidiaries. Borrowings under the credit facility are non-recourse to the Company and its direct subsidiaries.
As of December 31, 2015, no amounts were drawn under the Nitrogen Fertilizer Partnership's $25.0 million revolving credit facility.
An event of default under the Nitrogen Fertilizer Partnership credit facility will be triggered if CVR Energy or any of its subsidiaries (other than the Nitrogen Fertilizer Partnership and CRNF) terminates or violates any of its covenants in any of the intercompany agreements between the Nitrogen Fertilizer Partnership and CVR Energy and its subsidiaries (other than the Nitrogen Fertilizer Partnership and CRNF) and such action has a material adverse effect on the Nitrogen Fertilizer Partnership. If an event of default occurs, the administrative agent under the Nitrogen Fertilizer Partnership credit facility would be entitled to take various actions, including the acceleration of amounts due under the credit facility and all actions permitted to be taken by a secured creditor.
Nitrogen Fertilizer Partnership Interest Rate Swaps
The Nitrogen Fertilizer Partnership has determined that the two interest rate swap agreements entered into in 2011 qualify for hedge accounting treatment. The impact recorded for each of the years ended December 31, 2015, 2014 and 2013 was $1.1 million, in additional interest expense. For the years ended December 31, 2015, 2014 and 2013, the Nitrogen Fertilizer Partnership recorded a decrease in fair market value on the interest rate swaps of $0.1 million, $0.2 million and $0.2 million, respectively, which was unrealized in accumulated other comprehensive income (loss) ("AOCI"). The combined fair market
87
value of the interest rate swaps recorded in other current liabilities on the Consolidated Balance Sheets at December 31, 2015 is not material. This amount is unrealized and, therefore, included in AOCI.
Capital Spending
We divide the petroleum business and the nitrogen fertilizer business' capital spending needs into two categories: maintenance and growth. Maintenance capital spending includes only non-discretionary maintenance projects and projects required to comply with environmental, health and safety regulations. We undertake discretionary capital spending based on the expected return on incremental capital employed. Discretionary capital projects generally involve an expansion of existing capacity, improvement in product yields, and/or a reduction in direct operating expenses. Major scheduled turnaround expenses are expensed when incurred.
The following table summarizes our total actual capital expenditures for 2015 and current estimated capital expenditures in 2016 by operating segment and major category. These estimates may change as a result of unforeseen circumstances or a change in our plans, and amounts may not be spent in the manner allocated below:
Year Ended December 31, | |||||||
2015 Actual | 2016 Estimate | ||||||
(in millions) | |||||||
(unaudited) | |||||||
Petroleum Business (the Refining Partnership): | |||||||
Coffeyville refinery: | |||||||
Maintenance | $ | 69.7 | $ | 60.0 | |||
Growth | 73.2 | 50.0 | |||||
Coffeyville refinery total capital excluding major scheduled turnaround expenses | 142.9 | 110.0 | |||||
Wynnewood refinery: | |||||||
Maintenance | 25.6 | 40.0 | |||||
Growth | 6.4 | 6.0 | |||||
Wynnewood refinery total capital excluding major scheduled turnaround expenses | 32.0 | 46.0 | |||||
Other Petroleum: | |||||||
Maintenance | 8.1 | 20.0 | |||||
Growth | 11.7 | 24.0 | |||||
Other petroleum total capital excluding major scheduled turnaround expenses | 19.8 | 44.0 | |||||
Petroleum business total capital excluding major scheduled turnaround expenses | 194.7 | 200.0 | |||||
Nitrogen Fertilizer Business (the Nitrogen Fertilizer Partnership): | |||||||
Maintenance | 9.5 | 7.0 | |||||
Growth | 7.5 | 3.0 | |||||
Nitrogen fertilizer business total capital excluding major scheduled turnaround expenses | 17.0 | 10.0 | |||||
Corporate | 7.0 | 10.0 | |||||
Total capital spending excluding major scheduled turnaround expenses | $ | 218.7 | $ | 220.0 | |||
The petroleum business' and the nitrogen fertilizer business' estimated capital expenditures are subject to change due to unanticipated increases in the cost, scope and completion time for capital projects. For example, they may experience increases in labor or equipment costs necessary to comply with government regulations or to complete projects that sustain or improve the profitability of the refineries or nitrogen fertilizer plant. Capital spending for the Nitrogen Fertilizer Partnership's nitrogen fertilizer business and the Refining Partnership's petroleum business is determined by each partnership's respective board of directors of its general partner.
In October 2014, the board of directors of the general partner of the Refining Partnership approved the construction of a hydrogen plant at the Coffeyville refinery. The hydrogen plant will increase the overall plant liquid volume recovery and provide additional hydrogen that is needed for environmental compliance. The estimated cost of this project, excluding capitalized interest, is approximately $122.5 million with an anticipated completion date in the second quarter of 2016. As of
88
December 31, 2015, the Refining Partnership had incurred costs of approximately $77.7 million, excluding capitalized interest, for the hydrogen plant.
During 2015, the Refining Partnership constructed two crude oil storage tanks in Cushing, Oklahoma, which provide the petroleum business with an additional 0.5 million barrels of crude storage capacity. The tanks became operational in October 2015. As of December 31, 2015, the Refining Partnership had incurred costs of approximately $9.8 million, excluding capitalized interest, for the crude oil storage tanks. The total cost of this project, excluding capitalized interest, is expected to be approximately $11.0 million to $12.0 million.
Cash Flows
The following table sets forth our consolidated cash flows for the periods indicated below:
Year Ended December 31, | |||||||||||
2015 | 2014 | 2013 | |||||||||
(in millions) | |||||||||||
Net cash provided by (used in): | |||||||||||
Operating activities | $ | 536.8 | $ | 640.3 | $ | 440.1 | |||||
Investing activities | (150.6 | ) | (296.6 | ) | (250.3 | ) | |||||
Financing activities | (374.8 | ) | (432.1 | ) | (243.7 | ) | |||||
Net increase (decrease) in cash and cash equivalents | $ | 11.4 | $ | (88.4 | ) | $ | (53.9 | ) | |||
Cash Flows Provided by Operating Activities
For purposes of this cash flow discussion, we define trade working capital as accounts receivable, inventory and accounts payable. Other working capital is defined as all other current assets and liabilities except trade working capital.
Net cash flows provided by operating activities for the year ended December 31, 2015 were $536.8 million. The positive cash flow from operating activities generated over this period was primarily driven by $297.8 million of net income before noncontrolling interest and favorable impacts to trade working capital and other working capital. Trade working capital for the year ended December 31, 2015 resulted in a net cash inflow of $66.4 million, which was attributable to decreases in accounts receivable ($41.0 million) and inventory ($39.7 million), partially offset by a decrease in accounts payable ($14.3 million). Each of the cash flow impacts in trade working capital were largely attributable to the crude oil pricing environment and significant decreases in sales prices for gasoline and distillates at the petroleum business in 2015 as compared to 2014. Other working capital activities resulted in net cash inflow of $14.8 million, which was primarily related to decreases in prepaid expenses and other current assets ($40.4 million) and due from parent ($32.8 million), partially offset by decreases in other current liabilities ($52.1 million) and deferred revenue ($10.5 million). The decrease in prepaid expenses and other current assets was primarily due to the sale of trading securities, the timing of payments associated with the petroleum business' crude oil intermediation agreement and a reduction in prepaid insurance. The decrease in due from parent was the result of the timing and application of overpayments to AEPC under the Tax Allocation Agreement. The decrease in other current liabilities was primarily attributable to a decrease in the biofuel blending obligation at the petroleum business as a result of increased RINs purchases during the year ended December 31, 2015 to fulfill the petroleum business' requirements under the RFS. The decrease in deferred revenue was primarily attributable to lower market demand for prepaid contracts at the nitrogen fertilizer business for the year ended December 31, 2015 compared to the year ended December 31, 2014.
Net cash flows provided by operating activities for the year ended December 31, 2014 were $640.3 million. The positive cash flow from operating activities generated over this period was primarily driven by $309.4 million of net income before noncontrolling interest and favorable impacts to trade working capital of $211.2 million, partially offset by an unfavorable impact to other working capital of $6.3 million. Trade working capital for the year ended December 31, 2014 resulted in a net cash inflow of $211.2 million, which was attributable to decreases in inventory ($197.3 million) and accounts receivable ($105.7 million), partially offset by a decrease in accounts payable ($91.8 million). Each of the cash flow impacts in trade working capital were largely attributable to the crude oil pricing environment and significant reduction in pricing during the fourth quarter of 2014. The favorable trade working capital impacts for inventory and accounts receivable resulted from higher product prices and crude oil prices at the end of 2013 as compared to the end of 2014. These favorable trade working capital impacts were partially offset by the decrease in accounts payable at the petroleum business as a result of payables related to crude purchases based on higher crude oil prices at the end of 2013 as compared to the end of 2014, as well as payments for a judgment in an on-going litigation matter during 2014. Other working capital activities resulted in net cash outflow of $6.3
89
million, which was primarily related to an increase in the due (to) from parent ($44.6 million), partially offset by an increase in other current liabilities ($15.0 million), an increase in deferred revenue ($12.9 million) and a decrease in prepaid expenses and other current assets ($10.7 million). The increase in due to (from) parent was the result of overpayments to AEPC under the Tax Allocation Agreement. The increase in other current liabilities was primarily attributable to an increase in accruals related to the biofuel blending obligation as a result of higher RINs prices as of December 31, 2014 as compared to the prior year. The increase in deferred revenue was primarily attributable to higher market demand for prepaid contracts at the nitrogen fertilizer business for the year ended December 31, 2014 compared to the prior period. The decrease in prepaid expenses and other current assets was primarily due to a reduction in prepaid insurance and the timing of payments related to certain other prepaid items.
Net cash flows provided by operating activities for the year ended December 31, 2013 were $440.1 million. The positive cash flow from operating activities generated over this period was primarily driven by $522.0 million of net income before noncontrolling interest, partially offset by unfavorable impacts to trade working capital $67.4 million and other working capital $53.2 million. Trade working capital for the year ended December 31, 2013 resulted in a net cash outflow of $67.4 million, which was primarily attributable to an increase in accounts receivable ($30.2 million) and a decrease in accounts payable of ($38.7 million). The increase in accounts receivable primarily resulted from increased sales volumes at the petroleum business as compared to the end of 2012 due to the turnaround at the Wynnewood refinery completed in the fourth quarter of 2012. The decrease in accounts payable was largely the result of a decrease in amounts payable related to the turnaround completed at the Wynnewood refinery in the fourth quarter of 2012, partially offset by increased payables for leased crude purchases due to increased crude gathering capacity and timing of payments. Other working capital activities resulted in net cash outflow of $53.2 million, which was primarily related to an increase in prepaid expenses and other current assets ($28.7 million) and a decrease in other current liabilities ($26.7 million), partially offset by an increase in due (to) from parent ($9.1 million). The increase in prepaid expenses and other current assets was primarily due to timing of settlements associated with the petroleum business' crude oil intermediation agreement. The decrease in other current liabilities was primarily attributable to a decrease in liabilities related to share-based compensation, property taxes and interest on borrowings as compared to the prior year-end.
Cash Flows Used In Investing Activities
Net cash used in investing activities for the year ended December 31, 2015 was $150.6 million compared to $296.6 million for the year ended December 31, 2014. The decrease of $146.0 million was the result of decreased purchases of available-for-sale securities ($78.3 million) and proceeds received from the sale of available-for-sale securities ($68.0 million) for the year ended December 31, 2015. Capital spending remained relatively consistent for the year ended December 31, 2015 compared to the year ended December 31, 2014.
Net cash used in investing activities for the year ended December 31, 2014 was $296.6 million compared to $250.3 million for the year ended December 31, 2013. The increase in cash used in investing activities was primarily the result of purchases of held available-for-sale securities during the year ended December 31, 2014, partially offset by a $38.1 million decrease in capital spending. The decrease in capital spending was primarily the result of decreases in nitrogen fertilizer capital expenditures of approximately $22.7 million following the completion of the UAN expansion project in February 2013.
Cash Flows Used In Financing Activities
Net cash used in financing activities for the year ended December 31, 2015 was approximately $374.8 million. The net cash used in financing activities for the year ended December 31, 2015 was primarily attributable to dividend payments to common stockholders of $173.7 million and distributions to the Refining Partnership and Nitrogen Fertilizer Partnership common unitholders of $199.7 million.
Net cash used in financing activities for the year ended December 31, 2014 was approximately $432.1 million. The net cash used in financing activities for the year ended December 31, 2014 was primarily attributable to dividend payments to common stockholders of $434.2 million, distributions to the Refining Partnership and Nitrogen Fertilizer Partnership common unitholders of $184.9 million, partially offset by proceeds of $188.3 million from the Refining Partnership's Second Underwritten Offering.
Net cash used in financing activities for the year ended December 31, 2013 was approximately $243.7 million. The net cash used in financing activities for the year ended December 31, 2013 was primarily attributable to dividend payments of $1,237.3 million, distributions to the Refining Partnership and Nitrogen Fertilizer Partnership common unitholders of $164.2 million and payments to extinguish the Second Lien Notes of $243.4 million, largely offset by proceeds from CVR Refining's initial public offering of $655.7 million, proceeds from CVR Refining's Underwritten Offering of $393.6 million, proceeds
90
from CVR Energy's sale of CVR Refining's units to AEPC of $61.5 million and proceeds from the Secondary Offering of CVR Partners' common units of $292.6 million.
As of and for the year ended December 31, 2015, there were no borrowings or repayments under the Amended and Restated ABL credit facility or the Nitrogen Fertilizer Partnership revolving credit facility.
Capital and Commercial Commitments
In addition to long-term debt, we are required to make payments relating to various types of obligations. The following table summarizes our minimum payments as of December 31, 2015 relating to long-term debt outstanding, operating leases, capital lease obligations, unconditional purchase obligations and other specified capital and commercial commitments for the five-year period following December 31, 2015 and thereafter.
Payments Due by Period | |||||||||||||||||||||||||||
Total | 2016 | 2017 | 2018 | 2019 | 2020 | Thereafter | |||||||||||||||||||||
(in millions) | |||||||||||||||||||||||||||
Contractual Obligations | |||||||||||||||||||||||||||
Long-term debt(1) | $ | 625.0 | $ | 125.0 | $ | — | $ | — | $ | — | $ | — | $ | 500.0 | |||||||||||||
Operating leases(2) | 23.5 | 8.0 | 5.5 | 3.9 | 2.1 | 1.5 | 2.5 | ||||||||||||||||||||
Capital lease obligations(3) | 48.5 | 1.6 | 1.9 | 2.1 | 2.3 | 2.6 | 38.0 | ||||||||||||||||||||
Unconditional purchase obligations(4) | 1,349.6 | 141.0 | 125.6 | 124.3 | 123.5 | 107.8 | 727.4 | ||||||||||||||||||||
Environmental liabilities(5) | 3.7 | 2.0 | 0.5 | 0.5 | 0.1 | 0.1 | 0.5 | ||||||||||||||||||||
Interest payments(6) | 270.1 | 38.7 | 37.1 | 36.9 | 36.7 | 36.4 | 84.3 | ||||||||||||||||||||
Total | $ | 2,320.4 | $ | 316.3 | $ | 170.6 | $ | 167.7 | $ | 164.7 | $ | 148.4 | $ | 1,352.7 | |||||||||||||
Other Commercial Commitments | |||||||||||||||||||||||||||
Standby letters of credit(7) | $ | 27.8 | $ | — | $ | — | $ | — | $ | — | $ | — | $ | — | |||||||||||||
_______________________________________
(1) | Consists of the 2022 Notes and the Nitrogen Fertilizer Partnership's term loan facility outstanding as of December 31, 2015. The Nitrogen Fertilizer Partnership's term loan facility matures in April 2016. Refer to Note 9 ("Long-Term Debt") to Part II, Item 8 of this Report for further discussion. |
(2) | The Refining Partnership and the Nitrogen Fertilizer Partnership lease various facilities and equipment, including railcars and real property, under operating leases for various periods. |
(3) | The amount includes commitments under capital lease arrangements for two leases associated with pipelines and storage and terminal equipment at the Wynnewood refinery. |
(4) | The amount includes (a) commitments under several agreements for the petroleum operations related to pipeline usage, petroleum products storage and petroleum transportation, (b) commitments under an electric supply agreement with the city of Coffeyville, (c) a product supply agreement with Linde, (d) a pet coke supply agreement with HollyFrontier Corporation with a term ending in December 2016, (e) commitments related to our biofuels blending obligation and (f) approximately $781.5 million payable ratably over fifteen years pursuant to petroleum transportation service agreements between CRRM and each of TransCanada Keystone Pipeline Limited Partnership and TransCanada Keystone Pipeline, LP (together, "TransCanada"). The purchase obligation reflects the exchange rate between the Canadian dollar and the U.S. dollar as of December 31, 2015, where applicable. Under the agreements, CRRM receives transportation of at least 25,000 barrels per day of crude oil with a delivery point at Cushing, Oklahoma for a term of twenty years on TransCanada's Keystone pipeline system. The petroleum business began receiving crude oil under the agreements in the first quarter of 2011. |
(5) | Environmental liabilities represents our estimated payments required by federal and/or state environmental agencies related to closure of hazardous waste management units at our sites in Coffeyville and Phillipsburg, Kansas and Wynnewood, Oklahoma. We also are required to make payments with respect to other environmental liabilities which are not contractual obligations but which would be necessary for our continued operations. See "Business — Environmental Matters." |
91
(6) | Interest payments are based on stated interest rates for our long-term debt outstanding and interest payments for the capital lease obligations as of December 31, 2015. |
(7) | Standby letters of credit issued against our Amended and Restated ABL Credit Facility include $0.2 million of letters of credit issued in connection with environmental liabilities, $26.7 million in letters of credit to secure transportation services for crude oil and a $0.9 million letter of credit issued to guarantee a portion of our insurance policy. |
The Refining Partnership's and the Nitrogen Fertilizer Partnership's ability to make payments on and to refinance their indebtedness, to fund budgeted capital expenditures and to satisfy their other capital and commercial commitments will depend on their respective independent abilities to generate cash flow in the future. Their ability to refinance their respective indebtedness is also subject to the availability of the credit markets, which in recent periods have been extremely volatile. This, to a certain extent, is subject to refining spreads (for the Refining Partnership), fertilizer margins (for the Nitrogen Fertilizer Partnership) and general economic, financial, competitive, legislative, regulatory and other factors they are unable to control. Our businesses may not generate sufficient cash flow from operations, and future borrowings may not be available to the Nitrogen Fertilizer Partnership under its revolving credit facility or any replacement credit facility or to the Refining Partnership under the Amended and Restated ABL Credit Facility (or other credit facilities our businesses may enter into in the future) in an amount sufficient to enable them to pay indebtedness or to fund other liquidity needs. They may seek to sell assets to fund liquidity needs but may not be able to do so. They may also need to refinance all or a portion of their indebtedness on or before maturity, and may not be able to refinance such indebtedness on commercially reasonable terms or at all.
Off-Balance Sheet Arrangements
We do not have any "off-balance sheet arrangements" as such term is defined within the rules and regulations of the SEC.
Recent Accounting Pronouncements
Refer to Part II, Item 8, Note 2 ("Summary of Significant Accounting Policies"), of this Report for a discussion of recent accounting pronouncements applicable to us.
Critical Accounting Policies
We prepare our consolidated financial statements in accordance with GAAP. In order to apply these principles, management must make judgments, assumptions and estimates based on the best available information at the time. Actual results may differ based on the accuracy of the information utilized and subsequent events. Our accounting policies are described in the notes to our audited consolidated financial statements included elsewhere in this Report. Our critical accounting policies, which are described below, could materially affect the amounts recorded in our consolidated financial statements.
Goodwill
To comply with Accounting Standards Codification ("ASC") Topic 350, Intangibles — Goodwill and Other ("ASC 350"), we perform a test for goodwill impairment annually, or more frequently in the event we determine that a triggering event has occurred. Our annual testing is performed as of November 1 each year. In accordance with ASC 350, we identified our reporting units based upon our two key operating segments. These reporting units are our petroleum and nitrogen fertilizer segments. For 2015, 2014 and 2013, the nitrogen fertilizer segment was the only reporting unit that had goodwill.
In accordance with ASC 350, the nitrogen fertilizer segment may elect to perform a qualitative assessment to determine whether the two-step quantitative impairment test is required. If the nitrogen fertilizer segment elects to perform a qualitative assessment, the two-step impairment test is required only if the nitrogen fertilizer segment concludes that it is more likely than not that the reporting unit's fair value is less than its carrying amount. For the years ended December 31, 2015 and 2014, the nitrogen fertilizer segment elected to perform a qualitative assessment.
The nitrogen fertilizer segment began the qualitative assessment by analyzing the key drivers and other external factors that impact the business in order to determine if any significant events, transactions or other factors had occurred or are expected to occur that would impair earnings or competitiveness, thereby impairing the fair value of the nitrogen fertilizer segment. After assessing the totality of events and circumstances, it was determined that it was not more likely than not that the fair value of the nitrogen fertilizer segment was less than the carrying value, and so it was not necessary to perform the two-step valuation. The key drivers that were considered in the evaluation of the nitrogen fertilizer segment's fair value included:
92
• | general economic conditions; |
• | fertilizer pricing; |
• | input costs; |
• | liquidity and capital resources; and |
• | customer outlook. |
Long-Lived Assets
We calculate depreciation and amortization on a straight-line basis over the estimated useful lives of the various classes of depreciable assets. When assets are placed in service, we make estimates of what we believe are their reasonable useful lives. We account for impairment of long-lived assets in accordance with ASC Topic 360, Property, Plant and Equipment — Impairment or Disposal of Long-Lived Assets ("ASC 360"). In accordance with ASC 360, we review long-lived assets (excluding goodwill, intangible assets with indefinite lives, and deferred tax assets) for impairment whenever events or changes in circumstances indicate that the carrying amount of an asset may not be recoverable. Recoverability of assets to be held and used is measured by a comparison of the carrying amount of an asset to estimated undiscounted future net cash flows expected to be generated by the asset. If the carrying amount of an asset exceeds its estimated undiscounted future net cash flows, an impairment charge is recognized for the amount by which the carrying amount of the assets exceeds their fair value. Assets to be disposed of are reported at the lower of their carrying value or fair value less cost to sell. No impairment charges were recognized for any of the periods presented.
Derivative Instruments and Fair Value of Financial Instruments
The petroleum business uses futures contracts, options, and forward contracts primarily to reduce exposure to changes in crude oil prices and finished goods product prices to provide economic hedges of inventory positions. Although management considers these derivatives economic hedges, these derivative instruments do not qualify as hedges for hedge accounting purposes under ASC Topic 815, Derivatives and Hedging ("ASC 815"), and accordingly are recorded at fair value in the balance sheet. Changes in the fair value of these derivative instruments are recorded into earnings as a component of other income (expense) in the period of change. The estimated fair values of forward and swap contracts are based on quoted market prices and assumptions for the estimated forward yield curves of related commodities in periods when quoted market prices are unavailable. The petroleum business recorded net gains (losses) from derivative instruments of $(28.6) million, $185.6 million and $57.1 million for the years ended December 31, 2015, 2014 and 2013, respectively.
The nitrogen fertilizer business uses forward swap contracts primarily to reduce the exposure to changes in interest rates on its debt and to provide a cash flow hedge. These derivative instruments have been designated as hedges for accounting purposes. Accordingly, these instruments are recorded at fair value in the Consolidated Balance Sheets, at each reporting period end. The actual measurement of the cash flow hedge ineffectiveness is recognized in earnings, if applicable. The effective portion of the gain or loss on the swaps is reported in AOCI, in accordance with ASC 815.
Other financial instruments consisting of cash and cash equivalents, accounts receivable, and accounts payable are carried at cost, which approximates fair value, as a result of the short-term nature of the instruments.
Share-Based Compensation
We account for share-based compensation in accordance with ASC Topic 718, Compensation — Stock Compensation ("ASC 718"). ASC 718 requires that compensation costs relating to share-based payment transactions be recognized in a company's financial statements. ASC 718 applies to transactions in which an entity exchanges its equity instruments for goods or services and also may apply to liabilities an entity incurs for goods or services that are based on the fair value of those equity instruments. Total share-based compensation expense for the years ended December 31, 2015, 2014 and 2013 was $12.8 million, $12.3 million and $18.4 million, respectively.
Income Taxes
We provide for income taxes in accordance with ASC Topic 740, Income Taxes, accounting for uncertainty in income taxes. We record deferred tax assets and liabilities to account for the expected future tax consequences of events that have been recognized in our financial statements and our tax returns. We routinely assess the realizability of our deferred tax assets and if
93
we conclude that it is more likely than not that some portion or all of the deferred tax assets will not be realized, the deferred tax asset would be reduced by a valuation allowance. We consider future taxable income in making such assessments which requires numerous judgments and assumptions. We record contingent income tax liabilities, interest and penalties, based on our estimate as to whether, and the extent to which, additional taxes may be due.
Item 7A. Quantitative and Qualitative Disclosures About Market Risk
The risk inherent in our market risk sensitive instruments and positions is the potential loss from adverse changes in commodity prices and interest rates. None of our market risk sensitive instruments are held for trading.
Commodity Price Risk
The petroleum business, as a manufacturer of refined petroleum products, and the nitrogen fertilizer business, as a manufacturer of nitrogen fertilizer products, all of which are commodities, have exposure to market pricing for products sold in the future. In order to realize value from our processing capacity, a positive spread between the cost of raw materials and the value of finished products must be achieved (i.e., gross margin or crack spread). The physical commodities that comprise our raw materials and finished goods are typically bought and sold at a spot or index price that can be highly variable.
The petroleum business uses a crude oil purchasing intermediary, Vitol, to purchase the majority of its non-gathered crude oil inventory for the refineries, which allows it to take title to and price its crude oil at locations in close proximity to the refineries, as opposed to the crude oil origination point, reducing its risk associated with volatile commodity prices by shortening the commodity conversion cycle time. The commodity conversion cycle time refers to the time elapsed between raw material acquisition and the sale of finished goods. In addition, the petroleum business seeks to reduce the variability of commodity price exposure by engaging in hedging strategies and transactions that will serve to protect gross margins as forecasted in the annual operating plan. Accordingly, the petroleum business uses commodity derivative contracts to economically hedge future cash flows (i.e., gross margin or crack spreads) and product inventories. With regard to its hedging activities, the petroleum business may enter into, or have entered into, derivative instruments which serve to:
• | lock in or fix a percentage of the anticipated or planned gross margin in future periods when the derivative market offers commodity spreads that generate positive cash flows; |
• | hedge the value of inventories in excess of minimum required inventories; and |
• | manage existing derivative positions related to a change in anticipated operations and market conditions. |
Further, the petroleum business intends to engage only in risk mitigating activities directly related to its businesses. The nitrogen fertilizer business has not historically hedged for commodity prices.
Basis Risk. The effectiveness of our derivative strategies is dependent upon the correlation of the price index utilized for the hedging activity and the cash or spot price of the physical commodity for which price risk is being mitigated. Basis risk is a term we use to define that relationship. Basis risk can exist due to several factors including time or location differences between the derivative instrument and the underlying physical commodity. Our selection of the appropriate index to utilize in a hedging strategy is a prime consideration in our basis risk exposure.
Examples of our basis risk exposure are as follows:
• | Time Basis — In entering over-the-counter swap agreements, the settlement price of the swap is typically the average price of the underlying commodity for a designated calendar period. This settlement price is based on the assumption that the underlying physical commodity will price ratably over the swap period. If the commodity does not move ratably over the periods, then weighted-average physical prices will be weighted differently than the swap price as the result of timing. |
• | Location Basis — In hedging NYMEX crack spreads, we experience location basis as the settlement of NYMEX refined products (related more to New York Harbor cash markets) which may be different than the prices of refined products in our Group 3 pricing area. |
94
Price and Basis Risk Management Activities.
In the event inventories exceed the petroleum business' target base level of inventories, it may enter into commodity derivative contracts to manage price exposure to inventory positions that are in excess of its base level. Excess inventories are typically the result of plant operations, such as a turnaround or other plant maintenance.
To reduce the basis risk between the price of products for Group 3 and that of the NYMEX associated with selling forward derivative contracts for NYMEX crack spreads, the petroleum business may enter into basis swap positions to lock the price difference. If the difference between the price of products on the NYMEX and Group 3 (or some other price benchmark as specified in the swap) is different than the value contracted in the swap, then it will receive from or owe to the counterparty the difference on each unit of product contracted in the swap, thereby completing the locking of its margin. An example of the petroleum business' use of a basis swap is in the winter heating oil season. The risk associated with not hedging the basis when using NYMEX forward contracts to fix future margins is if the crack spread increases based on prices traded on NYMEX while Group 3 pricing remains flat or decreases then we would be in a position to lose money on the derivative position while not earning an offsetting additional margin on the physical position based on the Group 3 pricing.
From time to time, the petroleum business also holds various NYMEX positions through a third-party clearing house. At December 31, 2015, the Refining Partnership had no open commodity positions. At December 31, 2015, the Refining Partnership's account balance maintained at the third-party clearing house totaled approximately $7.5 million, which is reflected on the Consolidated Balance Sheets in cash and cash equivalents. NYMEX transactions conducted for the year ended December 31, 2015 resulted in gain (loss) on derivatives, net of approximately $3.2 million.
The Refining Partnership enters into commodity swap contracts in order to fix the margin on a portion of future production. Additionally, the Refining Partnership may enter into price and basis swaps in order to fix the price on a portion of its commodity purchases and product sales. The physical volumes are not exchanged and these contracts are net settled with cash. The contract fair value of the commodity swaps is reflected on the Consolidated Balance Sheets with changes in fair value currently recognized in the Consolidated Statements of Operations. At December 31, 2015, the Refining Partnership had open commodity hedging instruments consisting of 2.5 million barrels of crack spreads primarily to fix the margin on a portion of its future distillate production. A change of $1.00 per barrel in the fair value of the crack spread swaps would result in an increase or decrease in the related fair values of commodity hedging instruments of $2.5 million. Additionally, at December 31, 2015, the Refining Partnership had open commodity hedging instruments consisting of 1.4 million barrels to fix the price on a portion of its future crude oil purchases and the basis on a portion of its future product sales. A change of $1.00 per barrel in the fair value of the benchmark crude or product basis would result in an increase or decrease in the related fair value of the commodity hedging instruments of $1.4 million. The fair value of the outstanding contracts at December 31, 2015 was a net unrealized gain of $44.6 million, comprised of short-term unrealized gains and losses.
Interest Rate Risk
As of December 31, 2015 and prior to the expiration of the interest rate swaps on February 12, 2016, the Nitrogen Fertilizer Partnership had exposure to interest rate risk on 50% of its $125.0 million floating rate term debt. A 1.0% increase over the Eurodollar floor spread of 3.5%, as specified in the credit agreement, would increase interest cost to the Nitrogen Fertilizer Partnership by approximately $625,000 on an annualized basis, thus decreasing net income by the same amount.
Subsequent to the expiration of the interest rate swaps on February 12, 2016, the Nitrogen Fertilizer Partnership has exposure to interest rate risk on 100% of its $125.0 million floating rate debt. A 1.0% increase over the Eurodollar floor spread of 3.5%, as specified in the credit agreement, would increase interest cost to the Nitrogen Fertilizer Partnership by approximately $1,250,000 on an annualized basis, thus decreasing net income by the same amount.
The credit facility expires on April 13, 2016. The Nitrogen Fertilizer Partnership is considering capital structure and refinancing options associated with the credit facility maturity. The credit facility is discussed in Note 9 ("Long-Term Debt") and the interest rate swap agreements are discussed in Note 15 ("Derivative Financial Instruments") to Part II, Item 8 of this Report.
95
Foreign Currency Exchange
Given that ours, the petroleum business' and the nitrogen fertilizer business' operations are based entirely in the United States, we are not significantly exposed to foreign currency exchange rate risk. A portion of the petroleum business' Canadian crude oil purchases are conducted in Canadian dollars. Commitments for future periods under this agreement reflect the exchange rate between the Canadian Dollar and the U.S. Dollar as of the end of the reporting period. Based on the short period of time between the delivery and settlement of purchases of crude oil in Canadian dollars, the exposure to foreign currency exchange rate risk and the resulting foreign currency gain (loss) is not material.
96
Item 8. Financial Statements and Supplementary Data
CVR Energy, Inc. and Subsidiaries
INDEX TO CONSOLIDATED FINANCIAL STATEMENTS
Audited Financial Statements: | Page Number |
97
Report of Independent Registered Public Accounting Firm
The Board of Directors and Stockholders of CVR Energy, Inc.
We have audited the accompanying consolidated balance sheets of CVR Energy, Inc. (a Delaware corporation) and subsidiaries (the "Company") as of December 31, 2015 and 2014, and the related consolidated statements of operations, comprehensive income, changes in equity, and cash flows for each of the three years in the period ended December 31, 2015. These financial statements are the responsibility of the Company's management. Our responsibility is to express an opinion on these financial statements based on our audits.
We conducted our audits in accordance with the standards of the Public Company Accounting Oversight Board (United States). Those standards require that we plan and perform the audit to obtain reasonable assurance about whether the financial statements are free of material misstatement. An audit includes examining, on a test basis, evidence supporting the amounts and disclosures in the financial statements. An audit also includes assessing the accounting principles used and significant estimates made by management, as well as evaluating the overall financial statement presentation. We believe that our audits provide a reasonable basis for our opinion.
In our opinion, the consolidated financial statements referred to above present fairly, in all material respects, the financial position of CVR Energy, Inc. and subsidiaries as of December 31, 2015 and 2014, and the results of their operations and their cash flows for each of the three years in the period ended December 31, 2015 in conformity with accounting principles generally accepted in the United States of America.
We also have audited, in accordance with the standards of the Public Company Accounting Oversight Board (United States), the Company's internal control over financial reporting as of December 31, 2015, based on criteria established in the 2013 Internal Control — Integrated Framework issued by the Committee of Sponsoring Organizations of the Treadway Commission (COSO), and our report dated February 19, 2016 expressed an unqualified opinion.
/s/ GRANT THORNTON LLP
Houston, Texas
February 19, 2016
98
Report of Independent Registered Public Accounting Firm
The Board of Directors and Stockholders of CVR Energy, Inc.
We have audited the internal control over financial reporting of CVR Energy, Inc. (a Delaware corporation) and subsidiaries (the "Company") as of December 31, 2015, based on criteria established in the 2013 Internal Control — Integrated Framework issued by the Committee of Sponsoring Organizations of the Treadway Commission (COSO). The Company's management is responsible for maintaining effective internal control over financial reporting and for its assessment of the effectiveness of internal control over financial reporting, included in the accompanying Management's Report On Internal Control Over Financial Reporting under Item 9A. Our responsibility is to express an opinion on the Company's internal control over financial reporting based on our audit.
We conducted our audit in accordance with the standards of the Public Company Accounting Oversight Board (United States). Those standards require that we plan and perform the audit to obtain reasonable assurance about whether effective internal control over financial reporting was maintained in all material respects. Our audit included obtaining an understanding of internal control over financial reporting, assessing the risk that a material weakness exists, testing and evaluating the design and operating effectiveness of internal control based on the assessed risk, and performing such other procedures as we considered necessary in the circumstances. We believe that our audit provides a reasonable basis for our opinion.
A company's internal control over financial reporting is a process designed to provide reasonable assurance regarding the reliability of financial reporting and the preparation of financial statements for external purposes in accordance with generally accepted accounting principles. A company's internal control over financial reporting includes those policies and procedures that (1) pertain to the maintenance of records that, in reasonable detail, accurately and fairly reflect the transactions and dispositions of the assets of the company; (2) provide reasonable assurance that transactions are recorded as necessary to permit preparation of financial statements in accordance with generally accepted accounting principles, and that receipts and expenditures of the company are being made only in accordance with authorizations of management and directors of the company; and (3) provide reasonable assurance regarding prevention or timely detection of unauthorized acquisition, use, or disposition of the company's assets that could have a material effect on the financial statements.
Because of its inherent limitations, internal control over financial reporting may not prevent or detect misstatements. Also, projections of any evaluation of effectiveness to future periods are subject to the risk that controls may become inadequate because of changes in conditions, or that the degree of compliance with the policies or procedures may deteriorate.
In our opinion, the Company maintained, in all material respects, effective internal control over financial reporting as of December 31, 2015, based on criteria established in the 2013 Internal Control — Integrated Framework issued by COSO.
We also have audited, in accordance with the standards of the Public Company Accounting Oversight Board (United States), the consolidated financial statements of the Company as of and for the year ended December 31, 2015, and our report dated February 19, 2016 expressed an unqualified opinion on those financial statements.
/s/ GRANT THORNTON LLP
Houston, Texas
February 19, 2016
99
CVR Energy, Inc. and Subsidiaries
CONSOLIDATED BALANCE SHEETS
December 31, | |||||||
2015 | 2014 | ||||||
(in millions, except share data) | |||||||
ASSETS | |||||||
Current assets: | |||||||
Cash and cash equivalents | $ | 765.1 | $ | 753.7 | |||
Accounts receivable, net of allowance for doubtful accounts of $0.3 and $0.4, respectively | 95.8 | 136.7 | |||||
Inventories | 289.9 | 329.6 | |||||
Prepaid expenses and other current assets | 105.4 | 174.7 | |||||
Income tax receivable | 6.9 | 11.1 | |||||
Deferred income taxes | — | 6.3 | |||||
Due from parent | 11.6 | 44.5 | |||||
Total current assets | 1,274.7 | 1,456.6 | |||||
Property, plant, and equipment, net of accumulated depreciation | 1,967.1 | 1,916.0 | |||||
Intangible assets, net | 0.2 | 0.2 | |||||
Goodwill | 41.0 | 41.0 | |||||
Deferred financing costs, net | 6.2 | 8.4 | |||||
Other long-term assets | 16.6 | 40.3 | |||||
Total assets | $ | 3,305.8 | $ | 3,462.5 | |||
LIABILITIES AND EQUITY | |||||||
Current liabilities: | |||||||
Note payable and capital lease obligations | $ | 1.6 | $ | 1.4 | |||
Current portion of long-term debt | 125.0 | — | |||||
Accounts payable | 261.5 | 275.0 | |||||
Personnel accruals | 45.7 | 38.3 | |||||
Accrued taxes other than income taxes | 23.5 | 26.7 | |||||
Deferred revenue | 3.1 | 13.6 | |||||
Other current liabilities | 24.4 | 68.6 | |||||
Total current liabilities | 484.8 | 423.6 | |||||
Long-term liabilities: | |||||||
Long-term debt and capital lease obligations, net of current portion | 546.9 | 673.5 | |||||
Deferred income taxes | 639.7 | 638.3 | |||||
Other long-term liabilities | 33.9 | 51.8 | |||||
Total long-term liabilities | 1,220.5 | 1,363.6 | |||||
Commitments and contingencies | |||||||
Equity: | |||||||
CVR stockholders' equity: | |||||||
Common stock $0.01 par value per share, 350,000,000 shares authorized, 86,929,660 shares issued | 0.9 | 0.9 | |||||
Additional paid-in-capital | 1,174.7 | 1,174.7 | |||||
Retained deficit | (189.2 | ) | (184.9 | ) | |||
Treasury stock, 98,610 shares at cost | (2.3 | ) | (2.3 | ) | |||
Accumulated other comprehensive loss, net of tax | — | (0.3 | ) | ||||
Total CVR stockholders' equity | 984.1 | 988.1 | |||||
Noncontrolling interest | 616.4 | 687.2 | |||||
Total equity | 1,600.5 | 1,675.3 | |||||
Total liabilities and equity | $ | 3,305.8 | $ | 3,462.5 | |||
See accompanying notes to consolidated financial statements.
100
CVR Energy, Inc. and Subsidiaries
CONSOLIDATED STATEMENTS OF OPERATIONS
Year Ended December 31, | |||||||||||
2015 | 2014 | 2013 | |||||||||
(in millions, except per share data) | |||||||||||
Net sales | $ | 5,432.5 | $ | 9,109.5 | $ | 8,985.8 | |||||
Operating costs and expenses: | |||||||||||
Cost of product sold (exclusive of depreciation and amortization) | 4,190.4 | 8,066.0 | 7,563.2 | ||||||||
Direct operating expenses (exclusive of depreciation and amortization) | 584.7 | 515.1 | 455.8 | ||||||||
Flood insurance recovery | (27.3 | ) | — | — | |||||||
Selling, general and administrative expenses (exclusive of depreciation and amortization) | 99.0 | 109.7 | 113.5 | ||||||||
Depreciation and amortization | 164.1 | 154.4 | 142.8 | ||||||||
Total operating costs and expenses | 5,010.9 | 8,845.2 | 8,275.3 | ||||||||
Operating income | 421.6 | 264.3 | 710.5 | ||||||||
Other income (expense): | |||||||||||
Interest expense and other financing costs | (48.4 | ) | (40.0 | ) | (50.5 | ) | |||||
Interest income | 1.0 | 0.9 | 1.2 | ||||||||
Gain (loss) on derivatives, net | (28.6 | ) | 185.6 | 57.1 | |||||||
Loss on extinguishment of debt | — | — | (26.1 | ) | |||||||
Other income (expense), net | 36.7 | (3.7 | ) | 13.5 | |||||||
Total other income (expense) | (39.3 | ) | 142.8 | (4.8 | ) | ||||||
Income before income taxes | 382.3 | 407.1 | 705.7 | ||||||||
Income tax expense | 84.5 | 97.7 | 183.7 | ||||||||
Net income | 297.8 | 309.4 | 522.0 | ||||||||
Less: Net income attributable to noncontrolling interest | 128.2 | 135.5 | 151.3 | ||||||||
Net income attributable to CVR Energy stockholders | $ | 169.6 | $ | 173.9 | $ | 370.7 | |||||
Basic earnings per share | $ | 1.95 | $ | 2.00 | $ | 4.27 | |||||
Diluted earnings per share | $ | 1.95 | $ | 2.00 | $ | 4.27 | |||||
Dividends declared per share | $ | 2.00 | $ | 5.00 | $ | 14.25 | |||||
Weighted-average common shares outstanding: | |||||||||||
Basic | 86.8 | 86.8 | 86.8 | ||||||||
Diluted | 86.8 | 86.8 | 86.8 | ||||||||
See accompanying notes to consolidated financial statements.
101
CVR Energy, Inc. and Subsidiaries
CONSOLIDATED STATEMENTS OF COMPREHENSIVE INCOME
Year Ended December 31, | |||||||||||
2015 | 2014 | 2013 | |||||||||
(in millions) | |||||||||||
Net income | $ | 297.8 | $ | 309.4 | $ | 522.0 | |||||
Other comprehensive income (loss): | |||||||||||
Unrealized gain on available-for-sale securities, net of tax of $12.6, $0 and $2.4, respectively | 19.2 | — | 3.7 | ||||||||
Net gain reclassified into income on sale of available-for-sale-securities, net of tax of $(8.0), $0 and $(2.4), respectively (Note 14) | (12.1 | ) | — | (3.7 | ) | ||||||
Net gain reclassified into income on reclassification of available-for-sale securities to trading securities, net of tax of $(4.6), $0, $0, respectively (Note 14) | (7.1 | ) | — | — | |||||||
Change in fair value of interest rate swaps, net of tax of $0, $0 and $0, respectively | (0.1 | ) | (0.2 | ) | (0.2 | ) | |||||
Net loss reclassified into income on settlement of interest rate swaps, net of tax of $0.2, $0.2 and $0.3, respectively (Note 15) | 0.8 | 0.9 | 0.8 | ||||||||
Total other comprehensive income | 0.7 | 0.7 | 0.6 | ||||||||
Comprehensive income | 298.5 | 310.1 | 522.6 | ||||||||
Less: Comprehensive income attributable to noncontrolling interest | 128.6 | 135.9 | 151.5 | ||||||||
Comprehensive income attributable to CVR Energy stockholders | $ | 169.9 | $ | 174.2 | $ | 371.1 | |||||
See accompanying notes to consolidated financial statements.
102
CVR Energy, Inc. and Subsidiaries
CONSOLIDATED STATEMENTS OF CHANGES IN EQUITY
Common Stockholders | ||||||||||||||||||||||||||||||||||
Shares Issued | $0.01 Par Value Common Stock | Additional Paid-In Capital | Retained Earnings (Deficit) | Treasury Stock | Accumulated Other Comprehensive Income (Loss) | Total CVR Stockholders' Equity | Noncontrolling Interest | Total Equity | ||||||||||||||||||||||||||
(in millions, except share data) | ||||||||||||||||||||||||||||||||||
Balance at December 31, 2012 | 86,929,660 | $ | 0.9 | $ | 582.3 | $ | 945.4 | $ | (2.3 | ) | $ | (1.2 | ) | $ | 1,525.1 | $ | 135.0 | $ | 1,660.1 | |||||||||||||||
January issuance of CVR Refining's common units to the public, net of $148.0 tax impact | — | — | 229.3 | — | — | — | 229.3 | 276.4 | 505.7 | |||||||||||||||||||||||||
May issuance of CVR Refining's common units to the public, net of $96.0 tax impact | — | — | 148.9 | — | — | — | 148.9 | 148.7 | 297.6 | |||||||||||||||||||||||||
Sale of CVR Refining's common units to affiliate, net of $15.2 tax impact | — | — | 23.6 | — | — | — | 23.6 | 22.7 | 46.3 | |||||||||||||||||||||||||
Secondary offering of CVR Partners' common units to public, net of $88.5 tax impact | — | — | 129.7 | — | — | 0.2 | 129.9 | 74.1 | 204.0 | |||||||||||||||||||||||||
Dividends paid to CVR Energy stockholders | — | — | — | (1,237.3 | ) | — | — | (1,237.3 | ) | — | (1,237.3 | ) | ||||||||||||||||||||||
Distributions from CVR Partners to public unitholders | — | — | — | — | — | — | — | (50.0 | ) | (50.0 | ) | |||||||||||||||||||||||
Distributions from CVR Refining to public unitholders | — | — | — | — | — | — | — | (114.2 | ) | (114.2 | ) | |||||||||||||||||||||||
Share-based compensation | — | — | 1.0 | (2.6 | ) | — | — | (1.6 | ) | 2.8 | 1.2 | |||||||||||||||||||||||
Excess tax deficiency from share-based compensation | — | — | (0.1 | ) | — | — | — | (0.1 | ) | — | (0.1 | ) | ||||||||||||||||||||||
Redemption of common units | — | — | (0.3 | ) | — | — | — | (0.3 | ) | (0.2 | ) | (0.5 | ) | |||||||||||||||||||||
Net income | — | — | — | 370.7 | — | — | 370.7 | 151.3 | 522.0 | |||||||||||||||||||||||||
Other comprehensive income, net of tax | — | — | — | — | — | 0.4 | 0.4 | 0.2 | 0.6 | |||||||||||||||||||||||||
Balance at December 31, 2013 | 86,929,660 | $ | 0.9 | $ | 1,114.4 | $ | 76.2 | $ | (2.3 | ) | $ | (0.6 | ) | $ | 1,188.6 | $ | 646.8 | $ | 1,835.4 | |||||||||||||||
June issuance of CVR Refining's common units to the public, net of $39.4 tax impact | — | — | 60.3 | — | — | — | 60.3 | 88.6 | 148.9 | |||||||||||||||||||||||||
Dividends paid to CVR Energy stockholders | — | — | — | (434.2 | ) | — | — | (434.2 | ) | — | (434.2 | ) | ||||||||||||||||||||||
Distributions from CVR Partners to public unitholders | — | — | — | — | — | — | — | (48.2 | ) | (48.2 | ) | |||||||||||||||||||||||
Distributions from CVR Refining to public unitholders | — | — | — | — | — | — | — | (136.7 | ) | (136.7 | ) | |||||||||||||||||||||||
Share-based compensation | — | — | 0.1 | (0.8 | ) | — | — | (0.7 | ) | 0.8 | 0.1 | |||||||||||||||||||||||
Excess tax deficiency from share-based compensation | — | — | (0.1 | ) | — | — | — | (0.1 | ) | — | (0.1 | ) | ||||||||||||||||||||||
Net income | — | — | — | 173.9 | — | — | 173.9 | 135.5 | 309.4 | |||||||||||||||||||||||||
Other comprehensive income, net of tax | — | — | — | — | — | 0.3 | 0.3 | 0.4 | 0.7 | |||||||||||||||||||||||||
Balance at December 31, 2014 | 86,929,660 | $ | 0.9 | $ | 1,174.7 | $ | (184.9 | ) | $ | (2.3 | ) | $ | (0.3 | ) | $ | 988.1 | $ | 687.2 | $ | 1,675.3 | ||||||||||||||
Dividends paid to CVR Energy stockholders | — | — | — | (173.7 | ) | — | — | (173.7 | ) | — | (173.7 | ) | ||||||||||||||||||||||
Distributions from CVR Partners to public unitholders | — | — | — | — | — | — | — | (42.8 | ) | (42.8 | ) | |||||||||||||||||||||||
Distributions from CVR Refining to public unitholders | — | — | — | — | — | — | — | (156.9 | ) | (156.9 | ) | |||||||||||||||||||||||
Share-based compensation | — | — | 0.1 | (0.2 | ) | — | — | (0.1 | ) | 0.3 | 0.2 | |||||||||||||||||||||||
Excess tax deficiency from share-based compensation | — | — | (0.1 | ) | — | — | — | (0.1 | ) | — | (0.1 | ) | ||||||||||||||||||||||
Net income | — | — | — | 169.6 | — | — | 169.6 | 128.2 | 297.8 | |||||||||||||||||||||||||
Other comprehensive income, net of tax | — | — | — | — | — | 0.3 | 0.3 | 0.4 | 0.7 | |||||||||||||||||||||||||
Balance at December 31, 2015 | 86,929,660 | $ | 0.9 | $ | 1,174.7 | $ | (189.2 | ) | $ | (2.3 | ) | $ | — | $ | 984.1 | $ | 616.4 | $ | 1,600.5 | |||||||||||||||
See accompanying notes to consolidated financial statements.
103
CVR Energy, Inc. and Subsidiaries
CONSOLIDATED STATEMENTS OF CASH FLOWS
Year Ended December 31, | |||||||||||
2015 | 2014 | 2013 | |||||||||
(in millions) | |||||||||||
Cash flows from operating activities: | |||||||||||
Net income | $ | 297.8 | $ | 309.4 | $ | 522.0 | |||||
Adjustments to reconcile net income to net cash provided by operating activities: | |||||||||||
Depreciation and amortization | 164.1 | 154.4 | 142.8 | ||||||||
Allowance for doubtful accounts | (0.1 | ) | (0.5 | ) | (1.1 | ) | |||||
Amortization of deferred financing costs | 2.8 | 2.8 | 2.9 | ||||||||
Deferred income taxes | (10.4 | ) | 19.2 | (93.3 | ) | ||||||
Excess income tax deficiency of share-based compensation | 0.1 | 0.1 | 0.1 | ||||||||
Loss on disposition of assets | 1.8 | 0.4 | 0.1 | ||||||||
Loss on extinguishment of debt | — | — | 26.1 | ||||||||
Share-based compensation | 12.8 | 12.3 | 18.4 | ||||||||
Gain on sale of available-for-sale securities | (20.1 | ) | — | (6.1 | ) | ||||||
(Gain) loss on derivatives, net | 28.6 | (185.6 | ) | (57.1 | ) | ||||||
Current period settlements on derivative contracts | (26.0 | ) | 122.2 | 6.4 | |||||||
Changes in assets and liabilities: | |||||||||||
Accounts receivable | 41.0 | 105.7 | (30.2 | ) | |||||||
Inventories | 39.7 | 197.3 | 1.5 | ||||||||
Prepaid expenses and other current assets | 40.4 | 10.7 | (28.7 | ) | |||||||
Due to (from) parent | 32.8 | (44.6 | ) | 9.1 | |||||||
Other long-term assets | 3.8 | (0.8 | ) | (0.5 | ) | ||||||
Accounts payable | (14.3 | ) | (91.8 | ) | (38.7 | ) | |||||
Accrued income taxes | 4.2 | (0.3 | ) | (6.6 | ) | ||||||
Deferred revenue | (10.5 | ) | 12.9 | (0.3 | ) | ||||||
Other current liabilities | (52.1 | ) | 15.0 | (26.7 | ) | ||||||
Other long-term liabilities | 0.4 | 1.5 | — | ||||||||
Net cash provided by operating activities | 536.8 | 640.3 | 440.1 | ||||||||
Cash flows from investing activities: | |||||||||||
Capital expenditures | (218.7 | ) | (218.4 | ) | (256.5 | ) | |||||
Proceeds from sale of assets | 0.1 | 0.1 | 0.1 | ||||||||
Purchase of available-for-sale securities | — | (78.3 | ) | (18.6 | ) | ||||||
Proceeds from sale of available-for-sale securities | 68.0 | — | 24.7 | ||||||||
Net cash used in investing activities | (150.6 | ) | (296.6 | ) | (250.3 | ) | |||||
Cash flows from financing activities: | |||||||||||
Principal payments on senior secured notes | — | — | (243.4 | ) | |||||||
Payment of capital lease obligations | (1.3 | ) | (1.2 | ) | (1.2 | ) | |||||
Payment of deferred financing costs | — | — | (0.4 | ) | |||||||
Proceeds from CVR Refining's initial public offering, net of offering costs | — | — | 655.7 | ||||||||
Proceeds from CVR Refining's May 2013 offering, net of offering costs | — | — | 393.6 | ||||||||
Proceeds from the sale of CVR Refining's common units to affiliate | — | — | 61.5 | ||||||||
Proceeds from CVR Refining's June 2014 offering, net of offering costs | — | 188.3 | — | ||||||||
Proceeds from CVR Partners' secondary offering, net of offering costs | — | — | 292.6 | ||||||||
Dividends to CVR Energy's stockholders | (173.7 | ) | (434.2 | ) | (1,237.3 | ) | |||||
Distributions to CVR Refining's noncontrolling interest holders | (156.9 | ) | (136.7 | ) | (114.2 | ) | |||||
Distributions to CVR Partners' noncontrolling interest holders | (42.8 | ) | (48.2 | ) | (50.0 | ) | |||||
Excess income tax deficiency of share-based compensation | (0.1 | ) | (0.1 | ) | (0.1 | ) | |||||
Redemption of common units | — | — | (0.5 | ) | |||||||
Net cash used in financing activities | (374.8 | ) | (432.1 | ) | (243.7 | ) | |||||
Net increase (decrease) in cash and cash equivalents | 11.4 | (88.4 | ) | (53.9 | ) | ||||||
Cash and cash equivalents, beginning of period | 753.7 | 842.1 | 896.0 | ||||||||
Cash and cash equivalents, end of period | $ | 765.1 | $ | 753.7 | $ | 842.1 | |||||
Supplemental disclosures: | |||||||||||
Cash paid for income taxes, net of refunds (received) | $ | 57.9 | $ | 123.5 | $ | 274.5 | |||||
Cash paid for interest net of capitalized interest of $3.7, $9.4 and $3.6 for the years ended December 31, 2015, 2014 and 2013, respectively | $ | 45.4 | $ | 37.2 | $ | 54.9 | |||||
Non-cash investing and financing activities: | |||||||||||
Construction in progress additions included in accounts payable | $ | 22.3 | $ | 21.6 | $ | 32.8 | |||||
Change in accounts payable related to construction in progress additions | $ | 0.7 | $ | (11.2 | ) | $ | (23.4 | ) | |||
See accompanying notes to consolidated financial statements.
104
CVR Energy, Inc. and Subsidiaries
NOTES TO CONSOLIDATED FINANCIAL STATEMENTS
(1) Organization and History of the Company
Organization
The "Company," "CVR Energy," or "CVR" may be used to refer to CVR Energy, Inc. and, unless the context otherwise requires, its subsidiaries. Any references to the "Company" as of a date prior to October 16, 2007 (the date of the restructuring as further discussed in this Note) and subsequent to June 24, 2005 are to Coffeyville Acquisition LLC ("CALLC") and its subsidiaries.
CVR is a diversified holding company primarily engaged in the petroleum refining and nitrogen fertilizer manufacturing industries through its holdings in CVR Refining, LP ("CVR Refining" or the "Refining Partnership") and CVR Partners, LP ("CVR Partners" or the "Nitrogen Fertilizer Partnership"). The Refining Partnership is an independent petroleum refiner and marketer of high value transportation fuels. The Nitrogen Fertilizer Partnership produces and markets nitrogen fertilizers in the form of UAN and ammonia. The Company's operations include two business segments: the petroleum segment and the nitrogen fertilizer segment.
CALLC formed CVR Energy, Inc. as a wholly-owned subsidiary, incorporated in Delaware in September 2006, in order to effect an initial public offering. The initial public offering of CVR was consummated on October 26, 2007. In conjunction with the initial public offering, a restructuring occurred in which CVR became a direct or indirect owner of all of the subsidiaries of CALLC. Additionally, in connection with the initial public offering, CALLC was split into two entities: CALLC and Coffeyville Acquisition II LLC.
CVR's common stock is listed on the NYSE under the symbol "CVI." As of December 31, 2010, approximately 40% of its outstanding shares were beneficially owned by GS Capital Partners V, L.P. and related entities ("GS" or "Goldman Sachs Funds") and Kelso Investment Associates VII, L.P. and related entities ("Kelso" or "Kelso Funds"). On February 8, 2011, GS and Kelso completed a registered public offering, whereby GS sold into the public market its remaining ownership interests in CVR and Kelso substantially reduced its interest in the Company. On May 26, 2011, Kelso completed a registered public offering, whereby Kelso sold into the public market its remaining ownership interest in CVR Energy.
On December 15, 2011, CVR acquired all of the issued and outstanding shares of Gary-Williams Energy Corporation (subsequently converted to "WEC"). Assets acquired include a 70,000 bpcd rated capacity refinery in Wynnewood, Oklahoma and approximately 2.0 million barrels of company-owned storage tanks.
On April 18, 2012, an affiliate of Icahn Enterprises L.P. ("IEP") entered into a Transaction Agreement (the "Transaction Agreement") with CVR, with respect to its tender offer to purchase all of the issued and outstanding shares of CVR's common stock. On May 7, 2012, an affiliate of IEP announced that it had acquired control of CVR pursuant to a tender offer for all of the Company's common stock (the "IEP Acquisition"). As of December 31, 2015, IEP and its affiliates owned approximately 82% of the Company's outstanding shares. Prior to the IEP Acquisition, the Company was owned 100% by the public.
CVR Partners, LP
In conjunction with the consummation of CVR's initial public offering in 2007, CVR transferred Coffeyville Resources Nitrogen Fertilizers, LLC ("CRNF"), its nitrogen fertilizer business, to CVR Partners, which at the time was a newly created limited partnership, in exchange for a managing general partner interest ("managing GP interest"), a special general partner interest ("special GP interest," represented by special GP units) and a de minimis limited partner interest ("LP interest," represented by special LP units). CVR concurrently sold the managing GP interest, including the associated incentive distribution rights ("IDRs"), to Coffeyville Acquisition III LLC ("CALLC III"), an entity owned by its then controlling stockholders and senior management.
On April 13, 2011, the Nitrogen Fertilizer Partnership completed its initial public offering of 22,080,000 common units (the "Nitrogen Fertilizer Partnership IPO") priced at $16.00 per unit. The common units, which are listed on the NYSE, began trading on April 8, 2011 under the symbol "UAN." In connection with the Nitrogen Fertilizer Partnership IPO, the IDRs were purchased by the Nitrogen Fertilizer Partnership and subsequently extinguished. In addition, the noncontrolling interest representing the managing GP interest was purchased by Coffeyville Resources, LLC ("CRLLC"), a subsidiary of CVR, for a nominal amount. The consideration for the IDRs was paid to the owners of CALLC III, which included the Goldman Sachs
105
CVR Energy, Inc. and Subsidiaries
NOTES TO CONSOLIDATED FINANCIAL STATEMENTS — (Continued)
Funds, the Kelso Funds and members of CVR's senior management. In connection with the Nitrogen Fertilizer Partnership IPO and through May 27, 2013, the Company recorded a noncontrolling interest for the common units sold into the public market which represented approximately a 30% interest in the Nitrogen Fertilizer Partnership.
In connection with the Nitrogen Fertilizer Partnership IPO, the Nitrogen Fertilizer Partnership's limited partner interests were converted into common units, the Nitrogen Fertilizer Partnership's special general partner interests were converted into common units, and the Nitrogen Fertilizer Partnership's special general partner was merged with and into CRLLC, with CRLLC continuing as the surviving entity. In addition, as discussed above, the managing general partner sold its IDRs to the Nitrogen Fertilizer Partnership. These interests were extinguished, and CALLC III sold the managing general partner to CRLLC for a nominal amount. As a result of the Nitrogen Fertilizer Partnership IPO, the Nitrogen Fertilizer Partnership has two types of partnership interests outstanding:
• | common units representing limited partner interests; and |
• | a general partner interest, which is not entitled to any distributions, and which is held by the Nitrogen Fertilizer Partnership's general partner. |
On May 28, 2013, CRLLC completed a registered public offering (the "Secondary Offering") whereby it sold 12,000,000 Nitrogen Fertilizer Partnership common units to the public at a price of $25.15 per unit. The net proceeds to CRLLC from the Secondary Offering were approximately $292.6 million, after deducting approximately $9.2 million in underwriting discounts and commissions. The Nitrogen Fertilizer Partnership did not receive any of the proceeds from the sale of common units by CRLLC. In connection with the Secondary Offering, the Nitrogen Fertilizer Partnership incurred approximately $0.5 million in offering costs during the year ended December 31, 2013.
Immediately subsequent to the closing of the Secondary Offering and as of December 31, 2015, public security holders held approximately 47% of the total Nitrogen Fertilizer Partnership common units, and CRLLC held approximately 53% of the total Nitrogen Fertilizer Partnership common units. In addition, CRLLC owns 100% of the Nitrogen Fertilizer Partnership's general partner, CVR GP, LLC, which only holds a non-economic general partner interest. The noncontrolling interest reflected on the Consolidated Balance Sheets of CVR is impacted by the net income of, and distributions from, the Nitrogen Fertilizer Partnership. Immediately subsequent to the completion of the pending mergers, which are discussed in the "CVR Partners, LP - Pending Mergers" section below, it is estimated that CRLLC will hold approximately 34% of the Nitrogen Fertilizer Partnership's common units and 100% of the Nitrogen Fertilizer Partnership's general partner interest.
The Nitrogen Fertilizer Partnership has adopted a policy pursuant to which the Nitrogen Fertilizer Partnership will distribute all of the available cash it generates each quarter. The available cash for each quarter will be determined by the board of directors of the Nitrogen Fertilizer Partnership's general partner following the end of such quarter. The partnership agreement does not require that the Nitrogen Fertilizer Partnership make cash distributions on a quarterly basis or at all, and the board of directors of the general partner of the Nitrogen Fertilizer Partnership can change the Nitrogen Fertilizer Partnership's distribution policy at any time.
The Nitrogen Fertilizer Partnership is operated by CVR's senior management (together with other officers of the general partner) pursuant to a services agreement among CVR, the general partner and the Nitrogen Fertilizer Partnership. The Nitrogen Fertilizer Partnership's general partner, CVR GP, LLC, manages the operations and activities of the Nitrogen Fertilizer Partnership, subject to the terms and conditions specified in the partnership agreement. The operations of the general partner in its capacity as general partner are managed by its board of directors. Actions by the general partner that are made in its individual capacity are made by CRLLC as the sole member of the general partner and not by the board of directors of the general partner. The general partner is not elected by the common unitholders and is not subject to re-election on a regular basis. The officers of the general partner manage the day-to-day affairs of the business of the Nitrogen Fertilizer Partnership. CVR, the Nitrogen Fertilizer Partnership, their respective subsidiaries and the general partner are parties to a number of agreements to regulate certain business relations between them. Certain of these agreements were amended in connection with the Nitrogen Fertilizer Partnership IPO.
106
CVR Energy, Inc. and Subsidiaries
NOTES TO CONSOLIDATED FINANCIAL STATEMENTS — (Continued)
CVR Partners, LP - Pending Mergers
On August 9, 2015, CVR Partners, including its two newly-created direct wholly-owned subsidiaries Lux Merger Sub 1 LLC ("Merger Sub 1") and Lux Merger Sub 2 LLC ("Merger Sub 2"), entered into an Agreement and Plan of Merger (the "Merger Agreement") with Rentech Nitrogen Partners, L.P., a publicly traded partnership whose common units are listed on the New York Stock Exchange under the ticker symbol "RNF" ("Rentech Nitrogen"), and Rentech Nitrogen GP, LLC ("Rentech Nitrogen GP"), pursuant to which CVR Partners will acquire Rentech Nitrogen and Rentech Nitrogen GP. The Merger Agreement provides that, upon the terms and subject to the conditions set forth therein, Merger Sub 1 will be merged with and into Rentech Nitrogen GP, with Rentech Nitrogen GP continuing as the surviving entity and a wholly-owned subsidiary of CVR Partners, and Merger Sub 2 will be merged with and into Rentech Nitrogen, with Rentech Nitrogen continuing as the surviving entity and a wholly-owned subsidiary of CVR Partners (together, the "mergers").
Under the terms of the Merger Agreement, holders of common units representing limited partner interests in Rentech Nitrogen ("Rentech Nitrogen common units") eligible to receive consideration will receive 1.04 common units (the "unit consideration") representing limited partner interests in CVR Partners ("CVR Partners common units") and $2.57 in cash, without interest, (the "cash consideration" and together with the unit consideration, the "merger consideration") for each Rentech Nitrogen common unit. Phantom units granted and outstanding under Rentech Nitrogen's equity plans and held by an employee who will continue in the employment of a CVR Partners-affiliated entity upon closing of the mergers will be canceled and replaced with new incentive awards of substantially equivalent value and on similar terms. Each phantom unit granted and outstanding and held by (i) an employee who will not continue in employment of a CVR Partners-affiliated entity, or (ii) a director of Rentech Nitrogen GP will, upon closing of the mergers, vest in full and be entitled to receive the merger consideration. The unit consideration is fixed, and the number of units included in the merger consideration will not be adjusted to reflect changes in the price of Rentech Nitrogen common units or CVR Partners common units. CVR Partners is expected to issue approximately 40.7 million CVR Partners common units to former Rentech Nitrogen common unitholders pursuant to the mergers.
Rentech Nitrogen owns and operates two fertilizer facilities. The facility located in East Dubuque, Illinois produces primarily ammonia and UAN using natural gas as the facility's primary feedstock. The facility located in Pasadena, Texas (the "Pasadena facility") produces ammonium sulfate, ammonium thiosulfate and sulfuric acid, using ammonia and sulfur as the facility's primary feedstocks. Rentech Nitrogen is required to sell or spin off its Pasadena facility as a condition to closing of the mergers (unless waived), and Rentech Nitrogen common unitholders may receive additional consideration for the Pasadena facility in the event such a sale or spin-off is consummated.
The completion of the mergers is subject to satisfaction or waiver of closing conditions, including (i) the adoption of the Merger Agreement by holders of a majority of the outstanding Rentech Nitrogen common units, (ii) the effectiveness of a registration statement on Form S-4, (iii) the approval for listing of the CVR Partners common units issuable as part of the merger consideration on the New York Stock Exchange, (iv) the sale or spin-off by Rentech Nitrogen of Rentech Nitrogen's Pasadena facility on terms specified in the Merger Agreement, (v) the absence of certain events of default under the indenture governing Rentech Nitrogen's 6.5% Second Lien Senior Secured Notes due 2021 and (vi) other customary conditions. On February 15, 2016, the Merger Agreement was adopted by holders of a majority of the outstanding Rentech Nitrogen common units. On January 14, 2016, CVR Partners registration statement on Form S-4 with the Securities and Exchange Commission ("SEC") to register the CVR Partners common units issuable as part of the merger consideration was declared effective.
The Merger Agreement includes customary restrictions on the conduct of the Nitrogen Fertilizer Partnership's business prior to the completion of the mergers, generally requiring the Nitrogen Fertilizer Partnership to conduct its business in the ordinary course and subjecting the Nitrogen Fertilizer Partnership to a variety of specified limitations. In accordance with the terms of the Merger Agreement, beginning with the distribution for the third quarter of 2015 and until the closing of the mergers, the Nitrogen Fertilizer Partnership may not make or declare distributions in excess of available cash for distribution in respect of any quarter.
The Merger Agreement contains certain termination rights for both CVR Partners and Rentech Nitrogen and further provides that upon termination of the Merger Agreement, under certain circumstances, either party may be required to make an expense reimbursement payment of $10.0 million, and Rentech Nitrogen may be required to pay CVR Partners a termination fee equal to $31.2 million.
107
CVR Energy, Inc. and Subsidiaries
NOTES TO CONSOLIDATED FINANCIAL STATEMENTS — (Continued)
Simultaneously with the execution of the Merger Agreement, CVR Partners entered into a commitment letter (the "commitment letter") with CRLLC, pursuant to which CRLLC has committed to, on the terms and subject to the conditions set forth in the commitment letter, make available to CVR Partners term loan financing of up to $150.0 million, which amounts would be available solely to fund the repayment of all of the loans outstanding under Rentech Nitrogen's existing $50.0 million credit facility with General Electric Capital Corporation, the cash consideration payable by the Nitrogen Fertilizer Partnership upon closing of the mergers and expenses associated with the mergers. The term loan facility will bear interest at a rate of three-month LIBOR plus 3.0% per annum. Calculation of interest shall be on the basis of the actual number of days elapsed over a 360-day year. Such term loan, if drawn, would have a one-year term.
See Note 13 ("Commitments and Contingencies") for discussion of litigation related to the pending mergers.
CVR Refining, LP
In contemplation of an initial public offering, in September 2012, CRLLC formed CVR Refining Holdings, LLC ("CVR Refining Holdings"), which in turn formed CVR Refining GP, LLC. CVR Refining Holdings and CVR Refining GP, LLC formed the Refining Partnership, which issued them a 100% limited partnership interest and a non-economic general partner interest, respectively. CVR Refining Holdings formed CVR Refining, LLC ("Refining LLC") and CRLLC contributed its petroleum and logistics subsidiaries, as well as its equity interests in Coffeyville Finance Inc. ("Coffeyville Finance"), to Refining LLC in October 2012. CVR Refining Holdings contributed Refining LLC to the Refining Partnership on December 31, 2012.
On January 23, 2013, the Refining Partnership completed the initial public offering of its common units representing limited partner interests (the "Refining Partnership IPO"). The Refining Partnership sold 24,000,000 common units to the public at a price of $25.00 per unit, resulting in gross proceeds of $600.0 million, before giving effect to underwriting discounts and other offering expenses. Of the common units issued, 4,000,000 units were purchased by an affiliate of IEP. Additionally, on January 30, 2013, the Refining Partnership sold an additional 3,600,000 common units to the public at a price of $25.00 per unit in connection with the underwriters' exercise of their option to purchase additional common units, resulting in gross proceeds of $90.0 million, before giving effect to underwriting discounts and other offering costs. The common units, which are listed on the NYSE, began trading on January 17, 2013 under the symbol "CVRR." In connection with the Refining Partnership IPO, the Refining Partnership paid approximately $32.5 million in underwriting fees and incurred approximately $3.9 million of other offering costs.
Upon consummation of the Refining Partnership IPO, CVR indirectly owned the Refining Partnership's general partner and limited partnership interests in the form of common units. Following the offering, the Refining Partnership has two types of partnership interests outstanding:
• | common units representing limited partner interests; and |
• | a general partner interest, which is not entitled to any distributions, and which is held by the Refining Partnership's general partner. |
The net proceeds from the Refining Partnership IPO of approximately $653.6 million, after deducting underwriting discounts and commissions and offering expenses, have been utilized as follows:
• | approximately $253.0 million was used to repurchase the 10.875% senior secured notes due 2017 (including accrued interest); |
• | approximately $160.0 million was used to fund certain maintenance and environmental capital expenditures through 2014; |
• | approximately $54.0 million was used to fund the turnaround expenses at the Wynnewood refinery that were incurred during the fourth quarter of 2012; |
• | approximately $85.1 million was distributed to CRLLC; and |
108
CVR Energy, Inc. and Subsidiaries
NOTES TO CONSOLIDATED FINANCIAL STATEMENTS — (Continued)
• | the balance of the proceeds of approximately $101.5 million was allocated to be utilized by the Refining Partnership for general partnership purposes. |
In connection with the Refining Partnership IPO and through May 19, 2013, the Company recorded a noncontrolling interest for the common units sold into the public market, which represented an approximate 19% interest in the Refining Partnership. Prior to the Refining Partnership IPO, CVR owned 100% of the Refining Partnership and net income earned during this period was fully attributable to the Company.
On May 20, 2013, the Refining Partnership completed an underwritten offering (the "Underwritten Offering") by selling 12,000,000 common units to the public at a price of $30.75 per unit. American Entertainment Properties Corporation ("AEPC"), an affiliate of IEP, also purchased an additional 2,000,000 common units at the public offering price in a privately negotiated transaction with a subsidiary of CVR Energy, which was completed on May 29, 2013. In connection with the Underwritten Offering, on June 10, 2013, the Refining Partnership sold an additional 1,209,236 common units to the public at a price of $30.75 per unit in connection with a partial exercise by the underwriters of their option to purchase additional common units. The transactions described in this paragraph are collectively referred to as the "Transactions." In connection with the Transactions, the Refining Partnership paid approximately $12.2 million in underwriting fees and approximately $0.4 million in offering costs.
The Refining Partnership utilized net proceeds of approximately $394.0 million from the Underwritten Offering (including net proceeds from the exercise of the underwriters' option) to redeem 13,209,236 common units from CVR Refining Holdings, an indirect wholly-owned subsidiary of CVR Energy. The net proceeds to a subsidiary of CVR Energy from the sale of 2,000,000 common units to AEPC were approximately $61.5 million. The Refining Partnership did not receive any of the proceeds from the sale of common units by CVR Energy to AEPC.
Immediately following the closing of the Transactions and prior to June 30, 2014, public security holders held approximately 29% of the total Refining Partnership common units (including units owned by affiliates of IEP representing 4% of the total Refining Partnership common units), and CVR Refining Holdings held approximately 71% of the total Refining Partnership common units.
On June 30, 2014, the Refining Partnership completed a second underwritten offering (the "Second Underwritten Offering") by selling 6,500,000 common units to the public at a price of $26.07 per unit. The Refining Partnership paid approximately $5.3 million in underwriting fees and approximately $0.5 million in offering costs. The Refining Partnership utilized net proceeds of approximately $164.1 million from the Second Underwritten Offering to redeem 6,500,000 common units from CVR Refining Holdings. Immediately subsequent to the closing of the Second Underwritten Offering and through July 23, 2014, public security holders held approximately 33% of the total Refining Partnership common units, and CVR Refining Holdings held approximately 67% of the total Refining Partnership common units.
On July 24, 2014, the Refining Partnership sold an additional 589,100 common units to the public at a price of $26.07 per unit in connection with the underwriters' exercise of their option to purchase additional common units. The Refining Partnership utilized net proceeds of approximately $14.9 million from the underwriters' exercise of their option to purchase additional common units to redeem an equal amount of common units from CVR Refining Holdings. Additionally, on July 24, 2014, CVR Refining Holdings sold 385,900 common units to the public at a price of $26.07 per unit in connection with the underwriters' exercise of their remaining option to purchase additional common units. CVR Refining Holdings received net proceeds of $9.7 million.
Immediately subsequent to the closing of the underwriters' option for the Second Underwritten Offering and as of December 31, 2015, public security holders held approximately 34% of the total Refining Partnership common units (including units owned by affiliates of IEP representing 4% of the total Refining Partnership common units), and CVR Refining Holdings held approximately 66% of the total Refining Partnership common units. In addition, CVR Refining Holdings owns 100% of the Refining Partnership's general partner, CVR Refining GP, LLC, which holds a non-economic general partner interest. The noncontrolling interest reflected on the Consolidated Balance Sheets of CVR is impacted by the net income of, and distributions from, the Refining Partnership.
The Refining Partnership's general partner, CVR Refining GP, LLC, manages the Refining Partnership's activities subject to the terms and conditions specified in the Refining Partnership's partnership agreement. The Refining Partnership's general partner is owned by CVR Refining Holdings. The operations of its general partner, in its capacity as general partner, are
109
CVR Energy, Inc. and Subsidiaries
NOTES TO CONSOLIDATED FINANCIAL STATEMENTS — (Continued)
managed by its board of directors. Actions by its general partner that are made in its individual capacity are made by CVR Refining Holdings as the sole member of the Refining Partnership's general partner and not by the board of directors of its general partner. The members of the board of directors of the Refining Partnership's general partner are not elected by the Refining Partnership's unitholders and are not subject to re-election on a regular basis. The officers of the general partner manage the day-to-day affairs of the business of the Refining Partnership.
The Refining Partnership has adopted a policy pursuant to which it will distribute all of the available cash it generates each quarter. The available cash for each quarter will be determined by the board of directors of the Refining Partnership's general partner following the end of such quarter. The partnership agreement does not require that the Refining Partnership make cash distributions on a quarterly basis or at all, and the board of directors of the general partner of the Refining Partnership can change the distribution policy at any time.
The Refining Partnership entered into a services agreement on December 31, 2012, pursuant to which the Refining Partnership and its general partner obtain certain management and other services from CVR Energy. In addition, by virtue of the fact that the Refining Partnership is a controlled affiliate of CVR Energy, the Refining Partnership is bound by an omnibus agreement entered into by CVR Energy, CVR Partners and the general partner of CVR Partners, pursuant to which the Refining Partnership may not engage in, whether by acquisition or otherwise, the production, transportation or distribution, on a wholesale basis, of fertilizer in the contiguous United States, or a fertilizer restricted business, for so long as CVR Energy and certain of its affiliates continue to own at least 50% of the Nitrogen Fertilizer Partnership's outstanding units.
(2) Summary of Significant Accounting Policies
Principles of Consolidation
The accompanying CVR consolidated financial statements include the accounts of CVR Energy, Inc. and its majority-owned direct and indirect subsidiaries. All intercompany accounts and transactions have been eliminated in consolidation. The ownership interests of noncontrolling investors in its subsidiaries are recorded as noncontrolling interests.
The Nitrogen Fertilizer Partnership and the Refining Partnership are both consolidated based upon the fact that their general partners are owned by CVR and, therefore, CVR has the ability to control their activities. The Nitrogen Fertilizer Partnership's and the Refining Partnership's general partners manage their respective operations and activities subject to the terms and conditions specified in their respective partnership agreements. The operations of each general partner in its capacity as general partner are managed by its board of directors. The limited rights of the common unitholders of the Nitrogen Fertilizer Partnership and the Refining Partnership are demonstrated by the fact that the common unitholders have no right to elect either general partner or either general partner's directors on an annual or other continuing basis. Each general partner can only be removed by a vote of the holders of at least 66 2/3% of the outstanding common units, including any common units owned by the general partner and its affiliates (including CVR) voting together as a single class. Actions by the general partner that are made in its individual capacity are made by the CVR subsidiary that serves as the sole member of the general partner and not by the board of directors of the general partner. The officers of the general partner manage the day-to-day affairs of the business. The majority of the officers of both general partners are also officers of CVR. Based upon the general partner's role and rights as afforded by the partnership agreements and the limited rights afforded to the limited partners, the consolidated financial statements of CVR will include the assets, liabilities, cash flows, revenues and expenses of the Nitrogen Fertilizer Partnership and the Refining Partnership.
Cash and Cash Equivalents
For purposes of the Consolidated Statements of Cash Flows, CVR considers all highly liquid money market accounts and debt instruments with original maturities of three months or less to be cash equivalents. Under the Company's cash management system, checks issued but not presented to banks frequently result in book overdraft balances for accounting purposes and are classified as accounts payable in the Consolidated Balance Sheets. The change in book overdrafts are reported in the Consolidated Statements of Cash Flows as a component of operating cash flow for accounts payable as they do not represent bank overdrafts. The amount of these checks included in accounts payable as of December 31, 2015 and 2014 was $24.7 million and $21.5 million, respectively.
110
CVR Energy, Inc. and Subsidiaries
NOTES TO CONSOLIDATED FINANCIAL STATEMENTS — (Continued)
Accounts Receivable, net
CVR grants credit to its customers. Credit is extended based on an evaluation of a customer's financial condition; generally, collateral is not required. Accounts receivable are due on negotiated terms and are stated at amounts due from customers, net of an allowance for doubtful accounts. Accounts outstanding for longer than their contractual payment terms are considered past due. CVR determines its allowance for doubtful accounts by considering a number of factors, including the length of time trade accounts are past due, the customer's ability to pay its obligations to CVR, and the condition of the general economy and the industry as a whole. CVR writes off accounts receivable when they become uncollectible, and payments subsequently received on such receivables are credited to the allowance for doubtful accounts. Amounts collected on accounts receivable are included in net cash provided by operating activities in the Consolidated Statements of Cash Flows. As of December 31, 2015 and 2014, no customers individually represented greater than 10% of the total net accounts receivable balance. The largest concentration of credit for any one customer at December 31, 2015 and 2014 was approximately 9% and 8%, respectively, of the net accounts receivable balance.
Inventories
Inventories consist primarily of domestic and foreign crude oil, blending stock and components, work-in-progress, fertilizer products, and refined fuels and by-products. Inventories are valued at the lower of the first-in, first-out ("FIFO") cost, or market for fertilizer products, refined fuels and by-products for all periods presented. Refinery unfinished and finished products inventory values were determined using the ability-to-bear process, whereby raw materials and production costs are allocated to work-in-process and finished products based on their relative fair values. Other inventories, including other raw materials, spare parts, and supplies, are valued at the lower of moving-average cost, which approximates FIFO, or market. The cost of inventories includes inbound freight costs.
Prepaid Expenses and Other Current Assets
Prepaid expenses and other current assets consist of prepayments for crude oil deliveries to the Refining Partnership's refineries for which title had not transferred, non-trade accounts receivable, current portions of prepaid insurance, deferred financing costs, derivative agreements and other general current assets.
Property, Plant, and Equipment
Additions to property, plant and equipment, including capitalized interest and certain costs allocable to construction and property purchases, are recorded at cost. Capitalized interest is added to any capital project over $1.0 million in cost which is expected to take more than six months to complete. Depreciation is computed using principally the straight-line method over the estimated useful lives of the various classes of depreciable assets. The lives used in computing depreciation for such assets are as follows:
Asset | Range of Useful Lives, in Years |
Improvements to land | 15 to 30 |
Buildings | 20 to 30 |
Machinery and equipment | 5 to 30 |
Automotive equipment | 5 to 15 |
Furniture and fixtures | 3 to 10 |
Aircraft | 20 |
Railcars | 25 to 30 |
Leasehold improvements and assets held under capital leases are depreciated or amortized on the straight-line method over the shorter of the contractual lease term or the estimated useful life of the asset. Expenditures for routine maintenance and repair costs are expensed when incurred. Such expenses are reported in direct operating expenses (exclusive of depreciation and amortization) in the Company's Consolidated Statements of Operations.
111
CVR Energy, Inc. and Subsidiaries
NOTES TO CONSOLIDATED FINANCIAL STATEMENTS — (Continued)
Goodwill and Intangible Assets
Goodwill represents the excess of the cost of an acquired entity over the fair value of the assets acquired less liabilities assumed. Intangible assets are assets that lack physical substance (excluding financial assets). Goodwill acquired in a business combination and intangible assets with indefinite useful lives are not amortized, and intangible assets with finite useful lives are amortized. Goodwill and intangible assets not subject to amortization are tested for impairment annually or more frequently if events or changes in circumstances indicate the asset might be impaired. CVR uses November 1 of each year as its annual valuation date for its goodwill impairment test. The Company performed its annual impairment review of goodwill for 2015, 2014 and 2013, which is attributable entirely to the nitrogen fertilizer segment and concluded there were no impairments. See Note 6 ("Goodwill") for further discussion.
Deferred Financing Costs
Deferred financing costs associated with debt issuances are amortized to interest expense and other financing costs using the effective-interest method over the life of the debt. Additionally, any underwriting and original issue discount and premium related to debt issuances are amortized to interest expense and other financing costs using the effective-interest method over the life of the debt. Deferred financing costs related to the Refining Partnership's Amended and Restated ABL Credit Facility and the Nitrogen Fertilizer Partnership's revolving credit facility are amortized to interest expense and other financing costs using the straight-line method through the termination date of the respective facility.
Planned Major Maintenance Costs
The direct-expense method of accounting is used for planned major maintenance activities. Maintenance costs are recognized as expense when maintenance services are performed. Planned major maintenance activities for the nitrogen plant generally occur every two to three years. The required frequency of planned major maintenance activities varies by unit for the refineries, but generally is every four to five years. Costs associated with these turnaround activities were included in direct operating expenses (exclusive of depreciation and amortization) in the Consolidated Statements of Operations.
For the years ended December 31, 2015 and 2014, the Company's petroleum and nitrogen fertilizer segments incurred the following major scheduled turnaround expenses. No major scheduled turnaround expenses were incurred for the year ended December 31, 2013.
For the Year Ended December 31, | |||||||
2015 | 2014 | ||||||
(in millions) | |||||||
Petroleum segment | |||||||
Coffeyville refinery(1) | $ | 102.2 | $ | 5.5 | |||
Wynnewood refinery(2) | — | 1.3 | |||||
Nitrogen Fertilizer segment | |||||||
Nitrogen Fertilizer plant(3) | 7.0 | — | |||||
Total Major Scheduled Turnaround Expenses | $ | 109.2 | $ | 6.8 | |||
_______________________________________
(1) | The Coffeyville refinery completed the first phase of its current major scheduled turnaround in mid-November 2015. The second phase is scheduled to begin in late February 2016. During the outage at the Coffeyville refinery as discussed in Note 7 ("Insurance Claims"), the Refining Partnership accelerated certain planned turnaround activities scheduled for 2015 and incurred turnaround expenses for the year ended December 31, 2014. |
(2) | During the fluid catalytic cracking unit ("FCCU") outage at the Wynnewood refinery, the Refining Partnership accelerated certain planned turnaround activities previously scheduled for 2016 and incurred turnaround expenses for the year ended December 31, 2014. The next turnaround for the Wynnewood refinery is scheduled to occur in the spring of 2017. |
(3) | The Nitrogen Fertilizer Partnership underwent a full facility turnaround in the third quarter of 2015. The Nitrogen Fertilizer Partnership is planning to undergo the next scheduled full facility turnaround in the second half of 2017. |
112
CVR Energy, Inc. and Subsidiaries
NOTES TO CONSOLIDATED FINANCIAL STATEMENTS — (Continued)
Cost Classifications
Cost of product sold (exclusive of depreciation and amortization) includes cost of crude oil, other feedstocks, blendstocks, purchased refined products, pet coke expenses, renewable identification numbers ("RINs") expenses and freight and distribution expenses. Cost of product sold excluded depreciation and amortization of approximately $6.7 million, $6.3 million and $5.0 million for the years ended December 31, 2015, 2014 and 2013, respectively.
Direct operating expenses (exclusive of depreciation and amortization) includes direct costs of labor, maintenance and services, energy and utility costs, property taxes, environmental compliance costs as well as chemicals and catalysts and other direct operating expenses. Direct operating expenses excluded depreciation and amortization of approximately $149.7 million, $141.8 million and $134.5 million for the years ended December 31, 2015, 2014 and 2013, respectively.
Selling, general and administrative expenses (exclusive of depreciation and amortization) consist primarily of legal expenses, treasury, accounting, marketing, human resources, information technology and maintaining the corporate and administrative offices in Texas and Kansas. Selling, general and administrative expenses excluded depreciation and amortization of approximately $7.7 million, $6.3 million and $3.3 million for the years ended December 31, 2015, 2014 and 2013, respectively.
Income Taxes
CVR accounts for income taxes utilizing the asset and liability approach. Under this method, deferred tax assets and liabilities are recognized for the anticipated future tax consequences attributable to differences between the financial statement carrying amounts of existing assets and liabilities and their respective tax basis. Deferred amounts are measured using enacted tax rates expected to apply to taxable income in the year those temporary differences are expected to be recovered or settled. The effect on deferred tax assets and liabilities of a change in tax rates is recognized in income in the period that includes the enactment date. See Note 8 ("Income Taxes") for further discussion.
Impairment of Long-Lived Assets
CVR accounts for long-lived assets in accordance with accounting standards issued by the Financial Accounting Standards Board ("FASB") regarding the treatment of the impairment or disposal of long-lived assets. As required by these standards, CVR reviews long-lived assets (excluding goodwill, intangible assets with indefinite lives, and deferred tax assets) for impairment whenever events or changes in circumstances indicate that the carrying amount of an asset may not be recoverable. Recoverability of assets to be held and used is measured by a comparison of the carrying amount of an asset to estimated undiscounted future net cash flows expected to be generated by the asset. If the carrying amount of an asset exceeds its estimated undiscounted future net cash flows, an impairment charge is recognized for the amount by which the carrying amount of the assets exceeds their fair value. Assets to be disposed of are reported at the lower of their carrying value or fair value less cost to sell.
Revenue Recognition
Revenues for products sold are recorded upon delivery of the products to customers, which is the point at which title is transferred, the customer has the assumed risk of loss, and payment has been received or collection is reasonably assured. Deferred revenue represents customer prepayments under contracts to guarantee a price and supply of nitrogen fertilizer in quantities expected to be delivered in the next 12 months in the normal course of business. Excise and other taxes collected from customers and remitted to governmental authorities are not included in reported revenues.
Nonmonetary product exchanges and certain buy/sell crude oil transactions which are entered into in the normal course of business are included on a net cost basis in operating expenses on the Consolidated Statement of Operations.
The Company also engages in trading activities, whereby the Company enters into agreements to purchase and sell refined products with third parties. The Company acts as a principal in these transactions, taking title to the products in purchases from counterparties, and accepting the risks and rewards of ownership. The Company records revenue for the gross amount of the sales transactions, and records costs of purchases as an operating expense in the accompanying consolidated financial statements.
113
CVR Energy, Inc. and Subsidiaries
NOTES TO CONSOLIDATED FINANCIAL STATEMENTS — (Continued)
Shipping Costs
Pass-through finished goods delivery costs reimbursed by customers are reported in net sales, while an offsetting expense is included in cost of product sold (exclusive of depreciation and amortization).
Derivative Instruments and Fair Value of Financial Instruments
The petroleum business uses futures contracts, options, and forward contracts primarily to reduce exposure to changes in crude oil prices and finished goods product prices to provide economic hedges of inventory positions. Although management considers these derivatives economic hedges, these derivative instruments do not qualify as hedges for hedge accounting purposes under Accounting Standards Codification ("ASC") Topic 815, Derivatives and Hedging ("ASC 815"), and accordingly are recorded at fair value in the balance sheet. Changes in the fair value of these derivative instruments are recorded into earnings as a component of other income (expense) in the period of change. The estimated fair values of forward and swap contracts are based on quoted market prices and assumptions for the estimated forward yield curves of related commodities in periods when quoted market prices are unavailable.
The nitrogen fertilizer business uses forward swap contracts primarily to reduce the exposure to changes in interest rates on its debt and to provide a cash flow hedge. These derivative instruments have been designated as hedges for accounting purposes. Accordingly, these instruments are recorded at fair value in the Consolidated Balance Sheets at each reporting period end. The measurement of the cash flow hedge ineffectiveness is recognized in earnings, if applicable. The effective portion of the gain or loss on the swaps is reported in accumulated other comprehensive income (loss) ("AOCI"), in accordance with ASC 815. See Note 15 ("Derivative Financial Instruments") for further discussion.
Other financial instruments consisting of cash and cash equivalents, accounts receivable, and accounts payable are carried at cost, which approximates fair value, as a result of the short-term nature of the instruments. See Note 9 ("Long-Term Debt") for further discussion of the fair value of the debt instruments.
Share-Based Compensation
The Company accounts for share-based compensation in accordance with ASC Topic 718, Compensation — Stock Compensation ("ASC 718"). ASC 718 requires that compensation costs relating to share-based payment transactions be recognized in a company's financial statements. ASC 718 applies to transactions in which an entity exchanges its equity instruments for goods or services and also may apply to liabilities an entity incurs for goods or services that are based on the fair value of those equity instruments. See Note 3 ("Share-Based Compensation") for further discussion.
Treasury Stock
The Company accounts for its treasury stock under the cost method. To date, all treasury stock purchased was for the purpose of satisfying minimum statutory tax withholdings due at the vesting of non-vested stock awards.
Environmental Matters
Liabilities related to future remediation costs of past environmental contamination of properties are recognized when the related costs are considered probable and can be reasonably estimated. Estimates of these costs are based upon currently available facts, internal and third party assessments of contamination, available remediation technology, site-specific costs, and currently enacted laws and regulations. In reporting environmental liabilities, no offset is made for potential recoveries. Loss contingency accruals, including those for environmental remediation, are subject to revision as further information develops or circumstances change and such accruals can take into account the legal liability of other parties. Environmental expenditures are capitalized at the time of the expenditure when such costs provide future economic benefits.
Use of Estimates
The consolidated financial statements have been prepared in conformity with U.S. generally accepted accounting principles, using management's best estimates and judgments where appropriate. These estimates and judgments affect the reported amounts of assets and liabilities, the disclosure of contingent assets and liabilities at the date of the financial
114
CVR Energy, Inc. and Subsidiaries
NOTES TO CONSOLIDATED FINANCIAL STATEMENTS — (Continued)
statements, and the reported amounts of revenues and expenses during the reporting period. Actual results could differ materially from these estimates and judgments.
Subsequent Events
The Company evaluated subsequent events, if any, that would require an adjustment to the Company's consolidated financial statements or require disclosure in the notes to the consolidated financial statements through the date of issuance of the consolidated financial statements. See Note 20 ("Subsequent Events") for further discussion.
Recent Accounting Pronouncements
In May 2014, the FASB issued Accounting Standards Update ("ASU") No. 2014-09, "Revenue from Contracts with Customers" ("ASU 2014-09"), which requires an entity to recognize the amount of revenue to which it expects to be entitled for the transfer of promised goods or services to customers. ASU 2014-09 will replace most existing revenue recognition guidance in U.S. GAAP when it becomes effective. The standard is effective for interim and annual periods beginning after December 15, 2016 and permits the use of either the retrospective or cumulative effect transition method. Early adoption is not permitted. On July 9, 2015, the FASB approved a one-year deferral of the effective date making the standard effective for interim and annual periods beginning after December 15, 2017. The FASB will continue to permit entities to adopt the standard on the original effective date if they choose. The Company has not yet selected a transition method and is currently evaluating the standard and the impact on its consolidated financial statements and footnote disclosures.
In February 2015, the FASB issued ASU No. 2015-02, "Consolidations (Topic 810) - Amendments to the Consolidation Analysis." The new guidance makes amendments to the current consolidation guidance, including introducing a separate consolidation analysis specific to limited partnerships and other similar entities. Under this analysis, limited partnerships and other similar entities will be considered a variable-interest entity ("VIE") unless the limited partners hold substantive kick-out rights or participating rights. The standard is effective for annual periods beginning after December 15, 2015. The Company is currently evaluating the standard and the impact, if any, on its consolidated financial statements and footnote disclosures; however, the Company does not anticipate that the standard will impact the Company's conclusion with respect to the consolidation of the Refining and Nitrogen Fertilizer Partnerships.
In April 2015, the FASB issued ASU 2015-03, "Simplifying the Presentation of Debt Issuance Costs" ("ASU 2015-03"). The new standard requires that all costs incurred to issue debt be presented in the balance sheet as a direct deduction from the carrying value of the debt. The standard is effective for interim and annual periods beginning after December 15, 2015 and is required to be applied on a retrospective basis. Early adoption is permitted. The Company expects that the adoption of ASU 2015-03 will result in a reclassification of certain debt issuance costs on the Consolidated Balance Sheets.
In November 2015, the FASB issued ASU 2015-17, "Balance Sheet Classification of Deferred Taxes" ("ASU 2015-17"). The new standard requires that all deferred tax assets and liabilities, along with any related valuation allowance, be classified as noncurrent on the balance sheet. The standard is effective for interim and annual periods beginning after December 15, 2016 and early adoption is permitted. The new standard may be applied either prospectively or retrospectively upon adoption. The Company elected to early adopt ASU 2015-17 as of December 31, 2015 and applied the standard prospectively to the Consolidated Balance Sheet. The Consolidated Balance Sheet as of December 31, 2014 was not retrospectively adjusted. Refer to Note 8 ("Income Taxes") for further details.
115
CVR Energy, Inc. and Subsidiaries
NOTES TO CONSOLIDATED FINANCIAL STATEMENTS — (Continued)
(3) Share-Based Compensation
Long-Term Incentive Plan — CVR Energy
CVR has a Long-Term Incentive Plan ("LTIP"), which permits the grant of options, stock appreciation rights, restricted shares, restricted stock units, dividend equivalent rights, share awards and performance awards (including performance share units, performance units and performance-based restricted stock). As of December 31, 2015, only restricted stock units and performance units remain outstanding under the LTIP. Individuals who are eligible to receive awards and grants under the LTIP include the Company's employees, officers, consultants, advisors and directors. A summary of the principal features of the LTIP is provided below.
Shares Available for Issuance. The LTIP authorizes a share pool of 7,500,000 shares of the Company's common stock, 1,000,000 of which may be issued in respect of incentive stock options. Whenever any outstanding award granted under the LTIP expires, is canceled, is settled in cash or is otherwise terminated for any reason without having been exercised or payment having been made in respect of the entire award, the number of shares available for issuance under the LTIP is increased by the number of shares previously allocable to the expired, canceled, settled or otherwise terminated portion of the award. As of December 31, 2015, 6,787,341 shares of common stock were available for issuance under the LTIP.
Restricted Stock Units
A summary of restricted stock units activity and changes during the years ended December 31, 2015, 2014 and 2013 is presented below:
Restricted Shares | Weighted- Average Grant-Date Fair Value | Aggregate Intrinsic Value | ||||||||
(in millions) | ||||||||||
Non-vested at December 31, 2012 | 1,145,611 | $ | 23.24 | $ | 55.9 | |||||
Granted | 2,600 | 54.75 | ||||||||
Vested | (709,959 | ) | 18.73 | |||||||
Forfeited | (78,700 | ) | 42.80 | |||||||
Non-vested at December 31, 2013 | 359,552 | $ | 28.09 | $ | 15.6 | |||||
Granted | — | — | ||||||||
Vested | (281,684 | ) | 23.89 | |||||||
Forfeited | (29,857 | ) | 39.17 | |||||||
Non-vested at December 31, 2014 | 48,011 | $ | 45.89 | $ | 1.9 | |||||
Granted | — | — | ||||||||
Vested | (43,085 | ) | 45.55 | |||||||
Forfeited | (4,327 | ) | 47.68 | |||||||
Non-vested at December 31, 2015 | 599 | $ | 57.23 | $ | — | |||||
Through the LTIP, shares of restricted stock and restricted stock units (collectively "restricted shares") were previously granted to employees of the Company. These restricted shares are generally graded-vesting awards, which vest over a three-year period. Compensation expense is recognized on a straight-line basis over the vesting period of the respective tranche of the award. The IEP Acquisition and related Transaction Agreement dated April 18, 2012 between CVR and an affiliate of IEP discussed in Note 1 ("Organization and History of the Company") triggered a modification to outstanding awards under the LTIP converting the awards to restricted stock units whereby the recipient received cash settlement of the offer price of $30.00 per share in cash plus one CCP upon vesting. The CCPs expired on August 19, 2013. Restricted shares that vested in 2013, 2014 and 2015 were converted to restricted stock units whereby the awards were settled in cash upon vesting in an amount equal to the lesser of the offer price or the fair market value of the Company's common stock as determined at the most recent valuation date of December 31 of each year. The awards were remeasured at each subsequent reporting date until they vested. As a result of the modification of the awards, the classification changed from equity-classified awards to liability-classified awards.
116
CVR Energy, Inc. and Subsidiaries
NOTES TO CONSOLIDATED FINANCIAL STATEMENTS — (Continued)
In December 2012 and during 2013, awards of restricted stock units and dividend equivalent rights were granted to certain employees of CVR. The awards vest over three years with one-third of the award vesting each year with the exception of awards granted to certain executive officers that vested over one year. The award granted in December 2012 to Mr. Lipinski, the Company's Chief Executive Officer and President, was canceled in connection with the issuance of certain performance unit awards as discussed further below. Each restricted stock unit and dividend equivalent right represents the right to receive, upon vesting, a cash payment equal to (i) the fair market value of one share of the Company's common stock, plus (ii) the cash value of all dividends declared and paid by the Company per share of the Company's common stock from the grant date to and including the vesting date. The awards, which are liability-classified, are remeasured each subsequent reporting date until they vest.
As of December 31, 2015, total unrecognized compensation cost related to non-vested restricted stock units and associated dividend equivalent rights and the weighted average period over which it will be recognized were nominal. Total compensation expense for the years ended December 31, 2015, 2014 and 2013 was approximately $0.8 million, $2.6 million and $13.2 million, respectively, related to the restricted stock unit awards.
As of December 31, 2014, the Company had a liability of $1.7 million for non-vested restricted stock unit awards and associated dividend equivalent rights, which is recorded in personnel accruals on the Consolidated Balance Sheets. The liability as of December 31, 2015 was nominal. For the years ended December 31, 2015, 2014 and 2013, the Company paid cash of $2.5 million, $9.9 million and $23.8 million, respectively, to settle liability-classified restricted stock unit awards and dividend equivalent rights upon vesting.
Performance Unit Awards
In December 2013, the Company entered into performance unit awards agreements (the "2013 Performance Unit Awards Agreements") with Mr. Lipinski. Certain of the 2013 Performance Unit Awards Agreements were entered into in connection with the cancellation of Mr. Lipinski's December 2012 restricted stock unit award, as discussed above. In accordance with accounting guidance related to the modification of share-based and other compensatory award arrangements, the Company concluded that the cancellation and concurrent issuance of the performance awards created a substantive service period from the original grant date of the December 2012 restricted stock unit award through December 31, 2014, the end of the performance period for the related performance awards. Compensation cost for the related awards was recognized over the substantive service period. Total compensation expense for the years ended and December 31, 2014 and 2013 related to the performance unit awards was $4.4 million and $3.9 million, respectively.
The Company paid Mr. Lipinski approximately $6.8 million during 2014 for vested performance unit awards. As of December 31, 2014, the Company had a liability of $1.7 million recorded in personnel accruals on the Consolidated Balance Sheets for the final vested and unpaid 2013 Performance Unit Awards, which was paid in the first quarter of 2015.
In December 2015, the Company entered into a performance unit award agreement (the "2015 Performance Unit Award Agreement") with Mr. Lipinski. Compensation cost for the 2015 Performance Unit Award Agreement will be recognized over the performance cycle from January 1, 2016 to December 31, 2016. The performance unit award represents the right to receive, upon vesting, a cash payment equal to a defined threshold in accordance with the award agreement, multiplied by a performance factor that is based upon the achievement of certain operating objectives. Assuming a target performance threshold, there was approximately $3.5 million of total unrecognized compensation cost related to the 2015 Performance Unit Award Agreement to be recognized over a weighted-average period of approximately 1.0 year.
Long-Term Incentive Plan — CVR Partners
Common Units and Phantom Units
In April 2011, the board of directors of the Nitrogen Fertilizer Partnership's general partner adopted the CVR Partners, LP Long-Term Incentive Plan ("CVR Partners LTIP"). Individuals who are eligible to receive awards under the CVR Partners LTIP include (i) employees of the Nitrogen Fertilizer Partnership and its subsidiaries, (ii) employees of its general partner, (iii) members of the board of directors of its general partner and (iv) employees, consultants and directors of CVR Energy. The CVR Partners LTIP provides for the grant of options, unit appreciation rights, distribution equivalent rights, restricted units, phantom units and other unit-based awards, each in respect of common units. The maximum number of common units issuable under the
117
CVR Energy, Inc. and Subsidiaries
NOTES TO CONSOLIDATED FINANCIAL STATEMENTS — (Continued)
CVR Partners' LTIP is 5,000,000. As of December 31, 2015, there were 4,820,215 common units available for issuance under the CVR Partners LTIP.
Through the CVR Partners LTIP, phantom and common units have been awarded to employees of the Nitrogen Fertilizer Partnership and its general partner and to members of the board of directors of its general partner. In 2013, 2014 and 2015, awards of phantom units and distribution equivalent rights were granted to certain employees of the Nitrogen Fertilizer Partnership and its subsidiaries and its general partner. The awards are generally graded vesting awards, which are expected to vest over three years with one-third of the award vesting each year. Compensation expense is recognized on a straight-line basis over the vesting period of the respective tranche of the award. Each phantom unit and distribution equivalent right represents the right to receive, upon vesting, a cash payment equal to (i) the average fair market value of one unit of the Nitrogen Fertilizer Partnership's common units in accordance with the award agreement, plus (ii) the per unit cash value of all distributions declared and paid by the Nitrogen Fertilizer Partnership from the grant date to and including the vesting date. The awards, which are liability-classified, will be remeasured at each subsequent reporting date until they vest.
A summary of common units and phantom units (collectively "units") activity and changes under the CVR Partners LTIP during the years ended December 31, 2015, 2014 and 2013 is presented below:
Units | Weighted- Average Grant-Date Fair Value | Aggregate Intrinsic Value | ||||||||
(in millions) | ||||||||||
Non-vested at December 31, 2012 | 201,812 | $ | 23.70 | $ | 5.1 | |||||
Granted | 58,536 | 16.13 | ||||||||
Vested | (89,229 | ) | 23.24 | |||||||
Forfeited | — | — | ||||||||
Non-vested at December 31, 2013 | 171,119 | $ | 21.34 | $ | 2.8 | |||||
Granted | 198,141 | 9.44 | ||||||||
Vested | (48,310 | ) | 20.95 | |||||||
Forfeited | (77,004 | ) | 23.49 | |||||||
Non-vested at December 31, 2014 | 243,946 | $ | 11.07 | $ | 2.4 | |||||
Granted | 245,199 | 7.87 | ||||||||
Vested | (94,854 | ) | 12.55 | |||||||
Forfeited | (2,388 | ) | 10.99 | |||||||
Non-vested at December 31, 2015 | 391,903 | $ | 8.71 | $ | 3.1 | |||||
As of December 31, 2015, there was approximately $2.7 million of total unrecognized compensation cost related to the awards under the CVR Partners LTIP to be recognized over a weighted-average period of 1.8 years. Total compensation expense recorded for the years ended December 31, 2015, 2014 and 2013 related to the awards under the CVR Partners LTIP was approximately $1.3 million, $0.4 million and $1.3 million, respectively.
At December 31, 2015 and 2014, the Nitrogen Fertilizer Partnership had a liability of $0.7 million and $0.2 million, respectively, for cash-settled non-vested phantom unit awards and associated distribution equivalent rights, which is recorded in personnel accruals on the Consolidated Balance Sheets. For the years ended December 31, 2015, 2014 and 2013 the Nitrogen Fertilizer Partnership paid cash of $0.8 million, $0.4 million and $0.2 million, respectively, to settle liability-classified awards and associated distribution equivalent rights upon vesting.
Performance-Based Phantom Units
In May 2014, the Nitrogen Fertilizer Partnership entered into a Phantom Unit Agreement with the Chief Executive Officer and President of its general partner that included performance-based phantom units and distribution equivalent rights. Compensation cost for these awards is being recognized over the performance cycles of May 1, 2014 to December 31, 2014, January 1, 2015 to December 31, 2015 and January 1, 2016 to December 31, 2016, as the services are provided. Each phantom unit and distribution equivalent right represents the right to receive, upon vesting, a cash payment equal to (i) the average
118
CVR Energy, Inc. and Subsidiaries
NOTES TO CONSOLIDATED FINANCIAL STATEMENTS — (Continued)
closing price of the Nitrogen Fertilizer Partnership's common units in accordance with the award agreement, multiplied by a performance factor that is based upon the level of the Nitrogen Fertilizer Partnership’s production of UAN, and (ii) the per unit cash value of all distributions declared and paid by the Nitrogen Fertilizer Partnership from the grant date to and including the vesting date. Total compensation expense recorded for the years ended December 31, 2015 and 2014 related to the award was not material. Based on current estimates of performance thresholds for the remaining performance cycles, unrecognized compensation expense and the liability associated with the unvested phantom units at December 31, 2015 were also not material.
On December 31, 2014, the first award of Mr. Pytosh's Phantom Unit Agreement vested and a nominal amount was paid in 2015. On December 31, 2015, the second award of Mr. Pytosh's Phantom Unit Agreement vested and a nominal amount will be paid in 2016.
Long-Term Incentive Plan – CVR Refining
In connection with the Refining Partnership IPO, on January 16, 2013, the board of directors of the general partner of the Refining Partnership adopted the CVR Refining, LP Long-Term Incentive Plan (the "CVR Refining LTIP"). Individuals who are eligible to receive awards under the CVR Refining LTIP include (i) employees of the Refining Partnership and its subsidiaries, (ii) employees of the general partner, (iii) members of the board of directors of the general partner and (iv) certain employees, consultants and directors of CRLLC and CVR Energy who perform services for the benefit of the Refining Partnership. The CVR Refining LTIP provides for the grant of options, unit appreciation rights, restricted units, phantom units, unit awards, substitute awards, other-unit based awards, cash awards, performance awards and distribution equivalent rights, each in respect of common units. The maximum number of common units issuable under the CVR Refining LTIP is 11,070,000. As the phantom unit awards discussed below are cash-settled awards, they did not reduce the number of common units available for issuance under the plan. On August 14, 2013, the Refining Partnership filed a Form S-8 to register the common units.
In 2013, 2014 and 2015, awards of phantom units and distribution equivalent rights were granted to employees of the Refining Partnership and its subsidiaries, its general partner and certain employees of CRLLC and CVR Energy who perform services solely for the benefit of the Refining Partnership. The awards are generally graded-vesting awards, which are expected to vest over three years with one-third of the award vesting each year. Compensation expense is recognized on a straight-line basis over the vesting period of the respective tranche of the award. Each phantom unit and distribution equivalent right represents the right to receive, upon vesting, a cash payment equal to (i) the average fair market value of one unit of the Refining Partnership's common units in accordance with the award agreement, plus (ii) the per unit cash value of all distributions declared and paid by the Refining Partnership from the grant date to and including the vesting date. The awards, which are liability-classified, will be remeasured at each subsequent reporting date until they vest.
119
CVR Energy, Inc. and Subsidiaries
NOTES TO CONSOLIDATED FINANCIAL STATEMENTS — (Continued)
A summary of phantom unit activity and changes under the CVR Refining LTIP during the years ended December 31, 2015, 2014 and 2013 is presented below:
Phantom Units | Weighted- Average Grant-Date Fair Value | Aggregate Intrinsic Value | ||||||||
(in millions) | ||||||||||
Non-vested at January 16, 2013 | — | $ | — | $ | — | |||||
Granted | 187,177 | 21.55 | ||||||||
Vested | — | — | ||||||||
Forfeited | — | — | ||||||||
Non-vested at December 31, 2013 | 187,177 | $ | 21.55 | $ | 4.2 | |||||
Granted | 281,948 | 17.74 | ||||||||
Vested | (61,002 | ) | 21.55 | |||||||
Forfeited | (4,176 | ) | 21.55 | |||||||
Non-vested at December 31, 2014 | 403,947 | $ | 18.89 | $ | 6.8 | |||||
Granted | 302,319 | 20.40 | ||||||||
Vested | (136,531 | ) | 19.26 | |||||||
Forfeited | (58,144 | ) | 18.87 | |||||||
Non-vested at December 31, 2015 | 511,591 | $ | 19.68 | $ | 9.7 | |||||
As of December 31, 2015, there was approximately $8.3 million of total unrecognized compensation cost related to the awards under the CVR Refining LTIP to be recognized over a weighted-average period of 1.7 years. Total compensation expense recorded for the years ended December 31, 2015 and 2014 related to the awards under the CVR Refining LTIP was $4.6 million and $2.4 million, respectively. Total compensation expense recorded for the year ended December 31, 2013 was not material. As of December 31, 2015 and 2014, the Refining Partnership had a liability of $2.3 million and $1.0 million, respectively, for non-vested phantom unit awards and associated distribution equivalent rights, which is recorded in personnel accruals on the Consolidated Balance Sheets. For the years ended December 31, 2015 and 2014, the Refining Partnership paid cash of $3.3 million and $1.4 million, respectively, to settle liability-classified phantom unit awards and associated distribution equivalent rights upon vesting.
In December 2014, the Company granted an award of 227,927 incentive units in the form of stock appreciation rights ("SARs") to an executive of CVR Energy. In April 2015, the award granted was cancelled and replaced by an award of notional units in the form of SARs by CVR Refining pursuant to the CVR Refining LTIP. The replacement award is structured on the same economic and other terms as the incentive unit award and did not result in a material impact. Each SAR vests over three years and entitles the executive to receive a cash payment in an amount equal to the excess of the fair market value of one unit of the Refining Partnership's common units for the first ten trading days in the month prior to vesting over the grant price of the SAR. The fair value will be adjusted to include all distributions declared and paid by the Refining Partnership during the vesting period. The fair value of each SAR is estimated at the end of each reporting period using the Black-Scholes option-pricing model. Assumptions utilized to value the award have been omitted due to immateriality of the award. Total compensation expense during the years ended December 31, 2015 and 2014 and the liability related to the SARs as of December 31, 2015 and 2014 were not material.
Incentive Unit Awards
In 2013, 2014 and 2015, the Company granted awards of incentive units and distribution equivalent rights to certain employees of CRLLC, CVR Energy and CVR GP, LLC. The awards are generally graded-vesting awards, which are expected to vest over three years with one-third of the award vesting each year. Compensation expense is recognized on a straight-line basis over the vesting period of the respective tranche of the award. Each incentive unit and distribution equivalent right represents the right to receive, upon vesting, a cash payment equal to (i) the average fair market value of one unit of the Refining Partnership's common units in accordance with the award agreement, plus (ii) the per unit cash value of all distributions declared and paid by the Refining Partnership from the grant date to and including the vesting date. The awards, which are liability-classified, will be remeasured at each subsequent reporting date until they vest.
120
CVR Energy, Inc. and Subsidiaries
NOTES TO CONSOLIDATED FINANCIAL STATEMENTS — (Continued)
A summary of incentive unit activity and changes during the years ended December 31, 2015, 2014 and 2013 is presented below:
Incentive Units | Weighted- Average Grant-Date Fair Value | Aggregate Intrinsic Value | ||||||||
(in millions) | ||||||||||
Non-vested at December 31, 2012 | — | $ | — | $ | — | |||||
Granted | 251,431 | 22.62 | ||||||||
Vested | — | — | ||||||||
Forfeited | — | — | ||||||||
Non-vested at December 31, 2013 | 251,431 | $ | 22.62 | $ | 5.7 | |||||
Granted | 332,586 | 17.81 | ||||||||
Vested | (65,601 | ) | 22.63 | |||||||
Forfeited | (82,901 | ) | 22.62 | |||||||
Non-vested at December 31, 2014 | 435,515 | $ | 18.95 | $ | 7.3 | |||||
Granted | 347,811 | 20.38 | ||||||||
Vested | (160,120 | ) | 19.33 | |||||||
Forfeited | (18,264 | ) | 19.69 | |||||||
Non-vested at December 31, 2015 | 604,942 | $ | 19.64 | $ | 11.5 | |||||
As of December 31, 2015, there was approximately $9.6 million of total unrecognized compensation cost related to non-vested incentive units to be recognized over a weighted-average period of approximately 1.7 years. Total compensation expense for the years ended December 31, 2015 and 2014 related to the incentive units was $5.7 million and $2.4 million, respectively. Total compensation expense for the year ended December 31, 2013 related to the incentive units was not material. As of December 31, 2015 and 2014, the Company had a liability of $2.6 million and $0.8 million, respectively, for non-vested incentive units and associated distribution equivalent rights, which is recorded in personnel accruals on the Consolidated Balance Sheets. For the years ended December 31, 2015 and 2014, the Company paid cash of $3.9 million and $1.6 million, respectively, to settle liability-classified incentive unit awards and associated distribution equivalent rights upon vesting.
(4) Inventories
Inventories consisted of the following:
December 31, | |||||||
2015 | 2014 | ||||||
(in millions) | |||||||
Finished goods | $ | 114.5 | $ | 176.2 | |||
Raw materials and precious metals | 81.2 | 88.0 | |||||
In-process inventories | 35.8 | 20.6 | |||||
Parts and supplies | 58.4 | 44.8 | |||||
$ | 289.9 | $ | 329.6 | ||||
Due to the crude pricing environment and subsequent reduction in sales prices for the petroleum business' refined products at the end of 2014, the Refining Partnership recorded a lower of FIFO cost or market inventory adjustment of approximately $36.8 million as of December 31, 2014. The inventory adjustment is included in cost of product sold (exclusive of depreciation and amortization) in the Consolidated Statements of Operations.
121
CVR Energy, Inc. and Subsidiaries
NOTES TO CONSOLIDATED FINANCIAL STATEMENTS — (Continued)
(5) Property, Plant and Equipment
A summary of costs for property, plant, and equipment is as follows:
December 31, | |||||||
2015 | 2014 | ||||||
(in millions) | |||||||
Land and improvements | $ | 38.6 | $ | 37.4 | |||
Buildings | 53.6 | 50.4 | |||||
Machinery and equipment | 2,723.0 | 2,581.2 | |||||
Automotive equipment | 24.8 | 22.1 | |||||
Furniture and fixtures | 21.3 | 19.0 | |||||
Leasehold improvements | 3.6 | 3.4 | |||||
Aircraft | 3.6 | 3.7 | |||||
Railcars | 16.3 | 14.5 | |||||
Construction in progress | 122.3 | 71.5 | |||||
3,007.1 | 2,803.2 | ||||||
Accumulated depreciation | 1,040.0 | 887.2 | |||||
$ | 1,967.1 | $ | 1,916.0 | ||||
Capitalized interest recognized as a reduction in interest expense for the years ended December 31, 2015, 2014 and 2013 totaled approximately $3.7 million, $9.4 million and $3.6 million, respectively. Land, building and equipment that are under a capital lease obligation had an original carrying value of approximately $24.8 million at both December 31, 2015 and 2014, respectively. Amortization of assets held under capital leases is included in depreciation expense.
(6) Goodwill
The Nitrogen Fertilizer Partnership completes its annual test for impairment of goodwill as of November 1 each year. The Nitrogen Fertilizer Partnership elected to perform a qualitative evaluation for the years ended December 31, 2015 and 2014 to determine whether it was necessary to perform the quantitative two step goodwill analysis described in ASC 350, "Intangibles - Goodwill and Other." After assessing the totality of events and circumstances, it was determined that it was not more likely than not that the fair value of the Nitrogen Fertilizer Partnership was less than the carrying value, and so it was not necessary to perform the two-step goodwill impairment analysis. Based on the results of the tests, no impairment of goodwill was recorded for any of the periods presented.
(7) Insurance Claims
On July 29, 2014, the Coffeyville refinery experienced a fire at its isomerization unit. Four employees were injured in the fire, including one employee who was fatally injured. The fire was extinguished, and the refinery was subsequently shut down due to a failure of its plant-wide Distributed Control System, which was directly caused by the fire. The Coffeyville refinery returned to operations in mid-August, with all units except the isomerization unit in operation by August 23, 2014. The isomerization unit started operating on October 12, 2014. This interruption adversely impacted production of refined products for the petroleum business in the third quarter of 2014. Total gross repair and other costs recorded related to the incident for the year ended December 31, 2014 were approximately $6.3 million.
The Refining Partnership is covered by property damage insurance policies at the time of the incident, which had an associated deductible of $5.0 million for the Coffeyville refinery. The Refining Partnership anticipates amounts in excess of the $5.0 million deductible related to the isomerization unit fire incident will be recoverable under the property insurance policies. As of December 31, 2015 and 2014, the Refining Partnership had an insurance receivable related to the incident of approximately $1.2 million and $1.3 million, respectively, which is included in prepaid expenses and other current assets in the Consolidated Balance Sheet. The recording of the receivable resulted in a reduction of direct operating expenses (exclusive of depreciation and amortization).
122
CVR Energy, Inc. and Subsidiaries
NOTES TO CONSOLIDATED FINANCIAL STATEMENTS — (Continued)
During the outage at the Coffeyville refinery as discussed above, the Refining Partnership accelerated certain planned turnaround activities scheduled for 2015 and incurred approximately $5.5 million in turnaround expenses for the year ended December 31, 2014.
(8) Income Taxes
On May 19, 2012, CVR became a member of the consolidated federal tax group of AEPC, a wholly-owned subsidiary of IEP, and subsequently entered into a tax allocation agreement with AEPC (the "Tax Allocation Agreement"). The Tax Allocation Agreement provides that AEPC will pay all consolidated federal income taxes on behalf of the consolidated tax group. CVR is required to make payments to AEPC in an amount equal to the tax liability, if any, that it would have paid if it were to file as a consolidated group separate and apart from AEPC.
As of December 31, 2015 and 2014, the Company's Consolidated Balance Sheets reflected a receivable of $11.6 million and $44.5 million, respectively, for an overpayment of federal income taxes due to AEPC. The overpayment for 2015 will be applied as a credit against the Company's estimated tax to be paid during 2016 while the overpayment for 2014 was applied as a credit against the Company's tax owed during 2015. These amounts are recorded as due from parent in the Consolidated Balance Sheets. During the years ended December 31, 2015, 2014 and 2013, the Company paid $57.5 million, $120.1 million and $260.0 million, respectively, to AEPC under the Tax Allocation Agreement.
Income tax expense (benefit) is comprised of the following:
Year Ended December 31, | |||||||||||
2015 | 2014 | 2013 | |||||||||
(in millions) | |||||||||||
Current | |||||||||||
Federal | $ | 74.9 | $ | 76.1 | $ | 265.8 | |||||
State | 14.5 | 16.6 | 21.5 | ||||||||
Total current | 89.4 | 92.7 | 287.3 | ||||||||
Deferred | |||||||||||
Federal | 2.7 | 8.3 | (93.5 | ) | |||||||
State | (7.6 | ) | (3.3 | ) | (10.1 | ) | |||||
Total deferred | (4.9 | ) | 5.0 | (103.6 | ) | ||||||
Total income tax expense | $ | 84.5 | $ | 97.7 | $ | 183.7 | |||||
The following is a reconciliation of total income tax expense (benefit) to income tax expense (benefit) computed by applying the statutory federal income tax rate (35%) to pretax income (loss):
Year Ended December 31, | |||||||||||
2015 | 2014 | 2013 | |||||||||
(in millions) | |||||||||||
Tax computed at federal statutory rate | $ | 133.8 | $ | 142.5 | $ | 247.0 | |||||
State income taxes, net of federal tax benefit | 11.7 | 14.0 | 16.5 | ||||||||
State tax incentives, net of federal tax expense | (7.2 | ) | (5.4 | ) | (9.0 | ) | |||||
Domestic production activities deduction | (5.9 | ) | (5.5 | ) | (18.5 | ) | |||||
Non-deductible share-based compensation | — | 0.2 | 1.5 | ||||||||
Noncontrolling interest | (44.9 | ) | (47.4 | ) | (53.0 | ) | |||||
Other, net | (3.0 | ) | (0.7 | ) | (0.8 | ) | |||||
Total income tax expense | $ | 84.5 | $ | 97.7 | $ | 183.7 | |||||
The Company earns Kansas High Performance Incentive Program ("HPIP") credits for qualified business facility investment within the state of Kansas. CVR recognized a net income tax benefit of approximately $4.3 million, $2.8 million
123
CVR Energy, Inc. and Subsidiaries
NOTES TO CONSOLIDATED FINANCIAL STATEMENTS — (Continued)
and $7.8 million on a credit of approximately $6.7 million, $4.3 million and $12.0 million for the years ended December 31, 2015, 2014 and 2013, respectively, with respect to the HPIP credits. The Company earns Oklahoma Investment credits for qualified manufacturing facility investment within the state of Oklahoma. CVR recognized a net income tax benefit of approximately $2.9 million, $2.5 million and $1.2 million on a credit of approximately $4.4 million, $3.9 million and $1.8 million for the years ended December 31, 2015, 2014 and 2013, respectively, with respect to the Oklahoma Investment credits.
As discussed in Note 2 ("Summary of Significant Accounting Policies"), the Company elected to early adopt ASU 2015-17 as of December 31, 2015. The new standard requires that all deferred tax assets and liabilities, along with any related valuation allowance, be classified as noncurrent on the balance sheet. The Company applied the new standard prospectively to the Consolidated Balance Sheet as of December 31, 2015. The reclassification of current deferred income taxes to noncurrent deferred income taxes was not material. The Consolidated Balance Sheet as of December 31, 2014 was not retrospectively adjusted.
The income tax effect of temporary differences that give rise to significant portions of the deferred income tax assets and deferred income tax liabilities at December 31, 2015 and 2014 are as follows:
Year Ended December 31, | |||||||
2015 | 2014 | ||||||
(in millions) | |||||||
Deferred income tax assets: | |||||||
Personnel accruals | $ | 1.5 | $ | 1.8 | |||
State tax credit carryforward, net | 11.0 | 12.6 | |||||
Contingent liabilities | 0.1 | 0.1 | |||||
Other | — | 2.1 | |||||
Total gross deferred income tax assets | 12.6 | 16.6 | |||||
Deferred income tax liabilities: | |||||||
Property, plant, and equipment | (3.1 | ) | (2.7 | ) | |||
Investment in CVR Partners | (83.4 | ) | (76.1 | ) | |||
Investment in CVR Refining | (565.3 | ) | (569.4 | ) | |||
Prepaid expenses | (0.3 | ) | (0.3 | ) | |||
Other | (0.2 | ) | (0.1 | ) | |||
Total gross deferred income tax liabilities | (652.3 | ) | (648.6 | ) | |||
Net deferred income tax liabilities | $ | (639.7 | ) | $ | (632.0 | ) | |
CVR has Oklahoma state income tax credits of approximately $25.9 million which are available to reduce future Oklahoma state regular income taxes. These credits have an indefinite life.
In assessing the realizability of deferred tax assets including credit carryforwards, management considers whether it is more likely than not that some portion or all of the deferred tax assets will not be realized. The ultimate realization of deferred tax assets is dependent upon the generation of future taxable income during the periods in which those temporary differences become deductible. Management considers the scheduled reversal of deferred tax liabilities, projected future taxable income, and tax planning strategies in making this assessment. Although realization is not assured, management believes that it is more likely than not that all of the deferred tax assets will be realized and thus, no valuation allowance was provided as of December 31, 2015 and 2014.
124
CVR Energy, Inc. and Subsidiaries
NOTES TO CONSOLIDATED FINANCIAL STATEMENTS — (Continued)
A reconciliation of the unrecognized tax benefits for the years ended December 31, 2015, 2014 and 2013 is as follows:
Year Ended December 31, | |||||||||||
2015 | 2014 | 2013 | |||||||||
(in millions) | |||||||||||
Balance beginning of year | $ | 55.5 | $ | 45.2 | $ | 36.9 | |||||
Increase based on prior year tax positions | — | 0.5 | — | ||||||||
Decrease based on prior year tax positions | — | — | (6.4 | ) | |||||||
Increases in current year tax positions | 9.8 | 9.8 | 14.7 | ||||||||
Settlements | — | — | — | ||||||||
Reductions related to expirations of statute of limitations | (16.3 | ) | — | — | |||||||
Balance end of year | $ | 49.0 | $ | 55.5 | $ | 45.2 | |||||
Included in the balance of unrecognized tax benefits as of December 31, 2015, 2014 and 2013 are $31.8 million, $25.6 million and $19.1 million, respectively, of tax benefits that, if recognized, would affect the effective tax rate. Approximately $16.3 million of the unrecognized tax positions relating to the characterization of partnership distributions received were recognized by the end of 2015 as a result of a lapse of the statute of limitations. Additionally, the Company believes that it is reasonably possible that approximately $11.6 million of its unrecognized tax positions relating to state tax credits may be recognized by the end of 2016 as a result of a lapse of the statute of limitations. Under ASU 2013-11, approximately $25.9 million and $13.5 million of unrecognized tax benefits were netted with deferred tax asset carryforwards as of December 31, 2015 and 2014, respectively. The remaining unrecognized tax benefits are included in other long-term liabilities in the Consolidated Balance Sheets.
CVR recognizes interest expense (income) and penalties on uncertain tax positions and income tax deficiencies (refunds) in income tax expense. CVR recognized interest expense of approximately $1.0 million during 2015. No penalties were recognized during 2015. As of December 31, 2015, CVR has recognized a liability for interest of approximately $7.5 million. No liability was recognized for penalties in 2015. In 2014, CVR recognized interest expense of approximately $3.8 million. No penalties were recognized during 2014. As of December 31, 2014, CVR had recognized a liability for interest of approximately $6.5 million. No liability was recognized for penalties in 2014. In 2013, CVR recognized interest expense of approximately $2.2 million. No penalties were recognized during 2013.
At December 31, 2015, the Company's tax filings are generally open to examination in the United States for the tax years ended December 31, 2012 through December 31, 2014 and in various individual states for the tax years ended December 31, 2011 through December 31, 2014.
(9) Long-Term Debt
Long-term debt was as follows:
December 31, 2015 | December 31, 2014 | ||||||
(in millions) | |||||||
6.5% Senior Notes due 2022 | $ | 500.0 | $ | 500.0 | |||
CRNF credit facility | 125.0 | 125.0 | |||||
Capital lease obligations | 48.5 | 49.9 | |||||
Total debt | 673.5 | 674.9 | |||||
Current portion of long-term debt and capital lease obligations | (126.6 | ) | (1.4 | ) | |||
Long-term debt, net of current portion | $ | 546.9 | $ | 673.5 | |||
Old Senior Secured Notes
On April 6, 2010, CRLLC and its then wholly-owned subsidiary, Coffeyville Finance, completed a private offering of $225.0 million aggregate principal amount of 10.875% Second Lien Senior Secured Notes due 2017 (the "Old Second Lien
125
CVR Energy, Inc. and Subsidiaries
NOTES TO CONSOLIDATED FINANCIAL STATEMENTS — (Continued)
Notes"). The Old Second Lien Notes were scheduled to mature on April 1, 2017, unless earlier redeemed or repurchased by the issuers. On January 23, 2013, $253.0 million of the proceeds from the Refining Partnership's IPO were utilized to satisfy and discharge the indenture governing the Old Second Lien Notes. The amounts were used to (i) repay the face amount of all $222.8 million aggregate principal amount of Old Second Lien Notes then outstanding, (ii) pay the redemption premium of approximately $20.6 million and (iii) settle accrued interest with respect thereto in an amount of approximately $9.5 million. The repurchase of the Old Second Lien Notes resulted in a loss on extinguishment of debt of approximately $26.1 million for the year ended December 31, 2013, which includes the write-off of previously deferred financing fees of $3.7 million and unamortized original issue discount of $1.8 million.
2022 Senior Secured Notes
On October 23, 2012, Refining LLC and Coffeyville Finance completed a private offering of $500.0 million aggregate principal amount of 6.5% Second Lien Senior Secured Notes due 2022 (the "2022 Notes"). The 2022 Notes were issued at par. Refining LLC received approximately $492.5 million of cash proceeds, net of the underwriting fees, but before deducting other third-party fees and expenses associated with the offering. The 2022 Notes were secured by substantially the same assets that secured the then outstanding Old Second Lien Notes, subject to exceptions, until such time that the then outstanding Old Second Lien Notes were satisfied and discharged in full, which occurred on January 23, 2013. Accordingly, the 2022 Notes are no longer secured. The 2022 Notes are fully and unconditionally guaranteed by CVR Refining and each of Refining LLC's existing domestic subsidiaries on a joint and several basis. CVR Refining has no independent assets or operations and Refining LLC is a 100% owned finance subsidiary of CVR Refining. Prior to the satisfaction and discharge of the Second Lien Notes, which occurred on January 23, 2013, the 2022 Notes were also guaranteed by CRLLC. CVR Energy, the Nitrogen Fertilizer Partnership and CRNF, a wholly owned subsidiary of the Nitrogen Fertilizer Partnership, are not guarantors.
The net proceeds from the offering of the 2022 Notes were used to purchase all of the then outstanding First Lien Secured Notes due 2015 through a tender offer and settled redemption in the fourth quarter of 2012.
The debt issuance costs of the 2022 Notes totaled approximately $8.7 million and are being amortized over the term of the 2022 Notes as interest expense using the effective-interest amortization method. On September 17, 2013, Refining LLC and Coffeyville Finance consummated a registered exchange offer, whereby all $500.0 million of the outstanding 2022 Notes were exchanged for an equal principal amount of notes with identical terms that were registered under the Securities Act of 1933. The exchange offer fulfilled the Refining Partnership's obligations contained in the registration rights agreement entered into in connection with the issuance of the 2022 Notes. The Refining Partnership incurred approximately $0.4 million of debt registration costs related to the registration and exchange offer during the year ended December 31, 2013, which are being amortized over the term of the 2022 Notes as interest expense using the effective-interest amortization method.
The 2022 Notes mature on November 1, 2022, unless earlier redeemed or repurchased by the issuers. Interest is payable on the 2022 Notes semi-annually on May 1 and November 1 of each year, commencing on May 1, 2013.
The 2022 Notes contain customary covenants for a financing of this type that limit, subject to certain exceptions, the incurrence of additional indebtedness or guarantees, the creation of liens on assets, the ability to dispose of assets, the ability to make certain payments on contractually subordinated debt, the ability to merge, consolidate with or into another entity and the ability to enter into certain affiliate transactions. The 2022 Notes provide that the Refining Partnership can make distributions to holders of its common units provided, among other things, it has a minimum fixed charge coverage ratio and there is no default or event of default under the 2022 Notes. As of December 31, 2015, the Refining Partnership was in compliance with the covenants contained in the 2022 Notes.
Included in other current liabilities on the Consolidated Balance Sheets is accrued interest payable totaling approximately $5.4 million as of both December 31, 2015 and 2014 related to the 2022 Notes. At December 31, 2015, the estimated fair value of the 2022 Notes was approximately $485.0 million. This estimate of fair value is Level 2 as it was determined by quotations obtained from a broker-dealer who makes a market in these and similar securities.
126
CVR Energy, Inc. and Subsidiaries
NOTES TO CONSOLIDATED FINANCIAL STATEMENTS — (Continued)
Amended and Restated Asset Based (ABL) Credit Facility
On December 20, 2012, CRLLC, CVR Refining, Refining LLC and each of the operating subsidiaries of Refining LLC (collectively, the "Credit Parties") entered into an amended and restated ABL credit agreement (the "Amended and Restated ABL Credit Facility") with a group of lenders and Wells Fargo Bank, National Association ("Wells Fargo"), as administrative agent and collateral agent. The Amended and Restated ABL Credit Facility is scheduled to mature on December 20, 2017. Under the Amended and Restated ABL Credit Facility, the Refining Partnership assumed the Company's position as borrower and the Company's obligations under the facility upon the closing of the Refining Partnership's IPO on January 23, 2013, as further discussed in Note 1 ("Organization and History of the Company").
The Amended and Restated ABL Credit Facility is a senior secured asset-based revolving credit facility in an aggregate principal amount of up to $400.0 million with an incremental facility, which permits an increase in borrowings of up to $200.0 million subject to additional lender commitments and certain other conditions. The proceeds of the loans may be used for capital expenditures and working capital and general corporate purposes of the Credit Parties and their subsidiaries. The Amended and Restated ABL Credit Facility provides for loans and letters of credit in an amount up to the aggregate availability under the facility, subject to meeting certain borrowing base conditions, with sub-limits of 10% of the total facility commitment for swingline loans and 90% of the total facility commitment for letters of credit.
Borrowings under the Amended and Restated ABL Credit Facility bear interest at either a base rate or LIBOR plus an applicable margin. The applicable margin is (i) (a) 1.75% for LIBOR borrowings and (b) 0.75% for prime rate borrowings, in each case if quarterly average excess availability exceeds 50% of the lesser of the borrowing base and the total commitments and (ii) (a) 2.00% for LIBOR borrowings and (b) 1.00% for prime rate borrowings, in each case if quarterly average excess availability is less than or equal to 50% of the lesser of the borrowing base and the total commitments. The Amended and Restated ABL Credit Facility also requires the payment of customary fees, including an unused line fee of (i) 0.40% if the daily average amount of loans and letters of credit outstanding is less than 50% of the lesser of the borrowing base and the total commitments and (ii) 0.30% if the daily average amount of loans and letters of credit outstanding is equal to or greater than 50% of the lesser of the borrowing base and the total commitments. The Refining Partnership is also required to pay customary letter of credit fees equal to, for standby letters of credit, the applicable margin on LIBOR loans on the maximum amount available to be drawn under and for commercial letters of credit, the applicable margin on LIBOR loans less 0.50% on the maximum amount available to be drawn under, and customary facing fees equal to 0.125% of the face amount of, each letter of credit.
The Amended and Restated ABL Credit Facility also contains customary covenants for a financing of this type that limit the ability of the Credit Parties and their respective subsidiaries to, among other things, incur liens, engage in a consolidation, merger, purchase or sale of assets, pay dividends, incur indebtedness, make advances, investment and loans, enter into affiliate transactions, issue equity interests, or create subsidiaries and unrestricted subsidiaries. The amended and restated facility also contains a fixed charge coverage ratio financial covenant, as defined under the facility. The Credit Parties were in compliance with the covenants of the Amended and Restated ABL Credit Facility as of December 31, 2015.
In connection with the Amended and Restated ABL Credit Facility, CRLLC and its subsidiaries incurred lender and other third-party costs of approximately $2.1 million for the year ended December 31, 2012, which are being deferred and amortized to interest expense and other financing costs using a straight-line method over the term of the amended facility. Additionally, in accordance with guidance provided by the FASB regarding the modification of revolving debt arrangements, the remaining approximately $2.8 million of unamortized deferred financing costs associated with the prior ABL credit facility will continue to be amortized over the term of the Amended and Restated ABL Credit Facility.
As of December 31, 2015, the Refining Partnership and its subsidiaries had availability under the Amended and Restated ABL Credit Facility of $290.1 million and had letters of credit outstanding of approximately $27.8 million. There were no borrowings outstanding under the Amended and Restated ABL Credit Facility as of December 31, 2015. Availability under the Amended and Restated ABL Credit Facility was limited by borrowing base conditions as of December 31, 2015.
127
CVR Energy, Inc. and Subsidiaries
NOTES TO CONSOLIDATED FINANCIAL STATEMENTS — (Continued)
Nitrogen Fertilizer Partnership Credit Facility
The Nitrogen Fertilizer Partnership credit facility includes a term loan facility of $125.0 million and a revolving credit facility of $25.0 million with an uncommitted incremental facility of up to $50.0 million. No amounts were outstanding under the revolving credit facility at December 31, 2015. There is no scheduled amortization. The credit facility matures on April 13, 2016; therefore, the principal portion of the term loan is presented as current portion of long-term debt on the Consolidated Balance Sheets as of December 31, 2015. The carrying value of the Nitrogen Fertilizer Partnership's debt approximates fair value. The Nitrogen Fertilizer Partnership is considering capital structure and refinancing options associated with the credit facility maturity.
Borrowings under the credit facility bear interest based on a pricing grid determined by the trailing four quarter leverage ratio. The initial pricing for Eurodollar rate loans under the credit facility is the Eurodollar rate plus a margin of 3.50% or, for base rate loans, the prime rate plus 2.50%. Under its terms, the lenders under the credit facility were granted a perfected, first priority security interest (subject to certain customary exceptions) in substantially all of the assets of CRNF and the Nitrogen Fertilizer Partnership. At December 31, 2015 the effective rate was approximately 4.60%, inclusive of the impact of interest rate swaps discussed in Note 15 ("Derivative Financial Instruments").
The credit facility requires the Nitrogen Fertilizer Partnership to maintain a minimum interest coverage ratio and a maximum leverage ratio and contains customary covenants for a financing of this type that limit, subject to certain exceptions, the incurrence of additional indebtedness or guarantees, the creation of liens on assets, the ability to dispose of assets, the ability to make restricted payments, investments and acquisitions, sale-leaseback transactions and affiliate transactions. The credit facility provides that the Nitrogen Fertilizer Partnership can make distributions to holders of its common units provided, among other things, it is in compliance with the leverage ratio and interest coverage ratio on a pro forma basis after giving effect to any distribution and there is no default or event of default under the credit facility. As of December 31, 2015, CRNF was in compliance with the covenants contained in the credit facility and there were no borrowings outstanding under the credit facility.
In connection with the credit facility, the Nitrogen Fertilizer Partnership incurred lender and other third-party costs of approximately $4.8 million for the year ended December 31, 2011. The costs associated with the credit facility have been deferred and are being amortized over the term of the credit facility as interest expense using the effective-interest amortization method for the term loan facility and the straight-line method for the revolving credit facility.
On February 9, 2016, CRLLC and the Nitrogen Fertilizer Partnership entered into a guaranty, pursuant to which CRLLC agreed to guaranty the indebtedness outstanding under the Nitrogen Fertilizer Partnership's credit facility. If the credit facility becomes due prior to a refinancing by the Nitrogen Fertilizer Partnership, CRLLC is required to pay the indebtedness pursuant to this guaranty. The Nitrogen Fertilizer Partnership's obligation to repay CRLLC for the indebtedness will be pursuant to a promissory note ("the Note"). The terms of the Note will be mutually agreed upon by the parties, provided, the term will be the lesser of two years or such time that the Nitrogen Fertilizer Partnership obtains third-party financing ("New Debt") of at least $125.0 million on terms acceptable to the Nitrogen Fertilizer Partnership with a term of greater than one year from the inception of the New Debt.
128
CVR Energy, Inc. and Subsidiaries
NOTES TO CONSOLIDATED FINANCIAL STATEMENTS — (Continued)
Deferred Financing Costs
For the years ended December 31, 2015, 2014 and 2013, amortization of deferred financing costs reported as interest expense and other financing costs totaled approximately $2.8 million, $2.8 million and $2.9 million, respectively.
Estimated amortization of deferred financing costs is as follows:
Year Ending December 31, | Deferred Financing | ||
(in millions) | |||
2016 | $ | 2.2 | |
2017 | 1.8 | ||
2018 | 0.9 | ||
2019 | 0.9 | ||
2020 | 0.9 | ||
Thereafter | 1.7 | ||
$ | 8.4 | ||
Capital Lease Obligations
The Refining Partnership maintains two leases, accounted for as a capital lease and a finance obligation, related to the Magellan Pipeline Terminals, L.P. ("Magellan Pipeline") and Excel Pipeline LLC ("Excel Pipeline"). The underlying assets and related depreciation were included in property, plant and equipment. The capital lease relates to a sales-lease back agreement with Sunoco Pipeline, L.P. for its membership interest in the Excel Pipeline. The lease has 166 months remaining through September 2029. The financing agreement relates to the Magellan Pipeline terminals, bulk terminal and loading facility. The lease has 165 months remaining and will expire in September 2029. As of December 31, 2015, the outstanding obligation associated with these arrangements totaled approximately $48.5 million, of which $46.9 million is included in long-term liabilities and $1.6 million is included in current liabilities in the Consolidated Balance Sheets.
Future payments required under capital lease at December 31, 2015 are as follows:
Year Ending December 31, | Capital Lease | ||
(in millions) | |||
2016 | $ | 6.4 | |
2017 | 6.5 | ||
2018 | 6.5 | ||
2019 | 6.5 | ||
2020 | 6.5 | ||
2021 and thereafter | 57.2 | ||
Total future payments | 89.6 | ||
Less: amount representing interest | 41.1 | ||
Present value of future minimum payments | 48.5 | ||
Less: current portion | 1.6 | ||
Long-term portion | $ | 46.9 | |
129
CVR Energy, Inc. and Subsidiaries
NOTES TO CONSOLIDATED FINANCIAL STATEMENTS — (Continued)
(10) Dividends
On January 24, 2013, the board of directors of the Company adopted a quarterly cash dividend policy. Dividends are subject to change at the discretion of the board of directors. The Company began paying regular quarterly dividends in the second quarter of 2013. Additionally, the Company declared and paid one special cash dividend during the year ended December 31, 2014.
The following is a summary of the quarterly and special dividends paid to stockholders during the years ended December 31, 2015 and 2014:
December 31, 2014 | March 31, 2015 | June 30, 2015 | September 30, 2015 | Total Dividends Paid in 2015 | |||||||||||||||
(in millions, except per share data) | |||||||||||||||||||
Dividend type | Quarterly | Quarterly | Quarterly | Quarterly | |||||||||||||||
Amount paid to IEP | $ | 35.6 | $ | 35.6 | $ | 35.6 | $ | 35.6 | $ | 142.4 | |||||||||
Amounts paid to public stockholders | 7.8 | 7.8 | 7.8 | 7.8 | 31.3 | ||||||||||||||
Total amount paid | $ | 43.4 | $ | 43.4 | $ | 43.4 | $ | 43.4 | $ | 173.7 | |||||||||
Per common share | $ | 0.50 | $ | 0.50 | $ | 0.50 | $ | 0.50 | $ | 2.00 | |||||||||
Shares outstanding | 86.8 | 86.8 | 86.8 | 86.8 | |||||||||||||||
December 31, 2013 | March 31, 2014 | June 30, 2014 | July 17, 2014 | September 30, 2014 | Total Dividends Paid in 2014 | ||||||||||||||||||
(in millions, except per share data) | |||||||||||||||||||||||
Dividend type | Quarterly | Quarterly | Quarterly | Special | Quarterly | ||||||||||||||||||
Amount paid to IEP | $ | 53.4 | $ | 53.4 | $ | 53.4 | $ | 142.4 | $ | 53.4 | $ | 356.0 | |||||||||||
Amounts paid to public stockholders | 11.7 | 11.7 | 11.7 | 31.3 | 11.7 | 78.2 | |||||||||||||||||
Total amount paid | $ | 65.1 | $ | 65.1 | $ | 65.1 | $ | 173.7 | $ | 65.1 | $ | 434.2 | |||||||||||
Per common share | $ | 0.75 | $ | 0.75 | $ | 0.75 | $ | 2.00 | $ | 0.75 | $ | 5.00 | |||||||||||
Shares outstanding | 86.8 | 86.8 | 86.8 | 86.8 | 86.8 | ||||||||||||||||||
(11) Earnings Per Share
The computations of the basic and diluted earnings per share for the years ended December 31, 2015, 2014 and 2013 are as follows:
For the Year Ended December 31, | |||||||||||
2015 | 2014 | 2013 | |||||||||
(in millions, except per share data) | |||||||||||
Net income attributable to CVR Energy stockholders | $ | 169.6 | $ | 173.9 | $ | 370.7 | |||||
Weighted-average shares of common stock outstanding - Basic | 86.8 | 86.8 | 86.8 | ||||||||
Weighted-average shares of common stock outstanding - Diluted | 86.8 | 86.8 | 86.8 | ||||||||
Basic earnings per share | $ | 1.95 | $ | 2.00 | $ | 4.27 | |||||
Diluted earnings per share | $ | 1.95 | $ | 2.00 | $ | 4.27 | |||||
There were no dilutive awards outstanding during the years ended December 31, 2015, 2014 and 2013 as all unvested awards under the LTIP were liability-classified awards. See Note 3 ("Share-Based Compensation").
130
CVR Energy, Inc. and Subsidiaries
NOTES TO CONSOLIDATED FINANCIAL STATEMENTS — (Continued)
(12) Benefit Plans
CVR sponsors and administers two defined-contribution 401(k) plans, the CVR Energy 401(k) Plan and the CVR Energy 401(k) Plan for Represented Employees (the "Plans"), in which CVR employees may participate. Participants in the Plans may elect to contribute a designated percentage of their eligible compensation in accordance with the Plans, subject to statutory limits. CVR provides a matching contribution of 100% of the first 6% of eligible compensation contributed by participants. Contributions to the represented plan are determined in accordance with provisions of negotiated labor contracts. Participants in both Plans are immediately vested in their individual contributions. Both Plans provide for a three-year vesting schedule for CVR's matching contributions and contain a provision to count service with predecessor organizations. CVR's contributions under the Plans were approximately $7.3 million, $6.6 million and $6.1 million for the years ended December 31, 2015, 2014 and 2013, respectively.
(13) Commitments and Contingencies
The minimum required payments for CVR's operating lease agreements and unconditional purchase obligations are as follows:
Year Ending December 31, | Operating Leases | Unconditional Purchase Obligations(1) | |||||
(in millions) | |||||||
2016 | $ | 8.0 | $ | 141.0 | |||
2017 | 5.5 | 125.6 | |||||
2018 | 3.9 | 124.3 | |||||
2019 | 2.1 | 123.5 | |||||
2020 | 1.5 | 107.8 | |||||
Thereafter | 2.5 | 727.4 | |||||
$ | 23.5 | $ | 1,349.6 | ||||
_______________________________________
(1) | This amount includes approximately $781.5 million payable ratably over fifteen years pursuant to petroleum transportation service agreements between Coffeyville Resources Refining Marketing, LLC ("CRRM") and each of TransCanada Keystone Pipeline Limited Partnership and TransCanada Keystone Pipeline, LP (together "TransCanada"). The purchase obligation reflects the exchange rate between the Canadian dollar and the U.S. dollar as of December 31, 2015, where applicable. Under the agreements, CRRM receives transportation of at least 25,000 barrels per day of crude oil with a delivery point at Cushing, Oklahoma for a term of twenty years on TransCanada's Keystone pipeline system. CRRM began receiving crude oil under the agreements in the first quarter of 2011. |
CVR leases various equipment, including railcars and real properties, under long-term operating leases expiring at various dates. For the years ended December 31, 2015, 2014 and 2013, lease expense totaled approximately $8.7 million, $9.3 million and $9.4 million, respectively. The lease agreements have various remaining terms. Some agreements are renewable, at CVR's option, for additional periods. It is expected, in the ordinary course of business, that leases will be renewed or replaced as they expire.
Additionally, in the normal course of business, the Company has long-term commitments to purchase oxygen, nitrogen, electricity, storage capacity and pipeline transportation services. For the years ended December 31, 2015, 2014 and 2013, total expense of $135.9 million, $137.8 million and $126.1 million, respectively, was incurred related to long-term commitments.
Crude Oil Supply Agreement
On August 31, 2012, CRRM and Vitol Inc. ("Vitol"), entered into an Amended and Restated Crude Oil Supply Agreement (as amended, the "Vitol Agreement"). Under the Vitol Agreement, Vitol supplies the petroleum business with crude oil and intermediation logistics, which helps to reduce the Refining Partnership's inventory position and mitigate crude oil pricing risk. The Vitol Agreement will automatically renew for successive one-year terms (each such term, a "Renewal Term") unless either party provides the other with notice of nonrenewal at least 180 days prior to expiration of any Renewal Term. The Vitol Agreement currently extends through December 31, 2016.
131
CVR Energy, Inc. and Subsidiaries
NOTES TO CONSOLIDATED FINANCIAL STATEMENTS — (Continued)
Litigation
From time to time, the Company is involved in various lawsuits arising in the normal course of business, including matters such as those described below under, "Environmental, Health, and Safety ("EHS") Matters." Liabilities related to such litigation are recognized when the related costs are probable and can be reasonably estimated. These provisions are reviewed at least quarterly and adjusted to reflect the impacts of negotiations, settlements, rulings, advice of legal counsel, and other information and events pertaining to a particular case. It is possible that management's estimates of the outcomes will change within the next year due to uncertainties inherent in litigation and settlement negotiations. In the opinion of management, the ultimate resolution of any other litigation matters is not expected to have a material adverse effect on the accompanying consolidated financial statements. There can be no assurance that management's beliefs or opinions with respect to liability for potential litigation matters will prove to be accurate.
Proxy Matters
On June 21, 2012, Goldman, Sachs & Co. ("GS") filed suit against CVR in state court in New York, alleging that CVR failed to pay GS fees allegedly due to GS by CVR pursuant to an engagement letter dated March 21, 2012, which according to the allegations set forth in the complaint, provided that GS was engaged by CVR to assist CVR and the CVR board of directors in connection with a tender offer for CVR's stock, made by Carl C. Icahn and certain of his affiliates. On September 8, 2014, the court (in its decision granting GS's motion for summary judgment against CVR) directed the court clerk to enter judgment against CVR in the amount of approximately $22.6 million. CVR filed its notice of appeal on October 3, 2014. On November 24, 2014, CVR paid the judgment to GS, subject to a right of refund if it is successful on appeal. In October 2015, CVR entered into a settlement agreement with GS pursuant to which (i) CVR received settlement proceeds, (ii) the parties executed a mutual release and (iii) CVR’s appeal has been dismissed. The settlement did not have a material effect on the consolidated financial statements.
On August 10, 2012, Deutsche Bank ("DB") filed suit against CVR in state court in New York, alleging that CVR failed to pay DB fees allegedly due to DB by CVR pursuant to an engagement letter dated March 23, 2012, which according to the allegations set forth in the complaint, provided that DB was engaged by CVR to assist CVR and the CVR board of directors in connection with a tender offer for CVR's stock made by Carl C. Icahn and certain of his affiliates. On September 8, 2014, the court (in its decision granting DB's motion for summary judgment against CVR) directed the court clerk to enter judgment against CVR in the amount of approximately $22.7 million. CVR filed its notice of appeal on October 3, 2014. On October 27, 2014, CVR paid the judgment to DB, subject to a right of refund if it is successful on appeal. In October 2015, CVR entered into a settlement agreement with DB pursuant to which (i) CVR received settlement proceeds, (ii) the parties executed a mutual release and (iii) CVR’s appeal has been dismissed. The settlement did not have a material effect on the consolidated financial statements.
Rentech Nitrogen Mergers Litigation
On August 29, 2015, Mike Mustard, a purported unitholder of Rentech Nitrogen, filed a class action complaint on behalf of the public unitholders of Rentech Nitrogen against Rentech Nitrogen, Rentech Nitrogen GP, Rentech Nitrogen Holdings, Inc., Rentech, Inc., CVR Partners, DSHC, LLC, Merger Sub 1 and Merger Sub 2, and the members of the board of directors of Rentech Nitrogen GP (the "Rentech Nitrogen Board"), in the Court of Chancery of the State of Delaware (the "Mustard Lawsuit"). The Mustard Lawsuit alleges, among other things, that the consideration offered by CVR Partners is unfair and inadequate and that, by pursuing a transaction that is the result of an allegedly conflicted and unfair process, certain of the defendants have breached their duties owed to the unitholders of Rentech Nitrogen, and are engaging in self-dealing. Specifically, the lawsuit alleges that the director defendants: (i) failed to take steps to maximize the value of Rentech Nitrogen to its public shareholders, (ii) failed to properly value Rentech Nitrogen, and (iii) ignored or did not protect against the numerous conflicts of interest arising out of the proposed transaction. The Mustard Lawsuit also alleges that Rentech Nitrogen, Rentech Nitrogen GP, Rentech Nitrogen Holdings, Inc., Rentech, Inc., CVR Partners, DSHC, LLC, Merger Sub 1 and Merger Sub 2 aided and abetted the director defendants in their purported breach of fiduciary duties.
On October 6, 2015, Jesse Sloan, a purported unitholder of Rentech Nitrogen, filed a class action complaint on behalf of the public unitholders of Rentech Nitrogen against Rentech Nitrogen, Rentech Nitrogen GP, CVR Partners, Merger Sub 1 and Merger Sub 2, and the members of the Rentech Nitrogen Board, in the United States District Court for the Central District of California (the "Sloan Lawsuit"). The Sloan Lawsuit alleges, among other things, that the attempted sale of Rentech Nitrogen to
132
CVR Energy, Inc. and Subsidiaries
NOTES TO CONSOLIDATED FINANCIAL STATEMENTS — (Continued)
CVR Partners was conducted by means of an unfair process and for an unfair price. Specifically, the lawsuit alleges that (i) Rentech Nitrogen GP and the Rentech Nitrogen Board breached their obligations under the partnership agreement and their implied duty of good faith and fair dealing by causing Rentech Nitrogen to enter into the merger agreement and failing to disclose material information to unitholders of Rentech Nitrogen, (ii) the Rentech Nitrogen Board violated fiduciary duties owed to the unitholders of Rentech Nitrogen based primarily on allegations of inadequate consideration, restrictive deal protection devices and improper disclosure, (iii) each of the defendants aided and abetted in the foregoing breaches described in items (i) and (ii), and (iv) Rentech Nitrogen and the Rentech Nitrogen Board violated Sections 14(a) and 20(a) of the Securities Exchange Act of 1934 and Rule 14a-9 thereunder based on improper disclosure contained in the Registration Statement on Form S-4 (Registration No. 333-206982), which was originally filed with the SEC by CVR Partners on September 17, 2015.
Among other remedies, the plaintiffs in these actions seek to enjoin the mergers and seek unspecified money damages. The lawsuits are at a preliminary state, and the outcome of any such litigation is uncertain. An adverse ruling in these actions may cause the mergers to be delayed or not be completed, which could cause the Nitrogen Fertilizer Partnership not to realize some or all of the anticipated benefits of the mergers. No amounts have been recognized in these consolidated financial statements regarding the lawsuits.
On February 1, 2016, the parties to the Mustard Lawsuit and the Sloan Lawsuit entered into a memorandum of understanding ("MOU") providing for the proposed settlement of the lawsuits. While the defendants believe that no supplemental disclosure is required under applicable laws, in order to avoid the burden and expense of further litigation, they have agreed, pursuant to the terms of the MOU, to make certain supplemental disclosures related to the proposed mergers. The MOU contemplates that the parties will enter into a stipulation of settlement. The stipulation of settlement will be subject to customary conditions, including court approval following notice to Rentech Nitrogen's unitholders. In the event that the parties enter into a stipulation of settlement, a hearing will be scheduled at which the United States District Court for the Central District of California (the "Court") will consider the fairness, reasonableness and adequacy of the proposed settlement. If the proposed settlement is finally approved by the Court, it will resolve and release all claims by unitholders of Rentech Nitrogen challenging any aspect of the proposed mergers, the merger agreement and any disclosure made in connection therewith, including in the prospectus and definitive proxy statement, pursuant to terms that will be disclosed to such unitholders prior to final approval of the proposed settlement. In addition, in connection with the proposed settlement, the parties contemplate that plaintiffs' counsel will file a petition in the Court for an award of attorneys' fees and expenses to be paid by Rentech Nitrogen or its successor. The proposed settlement is also contingent upon, among other things, the mergers becoming effective under Delaware law. There can be no assurance that the Court will approve the proposed settlement contemplated by the MOU. In the event that the proposed settlement is not approved and such conditions are not satisfied, the defendants will continue to vigorously defend against the allegations in the lawsuits.
Property Tax Matter
CRNF received a ten-year property tax abatement from Montgomery County, Kansas (the "County") in connection with the construction of the nitrogen fertilizer plant that expired on December 31, 2007. In connection with the expiration of the abatement, the County reclassified and reassessed CRNF's nitrogen fertilizer plant for property tax purposes. The reclassification and reassessment resulted in an increase in CRNF's annual property tax expense by an average of approximately $10.7 million per year for the years ended December 31, 2008 and December 31, 2009, $11.7 million for the year ended December 31, 2010, $11.4 million for the year ended December 31, 2011 and $11.3 million for the year ended December 31, 2012. CRNF protested the classification and resulting valuation for each of those years to the Kansas Board of Tax Appeals ("BOTA"), followed by an appeal to the Kansas Court of Appeals. However, CRNF fully accrued and paid the property taxes the county claims are owed for the years ended December 31, 2008 through 2012. The Kansas Court of Appeals, in a memorandum opinion dated August 9, 2013, reversed the BOTA decision in part and remanded the case to BOTA, instructing BOTA to classify each asset on an asset by asset basis instead of making a broad determination that the entire plant was real property as BOTA did originally. The County filed a motion for rehearing with the Kansas Court of Appeals and a petition for review with the Kansas Supreme Court, both of which have been denied.
In March 2015, BOTA concluded that based upon an asset by asset determination, a substantial majority of the assets in dispute will be classified as personal property for the 2008 tax year. CRNF and the County next will submit evidence of valuation to BOTA with respect to the real property, following which, BOTA will issue its final decision. No amounts have been received or recognized in these consolidated financial statements related to the 2008 property tax matter or BOTA's decision.
133
CVR Energy, Inc. and Subsidiaries
NOTES TO CONSOLIDATED FINANCIAL STATEMENTS — (Continued)
On February 25, 2013, the County and CRNF agreed to a settlement for tax years 2009 through 2012, which has lowered and will lower CRNF's property taxes by about $10.7 million per year (as compared to the 2012 tax year) for tax years 2013 to 2016 based on current mill levy rates. In addition, the settlement provides the County will support CRNF's application before BOTA for a ten-year tax exemption for the UAN expansion. Finally, the settlement provides that CRNF will continue its appeal of the 2008 reclassification and reassessment discussed above.
SEC Matter
The SEC is conducting an investigation in connection with the Company's disclosures following the announcement of a tender offer for the Company's stock initiated in February 2012. The Company is cooperating with the SEC and has produced, at the SEC's request, documents pertaining to the tender offer and the Company's disclosures.
Flood, Crude Oil Discharge and Insurance
Crude oil was discharged from the Coffeyville refinery on July 1, 2007, due to the short amount of time available to shutdown and secure the refinery in preparation for the flood that occurred on June 30, 2007. On October 25, 2010, the Company received a letter from the United States Coast Guard on behalf of the EPA seeking approximately $1.8 million in oversight cost reimbursement. The Company responded by asserting defenses to the Coast Guard's claim for oversight costs. On September 23, 2011, the United States Department of Justice ("DOJ"), acting on behalf of the EPA and the United States Coast Guard, filed suit against CRRM in the United States District Court for the District of Kansas seeking recovery from CRRM related to alleged non-compliance with the Clean Air Act's Risk Management Program ("RMP"), the Clean Water Act ("CWA") and the OPA. CRRM reached an agreement with the DOJ resolving its claims under CWA and OPA. The agreement was memorialized in a Consent Decree that was filed with and approved by the Court on February 12, 2013 and March 25, 2013, respectively (the "2013 Consent Decree"). On April 19, 2013, CRRM paid a civil penalty (including accrued interest) in the amount of $0.6 million related to the CWA claims and reimbursed the Coast Guard for oversight costs under OPA in the amount of $1.7 million. The 2013 Consent Decree also requires CRRM to make small capital upgrades to the Coffeyville refinery crude oil tank farm, develop flood procedures and provide employee training, the majority of which have already been completed.
The parties also reached an agreement to settle DOJ's claims related to alleged non-compliance with RMP. The agreement was memorialized in a separate consent decree that was filed with and approved by the Court on May 21, 2013 and July 2, 2013, respectively, and provided for a civil penalty of $0.3 million. On July 29, 2013, CRRM paid the civil penalty related to the RMP claims. In 2015, CRRM continued to implement the recommendations of several audits required by the RMP Consent Decree, which were related to compliance with RMP requirements.
CRRM sought insurance coverage for the crude oil release and for the ultimate costs for remediation and third-party property damage claims. On July 10, 2008, the Company filed a lawsuit in the United States District Court for the District of Kansas against certain of the Company's environmental insurance carriers requesting insurance coverage indemnification for the June/July 2007 flood and crude oil discharge losses. Each insurer reserved its rights under various policy exclusions and limitations and cited potential coverage defenses. The Court issued summary judgment opinions that eliminated the majority of the insurance defendants' reservations and defenses. CRRM has received $25.0 million of insurance proceeds under its primary environmental liability insurance policy, which constitutes full payment of the primary pollution liability policy limit. During the second quarter of 2015, CRRM entered into a settlement agreement and release with the insurance carriers involved in the lawsuit, pursuant to which (i) CRRM received settlement proceeds of approximately $31.3 million, (ii) the parties mutually released each other from all claims relating to the flood and crude oil discharge and (iii) all pending appeals have been dismissed. Of the settlement proceeds received, $27.3 million were recorded as a flood insurance recovery in the Consolidated Statements of Operations for the year ended December 31, 2015. The remaining $4.0 million of settlement proceeds reduced CVR Refining's $4.0 million receivable related to this matter, which was included in other assets on the Consolidated Balance Sheets as of December 31, 2014.
Environmental, Health, and Safety ("EHS") Matters
The petroleum and nitrogen fertilizer businesses are subject to various stringent federal, state, and local EHS rules and regulations. Liabilities related to EHS matters are recognized when the related costs are probable and can be reasonably estimated. Estimates of these costs are based upon currently available facts, existing technology, site-specific costs, and currently enacted laws and regulations. In reporting EHS liabilities, no offset is made for potential recoveries.
134
CVR Energy, Inc. and Subsidiaries
NOTES TO CONSOLIDATED FINANCIAL STATEMENTS — (Continued)
CRRM, CRNF, Coffeyville Resources Crude Transportation, LLC ("CRCT"), Wynnewood Refining Company, LLC ("WRC") and Coffeyville Resources Terminal ("CRT") own and/or operate manufacturing and ancillary operations at various locations directly related to petroleum refining and distribution and nitrogen fertilizer manufacturing. Therefore, CRRM, CRNF, CRCT, WRC and CRT have exposure to potential EHS liabilities related to past and present EHS conditions at these locations. Under the Comprehensive Environmental Response, Compensation, and Liability Act ("CERCLA"), the Resource Conservation and Recovery Act ("RCRA"), and related state laws, certain persons may be liable for the release or threatened release of hazardous substances. These persons include the current owner or operator of property where a release or threatened release occurred, any persons who owned or operated the property when the release occurred, and any persons who disposed of, or arranged for the transportation or disposal of, hazardous substances at a contaminated property. Liability under CERCLA is strict, and under certain circumstances, joint and several, so that any responsible party may be held liable for the entire cost of investigating and remediating the release of hazardous substances. Similarly, the OPA generally subjects owners and operators of facilities to strict, joint and several liability for all containment and clean-up costs, natural resource damages, and potential governmental oversight costs arising from oil spills into the waters of the United States, which has been broadly interpreted to include most water bodies including intermittent streams.
CRRM, CRNF, CRCT, WRC and CRT are subject to extensive and frequently changing federal, state and local, environmental and health and safety laws and regulations governing the emission and release of hazardous substances into the environment, the treatment and discharge of waste water, the storage, handling, use and transportation of petroleum and nitrogen products, and the characteristics and composition of gasoline and diesel fuels. The ultimate impact of complying with evolving laws and regulations is not always clearly known or determinable due in part to the fact that the Company's operations may change over time and certain implementing regulations for laws, such as the federal Clean Air Act, have not yet been finalized, are under governmental or judicial review or are being revised. These laws and regulations could result in increased capital, operating and compliance costs.
CRRM and CRT have agreed to perform corrective actions at the Coffeyville, Kansas refinery and the now-closed Phillipsburg, Kansas terminal facility, pursuant to Administrative Orders on Consent issued under RCRA to address historical contamination by the prior owners (RCRA Docket No. VII-94-H-20 and Docket No. VII-95-H-11, respectively). WRC and the Oklahoma Department of Environmental Quality ("ODEQ") have entered into a Consent Order (Case No. 15-056) to resolve certain legacy environmental issues related to historical groundwater contamination and the operation of a wastewater conveyance. As of December 31, 2015 and 2014, environmental accruals of approximately $3.6 million and $1.1 million, respectively, were reflected in the Consolidated Balance Sheets for probable and estimated costs for remediation of environmental contamination under the RCRA Administrative Orders and the ODEQ Consent Order, for which approximately $2.0 million and $0.2 million, respectively, are included in other current liabilities. Accruals were determined based on an estimate of payment costs through 2026, for which the scope of remediation was arranged with the EPA and ODEQ, and were discounted at the appropriate risk free rates at December 31, 2015 and 2014, respectively. The accruals include estimated closure and post-closure costs of approximately $0.4 million and $0.9 million for two landfills at December 31, 2015 and 2014, respectively. The estimated future payments for these required obligations are as follows:
Year Ending December 31, | Amount | ||
(in millions) | |||
2016 | $ | 2.0 | |
2017 | 0.5 | ||
2018 | 0.5 | ||
2019 | 0.1 | ||
2020 | 0.1 | ||
Thereafter | 0.5 | ||
Undiscounted total | 3.7 | ||
Less amounts representing interest at 1.87% | 0.1 | ||
Accrued environmental liabilities at December 31, 2015 | $ | 3.6 | |
Management periodically reviews and, as appropriate, revises its environmental accruals. Based on current information and regulatory requirements, management believes that the accruals established for environmental expenditures are adequate.
135
CVR Energy, Inc. and Subsidiaries
NOTES TO CONSOLIDATED FINANCIAL STATEMENTS — (Continued)
Mobile Source Air Toxic II Emissions
In 2007, the EPA promulgated the Mobile Source Air Toxic II ("MSAT II") rule that requires the reduction of benzene in gasoline by 2011. The MSAT II projects for CRRM and WRC were completed within the compliance deadline of November 1, 2014. The projects were completed at a total cost of approximately $48.3 million and $89.0 million, excluding capitalized interest, by CRRM and WRC, respectively.
Tier 3 Motor Vehicle Emission and Fuel Standards
In April 2014, the EPA promulgated the Tier 3 Motor Vehicle Emission and Fuel Standards, which will require that gasoline contain no more than ten parts per million of sulfur on an annual average basis. Refineries must be in compliance with the more stringent emission standards by January 1, 2017; however, compliance with the rule is extended until January 1, 2020 for approved small volume refineries and small refiners. In March 2015, the EPA approved the Wynnewood refinery's application requesting "small volume refinery" status; therefore, its compliance deadline is January 1, 2020. It is not anticipated that the refineries will require additional controls or capital expenditures to meet the anticipated new standard.
Renewable Fuel Standards
CVR Refining is subject to the Renewable Fuel Standard ("RFS") which requires refiners to either blend "renewable fuels" in with their transportation fuels or purchase renewable fuel credits, known as RINs in lieu of blending. Due to mandates in the RFS requiring increasing volumes of renewable fuels to replace petroleum products in the U.S. transportation fuel market, there may be a decrease in demand for petroleum products. Beginning in 2011, the Coffeyville refinery was required to blend renewable fuels into its transportation fuel or purchase RINs in lieu of blending. In 2013, the Wynnewood refinery was subject to the RFS for the first time. CVR Refining is not able to blend the substantial majority of its transportation fuels and has to purchase RINs on the open market, as well as waiver credits for cellulosic biofuels from the EPA, in order to comply with the RFS.
The cost of RINs has been extremely volatile as the EPA's proposed renewable fuel volume mandates approached the "blend wall." The blend wall refers to the point at which the amount of ethanol blended into the transportation fuel supply exceeds the demand for transportation fuel containing such levels of ethanol. The blend wall is generally considered to be reached when more than 10% ethanol by volume ("E10 gasoline") is blended into transportation fuel.
On December 14, 2015, the EPA published in the Federal Register a final rule establishing the renewable fuel volume mandates for 2014, 2015 and 2016, and the biomass-based diesel mandate for 2017. The volumes included in the EPA's final rule increase each year, but are lower, with the exception of the volumes for biomass-based diesel, than the volumes required by the Clean Air Act. The EPA used its waiver authority to lower the volumes, but its decision to do so has been challenged in the U.S. Court of Appeals for the District of Columbia Circuit.
The cost of RINs for the years ended December 31, 2015, 2014 and 2013 was approximately $123.9 million, $127.2 million and $180.5 million, respectively. As of December 31, 2015 and 2014, CVR Refining's biofuel blending obligation was approximately $9.5 million and $52.3 million, respectively, which is recorded in other current liabilities in the Consolidated Balance Sheets. The price of RINs has been extremely volatile and has increased over the last year. The future cost of RINs for the petroleum business is difficult to estimate. Additionally, the cost of RINs is dependent upon a variety of factors, which include the availability of RINs for purchase, the price at which RINs can be purchased, transportation fuel production levels, the mix of the petroleum business' petroleum products, as well as the fuel blending performed at its refineries and downstream terminals, all of which can vary significantly from period to period.
Coffeyville Second Consent Decree
In March 2004, CRRM and CRT entered into a Consent Decree (the "2004 Consent Decree") with the EPA and the Kansas Department of Health and Environment (the "KDHE") to resolve air compliance concerns raised by the EPA and KDHE related to Farmland Industries Inc.'s prior ownership and operation of the Coffeyville crude oil refinery and the now-closed Phillipsburg terminal facilities. Under the 2004 Consent Decree, CRRM agreed to install controls to reduce emissions of sulfur dioxide ("SO2"), nitrogen oxides and particulate matter from its FCCU by January 1, 2011. In addition, pursuant to the 2004 Consent Decree, CRRM and CRT assumed clean-up obligations at the Coffeyville refinery and the now-closed Phillipsburg terminal facilities.
136
CVR Energy, Inc. and Subsidiaries
NOTES TO CONSOLIDATED FINANCIAL STATEMENTS — (Continued)
In March 2012, CRRM entered into a second consent decree (the "Second Consent Decree") with the EPA and KDHE, which replaced the 2004 Consent Decree (other than certain financial assurance provisions associated with corrective action at the refinery and terminal under RCRA). The Second Consent Decree was entered by the U.S. District Court for the District of Kansas on April 19, 2012. The Second Consent Decree gave CRRM more time to install the FCCU controls from the 2004 Consent Decree and expands the scope of the settlement so that it is now considered a "global settlement" under the EPA's "National Petroleum Refining Initiative." Under the National Petroleum Refining Initiative, the EPA alleged industry-wide non-compliance with four "marquee" issues under the Clean Air Act: New Source Review, Flaring, Leak Detection and Repair, and Benzene Waste Operations NESHAP. The National Petroleum Refining Initiative has resulted in most U.S. refineries (representing more than 90% of the U.S. refining capacity) entering into consent decrees requiring the payment of civil penalties and the installation of air pollution control equipment and enhanced operating procedures. Under the Second Consent Decree, CRRM was required to pay a civil penalty of approximately $0.7 million and complete the installation of FCCU controls required under the 2004 Consent Decree, add controls to certain heaters and boilers and enhance certain work practices relating to wastewater and fugitive emissions. The remaining costs of complying with the Second Consent Decree are expected to be approximately $44.0 million. Additional incremental capital expenditures associated with the Second Consent Decree will not be material and will be limited primarily to the retrofit and replacement of heaters and boilers over a several year timeframe.
CRRM has entered into an agreement with the EPA and KDHE to modify provisions in the Second Consent Decree relating to the installation of controls to reduce air emissions of sulfur dioxide from the refinery's FCCU. Pursuant to the terms of the modification, CRRM will be permitted to use alternative means of control to those currently specified in the Second Consent Decree provided it can meet the limits specified in the modification. In consideration for the EPA and KDHE's agreement to permit CRRM to use alternative controls, CRRM will pay higher stipulated penalties if it fails to meet the SO2 limits and, if it elects to install the original controls, will have to take additional steps to avoid negative impacts to the Verdigris River associated with the original controls. The modification has been signed by CRRM, the EPA and KDHE, and on February 10, 2016, the modification was lodged with the United States District Court for the District of Kansas. The modification is subject to public notice and comment and, ultimately, approval by the court.
Wynnewood Clean Air Act Compliance
WRC entered into a Consent Order with ODEQ in August 2011 (the "Wynnewood Consent Order"). The Wynnewood Consent Order addresses certain historic Clean Air Act compliance issues related to the operations of the prior owner. Under the Wynnewood Consent Order, WRC paid a civil penalty of $950,000, and agreed to install certain controls, enhance certain compliance programs, and undertake additional testing and auditing. A substantial portion of the costs of complying with the Wynnewood Consent Order were expended during the last turnaround. The remaining costs are expected to be $3.0 million. In consideration for entering into the Wynnewood Consent Order, WRC received a release from liability from ODEQ for matters described in the ODEQ order.
RCRA Compliance Matters
In January 2014, the EPA issued an inspection report to the Wynnewood refinery related to a RCRA compliance evaluation inspection conducted in March 2013. In February 2014, ODEQ notified WRC that it concurred with the EPA's inspection findings and would be pursuing enforcement. WRC and ODEQ entered into a Consent Order in June 2015 resolving all alleged non-compliance associated with the RCRA compliance evaluation inspection, as well as issues related to possible soil and groundwater contamination associated with the prior owner's operation of the refinery. The Consent Order requires WRC to take certain corrective actions, including specified groundwater remediation and monitoring measures pursuant to a work plan to be approved by ODEQ. CVR Refining does not anticipate that the costs of complying with the Consent Order will be material.
Environmental expenditures are capitalized when such expenditures are expected to result in future economic benefits. For the years ended December 31, 2015, 2014 and 2013, capital expenditures were approximately $35.7 million, $100.6 million and $111.3 million, respectively, and were incurred to improve the environmental compliance and efficiency of the operations.
CRRM, CRNF, CRCT, WRC and CRT each believe it is in substantial compliance with existing EHS rules and regulations. There can be no assurance that the EHS matters described above or other EHS matters which may develop in the future will not have a material adverse effect on the business, financial condition, or results of operations.
137
CVR Energy, Inc. and Subsidiaries
NOTES TO CONSOLIDATED FINANCIAL STATEMENTS — (Continued)
Wynnewood Refinery Incident
On September 28, 2012, the Wynnewood refinery experienced an explosion in a boiler unit during startup after a short outage as part of the turnaround process. Two employees were fatally injured. Damage at the refinery was limited to the boiler. Additionally, there has been no evidence of environmental impact. The refinery was in the final stages of shutdown for turnaround maintenance at the time of the incident. The petroleum business completed an internal investigation of the incident and cooperated with OSHA in its investigation. OSHA also conducted a general inspection of the facility during the boiler incident investigation. In March 2013, OSHA completed its investigation and communicated its citations to WRC. OSHA also placed WRC in its Severe Violators Enforcement Program ("SVEP"). WRC is vigorously contesting the citations and OSHA's placement of WRC in the SVEP. Any penalties associated with OSHA's citations are not expected to have a material adverse effect on the consolidated financial statements. In addition to the above, the spouses of the two employees fatally injured have filed a civil lawsuit against CVR Refining and CVR Energy in Fort Bend County, Texas. The companies will vigorously defend the suit. It is currently too early to assess a potential outcome in the matter.
Affiliate Pension Obligations
Mr. Icahn, through certain affiliates, owns approximately 82% of the Company’s capital stock. Applicable pension and tax laws make each member of a "controlled group" of entities, generally defined as entities in which there is at least an 80% common ownership interest, jointly and severally liable for certain pension plan obligations of any member of the controlled group. These pension obligations include ongoing contributions to fund the plan, as well as liability for any unfunded liabilities that may exist at the time the plan is terminated. In addition, the failure to pay these pension obligations when due may result in the creation of liens in favor of the pension plan or the Pension Benefit Guaranty Corporation ("PBGC") against the assets of each member of the controlled group.
As a result of the more than 80% ownership interest in CVR Energy by Mr. Icahn's affiliates, the Company is subject to the pension liabilities of all entities in which Mr. Icahn has a direct or indirect ownership interest of at least 80%. Two such entities, ACF Industries LLC ("ACF") and Federal-Mogul, are the sponsors of several pension plans. All the minimum funding requirements of the Code and the Employee Retirement Income Security Act of 1974, as amended by the Pension Protection Act of 2006, for these plans have been met as of December 31, 2015. If the ACF and Federal-Mogul plans were voluntarily terminated, they would be collectively underfunded by approximately $589.2 million and $473.8 million as of December 31, 2015 and 2014, respectively. These results are based on the most recent information provided by Mr. Icahn's affiliates based on information from the plans' actuaries. These liabilities could increase or decrease, depending on a number of factors, including future changes in benefits, investment returns, and the assumptions used to calculate the liability. As members of the controlled group, CVR Energy would be liable for any failure of ACF and Federal-Mogul to make ongoing pension contributions or to pay the unfunded liabilities upon a termination of their respective pension plans. In addition, other entities now or in the future within the controlled group that includes CVR Energy may have pension plan obligations that are, or may become, underfunded, and the Company would be liable for any failure of such entities to make ongoing pension contributions or to pay the unfunded liabilities upon a termination of such plans. The current underfunded status of the ACF and Federal-Mogul pension plans requires such entities to notify the PBGC of certain "reportable events," such as if CVR Energy were to cease to be a member of the controlled group, or if CVR Energy makes certain extraordinary dividends or stock redemptions. The obligation to report could cause the Company to seek to delay or reconsider the occurrence of such reportable events. Based on the contingent nature of potential exposure related to these affiliate pension obligations, no liability has been recorded in the consolidated financial statements.
(14) Fair Value Measurements
ASC Topic 820 — Fair Value Measurements and Disclosures ("ASC 820") established a single authoritative definition of fair value when accounting rules require the use of fair value, set out a framework for measuring fair value and required additional disclosures about fair value measurements. ASC 820 clarifies that fair value is an exit price, representing the amount from the perspective of a market participant that holds the asset or owes the liability at the measurement date.
ASC 820 discusses valuation techniques, such as the market approach (prices and other relevant information generated by market transactions involving identical or comparable assets, liabilities or a group of assets and liabilities such as a business), the income approach (techniques to convert future amounts to a single current amount based on market expectations about those future amounts including present value techniques and option pricing), and the cost approach (amount that would be
138
CVR Energy, Inc. and Subsidiaries
NOTES TO CONSOLIDATED FINANCIAL STATEMENTS — (Continued)
required currently to replace the service capacity of an asset which is often referred to as a replacement cost). ASC 820 utilizes a fair value hierarchy that prioritizes the inputs to valuation techniques used to measure fair value into three broad levels. The following is a brief description of those three levels:
• | Level 1 — Quoted prices in active markets for identical assets and liabilities |
• | Level 2 — Other significant observable inputs (including quoted prices in active markets for similar assets or liabilities) |
• | Level 3 — Significant unobservable inputs (including the Company's own assumptions in determining the fair value) |
The following table sets forth the assets and liabilities measured at fair value on a recurring basis, by input level, as of December 31, 2015 and 2014:
December 31, 2015 | |||||||||||||||
Level 1 | Level 2 | Level 3 | Total | ||||||||||||
(in millions) | |||||||||||||||
Location and Description | |||||||||||||||
Cash equivalents | $ | 15.7 | $ | — | $ | — | $ | 15.7 | |||||||
Other current assets (investments) | 0.1 | — | — | 0.1 | |||||||||||
Other current assets (other derivative agreements) | — | 44.7 | — | 44.7 | |||||||||||
Total Assets | $ | 15.8 | $ | 44.7 | $ | — | $ | 60.5 | |||||||
Other current liabilities (other derivative agreements) | — | (0.1 | ) | — | (0.1 | ) | |||||||||
Other current liabilities (interest rate swaps) | — | (0.1 | ) | — | (0.1 | ) | |||||||||
Other current liabilities (biofuel blending obligations) | — | (2.7 | ) | — | (2.7 | ) | |||||||||
Total Liabilities | $ | — | $ | (2.9 | ) | $ | — | $ | (2.9 | ) | |||||
December 31, 2014 | |||||||||||||||
Level 1 | Level 2 | Level 3 | Total | ||||||||||||
(in millions) | |||||||||||||||
Location and Description | |||||||||||||||
Cash equivalents | $ | 69.0 | $ | — | $ | — | $ | 69.0 | |||||||
Other current assets (investments) | 73.9 | 2.7 | — | 76.6 | |||||||||||
Other current assets (other derivative agreements) | — | 25.0 | — | 25.0 | |||||||||||
Other long-term assets (other derivative agreements) | — | 22.3 | — | 22.3 | |||||||||||
Total Assets | $ | 142.9 | $ | 50.0 | $ | — | $ | 192.9 | |||||||
Other current liabilities (interest rate swaps) | — | (0.8 | ) | — | (0.8 | ) | |||||||||
Other current liabilities (biofuel blending obligations) | — | (49.6 | ) | — | (49.6 | ) | |||||||||
Other long-term liabilities (interest rate swaps) | — | (0.2 | ) | — | (0.2 | ) | |||||||||
Total Liabilities | $ | — | $ | (50.6 | ) | $ | — | $ | (50.6 | ) | |||||
As of December 31, 2015 and 2014, the only financial assets and liabilities that are measured at fair value on a recurring basis are the Company's cash equivalents, investments, derivative instruments and uncommitted biofuel blending obligation. Additionally, the fair value of the Company's debt issuances is disclosed in Note 9 ("Long-Term Debt"). The Refining Partnership's commodity derivative contracts and uncommitted biofuel blending obligation, which use fair value measurements and are valued using broker quoted market prices of similar instruments, are considered Level 2 inputs. The Nitrogen Fertilizer Partnership has interest rate swaps that are measured at fair value on a recurring basis using Level 2 inputs. The fair value of these interest rate swap instruments are based on discounted cash flow models that incorporate the cash flows of the derivatives,
139
CVR Energy, Inc. and Subsidiaries
NOTES TO CONSOLIDATED FINANCIAL STATEMENTS — (Continued)
as well as the current LIBOR rate and a forward LIBOR curve, along with other observable market inputs. The Company had no transfers of assets or liabilities between any of the above levels during the year ended December 31, 2015.
As of December 31, 2014, the aggregate cost basis for the Company's available-for-sale securities was approximately $73.6 million following an other-than-temporary impairment of $4.7 million during the year ended December 31, 2014. During the year ended December 31, 2015, the Company received proceeds of $68.0 million for the sale of a portion of its investment in available-for-sale securities. The aggregate cost basis for the available-for-sale securities sold was approximately $47.9 million. Upon the sale of the available-for-sale securities, the Company reclassified an unrealized gain of $20.1 million from AOCI and recognized a realized gain in other income in the Consolidated Statements of Operations for the year ended December 31, 2015. At the end of the first quarter of 2015, the Company's remaining available-for-sale securities with an aggregate cost basis of approximately $25.7 million were reclassified to trading securities based on management's ability and intent with respect to the securities. In connection with the transfer to trading securities, an unrealized gain previously recorded in AOCI of $11.7 million was reclassified to other income and was reflected in the Consolidated Statements of Operations for the year ended December 31, 2015. During the second quarter of 2015, the trading securities were sold, and the Company received proceeds of $37.8 million and recognized an additional realized gain of $0.4 million in other income for the year ended December 31, 2015. As of December 31, 2015, the Company did not hold any further investments in available-for-sale securities.
During the year ended December 31, 2013, the Company received proceeds of $24.7 million for the sale of its investments in marketable securities, which were previously classified as available-for-sale and reported at fair market value using quoted market prices. The aggregate cost basis for the available-for-sale securities sold was approximately $18.6 million. Upon the sale of the available-for-sale securities, the Company reclassified the unrealized gain of $6.1 million from AOCI and recognized a realized gain in other income for the year ended December 31, 2013.
(15) Derivative Financial Instruments
Gain (loss) on derivatives, net and current period settlements on derivative contracts were as follows:
Year Ended December 31, | |||||||||||
2015 | 2014 | 2013 | |||||||||
(in millions) | |||||||||||
Current period settlement on derivative contracts | $ | (26.0 | ) | $ | 122.2 | $ | 6.4 | ||||
Gain (loss) on derivatives, net | (28.6 | ) | 185.6 | 57.1 | |||||||
The Refining Partnership and Nitrogen Fertilizer Partnership are subject to price fluctuations caused by supply conditions, weather, economic conditions, interest rate fluctuations and other factors. To manage price risk on crude oil and other inventories and to fix margins on certain future production, the Refining Partnership from time to time enters into various commodity derivative transactions.
The Refining Partnership has adopted accounting standards which impose extensive record-keeping requirements in order to designate a derivative financial instrument as a hedge. The Refining Partnership holds derivative instruments, such as exchange-traded crude oil futures and certain over-the-counter forward swap agreements, which it believes provide an economic hedge on future transactions, but such instruments are not designated as hedges for GAAP purposes. Gains or losses related to the change in fair value and periodic settlements of these derivative instruments are classified as gain (loss) on derivatives, net in the Consolidated Statements of Operations. There are no premiums paid or received at inception of the derivative contracts and upon settlement, there is no cost recovery associated with these contracts.
The Refining Partnership maintains a margin account to facilitate other commodity derivative activities. A portion of this account may include funds available for withdrawal. These funds are included in cash and cash equivalents within the Consolidated Balance Sheets. The maintenance margin balance is included within other current assets within the Consolidated Balance Sheets. Dependent upon the position of the open commodity derivatives, the amounts are accounted for as other current assets or other current liabilities within the Consolidated Balance Sheets. From time to time, the Refining Partnership may be required to deposit additional funds into this margin account. There were no open commodity positions as of December 31, 2015 or 2014. For the years ended December 31, 2015, 2014 and 2013, the Company recognized net gains of $3.2 million and $0.3 million and a net loss of $2.9 million, respectively, which are recorded in gain (loss) on derivatives, net in the Consolidated Statements of Operations.
140
CVR Energy, Inc. and Subsidiaries
NOTES TO CONSOLIDATED FINANCIAL STATEMENTS — (Continued)
Commodity Swaps
The Refining Partnership enters into commodity swap contracts in order to fix the margin on a portion of future production. Additionally, the Refining Partnership may enter into price and basis swaps in order to fix the price on a portion of its commodity purchases and product sales. The physical volumes are not exchanged and these contracts are net settled with cash. The contract fair value of the commodity swaps is reflected on the Consolidated Balance Sheets with changes in fair value currently recognized in the Consolidated Statements of Operations. Quoted prices for similar assets or liabilities in active markets (Level 2) are considered to determine the fair values for the purpose of marking to market the hedging instruments at each period end. At December 31, 2015 and 2014, the Refining Partnership had open commodity hedging instruments consisting of 2.5 million and 9.1 million barrels of crack spreads, respectively, primarily to fix the margin on a portion of its future gasoline and distillate production. Additionally, at December 31, 2015, the Refining Partnership had open commodity hedging instruments consisting of 1.4 million barrels primarily to fix the price on a portion of its future crude oil purchases or the basis on a portion of its future product sales. The fair value of the outstanding contracts at December 31, 2015 was a net unrealized gain of $44.6 million, of which $44.7 million is included in current assets and $0.1 million is included in other current liabilities. The fair value of the outstanding contracts at December 31, 2014 was a net unrealized gain of $47.3 million, of which $25.0 million is included in current assets and $22.3 million is included in other long-term assets. For the years ended December 31, 2015, 2014 and 2013, the Refining Partnership recognized a net loss of $36.4 million and net gains of $187.4 million and $60.1 million, respectively, which are recorded in gain (loss) on derivatives, net in the Consolidated Statements of Operations.
Nitrogen Fertilizer Partnership Interest Rate Swaps
CRNF has two floating-to-fixed interest rate swap agreements for the purpose of hedging the interest rate risk associated with a portion of the nitrogen fertilizer business' $125.0 million floating rate term debt which matures in April 2016. The aggregate notional amount covered under these agreements, which commenced on August 12, 2011 and expired on February 12, 2016, totals $62.5 million (split evenly between the two agreements). Under the terms of the interest rate swap agreement entered into on June 30, 2011, CRNF will receive a floating rate based on three-month LIBOR and pay a fixed rate of 1.94%. Under the terms of the interest rate swap agreement entered into on July 1, 2011, CRNF will receive a floating rate based on three-month LIBOR and pay a fixed rate of 1.975%. Both swap agreements will be settled every 90 days. The effect of these swap agreements is to lock in a fixed rate of interest of approximately 1.96% plus the applicable margin paid to lenders over three month LIBOR as governed by the CRNF credit facility. The agreements were designated as cash flow hedges at inception and accordingly, the effective portion of the gain or loss on the swap is reported as a component of AOCI, and will be reclassified into interest expense when the interest rate swap transaction affects earnings. Any ineffective portion of the gain or loss will be recognized immediately in interest expense on the Consolidated Statements of Operations.
The realized loss on the interest rate swap re-classed from AOCI into interest expense and other financing costs on the Consolidated Statements of Operations was $1.1 million for each of the years ended December 31, 2015, 2014 and 2013. For the years ended December 31, 2015, 2014 and 2013, the Nitrogen Fertilizer Partnership recognized a decrease in the fair value of the interest rate swap agreements of $0.1 million, $0.2 million and $0.2 million, respectively, which was unrealized in AOCI.
Counterparty Credit Risk
The Refining Partnership's exchange-traded crude oil futures and certain over-the-counter forward swap agreements are potentially exposed to concentrations of credit risk as a result of economic conditions and periods of uncertainty and illiquidity in the credit and capital markets. The Refining Partnership manages credit risk on its exchange-traded crude oil futures by completing trades with an exchange clearinghouse, which subjects the trades to mandatory margin requirements until the contract settles. The Refining Partnership also monitors the creditworthiness of its commodity swap counterparties and assesses the risk of nonperformance on a quarterly basis. Counterparty credit risk identified as a result of this assessment is recognized as a valuation adjustment to the fair value of the commodity swaps recorded in the Consolidated Balance Sheets. As of December 31, 2015, the counterparty credit risk adjustment was not material to the consolidated financial statements. Additionally, the Refining Partnership does not require any collateral to support commodity swaps into which it enters; however, it does have master netting arrangements that allow for the setoff of amounts receivable from and payable to the same party, which mitigates the risk associated with nonperformance.
141
CVR Energy, Inc. and Subsidiaries
NOTES TO CONSOLIDATED FINANCIAL STATEMENTS — (Continued)
Offsetting Assets and Liabilities
The commodity swaps and other commodity derivatives agreements discussed above include multiple derivative positions with a number of counterparties for which the Refining Partnership has entered into agreements governing the nature of the derivative transactions. Each of the counterparty agreements provides for the right to setoff each individual derivative position to arrive at the net receivable due from the counterparty or payable owed by the Refining Partnership. As a result of the right to setoff, the Refining Partnership's recognized assets and liabilities associated with the outstanding derivative positions have been presented net in the Consolidated Balance Sheets. The interest rate swap agreements held by the Nitrogen Fertilizer Partnership also provide for the right to setoff. However, as the interest rate swaps are in a liability position, there are no amounts offset in the Consolidated Balance Sheets as of December 31, 2015 and 2014. In accordance with guidance issued by the FASB related to "Disclosures about Offsetting Assets and Liabilities," the tables below outline the gross amounts of the recognized assets and liabilities and the gross amounts offset in the Consolidated Balance Sheets for the various types of open derivative positions at the Refining Partnership.
The offsetting assets and liabilities for the Refining Partnership's derivatives as of December 31, 2015 are recorded as current assets and current liabilities in prepaid expenses and other current assets and other current liabilities, respectively, in the Consolidated Balance Sheets as follows:
As of December 31, 2015 | |||||||||||||||||||
Description | Gross Current Assets | Gross Amounts Offset | Net Current Assets Presented | Cash Collateral Not Offset | Net Amount | ||||||||||||||
(in millions) | |||||||||||||||||||
Commodity Swaps | $ | 44.8 | $ | (0.1 | ) | $ | 44.7 | $ | — | $ | 44.7 | ||||||||
Total | $ | 44.8 | $ | (0.1 | ) | $ | 44.7 | $ | — | $ | 44.7 | ||||||||
As of December 31, 2015 | |||||||||||||||||||
Description | Gross Current Liabilities | Gross Amounts Offset | Net Current Liabilities Presented | Cash Collateral Not Offset | Net Amount | ||||||||||||||
(in millions) | |||||||||||||||||||
Commodity Swaps | $ | 0.1 | $ | — | $ | 0.1 | $ | — | $ | 0.1 | |||||||||
Total | $ | 0.1 | $ | — | $ | 0.1 | $ | — | $ | 0.1 | |||||||||
The offsetting assets and liabilities for the Refining Partnership's derivatives as of December 31, 2014 are recorded as current assets and non-current assets in prepaid expenses and other current assets and other long-term assets, respectively, in the Consolidated Balance Sheets as follows:
As of December 31, 2014 | |||||||||||||||||||
Description | Gross Current Assets | Gross Amounts Offset | Net Current Assets Presented | Cash Collateral Not Offset | Net Amount | ||||||||||||||
(in millions) | |||||||||||||||||||
Commodity Swaps | $ | 25.3 | $ | (0.3 | ) | $ | 25.0 | $ | — | $ | 25.0 | ||||||||
Total | $ | 25.3 | $ | (0.3 | ) | $ | 25.0 | $ | — | $ | 25.0 | ||||||||
As of December 31, 2014 | |||||||||||||||||||
Description | Gross Non-Current Assets | Gross Amounts Offset | Net Non-Current Assets Presented | Cash Collateral Not Offset | Net Amount | ||||||||||||||
(in millions) | |||||||||||||||||||
Commodity Swaps | $ | 22.3 | $ | — | $ | 22.3 | $ | — | $ | 22.3 | |||||||||
Total | $ | 22.3 | $ | — | $ | 22.3 | $ | — | $ | 22.3 | |||||||||
142
CVR Energy, Inc. and Subsidiaries
NOTES TO CONSOLIDATED FINANCIAL STATEMENTS — (Continued)
(16) Related Party Transactions
In May 2012, IEP announced that it had acquired control of CVR pursuant to a tender offer to purchase all of the issued and outstanding shares of the Company's common stock. As of December 31, 2015, IEP owned approximately 82% of all common shares outstanding. See Note 1 ("Organization and History of the Company") for additional discussion.
American Railcar Entities
From March 2009 until June 2013, the Company, through the Nitrogen Fertilizer Partnership, leased 199 railcars from American Railcar Leasing LLC ("ARL"), a company controlled by IEP, the Company's majority stockholder. On June 13, 2013, the Nitrogen Fertilizer Partnership purchased the railcars under the lease from ARL for approximately $5.0 million. For the year ended December 31, 2013, rent expense of $0.4 million was recorded related to this agreement and was included in cost of product sold (exclusive of depreciation and amortization) in the Consolidated Statements of Operations.
In 2014, the Nitrogen Fertilizer Partnership purchased 50 new UAN railcars from American Railcar Industries, Inc. ("ARI"), an affiliate of IEP, for approximately $6.7 million and 12 used UAN railcars from ARL for approximately $1.1 million. Also, ARI performed railcar maintenance for the Nitrogen Fertilizer Partnership, and the expenses associated with this maintenance were approximately $50,000 for the year ended December 31, 2014.
International Truck Purchase
During the year ended December 31, 2013, the Refining Partnership purchased seven trucks from a subsidiary of Navistar International Corporation for approximately $0.8 million.
Tax Allocation Agreement
CVR is a member of the consolidated federal tax group of AEPC, a wholly-owned subsidiary of IEP, and has entered into a Tax Allocation Agreement. Refer to Note 8 ("Income Taxes") for a discussion of related party transactions under the Tax Allocation Agreement.
Insight Portfolio Group
Insight Portfolio Group LLC is an entity formed and controlled by Mr. Icahn in order to maximize the potential buying power of a group of entities with which Mr. Icahn has a relationship in negotiating with a wide range of suppliers of goods, services and tangible and intangible property at negotiated rates. CVR Energy was a member of the buying group in 2012. In January 2013, CVR Energy acquired a minority equity interest in Insight Portfolio Group and agreed to pay a portion of Insight Portfolio Group's operating expenses in 2013. The Company paid Insight Portfolio Group approximately $0.1 million, $0.4 million and $0.1 million during the years ended December 31, 2015, 2014 and 2013, respectively. The Company may purchase a variety of goods and services as members of the buying group at prices and terms that management believes would be more favorable than those which would be achieved on a stand-alone basis.
CRLLC Guaranty
On February 9, 2016, CRLLC and the Nitrogen Fertilizer Partnership entered into a guaranty, pursuant to which CRLLC agreed to guaranty the indebtedness outstanding under the Nitrogen Fertilizer Partnership's credit facility. Refer to Note 9 ("Long-Term Debt") for further discussion of the guaranty terms.
143
CVR Energy, Inc. and Subsidiaries
NOTES TO CONSOLIDATED FINANCIAL STATEMENTS — (Continued)
(17) Business Segments
The Company measures segment profit as operating income for petroleum and nitrogen fertilizer, CVR's two reporting segments, based on the definitions provided in ASC Topic 280 — Segment Reporting. All operations of the segments are located within the United States.
Petroleum
Principal products of the petroleum segment are refined fuels, propane, and petroleum refining by-products, including pet coke. The petroleum segment's Coffeyville refinery sells pet coke to the Nitrogen Fertilizer Partnership for use in the manufacture of nitrogen fertilizer at the adjacent nitrogen fertilizer plant. For the petroleum segment, a per-ton transfer price is used to record intercompany sales on the part of the petroleum segment and corresponding intercompany cost of product sold (exclusive of depreciation and amortization) for the nitrogen fertilizer segment. The per ton transfer price paid, pursuant to the pet coke supply agreement that became effective October 24, 2007, is based on the lesser of a pet coke price derived from the price received by the nitrogen fertilizer segment for UAN (subject to a UAN based price ceiling and floor) or a pet coke price index for pet coke. The intercompany transactions are eliminated in the other segment. Intercompany sales included in petroleum net sales were approximately $6.8 million, $8.7 million and $9.6 million for the years ended December 31, 2015, 2014 and 2013, respectively.
The petroleum segment recorded intercompany cost of product sold (exclusive of depreciation and amortization) for the hydrogen purchases described below under "Nitrogen Fertilizer" of approximately $11.8 million, $10.1 million and $11.4 million for the years ended December 31, 2015, 2014 and 2013, respectively. The petroleum segment recorded intercompany revenue for hydrogen sales of approximately $0.6 million for the year ended December 31, 2013.
Nitrogen Fertilizer
The principal product of the nitrogen fertilizer segment is nitrogen fertilizer. Intercompany cost of product sold (exclusive of depreciation and amortization) for the pet coke transfer described above was approximately $6.6 million, $9.2 million and $9.8 million for the years ended December 31, 2015, 2014 and 2013, respectively.
Pursuant to the feedstock agreement, the Company's segments have the right to transfer hydrogen between the Coffeyville refinery and nitrogen fertilizer plant. Sales of hydrogen to the petroleum segment have been reflected as net sales for the nitrogen fertilizer segment. Receipts of hydrogen from the petroleum segment have been reflected in cost of product sold (exclusive of depreciation and amortization) for the nitrogen fertilizer segment. For the years ended December 31, 2015, 2014 and 2013, the net sales generated from intercompany hydrogen sales were $11.8 million, $10.1 million and $11.4 million, respectively. For the years ended December 31, 2013, the nitrogen fertilizer segment also recognized approximately $0.6 million of cost of product sold related to the transfer of excess hydrogen. As these intercompany sales and cost of product sold are eliminated, there is no financial statement impact on the consolidated financial statements.
Other Segment
The other segment reflects intercompany eliminations, corporate cash and cash equivalents, income tax activities and other corporate activities that are not allocated to the operating segments.
144
CVR Energy, Inc. and Subsidiaries
NOTES TO CONSOLIDATED FINANCIAL STATEMENTS — (Continued)
The following table summarizes certain operating results and capital expenditures information by segment:
Year Ended December 31, | |||||||||||
2015 | 2014 | 2013 | |||||||||
(in millions) | |||||||||||
Net sales | |||||||||||
Petroleum | $ | 5,161.9 | $ | 8,829.7 | $ | 8,683.5 | |||||
Nitrogen Fertilizer | 289.2 | 298.7 | 323.7 | ||||||||
Intersegment elimination | (18.6 | ) | (18.9 | ) | (21.4 | ) | |||||
Total | $ | 5,432.5 | $ | 9,109.5 | $ | 8,985.8 | |||||
Cost of product sold (exclusive of depreciation and amortization) | |||||||||||
Petroleum | $ | 4,143.6 | $ | 8,013.4 | $ | 7,526.7 | |||||
Nitrogen Fertilizer | 65.2 | 72.0 | 58.1 | ||||||||
Intersegment elimination | (18.4 | ) | (19.4 | ) | (21.6 | ) | |||||
Total | $ | 4,190.4 | $ | 8,066.0 | $ | 7,563.2 | |||||
Direct operating expenses (exclusive of depreciation and amortization) | |||||||||||
Petroleum | $ | 478.5 | $ | 416.0 | $ | 361.7 | |||||
Nitrogen Fertilizer | 106.1 | 98.9 | 94.1 | ||||||||
Other | 0.1 | 0.2 | — | ||||||||
Total | $ | 584.7 | $ | 515.1 | $ | 455.8 | |||||
Depreciation and amortization | |||||||||||
Petroleum | $ | 130.2 | $ | 122.5 | $ | 114.3 | |||||
Nitrogen Fertilizer | 28.4 | 27.3 | 25.6 | ||||||||
Other | 5.5 | 4.6 | 2.9 | ||||||||
Total | $ | 164.1 | $ | 154.4 | $ | 142.8 | |||||
Operating income | |||||||||||
Petroleum | $ | 361.7 | $ | 207.2 | $ | 603.0 | |||||
Nitrogen Fertilizer | 68.7 | 82.8 | 124.9 | ||||||||
Other | (8.8 | ) | (25.7 | ) | (17.4 | ) | |||||
Total | $ | 421.6 | $ | 264.3 | $ | 710.5 | |||||
Capital expenditures | |||||||||||
Petroleum | $ | 194.7 | $ | 191.3 | $ | 204.5 | |||||
Nitrogen fertilizer | 17.0 | 21.1 | 43.8 | ||||||||
Other | 7.0 | 6.0 | 8.2 | ||||||||
Total | $ | 218.7 | $ | 218.4 | $ | 256.5 | |||||
145
CVR Energy, Inc. and Subsidiaries
NOTES TO CONSOLIDATED FINANCIAL STATEMENTS — (Continued)
Year Ended December 31, | |||||||||||
2015 | 2014 | 2013 | |||||||||
(in millions) | |||||||||||
Total assets | |||||||||||
Petroleum | $ | 2,195.2 | $ | 2,417.8 | $ | 2,533.3 | |||||
Nitrogen Fertilizer | 536.5 | 578.8 | 593.5 | ||||||||
Other | 574.1 | 465.9 | 539.0 | ||||||||
Total | $ | 3,305.8 | $ | 3,462.5 | $ | 3,665.8 | |||||
Goodwill | |||||||||||
Petroleum | $ | — | $ | — | $ | — | |||||
Nitrogen Fertilizer | 41.0 | 41.0 | 41.0 | ||||||||
Other | — | — | — | ||||||||
Total | $ | 41.0 | $ | 41.0 | $ | 41.0 | |||||
(18) Major Customers and Suppliers
Sales to major customers as a percentage of the respective segment's sales were as follows:
Year Ended December 31, | ||||||||
2015 | 2014 | 2013 | ||||||
Petroleum | ||||||||
Customer A | 14 | % | 13 | % | 12 | % | ||
Nitrogen Fertilizer | ||||||||
Customer B | 10 | % | 17 | % | 15 | % | ||
Customer C | 14 | % | 10 | % | 13 | % | ||
24 | % | 27 | % | 28 | % | |||
The petroleum segment obtained crude oil from one third-party supplier under a long-term supply agreement during 2015, 2014 and 2013. The crude oil purchased from this supplier is governed by a long-term contract. Volume contracted as a percentage of the total crude oil purchases (in barrels) for each of the periods was as follows:
Year Ended December 31, | ||||||||
2015 | 2014 | 2013 | ||||||
Petroleum | ||||||||
Supplier A | 61 | % | 67 | % | 69 | % | ||
146
CVR Energy, Inc. and Subsidiaries
NOTES TO CONSOLIDATED FINANCIAL STATEMENTS — (Continued)
(19) Selected Quarterly Financial Information (unaudited)
Summarized quarterly financial data for December 31, 2015 and 2014.
Year Ended December 31, 2015 | |||||||||||||||
Quarter | |||||||||||||||
First | Second | Third | Fourth | ||||||||||||
(in millions, except per share data) | |||||||||||||||
Net sales | $ | 1,388.9 | $ | 1,624.2 | $ | 1,408.8 | $ | 1,010.6 | |||||||
Operating costs and expenses: | |||||||||||||||
Cost of product sold (exclusive of depreciation and amortization) | 1,073.6 | 1,192.2 | 1,076.7 | 847.9 | |||||||||||
Direct operating expenses (exclusive of depreciation and amortization) | 111.4 | 115.4 | 145.8 | 212.1 | |||||||||||
Flood insurance recovery | — | (27.3 | ) | — | — | ||||||||||
Selling, general and administrative (exclusive of depreciation and amortization) | 25.3 | 27.2 | 26.1 | 20.4 | |||||||||||
Depreciation and amortization | 42.0 | 42.5 | 38.7 | 40.9 | |||||||||||
Total operating costs and expenses | 1,252.3 | 1,350.0 | 1,287.3 | 1,121.3 | |||||||||||
Operating income (loss) | 136.6 | 274.2 | 121.5 | (110.7 | ) | ||||||||||
Other income (expense): | |||||||||||||||
Interest expense and other financing costs | (12.7 | ) | (11.9 | ) | (11.9 | ) | (11.9 | ) | |||||||
Interest income | 0.2 | 0.3 | 0.3 | 0.2 | |||||||||||
Gain (loss) on derivatives, net | (51.4 | ) | (12.6 | ) | 11.8 | 23.6 | |||||||||
Other income, net | 36.0 | 0.2 | 0.3 | 0.2 | |||||||||||
Total other income (expense) | (27.9 | ) | (24.0 | ) | 0.5 | 12.1 | |||||||||
Income (loss) before income taxes | 108.7 | 250.2 | 122.0 | (98.6 | ) | ||||||||||
Income tax expense (benefit) | 24.0 | 58.1 | 23.1 | (20.7 | ) | ||||||||||
Net income (loss) | 84.7 | 192.1 | 98.9 | (77.9 | ) | ||||||||||
Less: Net income (loss) attributable to noncontrolling interest | 29.8 | 90.2 | 41.0 | (32.9 | ) | ||||||||||
Net income (loss) attributable to CVR Energy stockholders | $ | 54.9 | $ | 101.9 | $ | 57.9 | $ | (45.0 | ) | ||||||
Basic earnings (loss) per share | $ | 0.63 | $ | 1.17 | $ | 0.67 | $ | (0.52 | ) | ||||||
Diluted earnings (loss) per share | $ | 0.63 | $ | 1.17 | $ | 0.67 | $ | (0.52 | ) | ||||||
Dividends declared per share | $ | 0.50 | $ | 0.50 | $ | 0.50 | $ | 0.50 | |||||||
Weighted-average common shares outstanding | |||||||||||||||
Basic | 86.8 | 86.8 | 86.8 | 86.8 | |||||||||||
Diluted | 86.8 | 86.8 | 86.8 | 86.8 | |||||||||||
147
CVR Energy, Inc. and Subsidiaries
NOTES TO CONSOLIDATED FINANCIAL STATEMENTS — (Continued)
Year Ended December 31, 2014 | |||||||||||||||
Quarter | |||||||||||||||
First | Second | Third | Fourth | ||||||||||||
(in millions, except per share data) | |||||||||||||||
Net sales | $ | 2,447.4 | $ | 2,540.3 | $ | 2,279.9 | $ | 1,841.8 | |||||||
Operating costs and expenses: | |||||||||||||||
Cost of product sold (exclusive of depreciation and amortization) | 2,076.9 | 2,189.0 | 2,066.7 | 1,733.4 | |||||||||||
Direct operating expenses (exclusive of depreciation and amortization) | 123.4 | 120.1 | 136.8 | 134.7 | |||||||||||
Selling, general and administrative (exclusive of depreciation and amortization) | 26.3 | 28.0 | 31.8 | 23.5 | |||||||||||
Depreciation and amortization | 37.3 | 38.6 | 37.8 | 40.8 | |||||||||||
Total operating costs and expenses | 2,263.9 | 2,375.7 | 2,273.1 | 1,932.4 | |||||||||||
Operating income (loss) | 183.5 | 164.6 | 6.8 | (90.6 | ) | ||||||||||
Other income (expense): | |||||||||||||||
Interest expense and other financing costs | (10.1 | ) | (9.3 | ) | (9.4 | ) | (11.2 | ) | |||||||
Interest income | 0.2 | 0.2 | 0.3 | 0.2 | |||||||||||
Gain on derivatives, net | 109.4 | 35.9 | 25.7 | 14.5 | |||||||||||
Other income (expense), net | 0.1 | (2.2 | ) | 2.1 | (3.6 | ) | |||||||||
Total other income (expense) | 99.6 | 24.6 | 18.7 | (0.1 | ) | ||||||||||
Income (loss) before income taxes | 283.1 | 189.2 | 25.5 | (90.7 | ) | ||||||||||
Income tax expense (benefit) | 69.4 | 45.2 | 4.2 | (21.0 | ) | ||||||||||
Net income (loss) | 213.7 | 144.0 | 21.3 | (69.7 | ) | ||||||||||
Less: Net income (loss) attributable to noncontrolling interest | 87.0 | 60.3 | 13.4 | (25.3 | ) | ||||||||||
Net income (loss) attributable to CVR Energy stockholders | $ | 126.7 | $ | 83.7 | $ | 7.9 | $ | (44.4 | ) | ||||||
Basic earnings (loss) per share | $ | 1.46 | $ | 0.96 | $ | 0.09 | $ | (0.51 | ) | ||||||
Diluted earnings (loss) per share | $ | 1.46 | $ | 0.96 | $ | 0.09 | $ | (0.51 | ) | ||||||
Dividends declared per share | $ | 0.75 | $ | 0.75 | $ | 2.75 | $ | 0.75 | |||||||
Weighted-average common shares outstanding | |||||||||||||||
Basic | 86.8 | 86.8 | 86.8 | 86.8 | |||||||||||
Diluted | 86.8 | 86.8 | 86.8 | 86.8 | |||||||||||
Factors Impacting the Comparability of Quarterly Results of Operations
As discussed in Note 2 ("Summary of Significant Accounting Policies"), the Coffeyville refinery completed the first phase of its current major scheduled turnaround in mid-November 2015 at a total cost of approximately $101.5 million. Additionally, the Coffeyville refinery incurred approximately $0.7 million in turnaround costs related to the second phase scheduled to begin in late February 2016. In total, the Coffeyville refinery incurred $102.2 million of major scheduled turnaround expenses for the year ended December 31, 2015, of which approximately $1.7 million, $15.6 million and $84.9 million were included in the second, third and fourth quarters of 2015, respectively. These costs are included in direct operating expenses (exclusive of depreciation and amortization) in the Consolidated Statements of Operations.
148
CVR Energy, Inc. and Subsidiaries
NOTES TO CONSOLIDATED FINANCIAL STATEMENTS — (Continued)
As discussed in Note 13 ("Commitments and Contingencies"), CRRM received an insurance recovery from its environmental insurance carriers in the second quarter of 2015 as a result of the flood and crude oil discharge at the Coffeyville refinery on June/July 2007.
As discussed in Note 7 ("Insurance Claims"), the fire at the Coffeyville refinery's isomerization unit adversely impacted production of refined products for the petroleum business in the third quarter of 2014. Total gross repair and other costs recorded related to the incident for the year ended December 31, 2014 were approximately $6.3 million and are included in direct operating expenses (exclusive of depreciation and amortization) in the Consolidated Statements of Operations.
During the fourth quarter of 2014, the FCCU at the Wynnewood refinery was offline for approximately 16 days for necessary repairs. As a result of the FCCU outage, crude throughput and production at the Wynnewood refinery was significantly reduced during the fourth quarter of 2014. Additionally, the Refining Partnership incurred approximately $8.5 million in costs to repair the FCCU for the year ended December 31, 2014. These costs are included in direct operating expenses (exclusive of depreciation and amortization) in the Consolidated Statements of Operations.
As discussed in Note 4 ("Inventories"), the Refining Partnership recorded a lower of FIFO cost or market inventory adjustment of approximately $36.8 million during the fourth quarter of 2014, which is included in cost of product sold (exclusive of depreciation and amortization) in the Consolidated Statements of Operations.
(20) Subsequent Events
Dividend
On February 17, 2016, the board of directors of the Company declared a cash dividend for the fourth quarter of 2015 to the Company's stockholders of $0.50 per share, or $43.4 million in aggregate. The dividend will be paid on March 7, 2016 to stockholders of record at the close of business on February 29, 2016. IEP will receive $35.6 million in respect of its 82% ownership interest in the Company's shares.
Nitrogen Fertilizer Partnership Distribution
On February 17, 2016, the board of directors of the Nitrogen Fertilizer Partnership's general partner declared a cash distribution for the fourth quarter of 2015 to the Nitrogen Fertilizer Partnership's unitholders of $0.27 per unit, or $19.7 million in aggregate. The cash distribution will be paid on March 7, 2016 to unitholders of record at the close of business on February 29, 2016. The Company will receive $10.5 million in respect of its Nitrogen Fertilizer Partnership common units.
149
Item 9. Changes in and Disagreements with Accountants on Accounting and Financial Disclosure
None.
Item 9A. Controls and Procedures
Evaluation of Disclosure Controls and Procedures. As of December 31, 2015, we have evaluated, under the direction of our Chief Executive Officer and Chief Financial Officer, the effectiveness of our disclosure controls and procedures, as defined in Exchange Act Rule 13a-15(e). There are inherent limitations to the effectiveness of any system of disclosure controls and procedures, including the possibility of human error and the circumvention or overriding of the controls and procedures. Accordingly, even effective disclosure controls and procedures can only provide reasonable assurance of achieving their control objectives. Based upon and as of the date of that evaluation, our Chief Executive Officer and Chief Financial Officer concluded that our disclosure controls and procedures were effective to provide reasonable assurance that information required to be disclosed in the reports that we file or submit under the Exchange Act is recorded, processed, summarized and reported within the time periods specified in the SEC's rules and forms, and that such information is accumulated and communicated to our management, including our Chief Executive Officer and Chief Financial Officer, as appropriate, to allow timely decisions regarding required disclosure.
Management's Report On Internal Control Over Financial Reporting. Our management is responsible for establishing and maintaining adequate internal control over financial reporting, as such term is defined in Exchange Act Rule 13a-15(f). Because of its inherent limitations, internal control over financial reporting may not prevent or detect misstatements. Projections of any evaluation of effectiveness to future periods are subject to the risk that controls may become inadequate because of changes in conditions, or that the degree of compliance with the policies or procedures may deteriorate. Under the supervision and with the participation of management, the Company conducted an evaluation of the effectiveness of its internal control over financial reporting based on the framework in the 2013 Internal Control — Integrated Framework issued by the Committee of Sponsoring Organizations of the Treadway Commission ("COSO"). Based on that evaluation, our Chief Executive Officer and Chief Financial Officer have concluded that the Company's internal control over financial reporting was effective as of December 31, 2015. Our independent registered public accounting firm, that audited the consolidated financial statements included herein under Item 8, has issued a report on the effectiveness of our internal control over financial reporting. This report can be found under Item 8.
Changes in Internal Control Over Financial Reporting. There has been no change in our internal control over financial reporting required by Rule 13a-15 of the Exchange Act that occurred during the fiscal quarter ended December 31, 2015 that has materially affected or is reasonably likely to materially affect, our internal control over financial reporting.
Item 9B. Other Information
None.
150
PART III
Item 10. Directors, Executive Officers and Corporate Governance
Information required by this Item regarding our directors, executive officers and corporate governance will be included under the captions "Corporate Governance," "Proposal 1 — Election of Directors," "Members and Nominees of the Board," "Executive Officers," "Information Concerning Executive Officers Who are Not Directors," "Section 16(a) Beneficial Ownership Reporting Compliance," and "Stockholder Proposals" contained in our proxy statement for the annual meeting of our stockholders, which will be filed with the SEC, and this information is incorporated herein by reference.
Item 11. Executive Compensation
Information about executive and director compensation will be included under the captions "Corporate Governance — Compensation Committee Interlocks and Insider Participation," "Proposal 1 — Election of Directors," "Director Compensation for 2015," "Compensation Discussion and Analysis," "Compensation Committee Report" and "Compensation of Executive Officers" contained in our proxy statement for the annual meeting of our stockholders, which will be filed with the SEC and this information is incorporated herein by reference.
Item 12. Security Ownership of Certain Beneficial Owners and Management and Related Stockholder Matters
Information about security ownership of certain beneficial owners and management will be included under the captions "Compensation of Executive Officers," "Securities Ownership of Certain Beneficial Owners and Officers and Directors" and "Equity Compensation Plans" contained in our proxy statement for the annual meeting of our stockholders, which will be filed with the SEC, and this information is incorporated herein by reference.
Item 13. Certain Relationships and Related Transactions, and Director Independence
Information about related party transactions between CVR Energy and its directors, executive officers and 5% stockholders that occurred during the year ended December 31, 2015 will be included under the captions "Certain Relationships and Related Party Transactions" and "Corporate Governance — Director Independence" contained in our proxy statement for the annual meeting of our stockholders, which will be filed with the SEC, and this information is incorporated herein by reference.
Item 14. Principal Accounting Fees and Services
Information about principal accounting fees and services will be included under the captions "Proposal 2 — Ratification of Selection of Independent Registered Public Accounting Firm" and "Fees Paid to the Independent Registered Public Accounting Firm" contained in our proxy statement for the annual meeting of our stockholders, which will be filed with the SEC and this information is incorporated herein by reference.
151
PART IV
Item 15. Exhibits, Financial Statement Schedules
(a)(1) Financial Statements
See "Index to Consolidated Financial Statements" Contained in Part II, Item 8 of this Report.
(a)(2) Financial Statement Schedules
All schedules for which provision is made in the applicable accounting regulations of the Securities and Exchange Commission (the "SEC") are not required under the related instructions or are inapplicable and therefore have been omitted.
(a)(3) Exhibits
Exhibit Number | Exhibit Title |
2.1**# | Agreement and Plan of Merger, dated as of August 9, 2015, by and among CVR Partners, LP, Lux Merger Sub 1, LLC, Lux Merger Sub 2, LLC, Rentech Nitrogen Partners, L.P., and Rentech Nitrogen GP, LLC (incorporated by reference to Exhibit 2.1 to the Form 8-K filed by CVR Partners, LP on August 13, 2015 (Commission File No. 001-35120)). |
2.2** | Transaction Agreement among CVR Energy, Inc., IEP Energy LLC and each of the other Offeror Parties (as defined therein) dated as of April 18, 2012 (incorporated by reference to Exhibit 2.1 to the Company's Form 8-K filed on April 23, 2012). |
3.1** | Amended and Restated Certificate of Incorporation of CVR Energy, Inc. (incorporated by reference to Exhibit 10.1 to the Company's Form 10-Q for the quarter ended September 30, 2007, filed on December 6, 2007). |
3.1.1** | Certificate of Designations, Rights and Preferences setting forth the terms of the Series A Preferred Stock of CVR Energy, Inc. (incorporated by reference to Exhibit 3.1 to the Company's Form 8-K filed on January 17, 2012). |
3.2** | Amended and Restated Bylaws of CVR Energy, Inc. (incorporated by reference to Exhibit 3.1 to the Company's Form 8-K filed on July 20, 2011). |
4.1** | Specimen Common Stock Certificate (incorporated by reference to Exhibit 4.1 to the Company's Registration Statement on Form S-1/A, File No. 333-137588, filed on June 5, 2007). |
4.2** | Indenture, dated as of October 23, 2012, among CVR Refining, LLC, Coffeyville Finance Inc., the Guarantors (as defined therein) and Wells Fargo Bank, National Association, as Trustee and Collateral Trustee (incorporated by reference to Exhibit 4.1 to the Company's Form 8-K filed on October 29, 2012). |
4.3** | Forms of 6.500% Second Lien Senior Secured Notes due 2022 (included within the Indenture filed as Exhibit 4.2). |
10.1** | Amended and Restated ABL Credit Agreement, dated as of December 20, 2012, among Coffeyville Resources, LLC, CVR Refining, LP, CVR Refining, LLC, Coffeyville Resources Refining & Marketing, LLC, Coffeyville Resources Pipeline, LLC, Coffeyville Resources Crude Transportation, LLC, Coffeyville Resources Terminal, LLC, Wynnewood Energy Company, LLC, Wynnewood Refining Company, LLC and certain of their affiliates, the lenders from time to time party thereto, Wells Fargo Bank, National Association, as collateral agent and administrative agent (incorporated by reference to Exhibit 1.1 to the Company's Form 8-K filed on December 27, 2012). |
10.2** | Amended and Restated ABL Pledge and Security Agreement, dated as of December 20, 2012, among CVR Refining, LP, CVR Refining, LLC, Coffeyville Resources Refining & Marketing, LLC, Coffeyville Resources Pipeline, LLC, Coffeyville Resources Crude Transportation, LLC, Coffeyville Resources Terminal, LLC, Wynnewood Energy Company, LLC, Wynnewood Refining Company, LLC and certain of their affiliates, and Wells Fargo Bank, National Association, as collateral agent (incorporated by reference to Exhibit 1.2 to the Company's Form 8-K filed on December 27, 2012). |
10.3** | Amended and Restated First Lien Pledge and Security Agreement, dated as of December 28, 2006, among Coffeyville Resources, LLC, CL JV Holdings, LLC, Coffeyville Pipeline, Inc., Coffeyville Refining and Marketing, Inc., Coffeyville Nitrogen Fertilizers, Inc., Coffeyville Crude Transportation, Inc., Coffeyville Terminal, Inc., Coffeyville Resources Pipeline, LLC, Coffeyville Resources Refining & Marketing, LLC, Coffeyville Resources Crude Transportation, LLC and Coffeyville Resources Terminal, LLC, as grantors, and Credit Suisse, as collateral agent (incorporated by reference to Exhibit 10.2 to the Company's Registration Statement on Form S-1/A, File No. 333-137588, filed on February 12, 2007). |
152
Exhibit Number | Exhibit Title |
10.4** | ABL Intercreditor Agreement, dated as of February 22, 2011, among Coffeyville Resources, LLC, Coffeyville Finance Inc., Deutsche Bank Trust Company Americas, as collateral agent for the ABL secured parties, Wells Fargo Bank, National Association, as collateral trustee for the secured parties in respect of the outstanding first lien obligations, and the outstanding second lien notes and certain subordinated liens, respectively, and the Guarantors (as defined therein) (incorporated by reference to Exhibit 1.3 to the Company's Form 8-K filed on February 28, 2011). |
10.5** | First Amended and Restated Collateral Trust and Intercreditor Agreement, dated as of April 6, 2010, among Coffeyville Resources, LLC, Coffeyville Finance Inc., the other grantors from time to time party thereto, Credit Suisse AG, Cayman Islands Branch, as administrative agent, Wells Fargo Bank, National Association, as indenture agent, J. Aron & Company, as hedging counterparty, each additional first lien representative and Wells Fargo Bank, National Association, as collateral trustee (incorporated by reference to Exhibit 10.33 to the Company's Form 10-K for the year ended December 31, 2011, filed on February 29, 2012). |
10.6** | Omnibus Amendment Agreement and Consent under the Intercreditor Agreement, dated as of April 6, 2010, by and among Coffeyville Resources, LLC, Coffeyville Finance Inc., Coffeyville Pipeline, Inc., Coffeyville Refining & Marketing, Inc., Coffeyville Nitrogen Fertilizers, Inc., Coffeyville Crude Transportation, Inc., Coffeyville Terminal, Inc., CL JV Holdings, LLC, and certain subsidiaries of the foregoing as Guarantors, the Requisite Lenders, Credit Suisse AG, Cayman Islands Branch, as Administrative Agent, Collateral Agent and Revolving Issuing Bank, J. Aron & Company, as a hedge counterparty and Wells Fargo Bank, National Association, as Collateral Trustee (incorporated by reference to Exhibit 1.4 to the Company's Form 8-K filed on April 12, 2010). |
10.7** | Credit and Guaranty Agreement, dated as of April 13, 2011, among Coffeyville Resources Nitrogen Fertilizers, LLC, CVR Partners, LP, the lenders party thereto and Goldman Sachs Lending Partners LLC, as administrative agent and collateral agent (incorporated by reference to Exhibit 10.8 to the Company's Form 8-K filed on May 23, 2011). |
10.8†** | License Agreement For Use of the Texaco Gasification Process, Texaco Hydrogen Generation Process, and Texaco Gasification Power Systems, dated as of May 30, 1997 by and between GE Energy (USA), LLC (as successor in interest to Texaco Development Corporation) and Coffeyville Resources Nitrogen Fertilizers, LLC (as successor in interest to Farmland Industries, Inc.), as amended (incorporated by reference to Exhibit 10.4 to the Company's Registration Statement on Form S-1/A, File No. 333-137588, filed on April 18, 2007). |
10.9†** | Amended and Restated On-Site Product Supply Agreement dated as of June 1, 2005, by and between The BOC Group, Inc. (n/k/a Linde LLC) and Coffeyville Resources Nitrogen Fertilizers, LLC (incorporated by reference to Exhibit 10.6 to the Company's Registration Statement on Form S-1/A, File No. 333-137588, filed on April 18, 2007). |
10.9.1** | First Amendment to Amended and Restated On-Site Product Supply Agreement, dated as of October 31, 2008, by and between Coffeyville Resources Nitrogen Fertilizers, LLC and Linde, Inc. (n/k/a Linde LLC) (incorporated by reference to Exhibit 10.3 to the Company's Form 10-Q for the quarter ended September 30, 2008, filed on November 13, 2008). |
10.10†** | Amended and Restated Crude Oil Supply Agreement, dated August 31, 2012, by and between Vitol Inc. and Coffeyville Resources Refining & Marketing, LLC (incorporated by reference to Exhibit 10.2 to the Company's Form 10-Q for the quarter ended September 30, 2012, filed on November 6, 2012). |
10.10.1** | First Amendment to Amended and Restated Crude Oil Supply Agreement, dated as of June 8, 2015, by and between Vitol Inc. and Coffeyville Resources Refining & Marketing, LLC (incorporated by reference to Exhibit 10.1 to the Company's Form 10-Q for the quarter ended June 30, 2015, filed on July 30, 2015). |
10.11†** | Pipeline Construction, Operation and Transportation Commitment Agreement, dated February 11, 2004, as amended, by and between Plains Pipeline, L.P. and Coffeyville Resources Refining & Marketing, LLC (incorporated by reference to Exhibit 10.14 to the Company's Registration Statement on Form S-1/A, File No. 333-137588, filed on April 18, 2007). |
10.12** | Amended and Restated Electric Services Agreement dated as of August 1, 2010, by and between Coffeyville Resources Nitrogen Fertilizers, LLC and the City of Coffeyville, Kansas (incorporated by reference to Exhibit 10.1 to the Company's Form 8-K filed on August 25, 2010). |
10.13**++ | Fifth Amended and Restated Employment Agreement, dated as of December 31, 2015, by and between CVR Energy, Inc. and John J. Lipinski (incorporated by reference to Exhibit 10.18 to CVR Partners, LP's Form 10-K filed on February 18, 2016 (Commission File No. 001-35120)). |
10.14**++ | Third Amended and Restated Employment Agreement, dated as of January 1, 2011, by and between CVR Energy, Inc. and Robert W. Haugen (incorporated by reference to Exhibit 10.5 to the Company's Form 10-Q for the quarter ended March 31, 2011, filed on May 10, 2011). |
153
Exhibit Number | Exhibit Title |
10.14.1**++ | Amendment Number 1 to Third Amended and Restated Employment Agreement, dated as of December 31, 2013, by and between CVR Energy, Inc. and Robert W. Haugen (incorporated by reference to Exhibit 10.17.1 to the Company's Form 10-K filed on February 26, 2014). |
10.14.2**++ | Amendment Number 2 to Third Amended and Restated Employment Agreement, dated as of December 18, 2013, by and between CVR Energy, Inc. and Robert W. Haugen (incorporated by reference to Exhibit 10.18.2 to the Company's Form 10-K filed on February 20, 2015). |
10.15**++ | Employment Agreement, dated as of December 1, 2014, by and between CVR Energy, Inc. and Martin J. Power (incorporated by reference to Exhibit 10.19 to the Company's Form 10-K filed on February 20, 2015). |
10.16** | Second Amended and Restated Agreement of Limited Partnership of CVR Partners, LP, dated April 13, 2011 (incorporated by reference to Exhibit 10.7 to the Company's Form 8-K/A filed on May 23, 2011). |
10.17** | Amended and Restated Contribution, Conveyance and Assumption Agreement, dated as of April 7, 2011, among Coffeyville Resources, LLC, CVR GP, LLC, Coffeyville Acquisition III LLC, CVR Special GP, LLC and CVR Partners, LP (incorporated by reference to Exhibit 10.1 to the Company's Form 8-K/A filed on May 23, 2011). |
10.18** | Environmental Agreement, dated as of October 25, 2007, by and between Coffeyville Resources Refining & Marketing, LLC and Coffeyville Resources Nitrogen Fertilizers, LLC (incorporated by reference to Exhibit 10.7 to the Company's Form 10-Q for the quarter ended September 30, 2007, filed on December 6, 2007). |
10.18.1** | Supplement to Environmental Agreement, dated as of February 15, 2008, by and between Coffeyville Resources Refining and Marketing, LLC and Coffeyville Resources Nitrogen Fertilizers, LLC (incorporated by reference to Exhibit 10.17.1 to the Company's Form 10-K for the year ended December 31, 2007, filed on March 28, 2008). |
10.18.2** | Second Supplement to Environmental Agreement, dated as of July 23, 2008, by and between Coffeyville Resources Refining and Marketing, LLC and Coffeyville Resources Nitrogen Fertilizers, LLC (incorporated by reference to Exhibit 10.1 to the Company's Form 10-Q for the quarter ended June 30, 2008, filed on August 14, 2008). |
10.19** | Amended and Restated Feedstock and Shared Services Agreement, dated as of April 13, 2011, by and between Coffeyville Resources Refining & Marketing, LLC and Coffeyville Resources Nitrogen Fertilizers, LLC (incorporated by reference to Exhibit 10.4 to the Company's Form 8-K/A filed on May 23, 2011). |
10.19.1** | Amendment to Amended and Restated Feedstock and Shared Services Agreement, dated as of December 30, 2013, by and between Coffeyville Resources Refining & Marketing, LLC and Coffeyville Resources Nitrogen Fertilizers, LLC (incorporated by reference to Exhibit 10.21.1 to the Company's Form 10-K filed on February 26, 2014). |
10.20** | Raw Water and Facilities Sharing Agreement, dated as of October 25, 2007, by and between Coffeyville Resources Refining & Marketing, LLC and Coffeyville Resources Nitrogen Fertilizers, LLC (incorporated by reference to Exhibit 10.9 to the Company's Form 10-Q for the quarter ended September 30, 2007, filed on December 6, 2007). |
10.21** | Second Amended and Restated Services Agreement, dated as of May 4, 2012, among CVR Partners, LP, CVR GP, LLC and CVR Energy, Inc. (incorporated by reference to Exhibit 10.2 to the Company's Form 10-Q filed on August 2, 2012). |
10.21.1** | Amendment to Second Amended and Restated Services Agreement, dated as of February 17, 2014, among CVR Partners, LP, CVR GP, LLC and CVR Energy, Inc. (incorporated by reference to Exhibit 10.1 to the Company's Form 10-Q filed on May 2, 2014). |
10.22** | Amended and Restated Omnibus Agreement, dated as of April 13, 2011, among CVR Energy, Inc., CVR GP, LLC and CVR Partners, LP (incorporated by reference to Exhibit 10.2 to the Company's Form 8-K/A filed on May 23, 2011). |
10.23** | Coke Supply Agreement, dated as of October 25, 2007, by and between Coffeyville Resources Refining & Marketing, LLC and Coffeyville Resources Nitrogen Fertilizers, LLC (incorporated by reference to Exhibit 10.5 to the Company's Form 10-Q for the quarter ended September 30, 2007, filed on December 6, 2007). |
10.24** | Amended and Restated Cross-Easement Agreement, dated as of April 13, 2011, by and between Coffeyville Resources Refining & Marketing, LLC and Coffeyville Resources Nitrogen Fertilizers, LLC (incorporated by reference to Exhibit 10.5 to the Company's Form 8-K/A filed on May 23, 2011). |
154
Exhibit Number | Exhibit Title |
10.25** | GP Services Agreement, dated as of November 29, 2011, by and between CVR Partners, LP, CVR GP, LLC and CVR Energy, Inc. (incorporated by reference to Exhibit 10.22 to the Form 10-K for the year ended December 31, 2011, filed by CVR Partners, LP on February 24, 2012 (Commission File No. 001-35120)). |
10.25.1** | Amendment to GP Services Agreement, dated as of June 27, 2014, by and between CVR Partners, LP, CVR GP, LLC and CVR Energy, Inc. (incorporated by reference to Exhibit 10.1 to the Company's Form 10-Q filed on August 1, 2014). |
10.26** | Trademark License Agreement, dated as of April 13, 2011, by and between CVR Energy, Inc. and CVR Partners, LP (incorporated by reference to Exhibit 10.9 to the Company's Form 8-K/A filed on May 23, 2011). |
10.27** | Lease and Operating Agreement, dated as of May 4, 2012, by and between Coffeyville Resources Terminal, LLC and Coffeyville Resources Nitrogen Fertilizers, LLC (incorporated by reference to Exhibit 10.2 to the Company's Form 10-Q filed on August 2, 2012). |
10.28** | Form of Indemnification Agreement (incorporated by reference to Exhibit 10.49 to the Company's Form 10-K for the year ended December 31, 2008, filed on March 13, 2009). |
10.29**++ | Amended and Restated CVR Energy, Inc. 2007 Long Term Incentive Plan, dated as of December 26, 2013 (incorporated by reference to Exhibit 10.32 to the Company's Form 10-K filed on February 26, 2014). |
10.29.1**++ | Form of Nonqualified Stock Option Agreement (incorporated by reference to Exhibit 10.33.1 to the Company's Registration Statement on Form S-1/A, File No. 333-137588, filed on June 5, 2007). |
10.29.2**++ | Form of Director Stock Option Agreement (incorporated by reference to Exhibit 10.33.2 to the Company's Registration Statement on Form S-1/A, File No. 333-137588, filed on June 5, 2007). |
10.29.3**++ | Form of Director Restricted Stock Agreement (incorporated by reference to Exhibit 10.28.3 to the Company's Form 10-K for the year ended December 31, 2009, filed on March 12, 2010). |
10.29.4**++ | Form of Restricted Stock Agreement (incorporated by reference to Exhibit 10.1 to the Company's Form 8-K filed on December 23, 2011). |
10.29.5**++ | Form of Restricted Stock Unit Agreement (incorporated by reference to Exhibit 10.1 to the Company's Form 8-K filed on January 4, 2013). |
10.29.6**++ | Form of Incentive Unit Agreement (incorporated by reference to Exhibit 10.32.6 to the Company's Form 10-K filed on February 26, 2014). |
10.30**++ | Performance Unit Agreement, dated as of December 31, 2015, by and between CVR Energy, Inc. and John J. Lipinski (incorporated by reference to Exhibit 10.20 to CVR Partners, LP's Form 10-K filed on February 18, 2016 (Commission File No. 001-35120)). |
10.31**++ | Other Unit Based Award Agreement, dated as of April 15, 2015, by and between CVR Energy, Inc. and Martin J. Power (incorporated by reference to Exhibit 10.3 to CVR Refining, LP's Form 10-K filed on February 19, 2016 (Commission File No. 001-35781)). |
10.32**++ | CVR Partners, LP Long-Term Incentive Plan (adopted March 16, 2011) (incorporated by reference to Exhibit 10.1 to the Form S-8 filed by CVR Partners, LP on April 12, 2011 (Commission File No. 333-173444)). |
10.32.1**++ | Form of CVR Partners, LP Long-Term Incentive Plan Employee Phantom Unit Agreement (incorporated by reference to Exhibit 10.18.4 to the Form 10-K filed by CVR Partners, LP on March 1, 2013 (Commission File No. 001-35120)). |
10.32.2**++ | Form of CVR Partners, LP Long-Term Incentive Plan Employee Phantom Unit Agreement (incorporated by reference to Exhibit 10.18.5 to the Form 10-K filed by CVR Partners, LP on March 1, 2013 (Commission File No. 001-35120)). |
10.32.3**++ | Form of CVR Partners, LP Long-Term Incentive Plan Employee Phantom Unit Agreement (incorporated by reference to Exhibit 10.38.3 to the Company's Form 10-K filed on February 20, 2015). |
10.33**++ | CVR Energy, Inc. Performance Incentive Plan (incorporated by reference to Exhibit 10.24 to the Form 10-K filed by CVR Partners, LP on March 1, 2013 (Commission File No. 001-35120)). |
10.34**++ | CVR Partners, LP Performance Incentive Plan (incorporated by reference to Exhibit 10.24 to the Form 10-K filed by CVR Partners, LP on March 1, 2013 (Commission File No. 001-35120)). |
10.35** | Third Amended and Restated Limited Liability Company Agreement of CVR GP, LLC, dated April 13, 2011 (incorporated by reference to Exhibit 3.4 to the Form 10-K for the year ended December 31, 2011 filed by CVR Partners, LP on February 24, 2012 (Commission File No. 001-35120)). |
155
Exhibit Number | Exhibit Title |
10.36** | First Amended and Restated Agreement of Limited Partnership of CVR Refining, LP, dated as of January 23, 2013 (incorporated by reference to Exhibit 3.1 to the Form 8-K filed by CVR Refining, LP on January 29, 2013 (Commission File No. 001-35781)). |
10.37** | Contribution Agreement, dated December 31, 2012, by and among CVR Refining, LP, CVR Refining Holdings, LLC and CVR Refining Holdings Sub, LLC (incorporated by reference to Exhibit 10.1 to the Form S-1/A filed by CVR Refining, LP on January 8, 2013 (Commission File No. 333-184200)). |
10.38**++ | CVR Refining, LP Long-Term Incentive Plan (incorporated by reference to Exhibit 10.2 to the Partnership's Form 8-K filed on January 23, 2013 (Commission File No. 001-35781)). |
10.38.1**++ | Form of CVR Refining, LP Long-Term Incentive Plan Employee Phantom Unit Agreement (incorporated by reference to Exhibit 10.41.1 to the Company's Form 10-K filed on February 26, 2014). |
10.38.2**++ | Form of CVR Refining, LP Long-Term Incentive Plan Employee Phantom Unit Agreement (incorporated by reference to Exhibit 10.44.2 to the Company's Form 10-K filed on February 20, 2015). |
10.39** | Services Agreement, dated December 31, 2012, by and among CVR Refining, LP, CVR Refining GP, LLC and CVR Energy, Inc. (incorporated by reference to Exhibit 10.2 to the Form 8-K filed by CVR Refining, LP on January 29, 2013 (Commission File No. 001-35781)). |
10.39.1** | Amendment to Services Agreement, dated as of February 17, 2014, by and among CVR Refining, LP, CVR Refining GP, LLC and CVR Energy, Inc. (incorporated by reference to Exhibit 10.2 to the Company's Form 10-Q filed on May 2, 2014). |
10.39.2** | Second Amendment to Services Agreement, dated as of June 27, 2014, by and among CVR Refining, LP, CVR Refining GP, LLC and CVR Energy, Inc. (incorporated by reference to Exhibit 10.2 to the Company's Form 10-Q filed on August 1, 2014). |
10.40** | Trademark License Agreement, dated as of January 23, 2013, by and among CVR Refining, LP and CVR Energy, Inc. (incorporated by reference to Exhibit 10.3 to the Form 8-K filed by CVR Refining, LP on January 29, 2013 (Commission File No. 001-35781)). |
10.41** | Senior Unsecured Revolving Credit Agreement, dated as of January 23, 2013, by and among CVR Refining, LLC and Coffeyville Resources, LLC (incorporated by reference to Exhibit 10.4 to the Form 8-K filed by CVR Refining, LP on January 29, 2013 (Commission File No. 001-35781)). |
10.41.1** | First Amendment to Credit Agreement, dated as of October 29, 2014, by and among CVR Refining, LLC and Coffeyville Resources, LLC (incorporated by reference to Exhibit 10.1 to the Company's Form 8-K filed October 30, 2014). |
10.42** | Reorganization Agreement, dated as of January 16, 2013, by and among CVR Refining, LP, CVR Refining GP, LLC, CVR Refining Holdings, LLC and CVR Refining Holdings Sub, LLC (incorporated by reference to Exhibit 10.1 to the Form 8-K filed by CVR Refining, LP on January 23, 2013 (Commission File No. 001-35781)). |
10.43** | Amended and Restated Registration Rights Agreement, dated as of April 13, 2011, among CVR Partners, LP and Coffeyville Resources, LLC (incorporated by reference to Exhibit 10.6 to the Company's Form 8-K/A filed by on May 23, 2011). |
10.44** | Registration Rights Agreement, dated as of January 23, 2013, by and among CVR Refining, LP, Icahn Enterprises Holdings L.P., CVR Refining Holdings, LLC and CVR Refining Holdings Sub, LLC (incorporated by reference to Exhibit 10.1 to the Form 8-K filed by CVR Refining, LP on January 29, 2013 (Commission File No. 001-35781)). |
10.45** | Registration Rights Agreement, dated as of August 9, 2015, by and among CVR Partners, Coffeyville Resources, LLC, Rentech Nitrogen Holdings, Inc., and DSHC, LLC (incorporated by reference to Exhibit 4.1 to the Form 8-K filed by CVR Partners, LP on August 13, 2015 (Commission File No. 001-35120)). |
10.46** | Voting and Support Agreement, dated as of August 9, 2015, by and among CVR Partners, LP, Rentech, Inc., Rentech Nitrogen Holdings, Inc., and DSHC, LLC (incorporated by reference to Exhibit 10.1 to the Form 8-K filed by CVR Partners, LP on August 13, 2015 (Commission File No. 001-35120)). |
10.47** | Transaction Agreement, dated as of August 9, 2015, by and among CVR Partners, LP, Coffeyville Resources, LLC, Rentech, Inc., Rentech Nitrogen Holdings, Inc., and DSHC, LLC (incorporated by reference to Exhibit 10.2 to the Form 8-K filed by CVR Partners, LP on August 13, 2015 (Commission File No. 001-35120)). |
156
Exhibit Number | Exhibit Title |
10.48** | Transaction Agreement, dated as of August 9, 2015, by and among CVR Partners, LP, GSO Special Situations Overseas Master Fund Ltd., GSO Special Situations Fund LP, GSO Palmetto Opportunistic Investment Partners LP, GSO Credit-A Partners LP, Steamboat Credit Opportunities Master Fund LP, GSO Coastline Credit Partners LP, GSO Cactus Credit Opportunities Fund LP and GSO Aiguille des Grands Montets Fund II LP and GSO Capital Partners LP (incorporated by reference to Exhibit 10.3 to the Form 8-K filed by CVR Partners, LP on August 13, 2015 (Commission File No. 001-35120)). |
10.49** | Commitment Letter, dated as of August 9, 2015, by and between Coffeyville Resources, LLC and CVR Partners, LP (incorporated by reference to Exhibit 10.4 to the Form 8-K filed by CVR Partners, LP on August 13, 2015 (Commission File No. 001-35120)). |
21.1** | List of Subsidiaries of CVR Energy, Inc. (incorporated by reference to Exhibit 21.1 to the Company's Form 10-K for the year ended December 31, 2012, filed on March 14, 2013). |
23.1* | Consent of Grant Thornton LLP. |
31.1* | Rule 13a-14(a)/15d-14(a) Certification of Chief Executive Officer and President. |
31.2* | Rule 13a-14(a)/15d-14(a) Certification of Chief Financial Officer and Treasurer. |
32.1* | Section 1350 Certification of Chief Executive Officer and President and Chief Financial Officer and Treasurer. |
101* | The following financial information for CVR Energy, Inc.'s Annual Report on Form 10-K for the year ended December 31, 2015, formatted in XBRL ("Extensible Business Reporting Language") includes: (1) Consolidated Balance Sheets, (2) Consolidated Statements of Operations, (3) Consolidated Statements of Comprehensive Income, (4) Consolidated Statements of Changes in Equity, (5) Consolidated Statements of Cash Flows and (6) the Notes to Consolidated Financial Statements, tagged in detail. |
_______________________________________
* | Filed herewith. | |
** | Previously filed. | |
† | Certain portions of this exhibit have been omitted and separately filed with the SEC pursuant to a request for confidential treatment which has been granted by the SEC. | |
++ | Denotes management contract or compensatory plan or arrangement. | |
# | Schedules have been omitted pursuant to Item 601(b)(2) of Regulation S-K. CVR Energy hereby undertakes to furnish supplemental copies of any of the omitted schedules upon request by the U.S. Securities and Exchange Commission. | |
PLEASE NOTE: Pursuant to the rules and regulations of the SEC, we may file or incorporate by reference agreements as exhibits to the reports that we file with or furnish to the SEC. The agreements are filed to provide investors with information regarding their respective terms. The agreements are not intended to provide any other factual information about the Company or its business or operations. In particular, the assertions embodied in any representations, warranties and covenants contained in the agreements may be subject to qualifications with respect to knowledge and materiality different from those applicable to investors and may be qualified by information in confidential disclosure schedules not included with the exhibits. These disclosure schedules may contain information that modifies, qualifies and creates exceptions to the representations, warranties and covenants set forth in the agreements. Moreover, certain representations, warranties and covenants in the agreements may have been used for the purpose of allocating risk between the parties, rather than establishing matters as facts. In addition, information concerning the subject matter of the representations, warranties and covenants may have changed after the date of the respective agreement, which subsequent information may or may not be fully reflected in the Company's public disclosures. Accordingly, investors should not rely on the representations, warranties and covenants in the agreements as characterizations of the actual state of facts about the Company or its business or operations on the date hereof.
157
SIGNATURES
Pursuant to the requirements of Section 13 or 15(d) of the Securities Exchange Act of 1934, the registrant has duly caused this Report to be signed on its behalf by the undersigned, thereunto duly authorized.
CVR Energy, Inc. | |||
By: | /s/ JOHN J. LIPINSKI | ||
Name: | John J. Lipinski | ||
Title: | Chief Executive Officer and President | ||
Date: February 19, 2016
Pursuant to the requirements of the Securities Exchange Act of 1934, this Report had been signed below by the following persons on behalf of the registrant and in the capacity and on the dates indicated.
Signature | Title | Date |
/s/ JOHN J. LIPINSKI | Chief Executive Officer, President and Director (Principal Executive Officer) | February 19, 2016 |
John J. Lipinski | ||
/s/ SUSAN M. BALL | Chief Financial Officer and Treasurer (Principal Financial and Accounting Officer) | February 19, 2016 |
Susan M. Ball | ||
Chairman of the Board of Directors | February 19, 2016 | |
Carl C. Icahn | ||
/s/ BOB G. ALEXANDER | Director | February 19, 2016 |
Bob G. Alexander | ||
/s/ SUNGHWAN CHO | Director | February 19, 2016 |
SungHwan Cho | ||
/s/ ANDREW LANGHAM | Director | February 19, 2016 |
Andrew Langham | ||
/s/ COURTNEY MATHER | Director | February 19, 2016 |
Courtney Mather | ||
/s/ STEPHEN MONGILLO | Director | February 19, 2016 |
Stephen Mongillo | ||
/s/ JAMES M. STROCK | Director | February 19, 2016 |
James M. Strock | ||
158