Attached files
| file | filename |
|---|---|
| 8-K - 8-K - COVANTA HOLDING CORP | d296095d8k.htm |
| EX-99.1 - EX-99.1 - COVANTA HOLDING CORP | d296095dex991.htm |

| Covanta Holding Corporation Fourth Quarter and Year End 2011 Earnings Conference Call NYSE: CVA February 9, 2012 1 Exhibit 99.2 |

| All information included in this earnings presentation is based on continuing operations. Forward-Looking Statements Certain statements in this presentation may constitute "forward-looking" statements as defined in Section 27A of the Securities Act of 1933 (the "Securities Act"), Section 21E of the Securities Exchange Act of 1934 (the "Exchange Act"), the Private Securities Litigation Reform Act of 1995 (the "PSLRA") or in releases made by the Securities and Exchange Commission ("SEC"), all as may be amended from time to time. Such forward- looking statements involve known and unknown risks, uncertainties and other important factors that could cause the actual results, performance or achievements of Covanta and its subsidiaries, or general industry or broader economic performance in global markets in which Covanta operates or competes, to differ materially from any future results, performance or achievements expressed or implied by such forward-looking statements. Statements that are not historical fact are forward-looking statements. Forward-looking statements can be identified by, among other things, the use of forward-looking language, such as the words "plan," "believe," "expect," "anticipate," "intend," "estimate," "project," "may," "will," "would," "could," "should," "seeks," or "scheduled to," or other similar words, or the negative of these terms or other variations of these terms or comparable language, or by discussion of strategy or intentions. These cautionary statements are being made pursuant to the Securities Act, the Exchange Act and the PSLRA with the intention of obtaining the benefits of the "safe harbor" provisions of such laws. Covanta cautions investors that any forward-looking statements made by Covanta are not guarantees or indicative of future performance. Important assumptions and other important factors that could cause actual results to differ materially from those forward-looking statements with respect to Covanta, include, but are not limited to, the risk that Covanta may not successfully grow its business as expected or close its announced or planned acquisitions or projects in development, and those factors, risks and uncertainties that are described in periodic securities filings by Covanta with the SEC. Although Covanta believes that its plans, intentions and expectations reflected in or suggested by such forward-looking statements are reasonable, actual results could differ materially from a projection or assumption in any forward-looking statements. Covanta's future financial condition and results of operations, as well as any forward-looking statements, are subject to change and to inherent risks and uncertainties. The forward-looking statements contained in this press release are made only as of the date hereof and Covanta does not have or undertake any obligation to update or revise any forward- looking statements whether as a result of new information, subsequent events or otherwise, unless otherwise required by law. Non-GAAP Financial Measures We use a number of different financial measures, both United States generally accepted accounting principles ("GAAP") and non-GAAP, in assessing the overall performance of our business. The non-GAAP financial measures of Adjusted EBITDA, Free Cash Flow and Adjusted EPS, as described and used in this earnings presentation, are not intended as a substitute or as an alternative to net income, cash flow provided by operating activities or diluted earnings per share as indicators of our performance or liquidity or any other measures of performance or liquidity derived in accordance with GAAP. In addition, our non-GAAP financial measures may be different from non-GAAP measures used by other companies, limiting their usefulness for comparison purposes. The presentations of Adjusted EBITDA, Free Cash Flow and Adjusted EPS are intended to enhance the usefulness of our financial information by providing measures which management internally use to assess and evaluate the overall performance of its business and those of possible acquisition candidates, and highlight trends in the overall business. In each case, a reconciliation to the nearest GAAP measure is provided. Cautionary Statements |
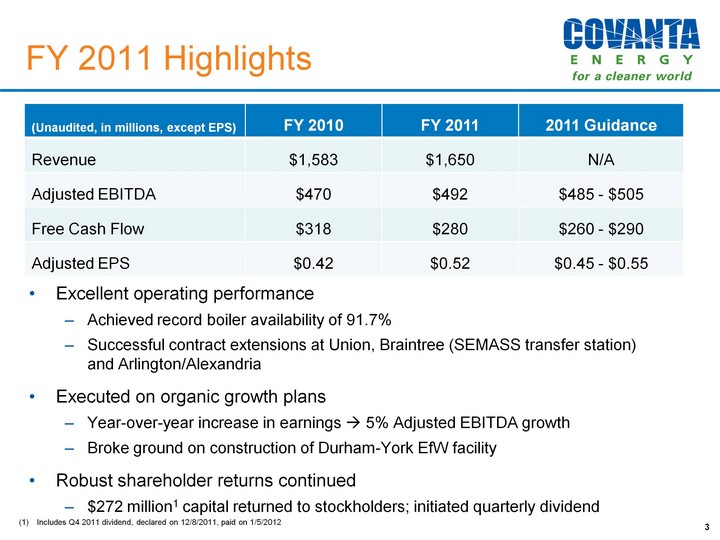
| FY 2011 Highlights 3 Excellent operating performance Achieved record boiler availability of 91.7% Successful contract extensions at Union, Braintree (SEMASS transfer station) and Arlington/Alexandria Executed on organic growth plans Year-over-year increase in earnings ? 5% Adjusted EBITDA growth Broke ground on construction of Durham-York EfW facility Robust shareholder returns continued $272 million1 capital returned to stockholders; initiated quarterly dividend (Unaudited, in millions, except EPS) FY 2010 FY 2011 2011 Guidance Revenue $1,583 $1,650 N/A Adjusted EBITDA $470 $492 $485 - $505 Free Cash Flow $318 $280 $260 - $290 Adjusted EPS $0.42 $0.52 $0.45 - $0.55 Includes Q4 2011 dividend, declared on 12/8/2011, paid on 1/5/2012 |
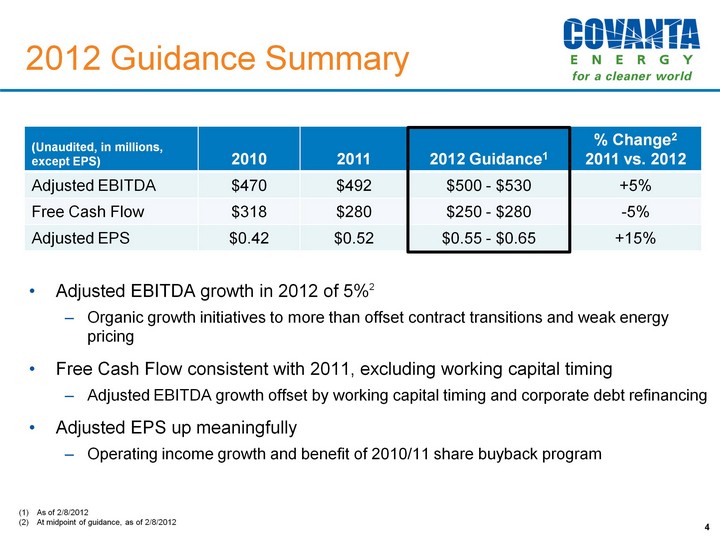
| 2012 Guidance Summary 4 Adjusted EBITDA growth in 2012 of 5%2 Organic growth initiatives to more than offset contract transitions and weak energy pricing Free Cash Flow consistent with 2011, excluding working capital timing Adjusted EBITDA growth offset by working capital timing and corporate debt refinancing Adjusted EPS up meaningfully Operating income growth and benefit of 2010/11 share buyback program (Unaudited, in millions, except EPS) 2010 2011 2012 Guidance1 % Change2 2011 vs. 2012 Adjusted EBITDA $470 $492 $500 - $530 +5% Free Cash Flow $318 $280 $250 - $280 -5% Adjusted EPS $0.42 $0.52 $0.55 - $0.65 +15% As of 2/8/2012 At midpoint of guidance, as of 2/8/2012 |

| Waste Market Update Current Trends: Tip fee pricing for 2011 up ~1% Q4 '11 tip fee pricing generally flat 2012 Outlook: Contracted waste revenue (~75%) escalations moving up with inflation Expect spot tip fee pricing to be generally flat 5 |

| Recycled Metals Market Update Current Trends: Strong 2011 prices holding up Q4 '11 metals revenue $19 million, down slightly from Q3 '11 Year-over-year net metals revenues up ~ $19 million or 35% to $74 million Price added ~ 70% of growth Metal shredder acquisition and volume added ~ 30% of growth 2011 ferrous tons: 414,000; 2011 non-ferrous tons: 16,000 2012 Outlook: Guidance assumes current recycled metal prices Anticipate continued strong demand Current ferrous pricing (HMS #1) ? flat with 2011 Current non-ferrous pricing ? slightly down from 2011 Rough rule of thumb: $50 change in HMS #1 Index ? ~$10 million annual impact on Adjusted EBITDA 6 |
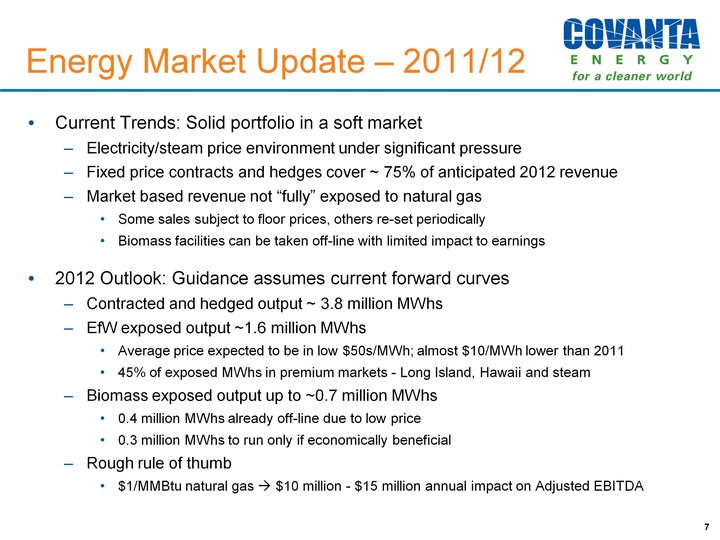
| Energy Market Update - 2011/12 Current Trends: Solid portfolio in a soft market Electricity/steam price environment under significant pressure Fixed price contracts and hedges cover ~ 75% of anticipated 2012 revenue Market based revenue not "fully" exposed to natural gas Some sales subject to floor prices, others re-set periodically Biomass facilities can be taken off-line with limited impact to earnings 2012 Outlook: Guidance assumes current forward curves Contracted and hedged output ~ 3.8 million MWhs EfW exposed output ~1.6 million MWhs Average price expected to be in low $50s/MWh; almost $10/MWh lower than 2011 45% of exposed MWhs in premium markets - Long Island, Hawaii and steam Biomass exposed output up to ~0.7 million MWhs 0.4 million MWhs already off-line due to low price 0.3 million MWhs to run only if economically beneficial Rough rule of thumb $1/MMBtu natural gas ? $10 million - $15 million annual impact on Adjusted EBITDA 7 |
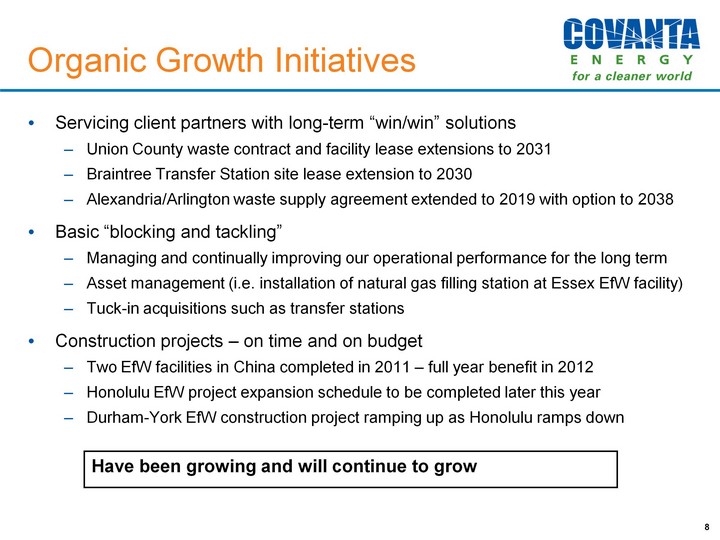
| Organic Growth Initiatives Servicing client partners with long-term "win/win" solutions Union County waste contract and facility lease extensions to 2031 Braintree Transfer Station site lease extension to 2030 Alexandria/Arlington waste supply agreement extended to 2019 with option to 2038 Basic "blocking and tackling" Managing and continually improving our operational performance for the long term Asset management (i.e. installation of natural gas filling station at Essex EfW facility) Tuck-in acquisitions such as transfer stations Construction projects - on time and on budget Two EfW facilities in China completed in 2011 - full year benefit in 2012 Honolulu EfW project expansion schedule to be completed later this year Durham-York EfW construction project ramping up as Honolulu ramps down 8 Have been growing and will continue to grow |
| Organic Growth Initiatives (cont'd) Grow metals revenue - increase quantity and quality of recycled metals Improvements through enhancing existing systems and adding new magnet systems, non-ferrous recovery systems and shredders Grow special waste revenue - improve pricing from mix of waste Pricing premium for special waste Enhanced customer offerings from Covanta4Recovery Covanta4Recovery: sustainable solutions, specialty services, assured destruction Will yield modest 2012 improvement; investing now for results in 2013 and beyond Performance improvement - leveraging technology, assets and scale Largely cost efficiency initiatives Deploying Covanta technologies such as ash conditioning Efficiency improvements - focus on resource, labor and purchasing optimization Innovation in maintenance techniques and process automation 9 Have been growing and will continue to grow |

| Summary 2011 was an excellent year for Covanta Grew Adjusted EBITDA 5% vs. 2010 Several operational successes Executed on meaningful shareholder returns Excited about 2012 outlook Organic growth initiatives drive Adjusted EBITDA up 5%1 despite challenging energy market and decline in debt service billings Will see additional clarity on development projects Capital allocation and shareholder returns continue to be a focus 10 Midpoint of 2012 Adjusted EBITDA guidance of $500 million to $530 million |

| Financial Overview 11 |

| Q4 2011 Financial Highlights 12 Continued strong financial and operational performance Year-over-year gains in most financial metrics Strength in metals pricing is offsetting energy pricing decline Benefit from maintenance timing Continued return to shareholders via dividend and stock buyback (Unaudited, $ in millions, except EPS) (Unaudited, in millions, except EPS) Q4 '10 Q4 '11 Management Remarks Revenue $419 $430 Service fee contract escalations, increased metal pricing and volume, higher tip fee volume and increased construction revenue, partially offset by reduced debt service pass through revenue and lower energy revenue Adjusted EBITDA $129 $146 Higher revenues for waste and recycled metals and lower maintenance expense, partially offset by reduced debt service pass through billings and lower energy revenue Free Cash Flow $82 $65 Higher Adjusted EBITDA was offset by a semi-annual high yield interest payment and expected working capital changes Adjusted EPS $0.19 $0.26 Improved operating performance and a lower share count, offset by a higher effective tax rate and increased interest expense |

| Revenue: Q4 10 vs. Q4 11 $ in millions (Unaudited) 13 Includes small amounts of coal-fired energy in China 1 |

| Adj EBITDA: Q4 10 vs. Q4 11 (Unaudited) $ in millions 14 |
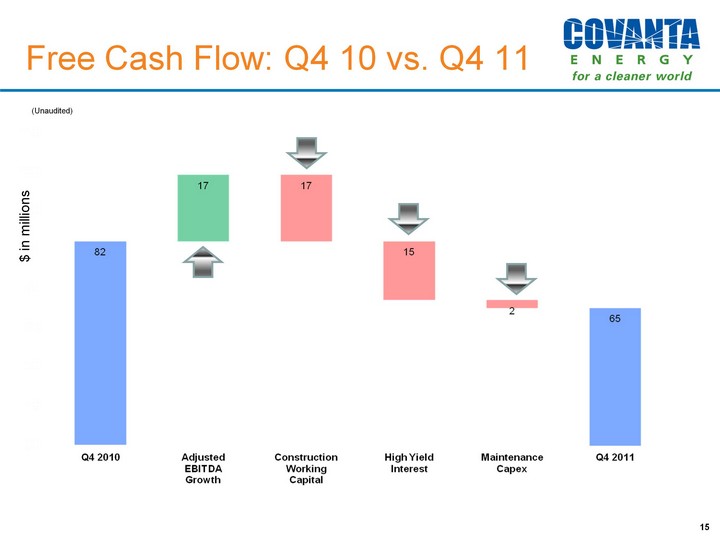
| Free Cash Flow: Q4 10 vs. Q4 11 (Unaudited) $ in millions 15 |

| Adj EPS: Q4 10 vs. Q4 11 ($, Unaudited) 16 |

| Capitalization Summary 17 Debt balances are presented at principal value, not book value. Net debt is calculated as total principal amount of debt outstanding less cash and cash equivalents and debt service principal-related restricted funds. Ratio is computed on a consolidated basis and differs from the calculation required under Covanta's credit facility. Capitalization is calculated as total debt outstanding plus stockholders' equity. Balance sheet remains strong; ample liquidity Repaid a total of $176 million of debt in 2011 Over last 5 years, paid down over $800 million of maturing project debt, continuing to increase overall financial flexibility - Dry powder |

| Actively Returning Capital Returned $272 million in 2011 Returned ~$600 million to shareholders since June 2010 Solid dividend with growth potential: $0.30 per share annually Active share repurchase program $230 million repurchased in 2011 (14.4 million shares or 9.9% of outstanding shares) Funded from repatriated Asia IPP asset sales (~$137 million) and operating cash flow Plan to continue share buyback program until further notice 18 (Unaudited, in millions) Q1 2011 Q2 2011 Q3 2011 Q4 2011 FY 2011 Stock Buyback $54 $70 $81 $25 $230 Dividend $11 $11 $10 $10 $42 Total Returned $65 $81 $91 $35 $272 |

| 2011 Uses of Free Cash Flow 19 (Unaudited, in millions) 2011 Sources Free Cash Flow $280 Asset Sales, net 267 Total Sources 547 Uses Debt repayments, net 2 138 Growth Capital, net of project debt proceeds 2 53 Increase in International Cash (Held for International Investment) 122 Dividends 3 42 Stock Buyback 3 230 Total Shareholder Return 272 Total Uses 585 Net Change $(38) Computed at 1/31/12 by dividing the midpoint of our 2012 Free Cash Flow guidance range ($265 million) by our market capitalization, which represents the closing price per share ($14.29) multiplied by the number of shares outstanding (136 million) See slide 39 Includes: $10 million of dividends and $1 million of stock buybacks that were paid in January 2012 Current Free Cash Flow yield of approximately 14%1 |

| 2012 Guidance Summary 20 (Unaudited, in millions, except EPS) 2010 2011 2012 Guidance1 % Change2 2011 vs. 2012 Adjusted EBITDA $470 $492 $500 - $530 +5% Free Cash Flow $318 $280 $250 - $280 -5% Adjusted EPS $0.42 $0.52 $0.55 - $0.65 +15% As of 2/8/2012 At midpoint of guidance, as of 2/8/2012 |

| Adj. EBITDA: 2011 vs. 2012E (Unaudited) $ in millions 21 +$20 to +$30 +$5 to +$10 +$15 to +$25 $(18) $500 to $530 $(10) to $0 Guidance as of 2/8/2012 1 $(7) $492 |

| FCF: 2011 vs. 2012E (Unaudited) $ in millions 22 $(15) to $(25) $250 to $280 +$23 $(15) to $(20) Midpoint of our Adjusted EBITDA guidance ($500 million to $530 million) vs. 2011 Adjusted EBITDA of $492 million Guidance as of 2/8/2012 2 $280 1 |

| Adj. EPS: 2011 vs. 2012E (Unaudited) 23 +$0.01 $0.55 to $0.65 $(0.12) to $(0.08) +$0.02 +$0.10 to +$0.20 Guidance as of 2/8/2012 Note: Based on year-end 2011 balance of 136 million shares outstanding; does not reflect any potential impact of 2012 share repurchases 1 $0.52 |

| Tax Outlook NOL continues to represent significant value for shareholders 24 (Unaudited, $ in millions) 2008 2009 2010 2011 Book Taxes $79 $42 $24 $28 Cash Taxes (net of refunds) 17 2 4 13 Difference $62 $40 $20 $15 2012 tax outlook Expect effective tax rate in range of 40 - 45% Expect cash taxes to be in the range of $10-15 million NOL outlook unchanged since last update Expect year-end 2011 U.S. Federal NOL balance of $427 million to be fully utilized by mid-decade AMT and PTC carry-forwards to provide additional partial tax shield past NOL utilization Under current assumptions, not fully tax paying until late into the decade |

| Maintenance activity is seasonal (unlike most other plant operating expenses) Represents about 25% of plant operating expense Typically occurs during the first half (with most activity in Q1) 2012 quarterly maintenance expense timing forecasted to be similar to 2011 Focus is on optimizing operating performance and on the annual spend Maintenance Seasonality 25 % of Maintenance Capital Expense by Quarter |

| Q1 2012 Outlook Year-over-year Q1 2012 Outlook: Similar trends to previous years Q1 earnings impacted by scheduled maintenance outages Q1 2012 Free Cash Flow expected to be down significantly due to working capital timing Free Cash Flow will be weighted towards 2H 2012 due to working capital timing Seasonality primarily from scheduled maintenance activity 26 Historical Operating Income Trend |
| Covanta Holding Corporation Fourth Quarter and Year End 2011 Earnings Conference Call NYSE: CVA Appendix 27 |

| Stable Revenue Mix with Upside 28 2011 Actuals $1,080 million Revenue mix between contracted and market allows for stability, with both upside and operational flexibility Waste & Service Revenues - Americas 2011 Actuals $376 million Energy Revenues - Americas |

| Waste Contract Outlook 29 Tip Fee Service Fee Owned Service Fee Operated Major Municipal Waste Contract Transitions from 2008 - 2020 |

| Q4 and FY 2011 Summary Results 30 |
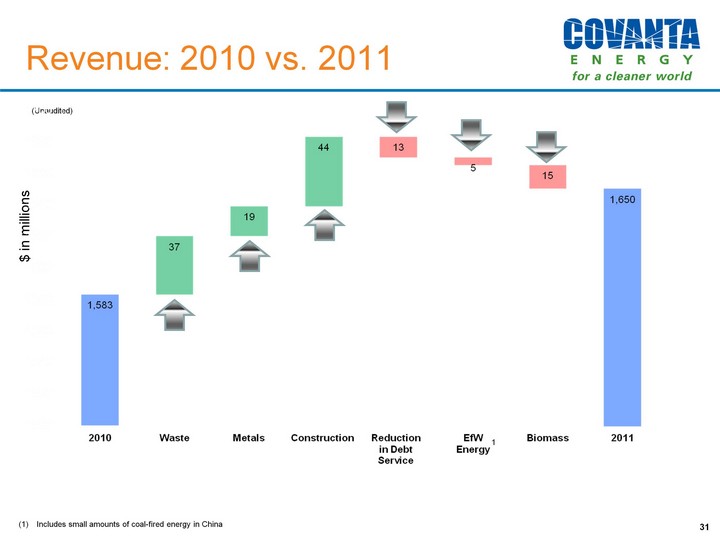
| Revenue: 2010 vs. 2011 $ in millions (Unaudited) 31 Includes small amounts of coal-fired energy in China 1 |

| Adj EBITDA: 2010 vs. 2011 (Unaudited) $ in millions 32 |

| Free Cash Flow: 2010 vs. 2011 (Unaudited) $ in millions 33 |

| Adj EPS: 2010 vs. 2011 ($, Unaudited) 34 |

| Strong Free Cash Flow Guidance as of 2/8/2012 Note: Please see slide 37 in the Supplemental Schedules for the text of footnotes 2 to 6 35 Free Cash Flow significantly exceeds Net Income on a consistent, sustainable basis D&A far exceeds maintenance capex requirements - an ongoing difference Low cash taxes due to shield from NOL and tax credits Non-cash interest related to convertible debt |

| Free Cash Flow Free Cash Flow is defined as cash flow provided by operating activities from continuing operations less maintenance capital expenditures, which are capital expenditures primarily to maintain our existing facilities. We use the non-GAAP measure of Free Cash Flow as a criterion of liquidity and performance-based components of employee compensation. We use Free Cash Flow as a measure of liquidity to determine amounts we can reinvest in our core businesses, such as amounts available to make acquisitions, invest in construction of new projects or make principal payments on debt. In order to provide a meaningful basis for comparison, we are providing information with respect to our Free Cash Flow reconciled for all periods to cash flow provided by operating activities from continuing operations, which we believe to be the most directly comparable measure under GAAP. Adjusted EBITDA We use Adjusted EBITDA to provide further information that is useful to an understanding of the financial covenants contained in the credit facilities of our most significant subsidiary, Covanta Energy, through which we conduct our core waste and energy services business, and as additional ways of viewing aspects of its operations that, when viewed with the GAAP results and the accompanying reconciliations to corresponding GAAP financial measures, provide a more complete understanding of our core business. The calculation of Adjusted EBITDA is based on the definition in Covanta Energy's credit facilities, which we have guaranteed. Adjusted EBITDA is defined as earnings before interest, taxes, depreciation and amortization, as adjusted for additional items subtracted from or added to net income. Because our business is substantially comprised of that of Covanta Energy, our financial performance is substantially similar to that of Covanta Energy. For this reason, and in order to avoid use of multiple financial measures which are not all from the same entity, the calculation of Adjusted EBITDA and other financial measures presented herein are ours, measured on a consolidated basis for continuing operations. In order to provide a meaningful basis for comparison, we are providing information with respect to our Adjusted EBITDA reconciled for all periods to net loss from continuing operations and cash flow provided by operating activities from continuing operations, which are believed to be the most directly comparable measures under GAAP. Adjusted EPS We use the non-GAAP measure of Adjusted EPS to enhance the usefulness of our financial information by providing a measure which management internally uses to assess and evaluate the overall performance and highlight trends in the ongoing business. Adjusted EPS excludes certain income and expense items that are not representative of our ongoing business and operations, which are included in the calculation of Diluted Earnings Per Share in accordance with GAAP. The following items are not all-inclusive, but are examples of reconciling items in prior comparative and future periods. They would include write-down of assets, the effect of derivative instruments not designated as hedging instruments, significant gains or losses from the disposition or restructuring of businesses, income and loss from discontinued operations, transaction-related costs, income and loss on the extinguishment of debt and other significant items that would not be representative of our ongoing business. In order to provide a meaningful basis for comparison, we are providing information with respect to our Adjusted EPS reconciled for all periods to diluted earnings per share from continuing operations, which is believed to be the most directly comparable measure under GAAP. Non-GAAP Financial Measures 36 |

| Non-GAAP Reconciliation: Adjusted EBITDA & Free Cash Flow Guidance as of 2/8/2012 Depreciation and amortization expense is significantly higher than maintenance capital expenditures due to (a) amortization expense associated with intangible assets recognized in connection with business combinations; (b) the net step-up in our fixed asset book basis recognized in connection with business combinations; and (c) facility construction expenditures related to long-lived assets (40-50 year useful lives) incurred during initial construction, which will not have recurring maintenance capital expenditures on annual basis related to these assets. Cash taxes are significantly lower than income tax expense due to the utilization of our net operating loss carryforwards (NOLs). This amount represents a true-up between (a) revenue recognized in the period for client payments of project debt principal under service fee contract structures, which is accounted for on a straight-line basis over the term of the project debt, and (b) actual billings to clients for debt principal payments in the period. As a result of this adjustment, Adjusted EBITDA reflects the actual amounts billed to clients for debt service principal, not the straight-lined revenue as recognized. Other is primarily non-cash compensation expense, but does include other non-cash expenses. The calculation of Adjusted EBITDA is based on the definitions in the credit facilities of our most significant subsidiary, Covanta Energy, through which we conduct our core waste and energy services business. 37 |
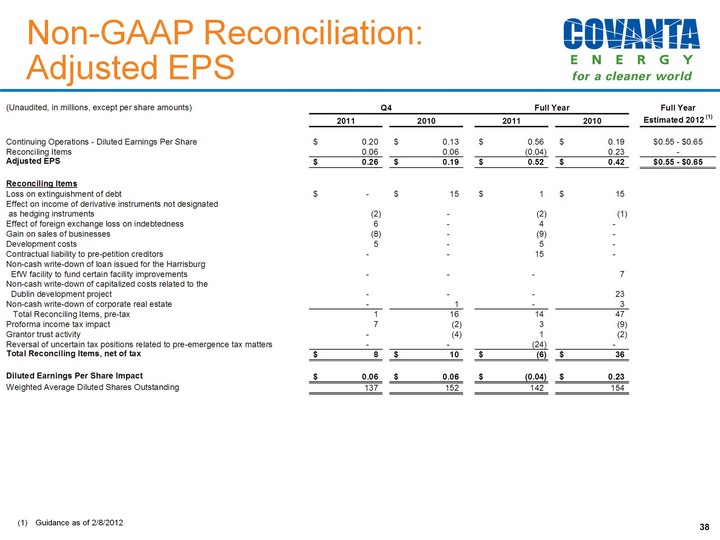
| 38 Guidance as of 2/8/2012 Non-GAAP Reconciliation: Adjusted EPS |

| Supporting Reconciliations 39 |