Attached files
| file | filename |
|---|---|
| 8-K - FORM 8-K - Bristow Group Inc | d296764d8k.htm |
 Credit Suisse Energy Summit
February 6-10, 2012
Bristow Group Inc.
February 8, 2012
Exhibit 99.1 |
 2
Forward-looking statements
This
presentation
may
contain
“forward-looking
statements”
within
the
meaning
of
the
Private
Securities
Litigation Reform Act of 1995. Forward-looking statements include statements
about our future business, operations, capital expenditures, fleet
composition, capabilities and results; modeling information, earnings
guidance, expected operating margins and other financial projections; future
dividends, share repurchase and other uses of excess cash; plans, strategies and
objectives of our management, including our plans and strategies to grow
earnings and our business, our general strategy going forward and our
business model; expected actions by us and by third parties, including our
customers, competitors and regulators; the valuation of our company and its valuation relative to
relevant financial indices; assumptions underlying or relating to any of the
foregoing, including assumptions regarding factors impacting our business,
financial results and industry; and other matters. Our
forward-looking
statements
reflect
our
views
and
assumptions
on
the
date
of
this
presentation
regarding future events and operating performance. They involve known and unknown
risks, uncertainties
and
other
factors,
many
of
which
may
be
beyond
our
control,
that
may
cause
actual
results to differ materially from any future results, performance or achievements
expressed or implied by the
forward-looking
statements.
These
risks,
uncertainties
and
other
factors
include
those
discussed
under the captions “Risk Factors”
and “Management’s Discussion and Analysis of Financial Condition
and
Results
of
Operations”
in
our
Annual
Report
on
Form
10-K
for
the
fiscal
year
ended
March
31,
2011
and our Quarterly Report on Form 10-Q for the quarter ended December 31,
2011. We do not undertake any obligation, other than as required by
law, to update or revise any forward-looking statements, whether as a
result of new information, future events or otherwise. |
 3
Bristow is the leading provider of helicopter
transportation services to the global offshore industry
•
~20 countries
•
550 aircraft
•
~3,400 employees
•
Ticker: BRS
•
Stock price
*
: $48.63
•
Market cap
*
: ~$1.8 billion
•
Secured: BBB-/Ba1 (stable outlook)
•
Corporate: BB/Ba2 (stable outlook)
$67
* Based on 36.8 million fully diluted weighted average shares outstanding as
of 12/31/2011 and stock price as of 01/27/2012. Bristow flies crews and light
cargo to production platforms, vessels and rigs 3
|
 •
#1 or #2 market position in the major oil and gas provinces: North Sea,
GoM, Australia, West Africa and Brazil
•
Industry-leading safety performance—the key customer requirement
•
New-technology fleet of medium and large helicopters meets the needs
of fast growing and high margin deepwater segment
•
Financial strength and cash flow generation
•
Leadership among peers
•
Continuous management focus on improved safety and capital
allocation performance
Strategically positioned for global growth
4 |
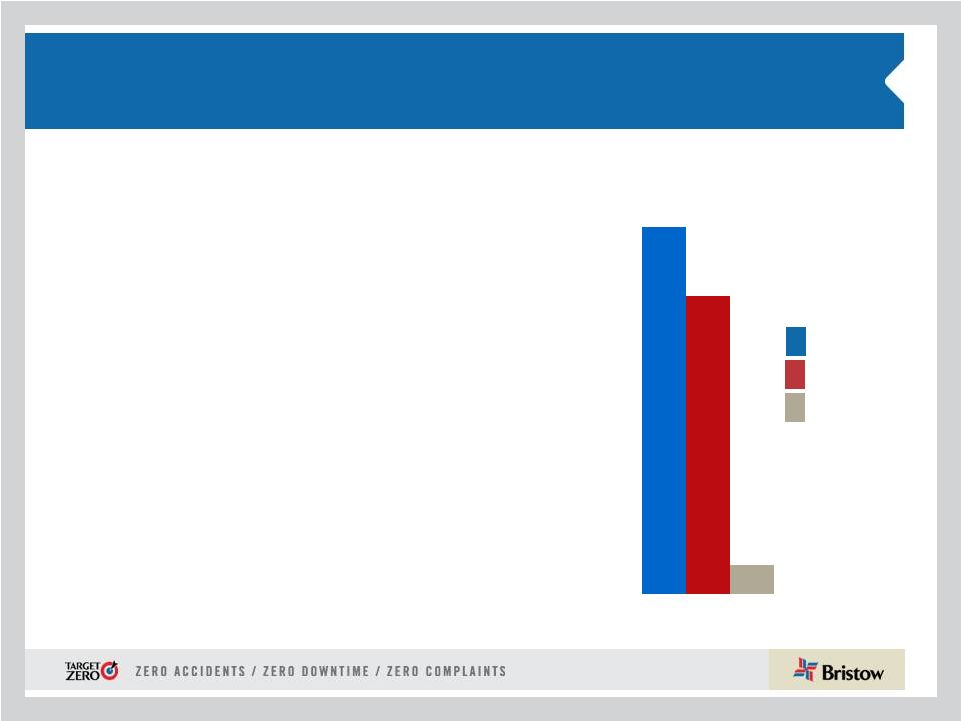 5
2.79
2.27
0.58
Industry leading safety record creates marketing
and cost advantage
•
Safety is our primary core value
•
Bristow’s ‘Target Zero’
program is now the
leading example emulated industry-wide
•
Bristow
accident
rate
is
less
than
one
fifth
the average rates for the oil and gas
industry and all civil helicopters
•
Safety Performance accounts for 25% of
management incentive compensation
* Averages for most recently available three-year period: Helicopter
Association International 2007-2009, International Oil & Gas Producers 2005-2007, Bristow Group, 2009-
2011, excluding Bristow Academy
3-year average air
accident rates
*
per 100K flight hours
Bristow
Oil & Gas industry
All civil helicopters
5 |
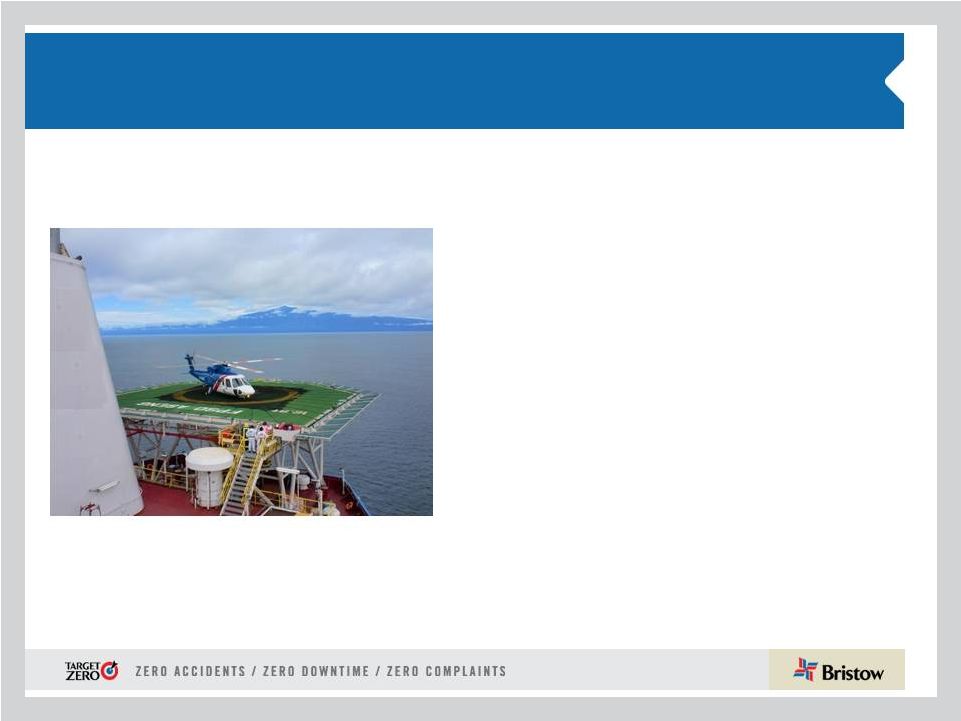
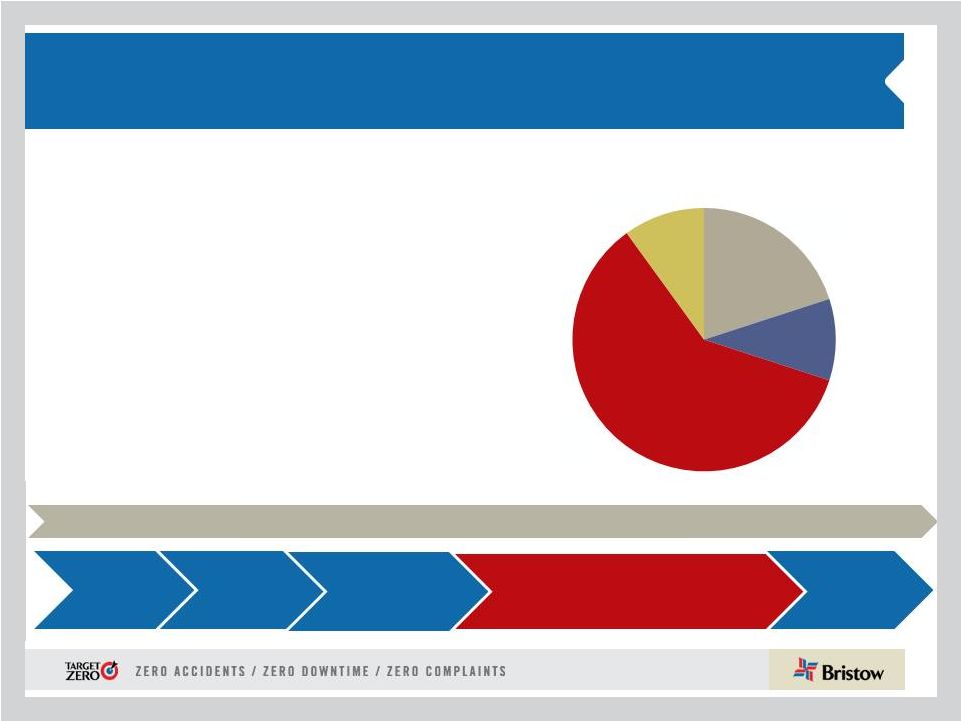 Bristow services are utilized in every phase of
offshore oil and gas activity
•
Largest share of revenues (>60%) relates to
oil and gas production, ensuring stability and
growth
•
There are ~ 8,000 offshore production
installations worldwide—compared with >600
exploratory drilling rigs
•
~ 1,700 helicopters servicing oil and gas
industry of which Bristow’s fleet is
approximately one third
•
Bristow revenues primarily driven by
operating expenditures
Typical revenues by segment
6
Production
60%
Development
10%
20%
Exploration
Other 10%
EXPLORATION
SEISMIC
DEVELOPMENT
ABANDONMENT
PRODUCTION
H e l i c o p t e r t r a n s p o r t a t i o
n s e r v i c e s |
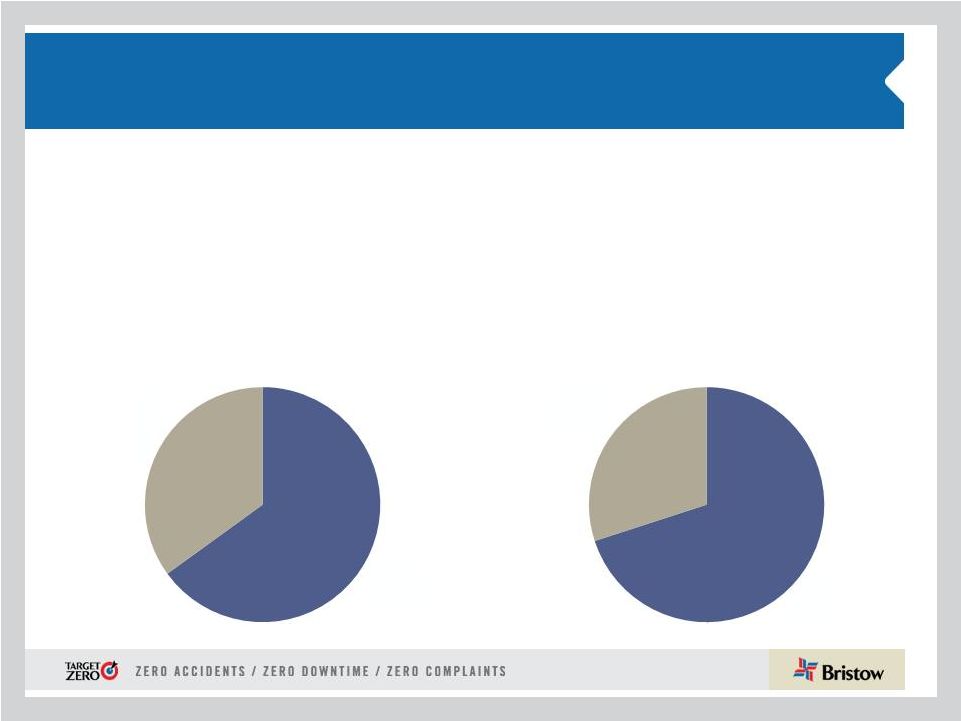 Bristow’s contract and operations structure results in a
more predictable income with significant operating
leverage
Revenue sources
•
Our run-rate capex is low as we expense almost all of our
overhaul and maintenance
•
Bristow contracts earn 65% of revenue without flying in most market
•
Two tiered contract structure includes both:
–
Fixed or monthly standing charge to reserve helicopter capacity
–
Variable fees based on hours flown
Operating income
7
Variable
hourly
35%
Fixed
monthly
65%
Fixed
monthly
70%
Variable
hourly
30% |
 Europe (EBU) Outlook:
Growth is surprisingly resilient
Business Strategy and Overview:
•
EBU is our largest BU with significant growth opportunities to both diversify
and increase market share
•
Annual Revenue ~ $550 million
•
# of LACE*: 46 (42 Heavy, 15 Medium)
•
LACE Rate* (annualized): $9.6 million
•
Market Share: circa 35%
Outlook:
•
Positive, but we must remain cost effective
•
New incremental work contracted
•
Fleet transitioning to all new generation aircraft
•
Market share gains and new tender activity
UK Gap SAR bid
Norway
West of Shetlands
•
SAR-H longer term opportunity
•
Wind farms diversification
FY12 operating margin expected to be ~ low twenties
Long-term operating margins should remain in the low twenties
* LACE and LACE Rate are calculated as of December 31, 2011
8 |
 West
Africa (WASBU) Outlook: Increased offshore deepwater development and
competition and competition
Business Strategy and Overview:
•
WASBU strategy is to maintain the proven and consistent premier brand
•
Annual Revenue: circa $250 million
•
# of LACE*: 22 (mostly medium/small aircraft)
•
LACE Rate* (annualized): circa $11.2 million
•
Market Share: circa 60%
Outlook:
•
Competition re-emerging in the medium term
•
Introduction of large new technology aircraft to market with increased activity
planned •
Deep-water opportunities -
greater barriers of entry
•
Twelve month renewal of key contract
•
Bids from major clients
•
Restructuring continues
FY12 operating margin expected to be low to mid twenties
Long-term operating margins should remain in the low to mid twenties
* LACE and LACE Rate are calculated as of December 31, 2011
9 |
 Australia (AUSBU) Outlook: Mid and Long term outlook
is positive; Expansion delayed
Business Strategy and Overview:
•
AUSBU strategy entails a focus on the organic growth and the Client Promise
•
# of LACE*: 20
•
Annual Revenue: circa $160 million
•
LACE Rate* (annualized): circa $7.0 million
•
Market Share: circa 65%
Outlook:
•
Some work delayed until second half FY12; expecting strong activity in Q4
•
Total market size is increasing as new projects come on line, driven by demand
for gas for Asian markets
•
Additional new technology work confirmed with key operators
FY12 operating margin expected to be mid teens
Long-term operating margins should remain in high teens
* LACE and LACE Rate are calculated as of December 31, 2011
10 |
 Other International (OIBU) Outlook:
Emerging growth
Business Strategy and Overview:
•
OIBU strategy is to develop new markets through geographic R&D and
partnerships
•
Annual Revenue: circa $141 million
•
# of LACE*: 38
•
LACE Rate* (annualized): $3.8 million
•
Multiple countries and joint ventures
Outlook:
•
Work in Equatorial Guinea, Bangladesh, as well as increased rates in Trinidad, set
to positively impact second half of FY12
•
Expansion of medium and large work with Lider in Brazil
•
Ongoing dry lease business with Heliservicio, Mexico and MHS, Malaysia
FY12 operating margin expected to be low twenties
Long-term operating margins should remain in the low to mid twenties
* LACE and LACE Rate are calculated as of December 31, 2011
11 |
 North America (NABU) Outlook:
Slow but steady improvement
Business Strategy and Overview:
•
NABU strategy is to focus on key contracts
•
Annual Revenue: circa $180-200 million
•
# of LACE*: 30
•
LACE Rate* (annualized): $5.9 million
•
Market Share: 28%
Outlook:
•
FY12 GoM and Alaska drilling permits continue to be issued but at a slow
rate with large aircraft demand slowly increasing
•
Well positioned to benefit from accelerated return of activity
•
Two new S-92s arrived for multi-year contracted work
•
Expect more exploration and development drilling to accelerate in FY13 with
large contracts coming up for renewal
FY12 operating margin expected to be singles digits
* LACE and LACE Rate are calculated as of December 31, 2011
12
Long-term operating margins should increase to low - mid teens |
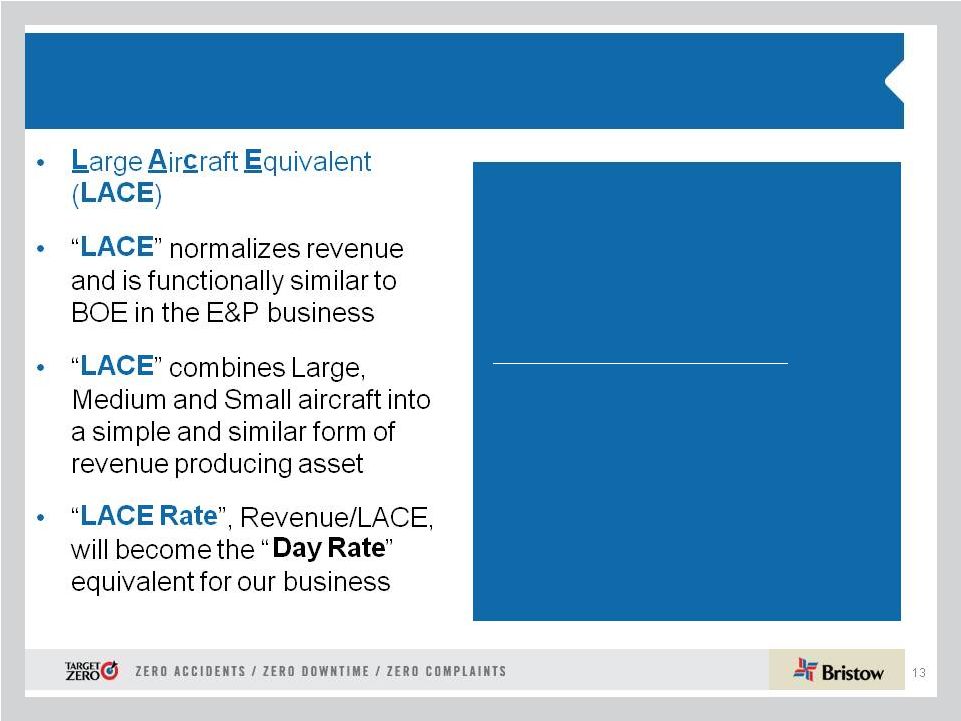 13
Translating these opportunities into revenue growth:
Introduction to LACE and the LACE Rate
LACE Math
100%
per # of Large Aircraft
+50%
per # of Medium Aircraft
+25%
per # of Small Aircraft
=
Total # of LACE Aircraft
x
LACE Rate (Revenue/LACE)
=
Revenue |
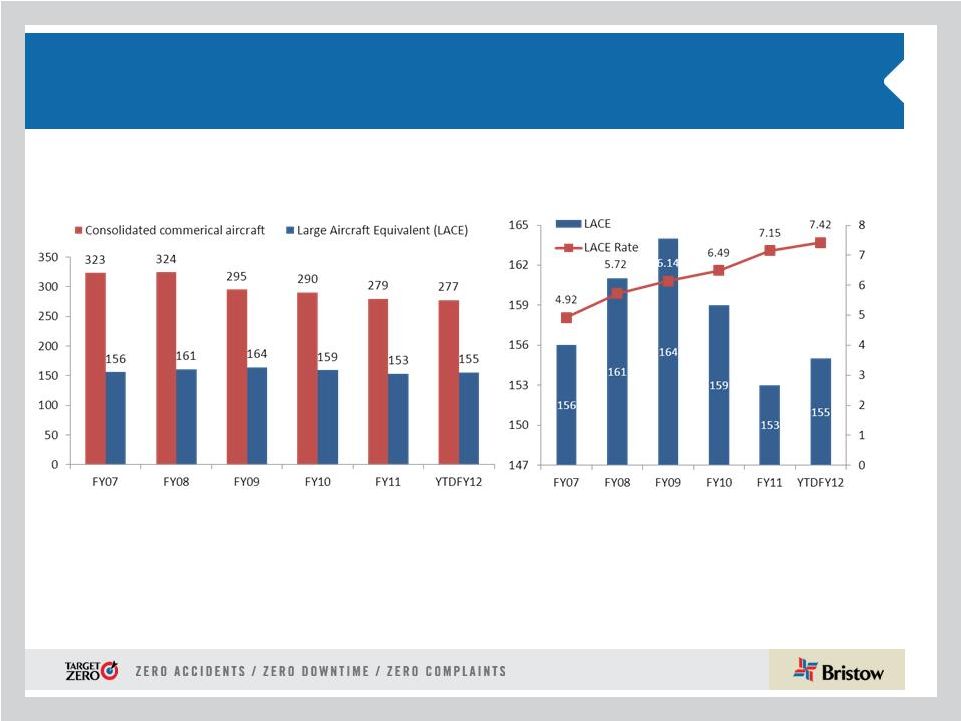 Translating these opportunities into revenue growth:
LACE and LACE Rate trends
LACE
and
LACE
Rate
excludes
Bristow
Academy,
affiliate
aircraft,
aircraft
held
for
sale,
aircraft
construction
in
progress,
and
reimbursable
revenue;
see
appendix
for
LACE
calculation
14 |
 What
clients are saying? •
Newer assets will be required
•
Pursuing highest operational standard and will require that of contractors
•
Higher levels of inspection required to award contracts
•
Certification of training and personnel competency needed
•
Bids will call for higher specs than needed to perform the actual job
•
“Every bid now seems to need partner approvals”
Our clients have sharply increased their focus on risk
related to contractor capabilities, personnel and equipment
These requirements favor Bristow’s business model because of its
financial strength and demonstrated premier service
15 |
 Bristow’s Client Promise is in response to this client focus:
Creating value through differentiation
Target Zero accidents, downtime and complaints
programs deliver value to operators.
More zero-accident flight hours than anyone,
more uptime than anyone,
and hassle-free service
creates confidence in flight. Worldwide.
Lowers client’s offshore operating costs
and improves productivity.
Earns us more business
to improve BVA.
16 |
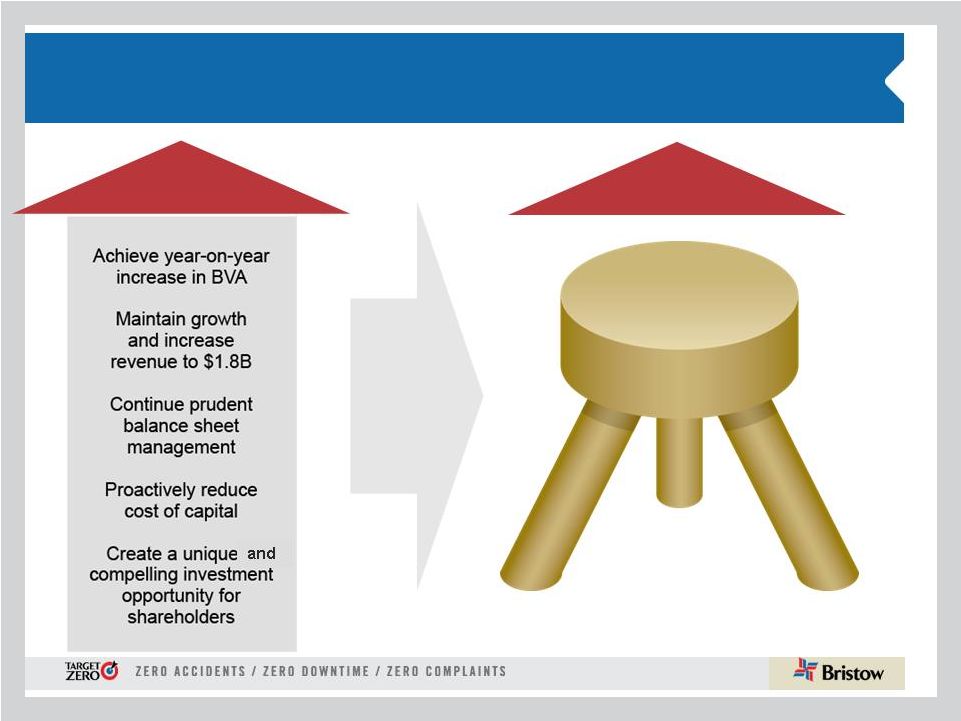 Bristow’s new unique investment thesis and
commitment to our shareholders for the next 5 years
17
Internal Strategy
Temple:
FY 2012 -
2016
Prudent
Balance Sheet
Management
Growth
Capital Return
External
Commitment:
FY 2012 -
2016
Our New Balanced
and Unique
Investment Thesis |
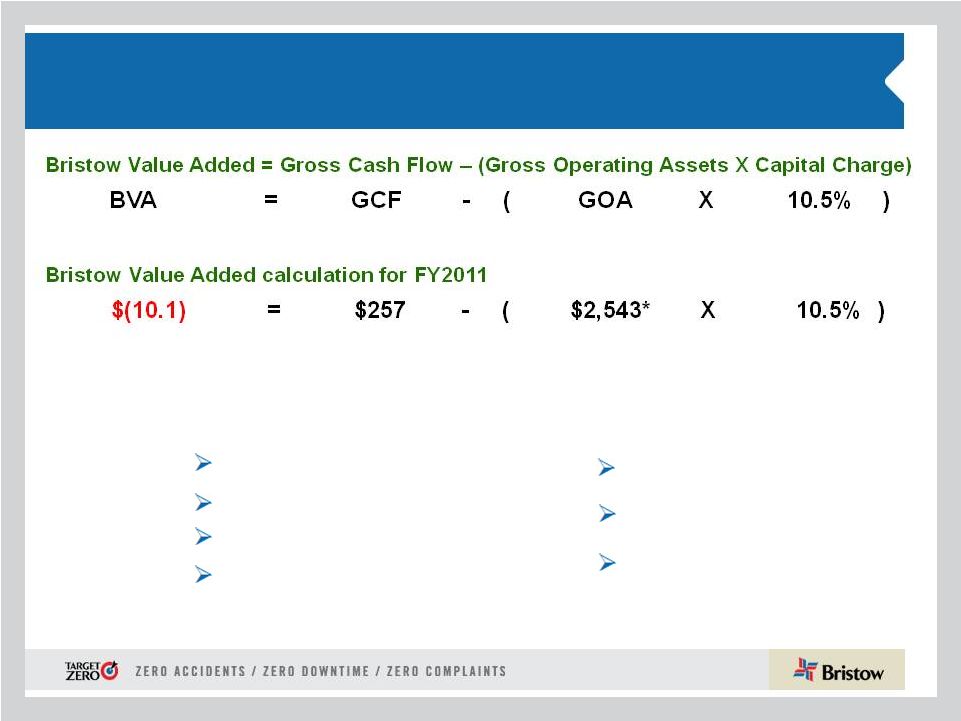 Understanding Bristow Value Added (BVA):
Treat capital like any other cost
•
BVA is the key measure to define financial success
•
BVA is robust enough to captures all trade-offs:
Revenue
After Tax Margins
Asset Intensity
Reinvestment Rate
Differentiation
Sustainability
Risk
* Represents the average gross operating assets for FY2011
18 |
 Operating
lease
strategy
–
opportunistically
entering market
19
•
Aircraft leasing market is very attractive to Bristow, offering lower rates and
better terms than previously anticipated
•
Our
initial
goal
is
to
utilize
this
financing
strategy
for
up
to
20-30
percent
of
our
LACE aircraft over the next few years
•
In December 2011 we entered into four operating lease transactions for new
technology large aircraft. We expect to execute similar transactions within the
next twelve months as the market continues to be strong
•
Financial
statement
impact:
rent
expense
is
part
of
direct
cost;
operating
leases
will increase cash flow from investing activity and decrease capital
expenditures •
Going forward, adjusted EBITDAR is a more relevant metric of operational
performance
compared
to
adjusted
EBITDA
as
we
increase
our
lease
portfolio |
 Understanding prudent balance sheet management:
How we get there
•
Minimum total liquidity of $200M
•
Quarterly dividend growth of 10-15% per annum
•
Excess cash may be distributed to shareholders with
specifics approved by Board of Directors
•
Balance use of operating cash flow + a/c sales with leases
for a/c purchases and other capex
•
Leases used for initially no more than 20-30% of total
Bristow LACE
•
Adjusted Debt/Capital Ratio less than 45%
20
Capex vs
Leases
Capital
Structure
Liquidity
Capital Return |
 Financial highlights:
Revised FY12 guidance
•
EPS guidance range $2.90 -
$3.10, excluding aircraft sales and special items
•
Depreciation and amortization expense ~ $90 –
$95 million
•
SG & A expense ~ $130 -
$135 million
•
Interest expense ~ $35 -
$40 million
•
Tax ~ 20% -
24 % (assuming revenue earned in same regions and same mix)
•
LACE* (Large Aircraft Equivalent) = 157
•
Revenue/LACE Rate* ~ $7.40 -
$7.50 million per LACE aircraft per year
* Excludes Bristow Academy, aircraft held for sale, CIP, and reimbursable
revenue. 21 |
 Understanding Bristow’s unique,
balanced investment
thesis The
“Growth
Price
Signal”
is
provided
by the commercial markets and outlook
for ANNUAL EPS Growth
Cash
Flow
Yield
2
=
OCF + A/C sales –
Depreciation
Market Capitalization
FY07 –
FY11 EPS
1
Growth
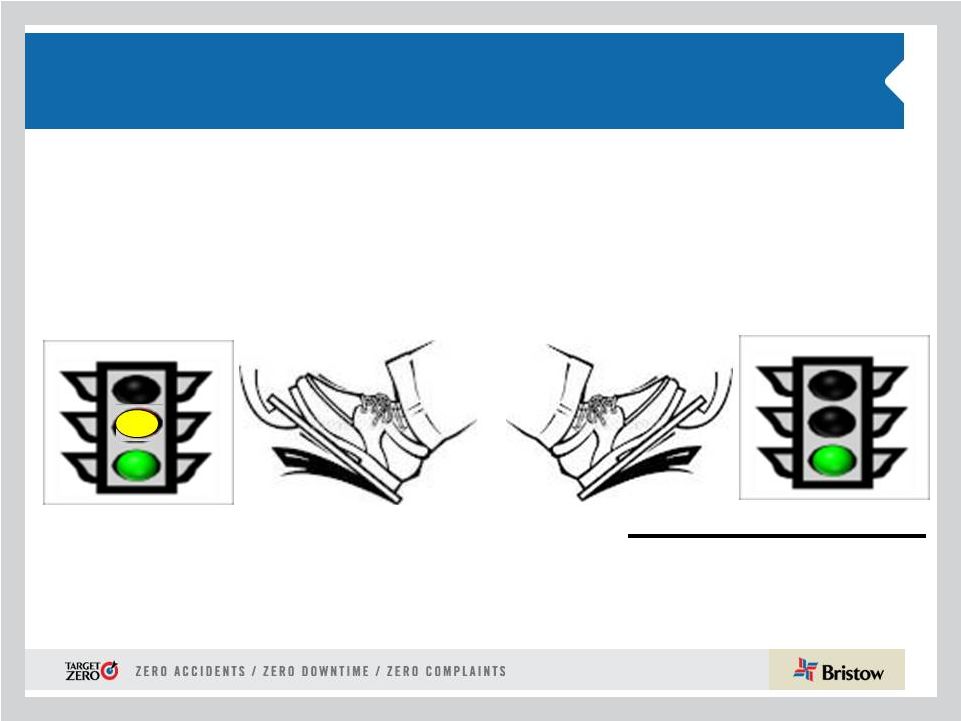
We will aim to provide a balanced return, but some
years we will “hit the gas”
depending on price signals
The
“Capital
Return
Price
Signal”
is
provided by the financial markets and
our current free cash flow yield
Today this equals 9.2%
2.9 %
=
1)
For the nine months ended December 31
2)
Trailing twelve months
22 |
 Putting it all together for FY12-16:
Over $700 million available for further growth and capital
return
23
735
Operating
leases
Operating
leases
116
1,378
103
1,121
238
497
FY11 balance
Operating cash flow
Asset sales
Aircraft purchases
Other capex
Maintain optimal
capital structure
Available for
dividend/growth/other
capital return
735 |
 Today’s Key Takeaways
Premier service provider with excellent secular expansion opportunities
Growth to be executed with care and discipline
Expand margins and revenue growth
Deepen
client
relationships
with
premium
market
share
with
the
premium clients
Push capital efficiency and revenue per asset
Proactive reduction of our capital charge
Bristow maintains its commitment to prudent balance sheet management
Bristow intends to grow the dividend
Bristow will demonstrate a balanced return for our investors by using
market price signals to grow or harvest our businesses
24
BVA creates a
capital
allocation
discipline
Unique
investment in
oilfield services
Target Zero will
remain a top
priority
Client Promise
ensures
differentiation |
 Bristow Group Inc. (NYSE: BRS)
2103 City West Blvd., 4th Floor
Houston, Texas 77042
t
713.267.7600
f
713.267.7620
bristowgroup.com/investorrelations
Contact Us
25 |
 26
Appendix
Appendix |
 27
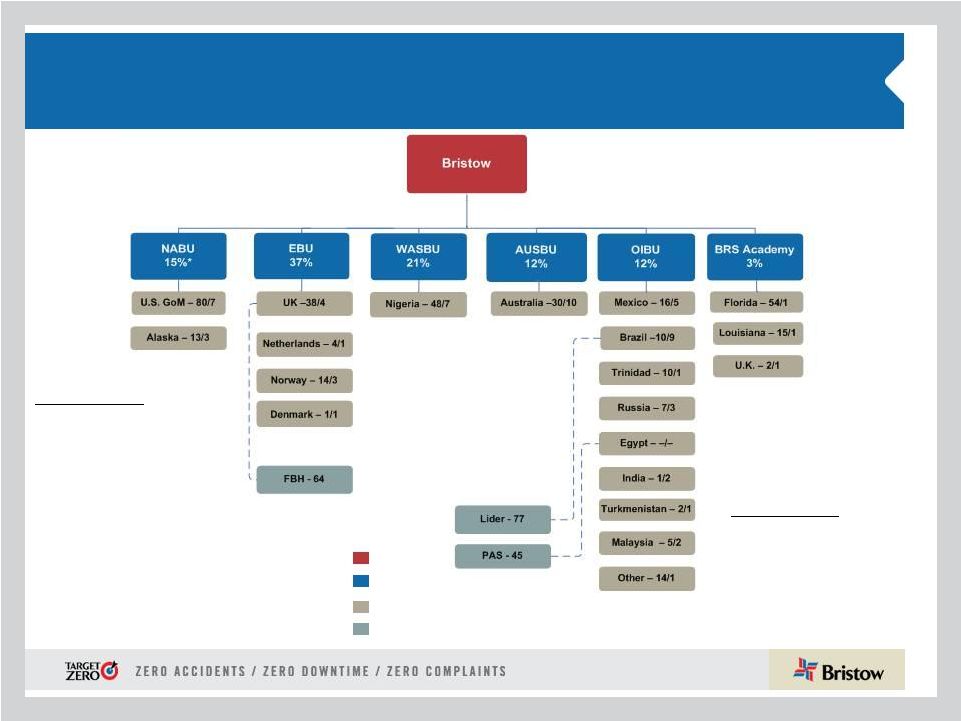
Organizational Chart -
as of December 31, 2011
Operated Aircraft
Bristow owns and/or operates 364
aircraft as of December 31, 2011
Affiliated Aircraft
Bristow affiliates and joint
ventures operate 186 aircraft
as of December 31, 2011
Business
Unit
(*
%
of
YTD
FY12
Operating
Revenue)
Corporate
Region
( # of Aircraft / # of Locations)
Joint Venture
(No.
of
aircraft)
Key |
 28
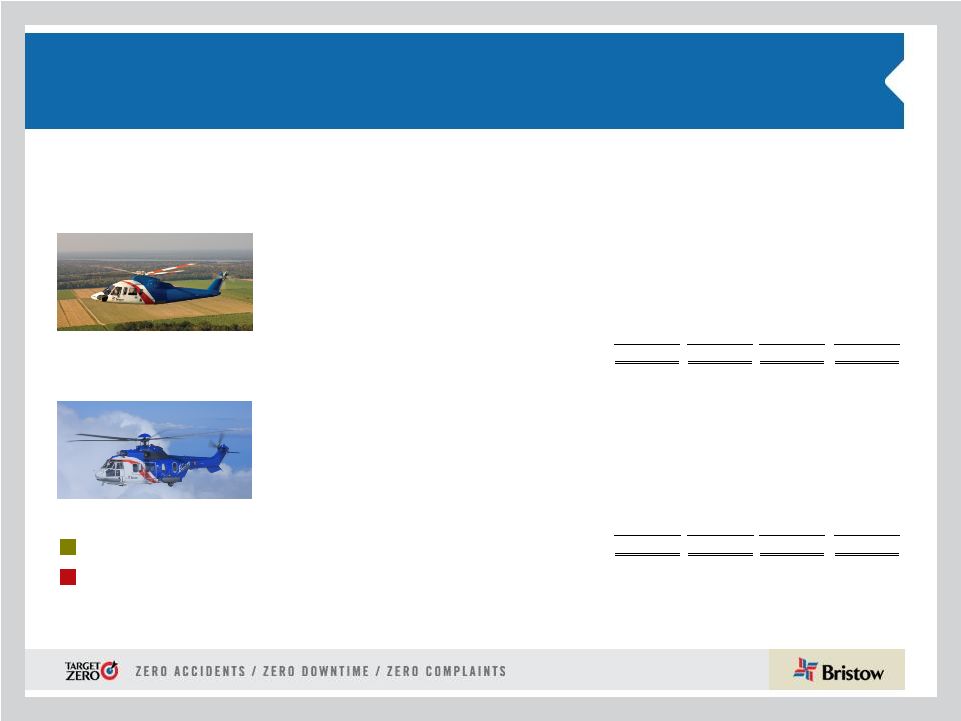
Aircraft Fleet –
Medium and Large
As of December 31, 2011
Next Generation Aircraft
Medium capacity 12-16 passengers
Large capacity 18-25 passengers
Mature Aircraft Models
Aircraft
Type
No. of PAX
Engine
Consl
Unconsl
Total
Ordered
Large Helicopters
AS332L Super Puma
18
Twin Turbine
30
-
30
-
AW189
16
Twin Turbine
-
-
-
6
EC225
25
Twin Turbine
18
-
18
-
Mil MI 8
20
Twin Turbine
7
-
7
-
Sikorsky S-61
18
Twin Turbine
2
-
2
-
Sikorsky S-92
19
Twin Turbine
28
2
30
10
85
2
87
16
LACE
79
Medium Helicopters
AW139
12
Twin Turbine
7
2
9
-
Bell 212
12
Twin Turbine
2
14
16
-
Bell 412
13
Twin Turbine
35
20
55
-
EC155
13
Twin Turbine
3
-
3
-
Sikorsky S-76A/A++
12
Twin Turbine
17
6
23
-
Sikorsky S-76C/C++
12
Twin Turbine
54
28
82
-
118
70
188
-
LACE
55 |
 29
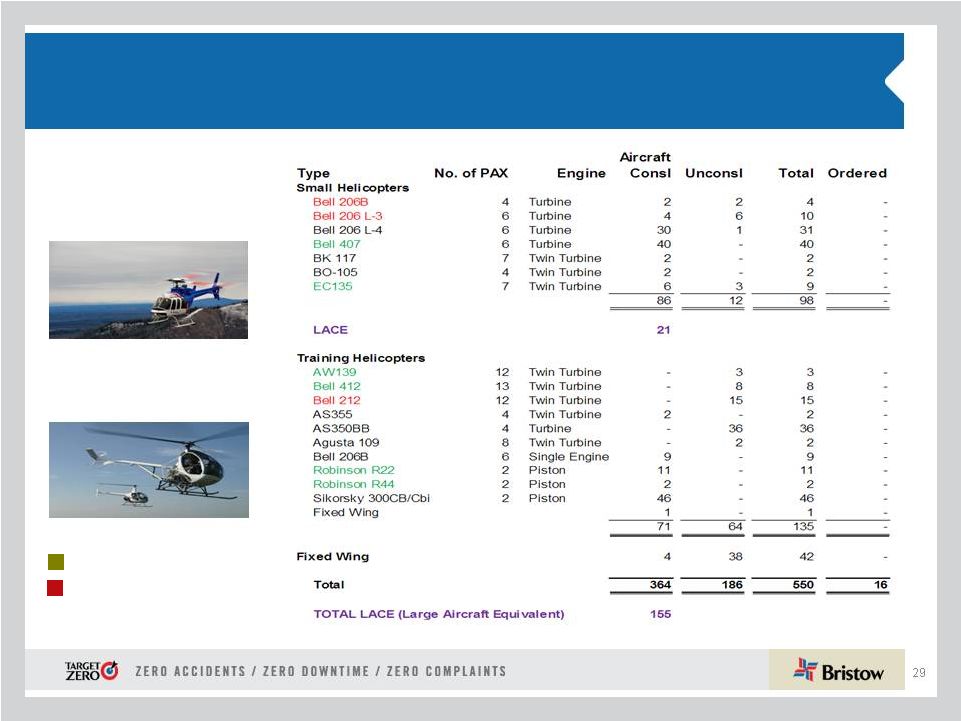
Aircraft Fleet –
Small, Training and Fixed
As of December 31, 2011 (continued)
Next Generation Aircraft
Mature Aircraft Models
Small capacity 4-7 passengers
Training capacity 2-6 passengers
•LACE does not include held for sale, training and fixed wing
helicopters |
 30
Consolidated Fleet Changes and Aircraft Sales for
Q3 FY12
EBU
WASBU
AUSBU
OIBU
NABU
Total
Large
3
-
3
-
-
6
Medium
2
1
1
3
1
8
Small
-
2
-
-
-
2
Total
5
3
4
3
1
16
Aircraft held for sale by BU
*
Amounts
stated
in
thousands;
In
Q3
FY12
two
aircraft
were
sold
for
$47.9 million and entered into lease back agreements and two aircraft
interest previously included in CIP were sold for $23.4 million.
Q 1 FY12
Q 2 FY12
Q 3 FY12
YTD
Fleet Count Beginning Period
373
372
366
373
Delivered
EC225
2
1
3
S-92
2
3
5
Citation XLS
1
1
Total Delivered
2
3
4
9
Removed
Sales
(3)
(5)
(7)
(15)
Other*
(4)
1
(3)
Total Removed
(3)
(9)
(6)
(18)
372
366
364
364
* Includes destroyed aircraft, lease returns and commencements
Fleet changes
EBU
WASBU
AUSBU
OIBU
NABU
BA
Total
Large
3
-
-
-
2
-
5
Medium
-
-
-
-
9
-
9
Small
-
-
2
-
1
-
3
Fixed
-
1
-
-
-
-
1
Training
-
-
-
-
-
23
23
Total
3
1
2
-
12
23
41
Leased aircraft in consolidated fleet
# of A/C Sold
Cash
Received*
Q1 FY12
3
2,478
Q2 FY12
5
10,674
Q3 FY12
9
81,248
Totals
17
94,400
|
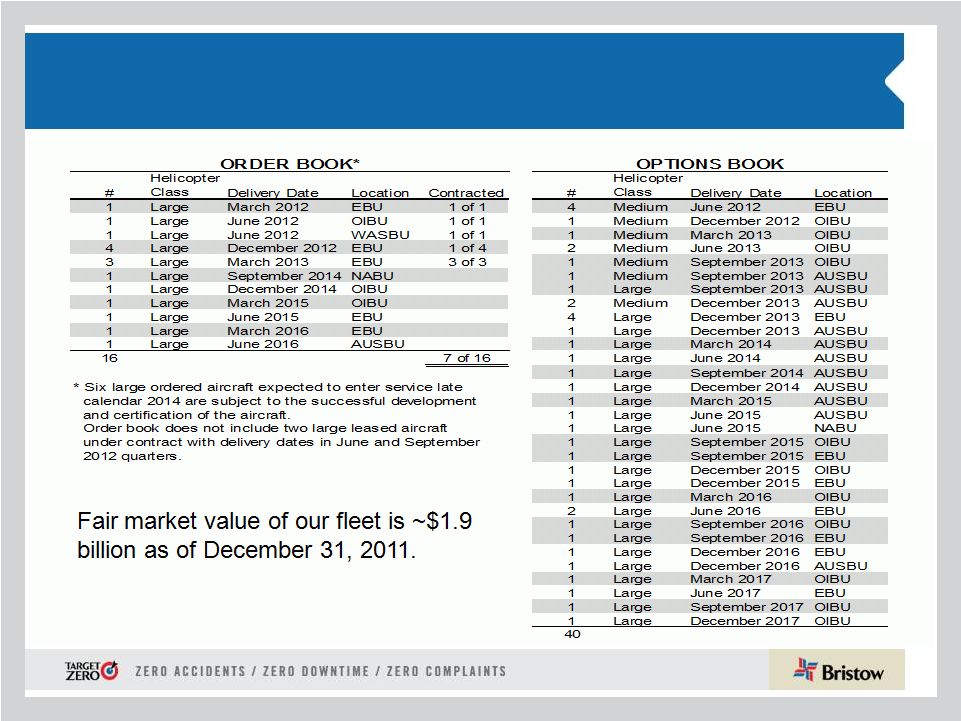 Order and options book as of December 31, 2011
31 |
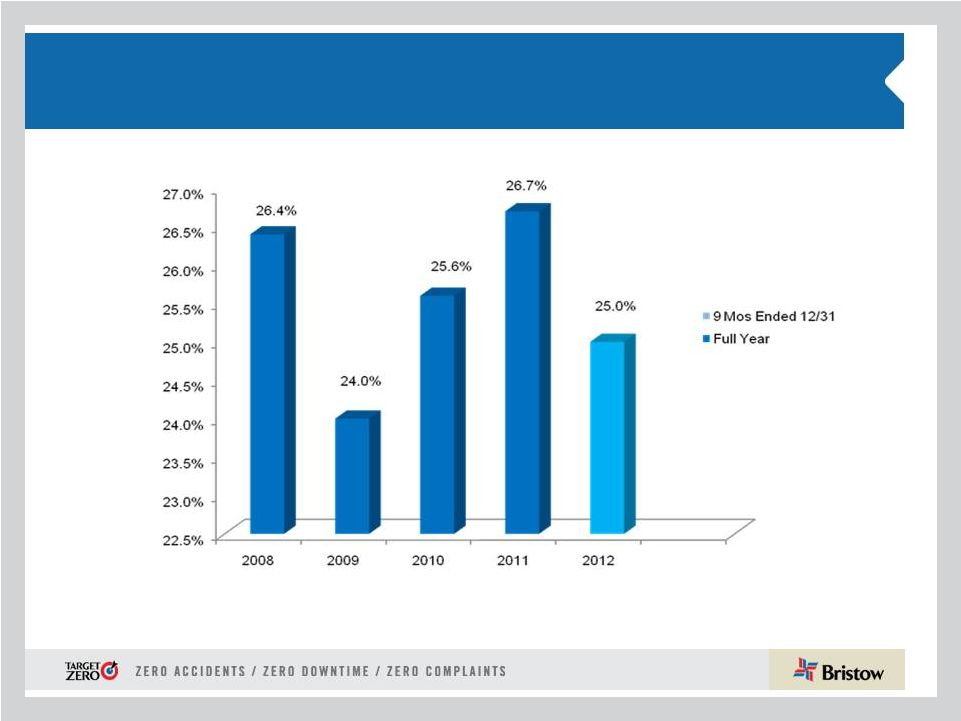 Adjusted EBITDAR margin trend
1) Calculated by taking adjusted EBITDAR divided by operating revenue
2) Adjusted EBITDAR excludes special items and asset dispositions
32 |
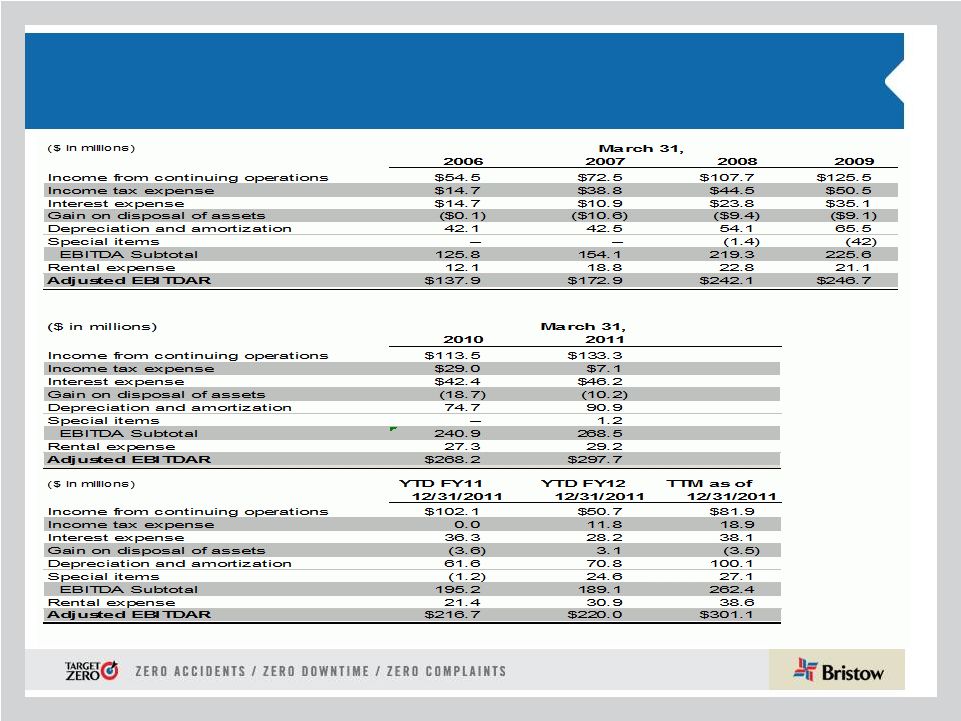 Adjusted EBITDAR reconciliation
33 |
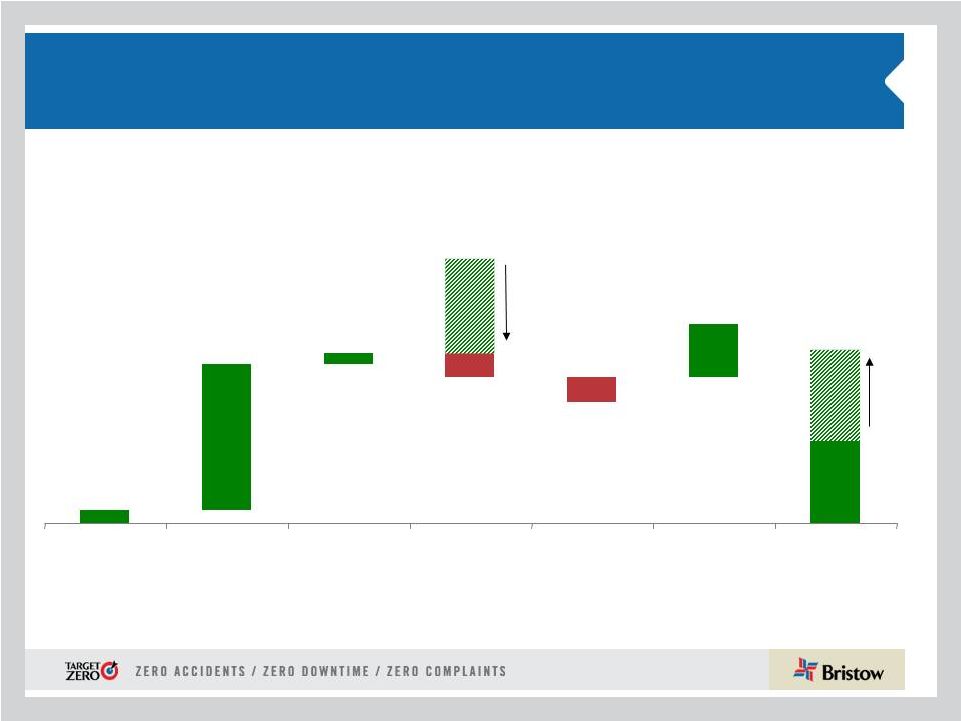
 Operating margin trend
Bristow Group
Operating Margin Trend
Actual
2008
2009
2010
2011
2012
As Reported
Full Year
Full Year
Q1
Q2
Q3
Q4
FY
Q1
Q2
Q3
Q4
FY
Q1
Q2
Q3
EBU
23.6%
19.3%
17.2%
16.7%
16.1%
18.1%
17.0%
18.0%
18.4%
19.6%
18.8%
18.8%
17.3%
16.8%
15.5%
WASBU
17.9%
21.5%
24.9%
29.3%
25.4%
34.7%
28.5%
26.5%
29.5%
29.8%
24.0%
27.4%
20.6%
25.2%
25.9%
NABU
14.5%
12.1%
8.9%
9.7%
3.3%
2.2%
6.1%
10.1%
16.1%
4.2%
-4.0%
7.5%
3.6%
5.3%
4.3%
AUSBU
17.2%
5.9%
20.1%
23.1%
24.5%
24.5%
23.2%
22.5%
16.3%
17.2%
17.4%
18.2%
10.0%
1.7%
8.7%
OIBU
17.3%
27.0%
21.8%
35.1%
15.5%
1.8%
19.2%
6.9%
30.6%
27.7%
45.8%
28.4%
33.6%
5.8%
32.6%
Consolidated
16.0%
17.8%
15.4%
18.4%
13.1%
15.2%
15.5%
13.6%
17.1%
14.7%
16.1%
15.4%
11.3%
2.9%
13.1%
New methodology (operating income/operating revenue)
2008
2009
2010
2011
2012
Revised *
Full Year
Full Year
Q1
Q2
Q3
Q4
FY
Q1
Q2
Q3
Q4
FY
Q1
Q2
Q3
EBU
29.2%
24.3%
20.9%
20.5%
19.8%
22.4%
20.8%
21.4%
22.1%
25.4%
23.6%
23.6%
21.5%
20.7%
19.5%
WASBU
19.4%
22.8%
26.8%
30.0%
27.3%
35.7%
29.9%
27.1%
30.5%
30.4%
26.1%
28.6%
21.5%
26.4%
27.1%
NABU
14.5%
12.2%
8.9%
9.7%
3.3%
2.2%
6.2%
10.2%
16.4%
4.2%
-4.0%
7.6%
3.6%
11.0%
4.3%
AUSBU
17.9%
6.3%
21.0%
24.5%
25.5%
25.6%
24.3%
23.6%
17.8%
18.8%
19.1%
19.8%
11.1%
1.9%
9.4%
OIBU
17.4%
27.3%
21.9%
35.9%
15.3%
1.9%
19.4%
6.9%
30.9%
28.2%
47.1%
28.8%
34.5%
5.9%
33.5%
Consolidated **
16.4%
14.7%
15.9%
17.4%
14.2%
13.9%
15.3%
14.0%
18.0%
15.3%
18.3%
16.4%
12.2%
13.0%
15.6%
* -
All amounts revised to exclude reimbursable revenue from denominator.
** -
Revised to exclude aircraft sales from numerator.
34 |
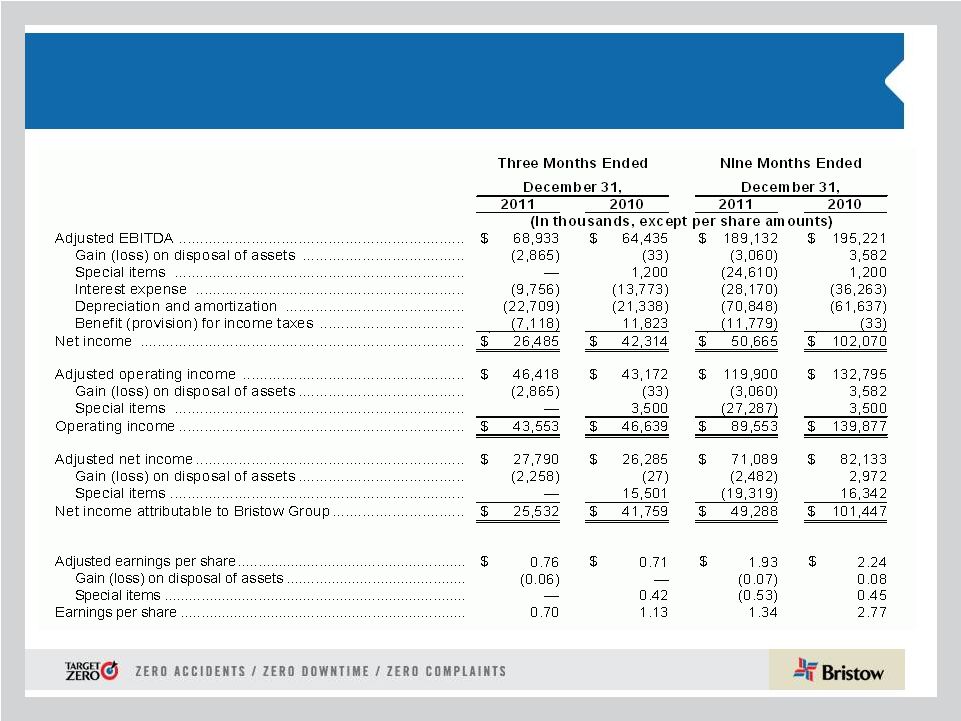 GAAP reconciliation
35 |
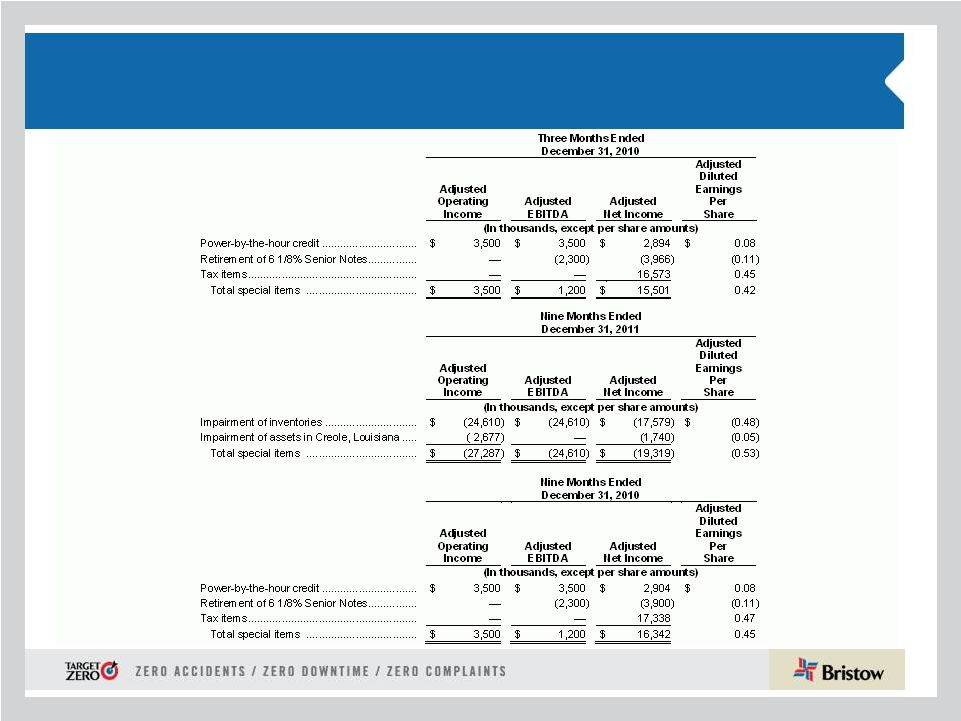 Special items reconciliation
36 |
 Leverage Reconciliation
*Adjusted EBITDAR exclude gains and losses on dispositions of assets
Debt
Investment
Capital
Leverage
(a)
(b)
(c) = (a) + (b)
(a) / (c)
(in millions)
As of December 31, 2011
$
832.8
$ 1,523.5
$ 2,356.3
35.3%
Adjust for:
Unfunded Pension Liability
97.2
97.2
NPV of Lease Obligations
165.0
165.0
Guarantees
15.5
15.5
Letters of credit
1.7
1.7
Adjusted
$
1,112.1
(d)
$ 1,523.5
$ 2,635.6
42.2%
Calculation of debt to adjusted EBITDAR multiple
Adjusted EBITDAR*:
FY 2012
$
301.1
(e)
Annualized
$
401.4
= (d) / (e)
3.69:1
37 |
 Bristow Group Inc. (NYSE: BRS)
2103
City
West
Blvd.,
4
Floor
Houston, Texas 77042
t
713.267.7600
f
713.267.7620
bristowgroup.com
Contact Us
38
th |