Attached files
| file | filename |
|---|---|
| 8-K - FORM 8-K - ManpowerGroup Inc. | form_8k.htm |
| EX-99.1 - PRESS RELEASE DATED FEBRUARY 1, 2012 - ManpowerGroup Inc. | exhibit_99-1.htm |
Exhibit 99.2

ManpowerGroup
4th Quarter
February 1, 2012

ManpowerGroup 2011 4th Quarter Results February 2012
Forward-Looking Statement
This presentation includes forward-looking statements,
including earnings projections which are subject to risks and
uncertainties. Actual results might differ materially from those
projected in the forward-looking statements. Additional
information concerning factors that could cause actual results
to materially differ from those in the forward-looking statements
is contained in the Manpower Inc. Annual Report on Form 10-K
dated December 31, 2010, which information is incorporated
herein by reference, and such other factors as may be
described from time to time in the Company’s SEC filings.

ManpowerGroup 2011 4th Quarter Results February 2012
|
As
Reported
|
Excluding Non
-recurring Items |
Q4 Financial Highlights
|
|
5%
|
5%
|
Revenue $5.5B
|
|
6% CC
|
6% CC
|
|
|
30 bps
|
30 bps
|
Gross Margin 17.1%
|
|
N/A
|
29%
|
Operating Profit $130M
|
|
N/A
|
29% CC
|
|
|
900 bps
|
50 bps
|
OP Margin 2.4%
|
|
N/A
|
48%
|
EPS $.78
|
|
N/A
|
48% CC
|
Throughout this presentation, the difference between reported variances and Constant Currency (CC) variances
represents the impact of currency on our financial results. Constant Currency is further explained on our Web site.
represents the impact of currency on our financial results. Constant Currency is further explained on our Web site.
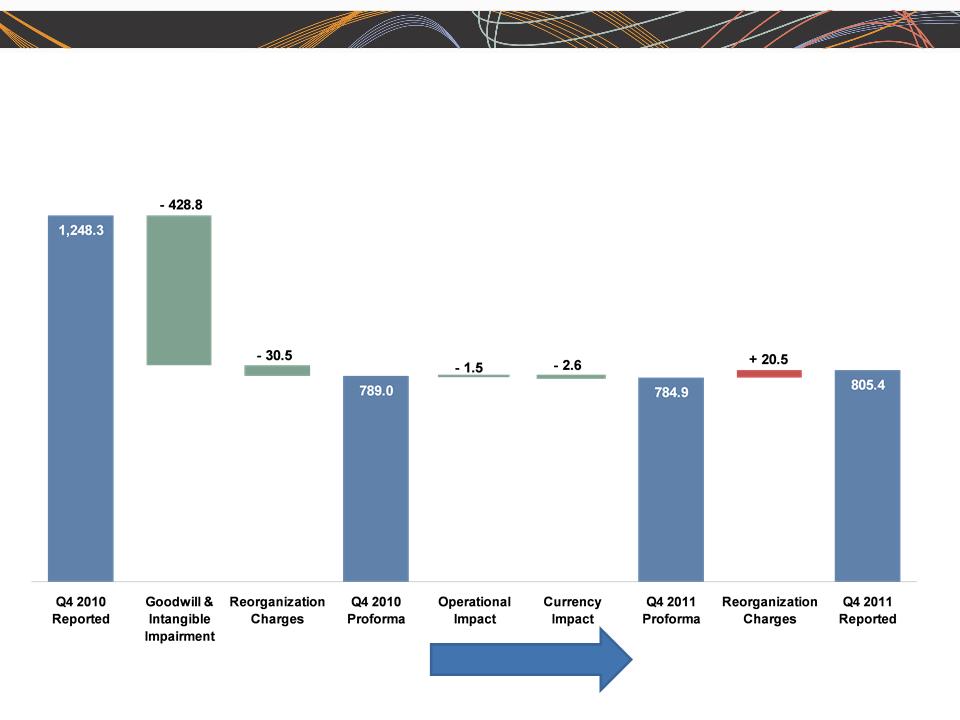
Consolidated Financial Highlights
3
(1) Excludes reorganization charges for 2011 and 2010, and goodwill and intangible asset impairment in 2010.
(1)

ManpowerGroup 2011 4th Quarter Results February 2012
Consolidated Gross Margin Change
4
ManpowerGroup 2011 4th Quarter Results February 2012
SG&A Expense Bridge - Q4 YOY
(in millions of USD)
(in millions of USD)
87.1%
83.9%
Productivity Gain
5
% of GP
% of GP

ManpowerGroup 2011 4th Quarter Results February 2012
Q4 Non-Recurring Items
($ in millions, except per share amounts)
6
(1) 2011 includes reorganization charges for the Americas ($2.4M), Northern Europe ($12.0M) and Right Management ($6.1M).
(2) 2010 includes reorganization charges for the Americas ($6.1M), Southern Europe ($7.6M) and Right Management ($16.8M).
(3) 2010 includes goodwill and intangible asset impairment charges for the Americas ($32.9M) and Right Management ($395.9M).
|
|
2011
|
2010
|
||||
|
|
Pre-tax
Earnings
|
Net
Earnings
|
EPS -
Diluted
|
Pre-tax
Earnings
|
Net
Earnings
|
EPS -
Diluted
|
|
Earnings, As Reported
|
$ 119.4
|
$ 63.6
|
$ 0.78
|
$ (352.6)
|
$ (350.4)
|
$ (4.29)
|
|
Reorganization Charge
|
20.5
|
16.3
|
0.20
|
30.5
|
20.6
|
0.25
|
|
Goodwill and Intangible
Asset impairment |
N/A
|
N/A
|
N/A
|
428.8
|
384.3
|
4.70
|
|
Earnings, Excluding non-
recurring items |
$ 139.9
|
$ 79.9
|
$ 0.98
|
$ 106.7
|
$ 54.5
|
$ 0.66
|
(1)(2)
(3)

ManpowerGroup 2011 4th Quarter Results February 2012
7
Growth
Business Line Gross Profit - Q4 2011
█ Manpower █ Experis █ ManpowerGroup - Total
█ ManpowerGroup Solutions █ Right Management

ManpowerGroup 2011 4th Quarter Results February 2012
|
As
Reported
|
Excluding Non
-recurring Items |
Q4 Financial Highlights
|
|
3%
|
3%
|
Revenue $1.2B
|
|
5% CC
|
5% CC
|
|
|
59%
|
35%
|
OUP $38M
|
|
62% CC
|
37% CC
|
|
|
120 bps
|
80 bps
|
OUP Margin 3.3%
|
Americas Segment
(21% of Revenue)
(1) Included in these amounts is the US, which had revenue of $766M (-1%) and OUP of $26M (+84%), including
$1.7M of reorganization charges.
$1.7M of reorganization charges.
(2) Excludes the impact of reorganization charges of $2.4M in 2011 and $6.1M in 2010.
Operating Unit Profit (OUP) is the measure that we use to evaluate segment performance. OUP is
equal to segment revenues less direct costs and branch and national headquarters operating
costs.
equal to segment revenues less direct costs and branch and national headquarters operating
costs.
(1)
8
(2)

ManpowerGroup 2011 4th Quarter Results February 2012
Americas - Q4 Revenue Growth YoY
Revenue Growth - CC
Revenue Growth
% of Segment
Revenue
66%
12%
7%
15%
9

ManpowerGroup 2011 4th Quarter Results February 2012
|
As
Reported
|
Excluding Non
-recurring Items |
Q4 Financial Highlights
|
|
5%
|
5%
|
Revenue $2.0B
|
|
6% CC
|
6% CC
|
|
|
41%
|
13%
|
OUP $43M
|
|
42% CC
|
14% CC
|
|
|
50 bps
|
10 bps
|
OUP Margin 2.1%
|
Southern Europe Segment
(37% of Revenue)
(1) Included in these amounts is France, which had revenue of $1.5B (+6% CC) and OUP of $21M (+72% CC).
(2) On an organic basis, revenue increased 4% (5% in CC).
(3) Excludes the impact of reorganization charges of $7.6M in 2010.
(1)
10
(3)
(2)

ManpowerGroup 2011 4th Quarter Results February 2012
Southern Europe - Q4 Revenue Growth YoY
Revenue Growth - CC
Revenue Growth
% of Segment
Revenue
75%
15%
5%
5%
11

ManpowerGroup 2011 4th Quarter Results February 2012
|
As
Reported
|
Excluding Non
-recurring Items |
Q4 Financial Highlights
|
|
3%
|
3%
|
Revenue $1.5B
|
|
4% CC
|
4% CC
|
|
|
18%
|
1%
|
OUP $52M
|
|
18% CC
|
1% CC
|
|
|
80 bps
|
10 bps
|
OUP Margin 3.4%
|
Northern Europe Segment
(28% of Revenue)
(1) Excludes the impact of reorganization charges of $12.0M in 2011.
12
(1)

ManpowerGroup 2011 4th Quarter Results February 2012
Northern Europe - Q4 Revenue Growth YoY
Revenue Growth - CC
Revenue Growth
% of Segment
Revenue
21%
17%
15%
12%
10%
18%
7%
13
ManpowerGroup 2011 4th Quarter Results February 2012
|
As
Reported
|
Q4 Financial Highlights
|
|
18%
|
Revenue $695M
|
|
14% CC
|
|
|
121%
|
OUP $22M
|
|
115% CC
|
|
|
140 bps
|
OUP Margin 3.1%
|
APME Segment
(13% of Revenue)
14
(1)
(1) On an organic basis, revenue increased 9% (5% in CC).
ManpowerGroup 2011 4th Quarter Results February 2012
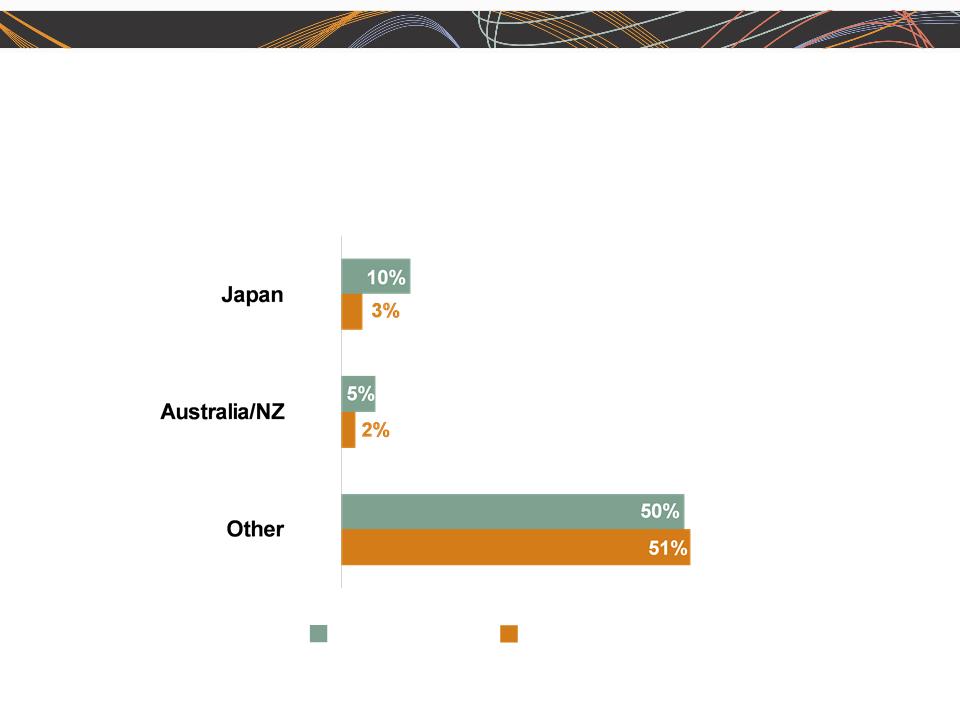
APME - Q4 Revenue Growth YoY
Revenue Growth - CC
Revenue Growth
% of Segment
Revenue
44%
26%
30%
15
(1) On an organic basis, Other revenue growth was 11% (+13% CC).
(1)

ManpowerGroup 2011 4th Quarter Results February 2012
|
As
Reported
|
Excluding
Non-recurring
Items |
Q4 Financial Highlights
|
|
8%
|
8%
|
Revenue $80M
|
|
9% CC
|
9% CC
|
|
|
N/A
|
N/A
|
OUP ($6M)
|
|
N/A
|
N/A
|
|
|
1240 bps
|
70 bps
|
OUP Margin (7.0%)
|
Right Management Segment
(1% of Revenue)
(1) Excludes the impact of reorganization charges of $6.1M in 2011 and $16.8M in 2010.
16
(1)

ManpowerGroup 2011 4th Quarter Results February 2012
Cash Flow Summary - Full Year
|
($ in millions)
|
2011
|
|
2010
|
|
Cash from Operations
|
69
|
|
182
|
|
Capital Expenditures
|
(65)
|
|
(58)
|
|
Free Cash Flow
|
4
|
|
124
|
|
Change in Debt
|
15
|
|
(15)
|
|
Share Repurchases
|
(105)
|
|
(35)
|
|
Acquisitions of Businesses
net of cash acquired
|
(49)
|
|
(270)
|
|
Effect of Exchange Rate Changes
|
(28)
|
|
(18)
|
|
Other
|
(29)
|
|
(28)
|
|
Change in Cash
|
(192)
|
|
(242)
|
|
|
|
|
|
|
|
|
|
|
17

ManpowerGroup 2011 4th Quarter Results February 2012
Balance Sheet Highlights
Total Debt
($ in millions)
Total Debt to
Total Capitalization
Total Debt
Net Debt

ManpowerGroup 2011 4th Quarter Results February 2012
|
|
Interest
Rate
|
Maturity
Date
|
Total
Outstanding
at 12/31/11 |
|
Remaining
Available
at 12/31/11
|
|
|
Euro Notes:
|
|
|
|
|
|
|
|
- Euro 200M
|
4.86%
|
Jun 2013
|
259
|
|
-
|
|
|
- Euro 300M
|
4.58%
|
Jun 2012
|
389
|
|
-
|
|
|
Revolving Credit Agreement
|
1.57%
|
Oct 2016
|
-
|
|
798
|
|
|
Uncommitted lines and Other
|
Various
|
Various
|
52
|
|
347
|
|
|
Total Debt
|
|
|
700
|
|
1,145
|
Credit Facilities
($ in millions)
($ in millions)
(1)
Represents subsidiary uncommitted lines of credit & overdraft facilities, which total $399.2M. Total subsidiary borrowing are limited to $300M due to
restrictions in our Revolving Credit Facility, with the exception of Q3 when subsidiary borrowings are limited to $600M.
restrictions in our Revolving Credit Facility, with the exception of Q3 when subsidiary borrowings are limited to $600M.
(1)
(2)
(2)
We completed a new $800M five year revolving credit agreement on October 5, 2011 with a syndicate of commercial banks .This new agreement
replaces the previous $400M agreement. This agreement, which expires in October 2016, allows for borrowings in various currencies and up to $150M
may be used for the issuance of stand-by letters of credit. Under this agreement, a debt ratings-based pricing grid determines the credit spread that we
add to the applicable interbank borrowing rate on all borrowings as well as the facility and issuance fees. At our current credit ratings, our facility fee is
0.225% and our credit spread for borrowings is 1.275%. This agreement requires that we comply with a Leverage Ratio (Debt-to-EBITDA) of not greater
than 3.5 to 1 and a Fixed Charge Coverage Ratio of not less than 1.5 to 1, in addition to other customary restrictive covenants. As defined in the
agreement, we had a Debt-to-EBITDA ratio of 0.80 and a fixed charge coverage ratio of 3.13 as of December 31, 2011. As of December 31, there were
$1.6M of standby letters of credit issued under the agreement.
19

ManpowerGroup 2011 4th Quarter Results February 2012
First Quarter Outlook
|
Revenue
|
Total
|
Down 1-3% (Up 0-2% CC)
|
|
|
Americas
|
Down 1-3% (Up 0-2% CC)
|
|
|
Southern Europe
|
Down 5-7% (Down 0-2% CC)
|
|
|
Northern Europe
|
Down 2-4% (Up 0-2% CC)
|
|
|
APME
|
Up 11-13% (Up 7-9% CC)
|
|
Right Management
|
Down 9-11% (Down 7-9% CC)
|
|
|
Gross Profit Margin
|
16.6 - 16.8%
|
|
|
Operating Profit Margin
|
1.4 - 1.6%
|
|
|
Tax Rate
|
56%
|
|
|
EPS
|
$0.30 - $0.38 (Neg. $.02 Currency)
|
|
20

ManpowerGroup 2011 4th Quarter Results February 2012
Last year at this time, we didn’t have…
21
… Introduction of Human Age
… Launch of our new parent brand - ManpowerGroup
… Launch of our new professional resourcing brand - Experis
… Launch of our solutions offering - ManpowerGroup Solutions
… Reposition of our Right Management brand to be aligned with our
new branding
new branding
… Introduction of new organizational structure - Southern and Northern
Europe
Europe
… Registered more than 9 million resumes on Direct Talent, our internet
recruitment tool, and implemented in 31 countries
recruitment tool, and implemented in 31 countries
… The largest global RPO business in the industry
… The largest Vender Neutral MSP business in the industry

ManpowerGroup 2011 4th Quarter Results February 2012
Strategic Drivers

Questions