Attached files
| file | filename |
|---|---|
| 8-K - FORM 8-K - Orbital Energy Group, Inc. | v300174_8k.htm |

Presented by William Clough President & CEO, CUI Global Corporate Presentation

Forward - Looking Statements This document contains forward - looking statements within the meaning of Section 27A of the Securities Act of 1933, as amended, and Section 21E of the Securities Exchange Act of 1934, as amended. Such statements are subject to risks and uncertainties that could cause actual results to vary materially from those projected in the forward - looking statements. The company may experience significant fluctuations in future operating results due to a number of economic, competitive, and other factors, including, among other things, our reliance on third - party manufacturers and suppliers, government agency budgetary and political constraints, new or increased competition, changes in market demand, and the performance or reliability of our products. These factors and others could cause operating results to vary significantly from those in prior periods, and those projected in forward - looking statements. Additional information with respect to these and other factors, which could materially affect the company and its operations, are included in certain forms the company has filed with the Securities and Exchange Commission. SEC Disclaimer 2

Offering Summary CUI Global (CUGI.OB) is conducting a primary offering of $10,000,000 The common shares offered are registered on an effective S1 Use of proceeds: $7,000,000 – To pay down debt from $14,600,000 to $7,600,000 $3,000,000 – For general corporate purposes and deal related expenses CUGI applied for a Nasdaq listing on August 17 th , 2011 CUGI received conditional approval for Nasdaq listing using the symbol CUI Obtain financing and pay down debt Reverse split to reach $4.00+ share price 3

CUI Global Investment Highlights CUGI is entering new highly profitable markets with major upside potential Global, IP - Driven Technology Platform Company focused on the electronics market Unique blend of proprietary technology, design expertise, manufacturing experience and test capabilities to deliver customized solutions to customers quickly and profitably Profitable traditional business: advanced power electronics and electro - mechanical components 100%+ Growth Rate over 3 years 2008 to TTM Q3 2011 Credibility with an established base of premier customers including Microsoft, Electrolux, Philips and other brand names Provides access to proprietary deal flow New business: acquiring, licensing and developing IP to create cutting - edge technology Initial products address key needs in high growth markets with massive potential Highly experienced management with well thought - out strategy A proven financial model coupled with new technologies to drive future growth 4
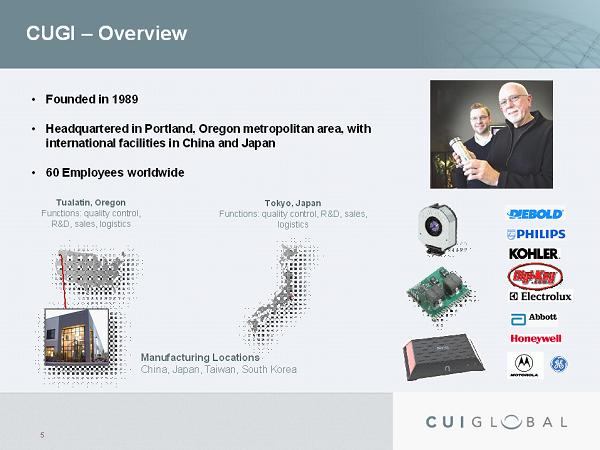
CUGI – Overview • Founded in 1989 • Headquartered in Portland, Oregon metropolitan area, with international facilities in China and Japan • 60 Employees worldwide Tualatin, Oregon Functions: quality control, R&D, sales, logistics Tokyo, Japan Functions: quality control, R&D, sales, logistics Manufacturing Locations China, Japan, Taiwan, South Korea 5

Experienced Management William J. Clough Matthew M. McKenzie Daniel N. Ford President & Chief Executive Officer Chief Operating Officer Chief Financial Officer • President and CEO since 2008 • Led commercialization of WayCool technology including the HydroJet licensing agreement with major customers like OCZ Technology Group • Attorney and former law enforcement officer, operated his own law firm for 14 years, with offices in Los Angeles, San Francisco and Honolulu • Successfully represented leading movie studios and media conglomerates • Certified to practice law in state and federal courts in CA, IL, HI, and before the U.S. Supreme Court • Juris Doctorate, cum laude, from Hastings College of the Law in 1990 • Held various functions for CUI Inc. for more than 10 years • Intimate knowledge of the business, its operations, and its opportunities for growth • Established one of CUI's most successful and profitable business divisions and brands: V - Infinity. • Initiated ISO 9000, a quality management system at CUI Inc.; provided structure to global logistics, including CUI's China facilities; and implemented CUI's ERP system, which allows for more visibility and analysis opportunities than ever in CUI's history • MBA from George Fox University • Background with top accounting firms, including KPMG • Over the past five years, Ford has implemented advanced internal fixed asset tracking, implemented a "real time" inventory system, and participated in implementing CUI's ERP system • His skills as a financier have allowed CUI to move to its current, 62,380 sq. ft. building, as well as provided leadership in CUI Global's acquisition of CUI Inc. • Many awards and leadership positions in business, including the Financial Executives Award in 2001 • MBA from George Fox University 6

Accounted for 99% of TTM Revenue 3 rd Quarter 2011 Power : External & embedded ac - dc power supplies, dc - dc converters, LED drivers • Motorola Wi - Fi Base Stations • Slingbox Motion Control: rotary encoders • Diebold Cash Machines • D - Box Home Theaters Components: connectors, buzzers, speakers, microphones, thermal • Abbott Insulin Machines • XM Satellite Radio • Philips Heartstream Defibrillator Test & Measurement • Vergence Inferential Gas Metering (new) • Oscilloscope Probes Main Product Lines (and sample end - user applications) Infrastructure • Customization • Global Sourcing • 3D Modeling • Application Support • In - house Testing • Customized Shipping 7

Customer/Partner (35% of Revenues) Major Customers 8

Platform for Growth • Proven Management Team – Since taking over in 2008, TTM Revenues are up over 100% @ Q3 2011 • Historical growth curve – Outside commission - based sales force – Expanded distribution relationships – Downloadable “part - level” 3D models – In - house testing; engineering support – Continued product expansion & technology development • Current operations and access to proprietary deal flow allow management to quickly introduce new products into large markets 9

Vergence – Gas Quality Inferential Measurement Device ▪ Industry’s first intra - pipeline natural gas (NG) quality & interchangeability measurement device ▪ Provides gas transmission operators fast , accurate, and near real - time measurement of gas properties and volume (vs. 40 minutes with traditional methods) ▪ Protected by >85 international patents; Own IP 100% after selling 3,100 units ▪ Certified for installation in EU, US, Asia, and African NG facilities – CSA; Baseefa; ATEX; & EICEx 10

Vergence – Gas Quality Inferential Measurement Device (Cont) Cost Comparison Vergence GasPT2 Gas Chromatograph MSRP $25,000 $50,000+ Initial Installation $13,000 $100,000+ Annual Costs $1,167 $12,183 10 yr Costs $49,670 $220,000+ 75% cost savings over 10 years Faster; More efficient; More economical 11

Vergence - Market Opportunity and Competition “Sea Change” Device • Terry Williams – Vergence Lead Engineer – Designer & 37 Year Career w. British Gas • Market Driven By Heightened Profitability • SNAM RETE Accuracy Testing – Better than >0.15% accuracy – Capturing 37% of high - end gas – Unseen by current technology – Raise revenues & profits 12 April thru June 2000 1010 1020 1030 1040 1050 1060 1070 1080 1090 1100 0 500 1000 1500 2000 2500 3000 3500 4000 4500 5000 Readings Every 23 minutes Btu / scf Gas Chromatograph Gas Quality Sensor Jun – Nov 2011

Vergence - Market Opportunity and Competition • Customers: • Orbital Distribution Agreement = $30,000,000 to $40,000,000 • Large Transmission (Pipeline) Companies • SNAM RETE • El Paso Gas • Williams Pipeline • Enagas • GazSystem • National Grid • Large NG Users • Steel/Glass producers • Power producers • Utilities (P, G & E) • Process Control • Gas turbines • CHP machines Total Available Market – Gas Chromatograph: $1.5 Billion annually by 2015 Global Industry Analysts, Inc. 13

Vergence - Market Opportunity • US Pipelines • 305,000 miles • 210 separate pipeline systems • 30,000+ monitoring sites • $600 Million Opportunity • European Pipelines • 221,000 miles • 20,000 miles under construction • 20,000+ monitoring sites • $400 Million Opportunity • Gas Turbines • 46,000+ in 2009 to 57,000+ by 2018 • $1 Billion Opportunity • Annual maintenance cost $18.3 Billion in 2009 up to $25 Billion by 2018 U.S Energy Information Administration 119,000 miles under construction Worldwide* 15,000+ potential monitoring sites = $300 Million Opportunity *2011 Worldwide Pipeline Construction Report (Jan. 2011) Natural Gas System of Europe, 2010 Edition Gas Turbine World: November - December 2009 14

Intermediate Bus Power Architecture • Intermediate Bus Architecture is the dominant power architecture for electronic equipment worldwide • Used in computing equipment (servers and networks wherein electrical power is the No.1 cost), industrial equipment, and communication equipment • The Bus Converter (Solus Based Quarter Brick) manages power to the board • Point - of - Loads (POLs) manage power to specific components on the board 15

Power: Novum Digital POL Modules • Targeting telecom, server and storage markets • Statement of Cooperation signed with Ericsson • Increased efficiency; significant performance gains; design flexibility • Based on patented chip technology • Flexibility | Cost | Configuration | Power Monitoring | Power on Demand |Built in Self - Test (BIST) • Allows for “system” sell, pulling in multiple solutions within the power architecture • Creates a “cut and paste” power system for target customer’s next generation designs 16
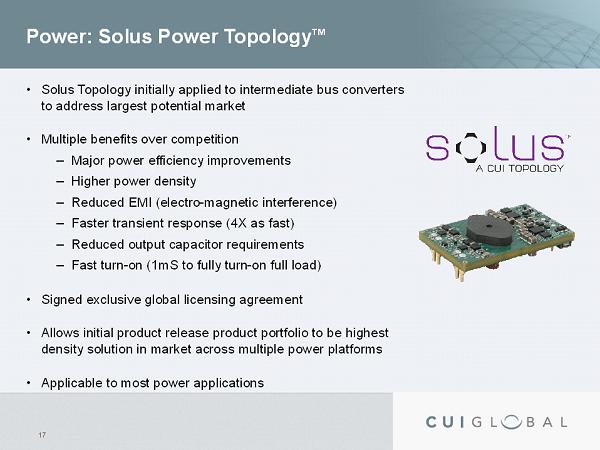
Power: Solus Power Topology TM • Solus Topology initially applied to intermediate bus converters to address largest potential market • Multiple benefits over competition – Major power efficiency improvements – Higher power density – Reduced EMI (electro - magnetic interference) – Faster transient response (4X as fast) – Reduced output capacitor requirements – Fast turn - on (1mS to fully turn - on full load) • Signed exclusive global licensing agreement • Allows initial product release product portfolio to be highest density solution in market across multiple power platforms • Applicable to most power applications 17

Market Opportunity and Competition Novum and Solus address the growing need for digital power supply solutions • Competitors: – Vicor – Ericsson Power – Lineage (GE Power) • Customers: – Cisco Systems – Juniper Systems – Ericsson • Total Available Market – $10’s of Billions between 2012 to 2015 • “Darnell in Depth” (2011) • Darnell “ DC - DC Power Converters ” (Jan. 2011) 18

Q3 2011 Performance Numbers . Summary Income Statement: ($) Total Sales 10,728,215 Total COGS 6,706,311 Gross Profit 4,021,904 Total Expenses Other Income & Discontinued Operations 3,591,251 Taxes 6,330 Net Income 424,323 19

0 10 20 30 40 50 60 70 80 Gross Margins Core Novum / Solus Vergence Mean Gross Margins Revenue Mix by Percentage Target Operating Model, Margins and Revenue Mix 0% 20% 40% 60% 80% 100% 2012 2013 2014 Core Novum / Solus Vergence 20

CUI Global Investment Highlights CUGI is entering new highly profitable markets with major upside potential Global, IP - Driven Technology Platform Company focused on the electronics market Unique blend of proprietary technology, design expertise, manufacturing experience and test capabilities to deliver customized solutions to customers quickly and profitably Profitable traditional business: advanced power electronics and electro - mechanical components 100%+ Growth Rate over 3 years 2008 to TTM Q3 2011 Credibility with an established base of premier customers including Microsoft, Electrolux, Philips and other brand names Provides access to proprietary deal flow New business: acquiring, licensing and developing IP to create cutting - edge technology Initial products address key needs in high growth markets with massive potential Highly experienced management with well thought - out strategy A proven financial model coupled with new technologies to drive future growth 21

Appendix 22

Balance Sheet Summary 2011 2010 2010 2009 (Unaudited) ( Unaudited) Cash and cash equivalents 143,750$ 459,091$ 373,823$ 391,486$ Total current assets 8,634,554 12,142,212 11,676,929 10,344,597 Total assets 32,783,612 40,133,973 35,874,849 38,806,307 Total current liabilities 9,774,182 13,405,794 13,241,513 10,497,367 Total liabilities 20,077,865 25,940,571 23,922,073 32,838,047 Total stockholders' equity 12,705,747 14,133,812 12,299,120 5,936,651 Noncontrolling interest - 59,590 (346,344) 31,609 Condensed Consolidated Balance Sheet As of September 30, As of December 31, Q2 2008 – Q3 2011 CUGI retired/eliminated ~$27M in debt, substantially strengthening its balance sheet 23

Ownership Summary BENEFICIAL INTEREST TABLE Common Stock Preferred Stock Series A Convertible Series B Convertible Series C Convertible Name and Address of Beneficial Owner Number Percent of Class Number Percent of Class Number Percent of Class Number Percent of Class Percent of All Voting Securities Colton Melby 12,690,623 5.78 % - * - * - * 5.78% William J. Clough 2,017,803 * - * - * - * * Thomas A. Price 1,901,000 * - * - * - * * Sean P. Rooney 374,202 * - * - * - * * Corey Lambrecht 201,000 * - * - * - * * Matthew M. McKenzie 758,205 * - * - * - * * Daniel N. Ford 418,559 * - * - * - * * Kjell Qvale 25,223,082 11.49 % - * - * - * 11.48% Mitchell Saltz 11,985,865 5.47 % - * - * - * 5.46% Jerry Ostrin - * 45,000 89.03 % - * - * * Barry Lezak - * 3,043 6.02 % - * - * * Officers, Directors, and Executives as Group 18,361,392 8.25 % - * - * - * 8.25% * Less than 1 percent ** For additional details related to the Beneficial Interest Table, please refer to page 43 of the S - 1/A Securities Registration Statement filed November 30, 2011. 24

EBITDA from continuing operations before impairment expenses is a non - GAAP financial measure and is reconciled in the table belo w. EBITDA from continuing operations before impairment expenses does not represent funds available for management's discretionary use and is not intended to represent ca sh flow from operations. EBITDA from continuing operations before impairment expenses should not be construed as a substitute for net loss or as a better measure of liquidit y t han cash flow from operating activities, which is determined in accordance with United States generally accepted accounting principles ("GAAP"). EBITDA from continuing operati ons before impairment expenses excludes components that are significant in understanding and assessing our results of operations and cash flows. In addition, EBITDA from contin uin g operations before impairment expenses is not a term defined by GAAP and as a result our measure of EBITDA from continuing operations before impairment expenses might not be comp ara ble to similarly titled measures used by other companies. However, EBITDA before impairment expenses is used by management to evaluate, assess and benchmark the Company’s o per ational results and the Company believes that EBITDA before impairment expenses is relevant and useful information, which is often reported and widely used by analyst s, investors and other interested parties in our industry. Accordingly, the Company is disclosing this information to permit a more comprehensive analysis of its operating performance, to provide an additional measure of performance and liquidity and to provide additional information with respect to the company’s ability to meet future debt service, capital ex pen diture and working capital requirements. This document contains forward - looking statements within the meaning of Section 27A of the Securities Act of 1933, as amended, a nd Section 21E of the Securities Exchange Act of 1934, as amended. EBITDA from continuing operations before impairment expenses For the Years Ended December 31, For the trailing twelve months ended, 2008 2009 (Restated) 2010 September 30, 2011 Consolidated Net (loss) from continuing operations $ (1,830,367) $ (16,022,390) $ (6,588,711) $ ( 3,517,309) Plus: Interest expense - intrinsic value of convertible debt, amortization of debt offering costs and amortization of debt discount 2,342,374 3,096,641 3,859,342 507,634 Plus: Interest expense 1,362,374 1,520,447 1,152,162 924,387 Plus: Depreciation and amortization 523,706 685,447 758,455 813,731 Plus: Taxes - - 111,163 97,744 EBITDA from continuing operations before impairment expenses 2,398,087 (10,719,855) (707,589) (1,173,813) Plus: Impairment expenses 247,617 10,834,980 3,524,141 3,524,141 Adjusted EBITDA from continuing operations before impairment expenses $ 2,645,704 $ 115,125 $ 2,816,552 $ 2,350,328 Note > 2008 included $2,831,688 of derivative income. This was associated with the change in the fair value of warrant liabi lit ies. Reconciliation of Non - GAAP Financial Measures 25