Attached files
| file | filename |
|---|---|
| EX-32.2 - EXHIBIT 32.2 - Orbital Energy Group, Inc. | ex_107426.htm |
| EX-32.1 - EXHIBIT 32.1 - Orbital Energy Group, Inc. | ex_107425.htm |
| EX-31.2 - EXHIBIT 31.2 - Orbital Energy Group, Inc. | ex_107424.htm |
| EX-31.1 - EXHIBIT 31.1 - Orbital Energy Group, Inc. | ex_107423.htm |
| EX-23.8 - EXHIBIT 23.8 - Orbital Energy Group, Inc. | ex_107422.htm |
| EX-10.93 - EXHIBIT 10.93 - Orbital Energy Group, Inc. | ex_107427.htm |
| EX-10.92 - EXHIBIT 10.92 - Orbital Energy Group, Inc. | ex_107435.htm |
UNITED STATES
SECURITIES AND EXCHANGE COMMISSION
WASHINGTON, D.C. 20549
FORM 10-K
☒ ANNUAL REPORT UNDER SECTION 13 OR 15(d) OF THE SECURITIES EXCHANGE ACT OF 1934
For the fiscal year ended December 31, 2017
OR
☐ TRANSITION REPORT PURSUANT TO SECTION 13 OR 15(d) OF THE SECURITIES EXCHANGE ACT OF 1934
For the transition period from_____to_____
Commission File Number 0-29923
CUI Global, Inc.
(Exact name of registrant as specified in its charter)
|
Colorado |
(3670) |
84-1463284 |
||
|
(State or jurisdiction of |
(Primary Standard Industrial |
(I.R.S. Employer |
||
|
incorporation or organization) |
Classification Code Number) |
Identification No.) |
20050 SW 112th Avenue
Tualatin, Oregon 97062
(503) 612-2300
(Address and Telephone Number of Principal Executive Offices and Principal Place of Business)
Securities registered pursuant to Section 12(b) of the Act:
|
Title of each class |
Name of each exchange where registered |
|
|
Common Stock par value $0.001 per share |
The NASDAQ Stock Market |
Securities registered pursuant to Section 12(g) of the Act: None
Indicate by check mark if the registrant is a well-known seasoned issuer, as defined in Rule 405 of the Securities Act.
☐ Yes ☒ No
Indicate by check mark if the registrant is not required to file reports pursuant to Section 13 or Section 15(d) of the Act.
☐ Yes ☒ No
Indicate by check mark whether the registrant (1) has filed all reports required to be filed by Section 13 or 15(d) of the Securities Exchange Act of 1934 during the preceding 12 months (or for such shorter period that the registrant was required to file such reports), and (2) has been subject to such filing requirements for the past 90 days. ☒ Yes ☐ No
Indicate by check mark whether the registrant has submitted electronically and posted on its corporate Web site, if any, every Interactive Data File required to be submitted and posted pursuant to Rule 405 of Regulation S-T (§ 232.405 of this chapter) during the preceding 12 months (or for such shorter period that the registrant was required to submit and post such files). ☒ Yes ☐ No
Indicate by check mark if disclosure of delinquent filers pursuant to Item 405 of Regulation S-K (§ 229.405 of this chapter) is not contained herein, and will not be contained, to the best of registrant’s knowledge, in definitive proxy or information statements incorporated by reference in Part III of this Form 10-K or any amendment to this Form 10-K. ☐
Indicate by check mark whether the registrant is a large accelerated filer, an accelerated filer, a non-accelerated filer, or a smaller reporting company. See the definitions of ‘‘large accelerated filer,’’ ‘‘accelerated filer,’’ ‘‘smaller reporting company’’ and “emerging growth company” in Rule 12b-2 of the Exchange Act.
Large accelerated filer ☐ Accelerated filer ☒ Non-accelerated filer ☐ (Do not check if a smaller reporting company)
Smaller reporting company ☐ Emerging growth company ☐
If an emerging growth company, indicate by check mark if the registrant has elected not to use the extended transition period for complying with any new or revised financial accounting standards provided pursuant to Section 13(a) of the Exchange Act. ☐
Indicate by check mark whether the registrant is a shell company (as defined in Rule 12b-2 of the Act). ☐ Yes ☒ No
The aggregate market value of the voting and non-voting common equity held by non-affiliates, based on the closing price of our common stock on the last business day of the registrant’s most recently completed fiscal second quarter (June 30, 2017), was approximately $61,769,100. Shares of common stock beneficially held by each executive officer and director as well as 5% holders as of June 30, 2017 have been excluded from this computation because these persons may be deemed to be affiliates. This determination of affiliate status is not necessarily a conclusive determination for any other purpose.
As of March 14, 2018, the registrant had 28,485,898 shares of common stock outstanding and no shares of Preferred Stock outstanding.
DOCUMENTS INCORPORATED BY REFERENCE
None.
| Part I | ||
|
Item 1. |
Business |
3 |
|
Item 1A. |
Risk Factors |
12 |
|
Item 1B. |
Unresolved Staff Comments |
23 |
|
Item 2. |
Properties |
23 |
|
Item 3. |
Legal Proceedings |
23 |
|
Item 4. |
Mine Safety Disclosure |
23 |
|
Part II |
||
|
Item 5. |
Market for Common Equity, Related Stockholder Matters and Issuer Purchases of Equity Securities |
23 |
| Description of Securities |
23 |
|
|
Market Value |
24 |
|
|
Item 6. |
Selected Financial Data |
29 |
|
Item 7. |
Management's Discussion and Analysis of Financial Condition and Results of Operations |
30 |
|
Critical Accounting Policies |
30 |
|
|
Liquidity and Capital Resources |
33 |
|
|
Results of Operations |
38 |
|
|
Item 7A. |
Quantitative and Qualitative Disclosures about Market Risk |
44 |
|
Item 8. |
Financial Statements and Supplementary Data |
46 |
|
Item 9. |
Changes In and Disagreements with Accountants on Accounting and Financial Disclosure |
85 |
|
Item 9A. |
Controls and Procedures |
86 |
|
Item 9B |
Other Information |
88 |
|
Part III |
||
|
Item 10. |
Directors, Executive Officers and Corporate Governance |
88 |
|
Our Corporate Governance Practices |
91 |
|
|
Audit Committee |
93 |
|
|
Audit Committee Report |
93 |
|
|
Nominating Committee |
94 |
|
|
Item 11. |
Executive Compensation |
97 |
|
Item 12. |
Security Ownership of Certain Beneficial Owners and Management and Related Stockholder Matters |
107 |
|
Item 13. |
Certain Relationships, Related Transactions and Director Independence |
111 |
|
Item 14. |
Principal Accounting Fees and Services |
111 |
|
Part IV |
||
|
Item 15. |
Exhibits, Financial Statement Schedules |
113 |
|
Exhibits |
114 |
|
|
Item 16. |
Form 10-K Summary |
115 |
|
Signatures |
115 |
|
|
Certifications |
||
PART I
Item 1. Business
Corporate Overview and Our Products
CUI Global, Inc. and Subsidiaries is collectively referred to as ‘‘CUI Global’’ or “The Company.” CUI Global, Inc. is a Colorado corporation organized on April 21, 1998. CUI Global, Inc.'s principal place of business is located at 20050 SW 112th Avenue, Tualatin, Oregon 97062, phone (503) 612-2300. The Company is a platform company dedicated to maximizing shareholder value through the acquisition, development and commercialization of new, innovative technologies. The Company's operations fall into two reportable segments: Power and Electromechanical segment and Energy segment. In addition, the Company’s corporate overhead activities are included in an ‘‘Other’’ category. CUI Global, Inc. has subsidiaries in 4 countries, including the United States. Through its subsidiaries, CUI Global, Inc. has built a diversified portfolio of industry leading technologies that touch many markets.
Power and Electromechanical Segment
CUI Inc., CUI Japan, and CUI-Canada - Subsidiaries
CUI Inc., is based in Tualatin, Oregon, CUI Japan is based in Tokyo, Japan and CUI-Canada, acquired in March 2015, is based in Toronto, Canada (collectively referred to as “CUI”). These three subsidiaries are providers of electronic components including power supplies, transformers, converters, connectors and industrial controls for Original Equipment Manufacturers (OEMs). Since its inception in 1989, CUI has been delivering quality products, extensive application solutions and superior personal service. CUI's solid customer commitment and honest corporate message are a hallmark in the industry.
The Power and Electromechanical segment aggregates its product offerings into two categories: power solutions - including external and embedded ac-dc power supplies, dc-dc converters and basic digital point of load modules and offering a technology architecture that addresses power and related accessories; and components - including connectors, speakers, buzzers, and industrial control solutions including encoders and sensors. These offerings provide a technology architecture that addresses power and related accessories to industries as broadly ranging as telecommunications, consumer electronics, medical and defense.
Power Supply Solutions
Our current power line consists of external and embedded ac-dc power supplies, dc-dc converters and basic digital point of load modules. This dynamic, broadly applicable product line accounts for a significant portion of our current revenue.
Digital Power Patent License Agreement with Power-One, Inc.
CUI Inc. entered into a non-exclusive Field of Use Agreement with Power-One, Inc. to license Power-One’s Digital Power Technology patents. The license provides access to Power-One’s portfolio of Digital Power Technology patents for incorporation into the company’s line of digital point of load power modules. The company, through its power division, also manufactures a wide range of embedded and external power electronics devices for OEM manufacturers.
Advanced Power
With the rapid rise in cloud computing and the “Internet of Things,” CUI is well positioned with our advanced power portfolio to address these quickly-growing markets. System complexity, energy efficiency regulations and the need for more processing power in smaller spaces has moved digital power to a mandatory technology in data communications, server and storage applications. As one of the early adopters of digital power, CUI continues to be an industry leader in this space. As a founding member of the Architects of Modern Power (AMP) Group® power consortium partnered with Ericsson Power Modules and Murata, CUI is driving change in the industry to ensure supply chain security and push technology innovation for tomorrow’s applications. The acquisition of certain assets and certain liabilities of Tectrol, Inc. (now CUI-Canada) in 2015 now allows us to address the front-end power requirements of these same systems, providing a complete power solution for our customers. In an environment where OEMs are working to reduce their approved vendor list, the capability to deliver a full system solution is becoming critical.
During 2014, CUI, Ericsson Power Modules and Murata announced the formation of the Architects of Modern Power (AMP) Group® power consortium. The goal of the AMP alliance is to realize the most technically advanced, end-to-end solutions and provide a complete ecosystem of hardware, software and support. Beyond purely mechanical specifications, it is the standardization of monitoring, control and communications functions, and the creation of common configuration files for plug-and-play interoperability that will ensure compatibility between each firms’ products.
Virtual Power Systems and ICE®
CUI Inc. entered into a hardware agreement with Virtual Power Systems (VPS) to be the exclusive third-party design and development provider of ICE (Intelligent Control of Energy) products enabled by the VPS patented software system. The ICE system is a revolutionary Software Defined Power® solution that combines CUI Inc.’s hardware and Virtual Power Systems’ software into a platform that increases data centers' power infrastructure utilization. CUI Inc. has an exclusive three-year agreement with VPS, with the potential to extend the partnership for another two years.
Components
AMT® Encoder
CUI Inc. has an exclusive agreement to develop, sell and distribute the AMT encoder worldwide. The AMT series modular encoder is designed with proprietary, capacitive, code-generating technology as opposed to optical or magnetic encoding. This unique device allows breakthroughs in selectable resolution, shaft-adaptation and convenient mounting solutions to bring ease of installation, reduction in SKUs and economies of scale in purchasing. The AMT amounts to almost 2,000 different encoders in one package. The AMT has been awarded several design wins from Motion Control OEM’s producing a wide range of products including robotics. This portfolio of products continues to grow and become more diverse in its ability to meet the needs of the customer base.
Anticipated Growth Strategy for Our Power and Electromechanical Segment
We hope to grow our power and electromechanical product line through a planned strategy to increase our name recognition as a technology company. Our plan, already in effect, includes:
|
• |
Developing collaborative relationships with our customers by seeking to meet their design needs in a timely and cost-effective manner. |
|
• |
Developing new technologies and expanded manufacturing capabilities as needed. |
|
• |
Growing our global sales and distribution through our international distribution channels. |
|
• |
Directing our marketing efforts through one of our two channels: either directly with the sales representative who understands the targets in the area or through our distributors with partnership marketing. |
These areas, however, need forward-looking growth investment to understand the customers’ needs and develop products accordingly. We are in line with market standards for quality, customer service and pricing. Our plan is to stay with this mark during our anticipated growth. We intend to expand according to our existing model. This expansion means additional manufacturer representative coverage and outside sales people in strategic areas.
Energy Segment
Orbital Gas Systems, Ltd. and Orbital Gas Systems, North America, Inc. - Subsidiaries
Orbital Gas Systems, Ltd. (Orbital-UK) is based in Stone, Staffordshire in the United Kingdom and Orbital Gas Systems, North America, Inc. (Orbital North America), which initiated operations in 2015, is based in Houston, Texas. Orbital-UK has operated successfully in the natural gas industry for over 30 years and is a leading provider of natural gas infrastructure and high-tech solutions to United Kingdom transmission companies, including: Scotia Gas Networks (SGN); Wales & West; and National Grid, the national gas transmission company in the UK and one of the most respected specialized gas engineering companies in the world. Orbital North America leverages the experience of Orbital-UK in an effort to reach the North American market with the innovative solutions that Orbital-UK customers have benefited from for years.
The Energy segment subsidiaries, collectively referred to as Orbital, have developed a portfolio of products, services and resources to offer a diverse range of personalized gas engineering solutions to the gas utilities, power generation, emissions, manufacturing and automotive industries. Its proprietary VE® Technology enhances the capability and speed of our GasPT® Technology. VE Technology provides a superior method of penetrating the gas flow without the associated vortex vibration, thereby making it a ‘‘stand-alone’’ product for thermal sensing (thermowells) and trace-element sampling.
We deal with several independent licensors for whose intellectual property we compete with other manufacturers. Rights to such intellectual property, when acquired by us, are usually exclusive and the agreements require us to pay the licensor a royalty on our net sales of the item. These license agreements, in some cases, also provide for advance royalties and minimum guarantees to maintain technical rights and exclusivity.
GasPT®
Through an exclusive licensing contract with DNV GL (formerly: GL Industrial Services UK, Ltd.) (formerly: British-based Advantica, Ltd.), CUI Global owns exclusive rights to manufacture, sell and distribute a Gas Quality Inferential Measurement Device designed by DNV GL on a worldwide basis, now marketed as the GasPT. The Company has minimum commitments, including royalty payments, under this licensing contract.
The GasPT, is a low-cost solution for measuring natural gas quality. It can be connected to a natural gas system to provide a fast, accurate, close to real time measurement of the physical properties of the gas, such as thermal conductivity, speed of sound and carbon dioxide content. From these measurements it infers an effective gas mixture comprising five components: methane, ethane, propane, nitrogen, and measured carbon dioxide and then uses ISO6976 to calculate the gas quality characteristics of calorific value (CV), Wobbe index (WI), relative density (RD), and compression factor (Z). An ISO, International Organization for Standardization, is a documented agreement containing technical specifications or other precise criteria to be used consistently as rules, guidelines or definitions of characteristics to ensure that materials, products, processes and services are fit for their purpose.
This new and innovative technology has been certified for use in fiscal monitoring by Ofgem in the United Kingdom, the Polish Oil & Gas Company Department of Testing and Calibration in Warsaw, NOVA Chemical/TransCanada in Canada, the Pipeline Research Counsel International (PRCI) in the US, ENGIE (the French energy giant), and NMi & The International Organization of Legal Metrology (‘‘OIML’’) for SNAM RETE in Italy. At present, there is no equivalent product competition. There are instruments like gas chromatographs (‘‘GC’’) that technically can be considered competition, but they are slow, complicated to use and as much as five times the installed price of the GasPT.
For example, in the case of SNAM RETE, the Italian gas transmission company, there are ~ 7,000 customer access points, servicing 7,500 customers. Those would include city gates, large industrial users, power generation plants and others. All of those customer access ports would be applicable for the GasPT Technology.
In addition, there are more than 50,000 gas-fired turbines in operation worldwide. Each turbine is subject to variances in natural gas quality. Depending on the quality of the gas, by using our GasPT Technology, those very expensive machines can be tuned to run more efficiently and therefore longer with significantly cleaner emissions. Because of the delay in information from the GC’s, such tuning cannot be effectively accomplished. This greater efficiency has led National Grid in the UK to change its entire turbine control strategy, canceling orders for several GC’s and, in 2013, replacing those GC’s with GasPT devices specifically designed for natural gas-fired turbine control.
Orbital has successfully introduced the combined GasPT analyzer and VE sample system (GasPTi) to National Grid, the largest natural gas provider in the UK. In addition, along with passing first phase testing by GE-Energy in October/November 2012, the GasPTi device successfully completed second phase testing with GE-Energy in October 2013. The device is now in final phase testing at GE's Oil & Gas Learning Center in Nuovo Pignone, Florence, Italy.
In January 2012, the company signed a five-year, exclusive distribution agreement for our GasPT technology with an Italian company, SOCRATE s.p.a. for sales, marketing, distribution and service of our GasPT gas metering device for Italy and North Africa, including Libya and Tunisia. SOCRATE is a ‘‘vendor-of-choice’’ for SNAM RETE GAS (‘‘SRG’’). SOCRATE was involved in negotiations with SRG relative to both the 2010 Technical Upgrade of Metering Facilities and 2011/2012 New Capacity and Implementation Plan. In conjunction with those two initiatives, SRG transmission system concluded 24 months of in-field testing with six (6) GasPTi units.
On September 3, 2015, SRG issued a public tender for the installation of at least 3,300 metering devices to change the way SRG monitors its facilities and assets. After a several months bidding process, Orbital and its partner, SOCRATE were awarded the initial purchase order (400 units) under the tender. Those 400 units were delivered on-time and in-budget during 2016. A regulatory issue unrelated to the technology delayed the next phase of the project through 2017. The Company expects the project to resume in 2018. The customer is currently working with its regulatory body to implement a program that would improve its ability to more rapidly deploy the new metering solutions. SRG has confirmed that the GasPT device is still the only qualified technology.
Bio-Methane to Grid
In addition, Orbital has been very involved in developing a method by which bio-methane gas can be injected into the existing natural gas infrastructure without enhancement, thus remaining environmentally-friendly while maintaining a carbon neutral footprint.
Bio-methane gas (produced wherever organic material is decaying) can be, and is a significant source of environmentally-friendly, carbon neutral energy in the U.K. Italy produces as much as 8 billion cubic meters of bio-methane gas per year and could dramatically reduce its carbon footprint by capturing that bio-methane gas in the form of energy. The specific advantages of bio-methane as a source of energy is that it uses already-existing pipeline infrastructure to quickly and efficiently deliver energy to the end-user, who, in most cases, is already connected to the grid.
The problem in the U.K. and elsewhere is maintaining accurate billing after the bio-methane gas is injected into the grid. In brief, how billing is currently done in the U.K. (and throughout much of Western Europe) means that to meet critical calorific value (“CV”) levels, before being injected into the grid, bio-methane gas must be enhanced by injecting propane or some other complex carbon material to allow the bio-methane gas to fit the CV envelope of the regional billing model.
Such enhancement means that the very simple, environmentally-friendly bio-methane gas is transformed into a complex carbon gas, which increases its carbon footprint. In addition, the energy used by fleets of vehicles transporting propane to the propane injectors at each bio-methane-to-grid facility further increases the carbon footprint and resulting pollution to the environment - All-in-all, a very environmentally-unfriendly, highly polluting method of delivering what would otherwise be a “green” alternative energy source.
DNV GL, the well-respected Norwegian consulting firm, has opined that the need to enhance bio-methane gas actually makes such gas less environmentally-friendly than standard natural gas sources.
The question, then, is how to avoid having to enhance bio-methane gas before injecting it into the grid. The answer, simply, is to measure the quality of the gas for billing downstream from the bio-methane injection sites, so the CV does not affect the billing, which is done in a much closer proximity to the end-user; thereby, becoming much more accurate and reliable. A simplified animation of the analysis/issues can be found at a link from our www.CUIGlobal.com website (Future Billing Methodology Animation).
To develop such a billing methodology, DNV GL (in conjunction with Orbital) has produced a “proof-of-concept” proposal. The first portion of that proposal, an industry survey, was memorialized in the Future Billing Methodology (“FBM”) Project Consultation Report, which can also be found at the DNV GL website, which is linked to at our www.CUIGlobal.com website (FBM Project Consultation).
That consultation resulted in an approval by Ofgem, the U.K. regulatory authority, to move forward with field trials to “decarbonize” the U.K. energy network. A copy of the Stage Gate Report memorializing that Ofgem approval can be found on the DNV GL website, for which a link can be found on our www.CUIGlobal.com website (FBM Stage Gate Report).
Finally, a comprehensive description of the field trials, including the use of Orbital’s proprietary GasPT technology to provide for quick, efficient, accurate, and cost-effective data monitoring, was recently published on January 11, 2018. A copy of that report can be found at the DNV GL website, which is linked to at www.CUIGlobal.com (FBM Project Report).
Orbital has produced an initial, formal bid for the UK project of up to £490,000,000 ($661,000,000 USD at December 31, 2017) over 15 to 20 years. DNV GL and Ofgem, the UK regulatory agency, have both confirmed that the formal bid falls “within budget guidelines.”
VE Technology®
Orbital holds exclusive worldwide rights to manufacture, sell, design, and otherwise market the VE-Probe, VE sample system, VE thermowell and VE Technology® from its United Kingdom-based inventor, EnDet Ltd. The agreement, which includes certain royalty commitments, gives Orbital exclusive and sole control of all technology related to its revolutionary GasPT natural gas metering systems. The GasPT technology provides fast and accurate measurement of the physical properties of the natural gas mixture. By combining the GasPT technology with the equally unique VE Technology, which can provide a gas sample from a high-pressure transmission line in less than two seconds, Orbital has created the GasPTi metering system.
The GasPTi system can accurately provide nearly real-time data to the natural gas operator in a total cycle-time of less than five seconds. It provides this analysis at approximately one-fifth of the installation cost of current technology with none of the associated maintenance, carrier gas, calibration gas, or other ancillary costs associated with traditional technology.
VE Technology gives us the ability to control and produce the entire bill of materials for our GasPTi systems, thus allowing us to capture a larger margin as we provide this unique metering solution to the natural gas industry.
In addition, the VE Technology, combined with applicable detectors, allows us to produce trace-element detectors for such components as mercury (Hg), moisture (H20), and hydrogen sulfide (H2S) that are particularly effective in quickly and accurately identifying these elements. That ability has allowed us to sell a significant number of our probes into the Gorgon LNG Project in Australia, a large Northeastern LNG terminal in the US, and chemical plants throughout North America.
Some of the features of the VE Technology that set it apart from its competition are the VE fixed or retractable sampling probe with its patented helical strakes to eliminate vortex shedding and the need for wake calculations and its patented aerodynamic probe tip to actively reject particulate, minimizing the need for filtration and allowing a small bore to optimize sample transit time. In addition, the VE sample system provides a simple, optimized system to deliver a representative sample to any analyzer with no dead volume, threaded connections or components in the sample pathway. Simple concepts and decades of detailed engineering allows very quick and simple customization to suit any application.
Anticipated Growth Strategy for Our Energy Segment
We are presently in the midst of our marketing efforts for our GasPT Inferential Natural Gas Monitoring Device, VE technology products, and other product and integrated solutions. Our strategy includes:
|
• |
For GasPT, our strategy has been to identify the large gas utility companies who would most likely provide opportunities for batch sales rather than single unit sales. This approach has focused strongly on the United Kingdom, Europe and North America. The Company will continue its efforts in those areas. |
|
• |
We will continue identifying prospects for our GasPT technology in the Asian markets. |
|
• |
Beyond this, our strategy is based on identification of the main geographic locations for liquefied natural gas importation (pipelines and terminals), mixing and blending points and strategic locations for security of supply strategies, which can be current or planned pipelines and import terminals where additional gas quality monitoring may be required. |
|
• |
Orbital continues to develop new integrated solutions, promote existing technologies, and increase customer relationships. |
|
• |
The Company will continue to identify opportunities to utilize the unique VE Technology beyond the existing product offering, with a focus on gas sampling, thermowells, and trace element sampling applications. |
|
• |
We signed an exclusive distribution agreement for our GasPT technology with an Italian company, SOCRATE s.p.a., for sales, marketing, distribution and service of our GasPT gas metering device for Italy and North Africa, including Libya and Tunisia. |
|
• |
During 2016, Orbital signed a Technology and Patent License Agreement with daily Thermetrics, a globally-respected design and manufacturing company providing process industries with precise temperature measurement instrumentation. The Agreement calls for the manufacture and sale of the patented natural gas sampling VE Technology in North America. This relationship is expected to allow Orbital to more efficiently penetrate the North American energy market. |
|
• |
The Company will continue to seek new opportunities to design, manufacture, and produce innovative solutions within the Energy segment to increase customer reach, product innovation, and growth. In such an effort, during 2016, Orbital was awarded a $3.0 million project to design, manufacture, and produce innovative solutions for gas quality and volumetric metering within SGN’s (formerly: Scotia Gas Network) Great Britain gas distribution network. Orbital-UK was awarded the contract by DNV GL, a leader within the oil and gas industry. The project is part of DNV GL’s Future Billing Methodology (“FBM”) Project, which, when implemented in late-2019, could call for the deployment of literally tens-of-thousands of the Company’s proprietary GasPT analyzers. |
The objective of the SGN project is to optimize gas network design and network operation assumptions. This project will use a pilot trial methodology with the procurement and installation of innovative sensor technologies across pressure tiers in a gas distribution system. These technologies, combined with novel power and communications and a cloud-based data system, will be used by DNV GL to develop a prototype real-time energy demand model, a world first. Innovative technology, such as Orbital’s proprietary GasPT Technology, form the backbone of the solution coupled with custom metering designs to be used to meet the project criteria. The project produces a GasPT application which would allow the millions of residential energy consumers to have immediate, real-time access to the cost of their energy usage.
We continue negotiations with ENGIE, the French transmission company, for deployment of the devices to both GRTgaz (ENGIE’s pipeline subsidiary) and Elengy (ENGIE’s liquid natural gas subsidiary) in the near future. ENGIE has agreed to represent the technology to other Western European, North American, and Asian entities in a partnership with Orbital.
According to the latest industry analysts (including MarketsandMarkets), the global GC market reached $2,583.6 million in 2014 and is poised to grow at a CAGR of 6.9% from 2014 to 2019, reaching $3,605.1 million by 2019. Admittedly, that market is mature and is dominated by ‘‘after-market and accessories’’ sales. In contrast, the GasPT Technology is less expensive, more efficient and dramatically faster than any GC. It provides nearly real-time monitoring with no large enclosure, carrier gas and, most significantly, regular technical support and calibration. Taking those factors into account, it is our intention that the GasPT Technology will rapidly and effectively penetrate a large segment of that $2.5+ billion market.
In conclusion, Orbital utilizes internationally recognized distribution partners in various global markets to reach customers throughout the natural gas industry. These distribution partners are utilized to supplement and enhance our existing sales and engineering teams in the UK and USA.
ISO 9001:2008 Certification
CUI Inc.; CUI-Canada; Orbital Gas Systems, Ltd. and Orbital Gas Systems, North America Inc. are certified to the ISO 9001:2008 Quality Management Systems standards and guidelines. These entities are registered as conforming to the requirements of standard: ISO 9001:2008. The CUI Quality Management Systems are applicable to design, development and distribution of electromechanical components for OEM manufacturing. Orbital’s Quality Management Systems are designed to safeguard product quality, health and safety and the environment through the design, build, installation commissioning and after sales processes. ISO 9001 is accepted worldwide as the inclusive international standard that defines quality.
Orbital-UK's Environmental Management System has also been verified by an independent third party (NQA) as complying with the requirements of BS EN ISO 14001:2008. This assists Orbital in meeting applicable environmental legislation and to control the environmental aspects of our activities as a company.
The certification of compliance with ISO 9001:2008 recognizes that our policies, practices and procedures ensure consistent quality in the design services, technology and products we provide to our customers.
Acquisition Strategy
We are constantly alert to potential acquisition targets, both in the form of innovative technology and potential strategic partners. In that regard, we are repeatedly approached by inventors and others, to assess and assist in commercialization and marketing of new technologies. These contacts largely arise because of our reputation and successes as well as our recent technology product line additions including GasPT, VE and ICE. Moreover, much like our past acquisitions, there are many small, well-run electronics and gas industry companies that become available for multiple reasons. We will consider each of these potential opportunities as they arise with a careful analysis of the relevant synergies with our current business, along with the potential for increasing revenue and/or market share.
Research and Development Activities
Research and development costs for CUI Global were approximately $2.5 million, $2.0 million and $1.8 million for the years ended December 31, 2017, 2016 and 2015, respectively. Research and development costs are related to the various technologies for which CUI Global has acquired licensing rights or is developing internally. The expenditures for research and development have been directed primarily towards the further development of power technologies including advanced power products, AMT Capacitive Encoders and towards further development of the GasPT and VE Probe technologies. The Company expects that research and development expenses will continue during 2018 as the Company continues to expand its product offering and technologies due to market acceptance and customer integration.
Employees
As of December 31, 2017, CUI Global, Inc., together with its consolidated subsidiaries, had 333 employees. As of December 31, 2017, 75 of its employees in Canada are represented by a labor union. This is a decrease in total employees from the 357 total employees reported as of December 31, 2016 and a slight decrease in unionized employees from the 76 reported as of December 31, 2016. The Company considers its relations with its employees to be good. The Company plans to add additional staff as needed to handle all phases of its business.
Intellectual Property License Evolution
AMT® encoder technology
Through an exclusive licensing contract with AnderMotion Technologies, LLC, signed on or about April 20, 2009, CUI acquired exclusive rights to manufacture, sell and distribute motion control devices utilizing the AMT encoder technology.
Novum® Digital POL technology
Through a non-exclusive licensing agreement with Power-One, Inc., signed on or about September 18, 2009, CUI has access to Power-One’s portfolio of Digital Power Technology patents for incorporation into CUI’s advanced power solutions.
GasPT® technology
Through an exclusive licensing contract with DNV GL (formerly: GL Industrial Services UK, Ltd.) (formerly British-based Advantica, Ltd.) ("GL") and signed on or about January 4, 2010, CUI Global acquired exclusive rights to manufacture, sell and distribute a Gas Quality Inferential Measurement Device (GasPT), designed by GL, on a worldwide basis. According to the agreement, a percentage of sales is remitted back to DNV GL in the form of a royalty payment.
VE-Probe and VE Technology
On July 30, 2013, our Orbital subsidiary acquired exclusive worldwide rights to manufacture, sell, design, and otherwise market the VE Technology from its United Kingdom-based inventor, EnDet Ltd. The agreement, which includes ongoing royalty requirements, gives Orbital exclusive and sole control of all VE-based technology.
Virtual Power Systems and ICE®
CUI entered into a hardware agreement with Virtual Power Systems (VPS) to be the exclusive third-party design and development provider of ICE (Intelligent Control of Energy) products enabled by the VPS patented software system. The ICE system is a revolutionary Software Defined Power® solution that combines CUI’s hardware and Virtual Power Systems’ software into a platform that increases data centers' power infrastructure utilization. CUI has an exclusive three-year agreement with VPS, with the potential to extend the partnership for another two years.
Intellectual Property Protection
The Company relies on various intellectual property laws and contractual restrictions to protect its proprietary rights in products, logos and services. These include confidentiality, invention assignment and nondisclosure agreements with employees, contractors, suppliers and strategic partners. The confidentiality and nondisclosure agreements with employees, contractors and suppliers are in perpetuity or for a sufficient length of time so as to not threaten exposure of proprietary information.
Under the United States Trademark Act of 1946, as amended, and the system of international registration of trademarks governed by international treaties, the Madrid Agreement concerning the international registration of marks and the protocol relating to the Madrid Agreement, administered by the World Intellectual Property Organization, which maintains the international register and, in several instances, direct trademark registration in foreign countries, we and our subsidiaries actively maintain up to date the following trademarks: CUI INC, AMT, Novum, CUI Global, GasPT, IRIS, AMP, Architects of Modern Power, AMP Group, Solus, Total Power Solutions and Orbital Gas Systems.
The Company continuously reviews and updates the existing intellectual property filings and files new documentation both nationally and internationally (Patent Cooperation Treaty) in a continuing effort to maintain up-to-date protection of its intellectual property.
For those intellectual property applications pending, there is no assurance that the registrations will be granted. Furthermore, the Company is exposed to the risk that other parties may claim the Company infringes their existing patent and trademark rights, which could result in the Company’s inability to develop and market its products unless the Company enters into licensing agreements with the technology owner or could force the Company to engage in costly and potentially protracted litigation.
Competitive Business Conditions
The industries in which the company competes are very broad. We operate a commoditized power and electromechanical parts distribution business that is focused on efficiency of delivery and competitive pricing to differentiate our products from competitors. The market is subject to some volatility due to production requirements of larger global firms. We feel that our power and electromechanical parts distribution business is diverse and broad. We have very strong retail distribution partners that maximize our product exposure to new designs and small to medium sized customers. We focus on the OEM market and supply higher levels of support, customer service and a constantly expanding product line in order to further differentiate from our competitors. This product line ranges from a $0.02 connector to a several thousand dollar power solution – all different products for different customers. Additionally, we utilize third-party external sales representative organizations to penetrate new customers otherwise not readily available to the company.
CUI is becoming more recognized in the power supply market and has differentiated itself through technology with a foundation of legacy and product quality. As of December 31, 2017, our Power and Electromechanical segment accounted for approximately 77% of our revenues and our Energy segment accounted for approximately 23% of our revenues. We continue to add new products and technologies that will provide us the opportunity to compete outside of price and more on innovative technology and strategic partnerships.
From our portfolio of full-featured power supplies, we believe that we are competitive with market leaders in our space and that the market is ready for new technologies and new ideas. With the shift toward digitally-based power supplies accelerating, our strategy is to develop a true software-defined power ecosystem where the sum of the components is greater than its parts.
Similarly, the natural gas inferential metering device, the GasPT along with our VE Technology, competes in a mature industry with established competitors. There are significant investments being made globally into the natural gas extraction and transportation infrastructure. Our natural gas quality measurement system is a comparably low-cost solution to measuring natural gas quality as compared to our best competition. It can be connected to a natural gas system to provide a fast, accurate, close to real-time measurement of the physical properties, such as thermal conductivity, speed of sound and carbon dioxide content. From these measurements it infers an effective gas mixture comprising five components: methane, ethane, propane, nitrogen and measured carbon dioxide and then uses ISO6976 to calculate the gas quality characteristics of calorific value (CV), Wobbe index (WI), relative density (RD) and compression factor (Z). This technology has been certified for use in fiscal monitoring by Ofgem in the United Kingdom and SNAM RETE in Italy. There is no equivalent product competition. There are instruments like gas chromatographs that are technically competition, but they are slower and more complicated to use and as much as five times the installed price of the GasPT system.
Philanthropic Philosophy
In an industry first, CUI has chosen that, in addition to sales commission, many of our sales representative firms will also receive a charity commission to be donated to charities of their choice. One of CUI’s values is generosity, which includes philanthropic giving. We give in our local community and we want to also give in the communities in which we do business.
Item 1A. Risk Factors
RISK FACTORS
Our business is subject to various risks and uncertainties. Investors should read carefully the following factors as well as the cautionary statements referred to in ‘‘Forward-Looking Statements’’ herein. If any of the risks and uncertainties described below or elsewhere in this annual report on Form 10-K actually occur, the Company's business, financial condition or results of operations could be materially adversely affected.
Risks Related to Our Business and Products
Historically, we have generated annual losses from operations and we may need additional funding in the future.
Historically, on an annual basis, we have not generated sufficient revenues from operations to self-fund our capital and operating requirements. For the year ended 2017, we had a net loss of $12.6 million and our accumulated deficit as of December 31, 2017 was $108.6 million. If we are not able to generate sufficient income and cash flows from operations to fund our operations and growth plans, we may seek additional capital from equity and debt placements or corporate arrangements. Additional capital may not be available on terms favorable to us, or at all. If we raise additional funds by issuing equity securities, our shareholders may experience dilution. Debt financing, if available, may involve restrictive covenants or security interests in our assets. If we raise additional funds through collaboration arrangements with third parties, it may be necessary to relinquish some rights to technologies or products. If we are unable to raise adequate funds or generate them from operations, we may have to delay, reduce the scope of, or eliminate some or all of our growth plans or liquidate some or all of our assets.
There is no assurance we will achieve or sustain profitability.
For the year ended December 31, 2017, we had a net loss of $12.6 million. There is no assurance that we will achieve or sustain profitability. If we fail to achieve or sustain profitability, the price of our common stock could fall and our ability to raise additional capital could be adversely affected.
We have expanded our business activities and these activities may not be successful and may divert our resources from our existing business activities.
Our historical business was a commoditized power and electromechanical parts distribution business. In recent years, we have focused our business on the acquisition, development and commercialization of new and innovative technologies/products. We may not be successful in acquiring technologies that are commercially viable. We may fail to successfully develop or commercialize technologies that we acquire. Research, development and commercialization of such acquired technologies may disproportionately divert our resources from our other business activities.
If our manufacturers or our suppliers are unable to provide an adequate supply of products, our growth could be limited and our business could be harmed.
We rely on third parties to supply components for and to manufacture our products. In order to grow our business to achieve profitability, we will need our manufacturers and suppliers to increase, or scale up, production and supply by a significant factor over current levels. There are technical challenges to scaling up capacity that may require the investment of substantial additional funds by our manufacturers or suppliers and hiring and retaining additional management and technical personnel who have the necessary experience. If our manufacturers and suppliers are unable to do so, we may not be able to meet the requirements to grow our business to anticipated levels. We also may represent only a small portion of our supplier’s or manufacturer’s business, and if they become capacity constrained, they may choose to allocate their available resources to other customers that represent a larger portion of their business.
Our international operations are subject to increased risks, which could harm our business, operating results and financial condition.
Our ability to manage our business and conduct our operations internationally requires considerable management attention and resources and is subject to a number of risks, including the following:
|
• |
challenges caused by distance, language and cultural differences and by doing business with foreign agencies and governments; |
|
• |
longer payment cycles in some countries; |
|
• |
uncertainty regarding liability for services and content; |
|
• |
credit risk and higher levels of payment fraud; |
|
• |
currency exchange rate fluctuations and our ability to manage these fluctuations; |
|
• |
foreign exchange controls that might prevent us from repatriating cash earned in countries outside the U.S.; |
|
• |
import and export requirements that may prevent us from shipping products or providing services to a particular market and may increase our operating costs; |
|
• |
potentially adverse tax consequences; |
|
• |
higher costs associated with doing business internationally; |
|
• |
political, social and economic instability abroad, terrorist attacks and security concerns in general; |
|
• |
reduced or varied protection for intellectual property rights in some countries; and |
|
• |
different employee/employer relationships and the existence of workers’ councils and labor unions. |
In addition, compliance with complex foreign and U.S. laws and regulations that apply to our international operations increases our cost of doing business in international venues and could expose us or our employees to fines and penalties. These numerous and sometimes conflicting laws and regulations include import and export requirements, content requirements, trade restrictions, tax laws, sanctions, internal and disclosure control rules, data privacy requirements, labor relations laws, U.S. laws such as the Foreign Corrupt Practices Act and local laws prohibiting corrupt payments to governmental officials. Violations of these laws and regulations could result in fines, civil and criminal penalties against us, our officers or our employees, prohibitions on the conduct of our business and damage to our reputation. Any such violations could include prohibitions on our ability to offer our products and services in one or more countries and could also materially damage our reputation, our brand, our international expansion efforts, our ability to attract and retain employees, our business and our operating results.
Our revenues depend on key customers and suppliers.
The Company’s major product lines in 2017, 2016 and 2015 were power and electromechanical products and natural gas infrastructure and high-tech solutions.
During 2017, over 36% of revenues were derived from two customers, Digi-Key Electronics at 26% and Future Electronics at 10%. During 2016, over 19% of revenues were derived from one customer, Digi-Key Electronics. During 2015, over 31% of revenues were derived from two customers, Digi-Key Electronics at 20% and National Grid at 11%.
At December 31, 2017, of the gross trade accounts receivable totaling approximately $11.0 million, approximately 21% was due from two customers: GL Industrial Services UK Ltd. at 11% and Digi-Key Electronics at 10%. At December 31, 2016, of the gross trade accounts receivable totaling approximately $9.5 million, approximately 30% was due from three customers: Scotia Gas Networks plc at 10%, Socrate S.p.A. at 10%, and National Grid at 10%.
During 2017, the Company had one supplier concentration of 12% related to inventory product received.
With the United Kingdom operations of Orbital, the Company also has foreign revenue and trade accounts receivable concentrations in the United Kingdom of 17% and 28%, respectively as of and for the year ended December 31, 2017 and 20% and 27%, respectively as of and for the year ended December 31, 2016. Additionally, at December 31, 2017 the Company had accounts receivable concentrations of 11% in Canada and at December 31, 2016, the Company had accounts receivable concentrations of 11% in China and 10% in Italy.
There is no assurance that we will continue to maintain all of our existing key customers in the future. Should we, for any reason, discontinue our business relationship with any one of these key customers, the impact to our revenue stream would be substantial. For additional information on our concentrations, see Note 17 – Concentrations.
We rely on third-party distributors to generate a substantial part of our revenue and, if we fail to expand and manage our distribution channels, our revenues could decline and our growth prospects could suffer.
We derive a substantial portion of our revenues from sales of our power and electromechanical component products through distributors and we expect that sales through these distributors will represent a substantial portion of our revenues for the foreseeable future. Our ability to expand our distribution channels depends in part on our ability to educate our distributors about our products, which are complex. Many of our distributors have established relationships with our competitors. If our distributors choose to place greater emphasis on products and services of their own or those offered by our competitors, our ability to grow our business and sell our products may be adversely affected. If our distributors do not effectively market and sell our products, or if they fail to meet the needs of our customers, then our ability to grow our business and sell our products may be adversely affected. The loss of one or more of our larger distributors, which may cease marketing our products with limited or no notice and our possible inability to replace them, could adversely affect our sales. Our failure to recruit additional distributors or any reduction or delay in their sales of our products or conflicts between distributor sales and our direct sales and marketing activities could materially and adversely affect our results of operations.
We are a relatively small specialty component and solutions business and face formidable competition.
We are a relatively small company with limited capitalization in comparison to many of our international competitors in each of our business segments. Because of our size and capitalization, we believe that we have not yet established sufficient market awareness in our segments that is essential to our continued growth and success in all of our markets. We face formidable competition in every aspect of our business from other companies, many of whom have greater name recognition, more resources and broader product offerings than ours.
We also expect competition to intensify in the future. For example, the market for our power and electromechanical components and our inferential natural gas monitoring device, the GasPT, is emerging and is characterized by rapid technological change, evolving industry standards, frequent new product introductions and shortening product life cycles. Our future success in keeping pace with technological developments and achieving product acceptance depends upon our ability to enhance our current products and to continue to develop and introduce new product offerings and enhanced performance features and functionality on a timely basis at competitive prices. Our inability, for technological or other reasons, to enhance, develop, introduce or deliver compelling products in a timely manner, or at all, in response to changing market conditions, technologies or customer expectations, could have a material adverse effect on our operating results and growth prospects. Our ability to compete successfully will depend in large measure on our ability to maintain a technically skilled development and engineering staff and to adapt to technological changes and advances in the industry, including providing for the continued compatibility of our products with evolving industry standards and protocols in a competitive environment.
Acquisitions could result in operating difficulties, dilution and other harmful consequences.
We continue our process of integrating recent acquisitions into our own business model and we expect to continue to evaluate and enter into discussions regarding a wide array of potential strategic transactions. These transactions could be material to our financial condition and results of operations. The process of integrating an acquired company, business or technologies may create unforeseen operating difficulties and expenditures. The areas where we face risks include:
|
• |
implementation or remediation of controls, procedures and policies of the acquired company; |
|
• |
diversion of management time and focus from operating our business to acquisition integration challenges; |
|
• |
coordination of product, engineering and sales and marketing functions; |
|
• |
transition of operations, users and customers into our existing customs; |
|
• |
cultural challenges associated with integrating employees from the acquired company into our organization; |
|
• |
retention of employees from the businesses we acquire; |
|
• |
integration of the acquired company’s accounting, management information, human resource and other administrative systems; |
|
• |
liability for activities of the acquired company before the acquisition, including patent and trademark infringement claims, violations of laws, commercial disputes, tax liabilities and other known and unknown liabilities; |
|
• |
litigation or other claims in connection with the acquired company, including claims from terminated employees, customers, former shareholders, or other third parties; |
|
• |
in the case of foreign acquisitions, the need to integrate operations across different cultures and languages and to address the particular economic, currency, political and regulatory risks associated with specific countries; |
|
• |
failure to successfully further develop the acquired technologies; and |
|
• |
other as yet unknown risks that may impact our business. |
Our failure to address these risks or other problems encountered in connection with our past or future acquisitions could cause us to fail to realize the anticipated benefits of such acquisitions, incur unanticipated liabilities and harm our business generally. For example, a majority of Orbital’s revenues for each of its last two fiscal years has come from a few customers. If we fail to continue to do business with Orbital’s primary customers at substantially similar or greater levels than recent historical levels, our financial condition, results of operations and growth prospects would be significantly harmed.
Future acquisitions could also result in dilutive issuances of our equity securities, the incurrence of debt, contingent liabilities or amortization expenses, write-offs of goodwill, or reductions to our tangible net worth any of which could harm our business, financial condition, results of operations and prospects. Also, the anticipated benefit of many of our acquisitions may not materialize.
We will need to grow our organization and we may encounter difficulties in managing this growth.
As of December 31, 2017, CUI Global, Inc., together with its consolidated subsidiaries, had 333 full-time employees. We expect to experience growth in the number of our employees and the scope of our operations as we follow our growth strategy. To manage our anticipated future growth, we must continue to implement and improve our managerial, operational and financial systems, expand our facilities and continue to recruit and train additional qualified personnel. Also, our management may need to divert a disproportionate amount of its attention away from our day-to-day activities and devote a substantial amount of time to managing these growth activities. Due to our limited resources, we may not be able to effectively manage the expansion of our operations or recruit and train additional qualified personnel, which may result in weaknesses in our infrastructure, give rise to operational mistakes, loss of business opportunities, loss of employees and reduced productivity among remaining employees. The physical expansion of our operations may lead to significant costs and may divert financial resources from other projects, such as the development of new products. If our management is unable to effectively manage our expected growth, our expenses may increase more than expected, our ability to generate or increase our revenue could be reduced and we may not be able to implement our business strategy. Our future financial performance and our ability to commercialize new products and compete effectively will depend, in part, on our ability to effectively manage any future growth.
Our operating results will vary over time and such fluctuations could cause the market price of our common stock to decline.
Our operating results may fluctuate significantly due to a variety of factors, many of which are outside of our control. Because revenues for any future period are not predictable with any significant degree of certainty, you should not rely on our past results as an indication of our future performance. If our revenues or operating results fall below the expectations of investors or securities analysts or below any estimates we may provide to the market, the price of our common shares would likely decline substantially. Factors that could cause our operating results and stock price to fluctuate include:
|
• |
varying demand for our products due to the financial and operating condition of our distributors and their customers, distributor inventory management practices and general economic conditions; |
|
• |
inability of our contract manufacturers and suppliers to meet our demand; |
|
• |
success and timing of new product introductions by us and the performance of our products generally; |
|
• |
announcements by us or our competitors regarding products, promotions or other transactions; |
|
• |
costs related to responding to government inquiries related to regulatory compliance; |
|
• |
our ability to control and reduce product costs; |
|
• |
changes in the manner in which we sell products; |
|
• |
volatility in foreign exchange rates, changes in interest rates and/or the availability and cost of financing or other working capital to our distributors and their customers; and |
|
• |
the impact of write downs of excess and obsolete inventory. |
Our operating expenses will increase as we make further expenditures to enhance and expand our operations in order to support additional growth in our business and national stock market reporting and compliance obligations.
Historically, we limited our investment in operations, but in the future, we expect our operations and marketing investments to increase substantially to support our anticipated growth and as a result of our listing on the NASDAQ Stock Market. We are making significant investments in using more professional services and expanding our operations outside the United States. We intend to make additional investments in personnel and continue to expand our operations to support anticipated growth in our business. In addition, we may determine the need in the future to build a direct sales force to market and sell our products or provide additional resources or cooperative funds to our distributors. Such changes to our existing sales model would likely result in higher selling, general and administrative expenses as a percentage of our revenues. We expect our increased investments to adversely affect operating income in the short term while providing long-term benefit.
Our business depends on a strong brand and failing to maintain and enhance our brand would hurt our ability to expand our base of distributors, customers and end-users.
We believe that we have not yet established sufficient market awareness in our various markets. Market awareness of our capabilities and products is essential to our continued growth and our success in all of our markets. We expect the brand identity that we have developed through CUI, GasPT, Orbital Gas Systems, IRIS, ICE, and AMT to significantly contribute to the success of our business. Maintaining and enhancing these brands is critical to expanding our base of distributors, customers and end-users. If we fail to maintain and enhance our brands, or if we incur excessive expenses in this effort, our business, operating results and financial condition will be materially and adversely affected. Maintaining and enhancing our brands will depend largely on our ability to be a technology leader and continue to provide high-quality products, which we may not do successfully.
New entrants and the introduction of other distribution models in our markets may harm our competitive position.
The markets for development, distribution and sale of our products are rapidly evolving. New entrants seeking to gain market share by introducing new technology and new products may make it more difficult for us to sell our products and could create increased pricing pressure, reduced profit margins, increased sales and marketing expenses or the loss of market share or expected market share, any of which may significantly harm our business, operating results and financial condition.
Adverse conditions in the global economy and disruption of financial markets may significantly restrict our ability to generate revenues or obtain debt or equity financing.
The global economy continues to experience volatility and uncertainty and governments in many countries continue to evaluate and implement spending cuts designed to reduce budget deficits. These conditions and deficit reduction measures could reduce demand for our products and services, including through reduced government infrastructure projects, which would significantly jeopardize our ability to achieve our sales targets. These conditions could also affect our potential strategic partners, which in turn, could make it more difficult to execute a strategic collaboration. Moreover, volatility and disruption of financial markets could limit our customers’ ability to obtain adequate financing or credit to purchase and pay for our products and services in a timely manner, or to maintain operations and result in a decrease in sales volume. General concerns about the fundamental soundness of domestic and international economies may also cause customers to reduce purchases. Changes in governmental banking, monetary and fiscal policies to restore liquidity and increase credit availability may not be effective. Economic conditions and market turbulence may also impact our suppliers’ ability to supply sufficient quantities of product components in a timely manner, which could impair our ability to fulfill sales orders. It is difficult to determine the extent of the economic and financial market problems and the many ways in which they may affect our suppliers, customers, investors and business in general. Continuation or further deterioration of these financial and macroeconomic conditions could significantly harm sales, profitability and results of operations.
One of our subsidiaries and certain suppliers are in Japan and located in areas subject to natural disasters or other events that could stop us from having our products made or shipped or could result in a substantial delay in our production or development activities.
We have sales, development and manufacturing resources in Japan. The risk of earthquakes, typhoons and other natural disasters in this geographic area is significant due to the proximity of major earthquake fault lines. Despite precautions taken by us and our third-party providers, a natural disaster or other unanticipated problems, at our location in Japan or at third-party providers could cause interruptions in the products that we provide. Any disruption resulting from these events could cause significant delays in shipments of our products until we are able to shift our manufacturing, assembly or testing from the affected contractor(s) to another third-party vendor. We cannot assure you that alternative capacity could be obtained on favorable terms, if at all.
Defects in our products could harm our reputation and business.
Our products are complex and have contained and may contain undetected defects or errors, especially when first introduced or when new versions are released. Defects in our products may lead to product returns and require us to implement design changes or updates.
Any defects or errors in our products, or the perception of such defects or errors, could result in:
|
• |
expenditure of significant financial and product development resources in efforts to analyze, correct, eliminate or work around errors or defects; |
|
• |
loss of existing or potential customers or distributors; |
|
• |
delayed or lost revenue; |
|
• |
delay or failure to attain market acceptance; |
|
• |
delay in the development or release of new products or services; |
|
• |
negative publicity, which will harm our reputation; |
|
• |
warranty claims against us; |
|
• |
an increase in collection cycles for accounts receivable, which could result in an increase in our provision for doubtful accounts and the risk of costly litigation; and |
|
• |
harm to our results of operations. |
We and our contract manufacturers purchase some components, subassemblies and products from a limited number of suppliers. The loss of any of these suppliers may substantially disrupt our ability to obtain orders and fulfill sales as we design and qualify new components.
We rely on third-party components and technology to build and operate our products and we rely on our contract manufacturers to obtain the components, subassemblies and products necessary for the manufacture of our products. Shortages in components that we use in our products are possible and our ability to predict the availability of such components is limited. If shortages occur in the future, as they have in the past, our business, operating results and financial condition would be materially adversely affected. Unpredictable price increases of such components due to market demand may occur. While components and supplies are generally available from a variety of sources, we and our contract manufacturers currently depend on a single or limited number of suppliers for several components for our products. If our suppliers of these components or technology were to enter into exclusive relationships with other providers or were to discontinue providing such components and technology to us and we were unable to replace them cost effectively, or at all, our ability to provide our products would be impaired. Therefore, we may be unable to meet customer demand for our products, which would have a material adverse effect on our business, operating results and financial condition.
We depend on key personnel and will need to recruit new personnel as our business grows.
As a small company, our future success depends in a large part upon the continued service of key members of our senior management team who are critical to the overall management of CUI Global and our subsidiary companies, Orbital, Orbital Gas Systems, North America, Inc., CUI Inc., CUI Japan, and CUI-Canada as well as the development of our technologies, our business culture and our strategic direction. The loss of any of our management or key personnel could seriously harm our business and we do not maintain any key-person life insurance policies on the lives of these critical individuals.
If we are successful in expanding our product and customer base, we will need to add additional key personnel as our business continues to grow. If we cannot attract and retain enough qualified and skilled staff, the growth of the business may be limited. Our ability to provide services to customers and expand our business depends, in part, on our ability to attract and retain staff with professional experiences that are relevant to technology development and other functions the Company performs. Competition for personnel with these skills is intense. We may not be able to recruit or retain the caliber of staff required to carry out essential functions at the pace necessary to sustain or expand our business.
We believe our future success will depend in part on the following:
|
• |
the continued employment and performance of our senior management; |
|
• |
our ability to retain and motivate our officers and key employees; and |
|
• |
our ability to identify, attract, hire, train, retain and motivate other highly skilled technical, managerial, marketing, sales and customer service personnel. |
Risks Related to Our Intellectual Property and Technology
If we fail to protect our intellectual property rights adequately, our ability to compete effectively or to defend ourselves from litigation could be impaired.
We rely primarily on patent, copyright, trademark and trade secret laws, as well as confidentiality and non-disclosure agreements and other methods, to protect our proprietary technologies and know-how. Given the costs of obtaining patent protection, we may choose not to protect certain innovations that later turn out to be important. Furthermore, there is always the possibility, despite our efforts, that the scope of the protection gained will be insufficient or that an issued patent may be deemed invalid or unenforceable. We license a significant amount of our underlying intellectual property from third parties, i.e., AMT Encoder Technology, Novum Digital Point of Load Technology, ICE Technology, GasPT Technology and VE Technology. The loss of our rights as a licensee under any of these or future technology licensing arrangements, or the exclusivity provisions of these agreements, could have a material adverse impact upon our financial position and results of operations.
Monitoring unauthorized use of our intellectual property is difficult and costly. Unauthorized use of our intellectual property may occur in the future without our knowledge. The steps we have taken may not prevent unauthorized use of our intellectual property. Further, we may not be able to detect unauthorized use of, or take appropriate steps to enforce our intellectual property rights. Our competitors may also independently develop similar technology. Our failure to effectively protect our intellectual property could reduce the value of our technology in licensing arrangements or in cross-licensing negotiations and could impair our ability to compete. Any failure by us to meaningfully protect our intellectual property could result in competitors offering products that incorporate our most technologically advanced features, which could seriously reduce demand for our products.
In the future we may need to initiate infringement claims or litigation. Litigation, whether we are a plaintiff or a defendant, can be expensive and time-consuming and may divert the efforts of our technical staff and managerial personnel, which could result in lower revenues and higher expenses, whether or not such litigation results in a determination favorable to us.
Confidentiality agreements with employees and others may not adequately prevent disclosure of our trade secrets and other proprietary information.
We have devoted substantial resources to the development of our proprietary technology and trade secrets. In order to protect our proprietary technology and trade secrets, we rely in part on confidentiality agreements with our key employees, licensees, independent contractors and other advisors. These agreements may not effectively prevent disclosure of our trade secrets and may not provide an adequate remedy in the event of unauthorized disclosure of our trade secrets. We may have difficulty enforcing our rights to our proprietary technology and trade secrets, which could have a material adverse effect on our business, operating results and financial condition. In addition, others may independently discover trade secrets and proprietary information and in such cases we could not assert any trade secret rights against such parties. Costly and time consuming litigation could be necessary to determine and enforce the scope of our proprietary rights and failure to obtain or maintain trade secret protection could adversely affect our competitive business position.
If a third party asserts that we are infringing on its intellectual property, whether successful or not, it could subject us to costly and time-consuming litigation and our business may be adversely affected.
The technology industry is characterized by the existence of a large number of patents, trademarks and copyrights and by frequent litigation based on allegations of infringement or other violations of intellectual property rights. Third parties may assert patent and other intellectual property infringement claims against us or the parties from whom we license our technological rights in the form of lawsuits, letters or other forms of communication. These claims, whether or not successful, could:
|
• |
divert management’s attention; |
|
• |
result in costly and time-consuming litigation; |
|
• |
require us to enter into royalty or licensing agreements, which may not be available on acceptable terms, or at all; and |
|
• |
require us to redesign our products to avoid infringement. |
As a result, any third-party intellectual property claims against us could increase our expenses and adversely affect our business. Even if we have not infringed any third parties’ intellectual property rights, we cannot be sure our legal defenses will be successful and even if we are successful in defending against such claims, our legal defense could require significant financial resources and management time. Finally, if a third party successfully asserts a claim that our products infringe its proprietary rights, royalty or licensing agreements might not be available on terms we find acceptable or at all and we may be required to pay significant monetary damages to such third party.
If our contract manufacturers do not respect our intellectual property and trade secrets, our business, operating results and financial condition could be materially adversely affected.
Because most of our contract manufacturers operate outside the United States, where prosecution of intellectual property infringement and trade secret theft is more difficult than in the United States, certain of our contract manufacturers, their affiliates, their other customers or their suppliers may attempt to use our intellectual property and trade secrets to manufacture our products for themselves or others without our knowledge. Although we attempt to enter into agreements with our manufacturers to preclude them from using our intellectual property and trade secrets, we may be unsuccessful in monitoring and enforcing our intellectual property rights. Although we take steps to stop counterfeits, we may not be successful and customers who purchase these counterfeit goods may have a bad experience and our brand may be harmed. If such an impermissible use of our intellectual property or trade secrets were to occur, our ability to sell our products at competitive prices and to be the sole provider of our products may be adversely affected and our business, operating results and financial condition could be materially and adversely affected.
Risks Related to Our Common Stock
Our common stock price may be volatile, which could result in substantial losses for individual shareholders.
The market price for the Company’s common stock is volatile and subject to wide fluctuations in response to factors, including the following, some of which are beyond our control, which means our market price could be depressed and could impair our ability to raise capital:
|
• |
actual or anticipated variations in our quarterly operating results; |
|
• |
announcements of technological innovations or new products or services by the Company or our competitors; |
|
• |
conditions or trends relating to our gas technologies or power and electromechanical technologies; |
|
• |
changes in the economic performance and/or market valuations of other power and electromechanical, electronic component, industrial controls, gas metering, monitoring and sampling related companies; |
|
• |
conditions or trends relating to the marketing, sale or distribution of power and electromechanical components and industrial controls to OEM manufacturing customers; |
|
• |
changes in the economic performance and/or market valuations of other inferential natural gas monitoring device or power and electromechanical components and industrial electronic component related companies; |
|
• |
additions or departures of key personnel; |
|
• |
fluctuations of the stock market as a whole; |
|
• |
announcements about our earnings that are not in line with expectations; |
|
• |
announcements by our competitors of their earnings that are not in line with expectations; |
|
• |
the volume of shares of common stock available for public sale; |
|
• |
sales of stock by us or by our shareholders; |
|
• |
short sales, hedging and other derivative transactions on shares of our common stock; |
|
• |
our ability to retain existing customers, attract new customers and satisfy our customers’ requirements; |
|
• |
general economic conditions; |
|
• |
changes in our pricing policies; |
|
• |
our ability to expand our business; |
|
• |
the effectiveness of our personnel; |
|
• |
new product and service introductions; |
|
• |
technical difficulties or interruptions in our services; |
|
• |
the timing of additional investments in our products; |
|
• |
regulatory compliance costs; |
|
• |
costs associated with future acquisitions of technologies and businesses; and |
|
• |
extraordinary expenses such as litigation or other dispute-related settlement payments. |
These factors may materially and adversely affect the market price of our common stock, regardless of our performance. In addition, the stock market in general and the market for technology companies in particular, have experienced extreme price and volume fluctuations that have often been unrelated or disproportionate to the operating performance of those companies. These broad market and industry factors may seriously harm the market price of our common stock, regardless of our actual operating performance. Additionally, because the trading volume of our stock is not large, there can be a disparity between the bid and the asked price that may not be indicative of the stock’s true value.
Offers or availability for sale of a substantial number of shares of our common stock may cause the price of our common stock to decline.
Sales of a significant number of shares of our common stock in the public market could harm the market price of our common stock and make it more difficult for us to raise funds through future offerings of common stock.
We have never paid dividends on our common stock and do not expect to pay any in the foreseeable future.
Potential purchasers should not expect to receive a return on their investment in the form of dividends on our common stock. The Company has never paid cash dividends on its common stock and the Company does not expect to pay dividends in the foreseeable future.
We currently anticipate that we will retain future earnings for the development, operation and expansion of our business and do not anticipate declaring or paying any cash dividends for the foreseeable future. Our payment of any future dividends will be at the discretion of our board of directors after taking into account various factors, including but not limited to our financial condition, operating results, cash needs, growth plans and the terms of any credit agreements that we may be a party to at the time. Our ability to pay dividends may be further restricted by the terms of any of our future debt or preferred securities. Accordingly, investors must rely on sales of their own common stock after price appreciation, which may never occur, as the only way to realize their investment. Investors seeking cash dividends should not purchase shares of our stock.
There is a limited public trading market for our common stock so you may not be able to resell your stock and may not be able to turn your investment into cash.
Our common stock is currently traded on the NASDAQ Stock Market under the trading symbol ‘‘CUI.’’ Our shares of common stock are thinly traded. Due to the illiquidity, the market price may not accurately reflect our relative value. There can be no assurance that there will be an active market for our shares of common stock either now or in the future. Because our common stock is thinly traded, a large block of shares traded can lead to a dramatic fluctuation in the share price and investors may not be able to liquidate their investment in us at all or at a price that reflects the value of the business.
Risks Relating to Shareholder Rights
Our board of directors has the authority, without shareholder approval, to issue preferred stock with terms that may not be beneficial to existing common shareholders and with the ability to adversely affect shareholder voting power and perpetuate their control.
Although we do not have any preferred stock outstanding presently, our Articles of Incorporation allow us to issue shares of preferred stock without any vote or further action by our shareholders. Our board of directors has the authority to issue preferred stock without further shareholder approval, as well as the authority to fix and determine the relative rights and preferences of preferred stock. As a result, our board of directors could authorize the issuance of a series of preferred stock that would grant to holders the preferred right to our assets upon liquidation, the right to receive dividend payments before dividends are distributed to the holders of common stock or other preferred shareholders and the right to the redemption of the shares, together with a premium, prior to the redemption of our common stock.
Preferred stock could be used to dilute a potential hostile acquirer. Accordingly, any future issuance of preferred stock or any rights to purchase preferred shares may have the effect of making it more difficult for a third party to acquire control of us. This may delay, defer or prevent a change of control or an unsolicited acquisition proposal. The issuance of preferred stock also could decrease the amount of earnings attributable to and assets available for distribution to, the holders of our common stock and could adversely affect the rights and powers, including voting rights, of the holders of our common stock and preferred stock.
Our Articles of Incorporation limits director liability, thereby making it difficult to bring any action against them for breach of fiduciary duty.
CUI Global, Inc. is a Colorado corporation. As permitted by Colorado law, the Company’s Articles of Incorporation limits the liability of directors to CUI Global, Inc. or its shareholders for monetary damages for breach of a director’s fiduciary duty, with certain exceptions. These provisions may discourage shareholders from bringing suit against a director for breach of fiduciary duty and may reduce the likelihood of derivative litigation brought by shareholders on behalf of the Company against a director.
Our charter documents and note outstanding to IED, Inc. may inhibit a takeover that shareholders consider favorable.
Provisions of our Articles of Incorporation and Bylaws may delay or discourage transactions involving an actual or potential change in control of the Company, including transactions in which shareholders might otherwise receive a premium for their shares, or transactions that our shareholders might otherwise deem to be in their best interests. These provisions:
|
• |
provide that the authorized number of directors may be changed by resolution of the board of directors; |
|
• |
provide that all vacancies, including newly created directorships, may, except as otherwise required by law, be filled by the affirmative vote of a majority of directors then in office, even if less than a quorum; and |
|
• |
do not provide for cumulative voting rights. |
CUI Global issued a note to IED, Inc. in connection with our acquisition of CUI Inc. The note provides that, for so long as any obligations are outstanding under the note, IED will have a right to match any bona fide offer from a third party to acquire CUI Inc. by any means. This matching right could discourage third parties from making an offer to acquire us, which would involve indirectly acquiring CUI Inc., or from acquiring CUI Inc. directly, in a transaction our shareholders might find advantageous because any such offer could be matched by IED and result in the third party utilizing time and resources to formulate an offer without being able to complete a transaction.
Risks Related to Our 2013 Acquisition of Orbital Gas Systems Ltd. in the United Kingdom, and our March 2015 Acquisition of CUI-Canada
A significant portion of our total assets at Orbital Gas Systems Ltd. consists of goodwill, which is subject to periodic impairment analysis, and a significant impairment determination in any future period could have an adverse effect on our results of operations even without a significant loss of revenue or increase in cash expenses attributable to such period.
As of December 31, 2017, we have goodwill totaling approximately $4.6 million associated with the acquisition of Orbital Gas Systems Ltd and CUI-Canada. We are required to evaluate this goodwill for impairment based on the fair value of the operating business units to which this goodwill relates, at least once a year. This estimated fair value could change if we are unable to achieve operating results at the levels that have been forecasted, the market valuation of those business units decreases based on transactions involving similar companies, or there is a permanent, negative change in the market demand for the services offered by the business units. These changes could result in an impairment of the existing goodwill balance that could require a material non-cash charge to our results of operations. See Note 2 - Summary of Significant Accounting Policies - Indefinite-Lived Intangibles and Goodwill Assets for more information on the Company’s goodwill impairment testing and the $3.2 million impairment taken against goodwill in 2017.
Our operating results may be affected by fluctuations in foreign currency exchange rates, which may affect our operating results in U.S. dollar terms.
A portion of our revenue arises from our international operations and we anticipate that, as we grow, our revenues from international operations will increase. Revenues generated and expenses incurred by our international operations are often denominated in foreign currencies. As a result, our consolidated U.S. dollar financial statements are subject to fluctuations due to changes in exchange rates as revenues and expenses of our international operations are translated from local currencies into U.S. dollars. In addition, our financial results are subject to changes in exchange rates that impact the settlement of transactions. The Company does not currently undertake any hedges to protect against adverse foreign currency exposure.
The United Kingdom’s proposed withdrawal from the European Union could have an adverse effect on our business and financial results.
On June 23, 2016, a referendum was held in the United Kingdom to determine whether the country should remain a member of the European Union, with voters approving to withdraw from the EU (commonly referred to as Brexit). The UK is currently scheduled to depart on March 29, 2019. Following the referendum, the UK government began discussions with the EU on the terms and conditions of the withdrawal from the EU and on terms of a transition period to December 31, 2020 proposed by the EU but not yet agreed upon. Current uncertainty over the final outcome of the negotiations between the UK and EU, could have an adverse effect on our business and financial results. The long-term effects of Brexit will depend on the terms negotiated between the UK and the EU, which may take years to complete. Our Orbital operations in the UK could be impacted by the global economic uncertainty caused by Brexit.
The announcement of Brexit caused significant volatility in global stock markets and currency exchange rate fluctuations that resulted in the strengthening of the U.S. dollar against foreign currencies in which we conduct business. Volatility in exchange rates is expected to continue in the short term and a strong U.S. dollar relative to the British pound and other currencies may adversely affect our results of operations. During periods of a strengthening dollar, the local currency results of our international operations may translate into fewer U.S. dollars. Uncertainty over Brexit and currency fluctuations could also impact our customers, who may curtail or postpone near-term capital investments or take other actions that adversely affect the growth of our volume and revenue streams from these customers.
In addition, Brexit could lead to legal uncertainty and potentially divergent national laws and regulations as the UK determines which EU laws to replace or replicate. Our UK operations may incur additional costs and expenses as we adapt to potentially divergent regulatory frameworks from the rest of the EU.
The UK may need to adopt specific legislation and apply for regulatory authorization and permission in separate EU member states. This may impact our overall business opportunities to operate in the EU and UK seamlessly. These added challenges may impact our customers' overall business, which may impact our volume and revenue.
Any of these effects of Brexit, among others, could adversely affect our business and financial results.
Our gas quality inferential measurement device, GasPT®, has not gained market acceptance as rapidly as we anticipated.
Our future financial performance and ability to commercialize the GasPT device and compete successfully will depend on our ability to effectively manage acceptance and introduction of our GasPT device in the natural gas quality inferential measurement device market. Although we have entered into agreements and letters of understanding with third parties, which could result in substantial sales of the GasPT device over the next several years, there is no assurance we will sell at or near the number of units forecasted under these contracts.
Several factors have and may continue to contribute to the slower than anticipated market acceptance of the GasPT device, such as: disruptive technologies, such as the GasPT device, are slow to be accepted in a mature industry, such as natural gas distribution; extensive testing and research required by large natural gas distribution customers takes an extended period of time before such potential customers place firm orders; macro-economic issues in the natural gas industry may slow or impede capital expenditures; registration, regulatory approvals, certifications and licensing requirements in foreign countries.
Our strategy has been to establish market acceptance and credibility with potential customers through a campaign of product exposure and disclosure of highly acceptable test results of recognized international testing laboratories along with industry seminars, conventions, trade shows, professional periodicals and public relations. While we believe that the base has been laid for substantial sales of our GasPT device over the next several years, there is no assurance that our strategy and efforts will be successful.
Item 1B. Unresolved Staff Comments
None.
Item 2. Properties
During September 2013, our wholly owned subsidiary, CUI Properties, LLC, signed closing documents on the purchase of our Tualatin, Oregon corporate office real estate located at 20050 SW 112th Avenue in the Tualatin Franklin Business Park. In addition to the corporate office, the property also includes the Company’s warehouse facility for CUI Inc. The purchase price for this acquisition was $5.1 million and was partially funded by a promissory note payable to Wells Fargo Bank in the amount of $3.7 million plus interest at the rate of 2.0% above LIBOR, payable over ten years.
In January 2015, the Company entered into a three-year lease for our 13,175 square foot Houston facility. In November 2017, the Company relocated to a larger rented office and warehouse space in Houston, TX, of approximately 40,000 square feet that runs until 2022.
In March 2015, as part of the Tectrol (CUI-Canada) acquisition, the Company leased a 73,700 square foot manufacturing facility in Toronto, Canada that runs until 2020.
In September 2015, Orbital completed the construction of a new 46,000 square foot state-of-the-art manufacturing/administration/research and development facility on its existing site in the UK to supplement existing office space. This enhanced onsite facility enabled the Company to not renew its lease on an additional building it was leasing for manufacturing and office space requirements.
Additionally, CUI Japan has leased space in Tokyo, Japan, which is used as a sales office and is leased through March 2020.
The Company has enough manufacturing and office capacity to meet its business needs for the foreseeable future.
Item 3. Legal Proceedings
The Company and its subsidiaries are not parties in any legal proceedings. No director, officer or affiliate of the Company, any owner of record or beneficially of more than five percent of any class of voting securities of the Company or any associate of any such director, officer, affiliate of the Company or security holder is a party adverse to the Company or any of its subsidiaries or has a material interest adverse to the Company or any of its subsidiaries.
Item 4. Mine Safety Disclosure
Not applicable.
PART II
Item 5. Market for Registrant’s Common Equity, Related Stockholder Matters and Issuer Purchases of Equity Securities
Description of Securities
The Company’s Common Stock is traded on The NASDAQ Stock Market under the trading symbol ‘‘CUI.’’ The Company currently has authorized 325,000,000 common shares, par value $0.001 per share, and as of December 31, 2017, the Company’s issued and outstanding shares consisted of 28,406,856 shares of common stock of which 27,890,719 shares are freely tradable without restriction or limitation under the Securities Act. As of December 31, 2017, the Company had in excess of 3,000 beneficial holders of our common stock and in excess of 2,300 shareholders of record. The actual number of shareholders is greater than this number of record holders and includes shareholders who are beneficial owners, but whose shares are held in street name by brokers and other nominees.
The holders of Common Stock are entitled to one vote per share and do not have cumulative voting rights. Holders of the Company’s Common Stock do not have any pre-emptive or other rights to subscribe for or purchase additional shares of capital stock and no conversion rights, redemption or sinking-fund provisions.
Market Value
The Company’s Common Stock is traded on the NASDAQ Stock Market under the trading symbol ‘‘CUI.’’ The following table sets forth, the high and low sales prices of our Common Stock on the NASDAQ during each quarter of the two most recent years.
|
High |
Low |
|||||||
|
2017 |
||||||||
|
First Quarter |
$ | 6.90 | $ | 4.31 | ||||
|
Second Quarter |
4.93 | 3.17 | ||||||
|
Third Quarter |
4.12 | 3.01 | ||||||
|
Fourth Quarter |
4.35 | 2.44 | ||||||
|
2016 |
||||||||
|
First Quarter |
$ | 9.42 | $ | 6.18 | ||||
|
Second Quarter |
8.40 | 4.85 | ||||||
|
Third Quarter |
6.14 | 4.01 | ||||||
|
Fourth Quarter |
7.39 | 4.30 | ||||||
Stock Performance Graph
The following graph compares the performance of our common stock to the performance of the NASDAQ Composite Index and the Russell 2000 Index. The Russell 2000 Index measures the performance of the small-cap segment of the U.S. equity markets. The comparisons in the chart below are provided in response to SEC disclosure requirements and are not intended to forecast or be indicative of future performance of our common stock. We issued 7,392,856 shares in October 2017, which increased the total number of shares outstanding by about 35% and this had a dilutive effect on the share price as reflected in the following graph.
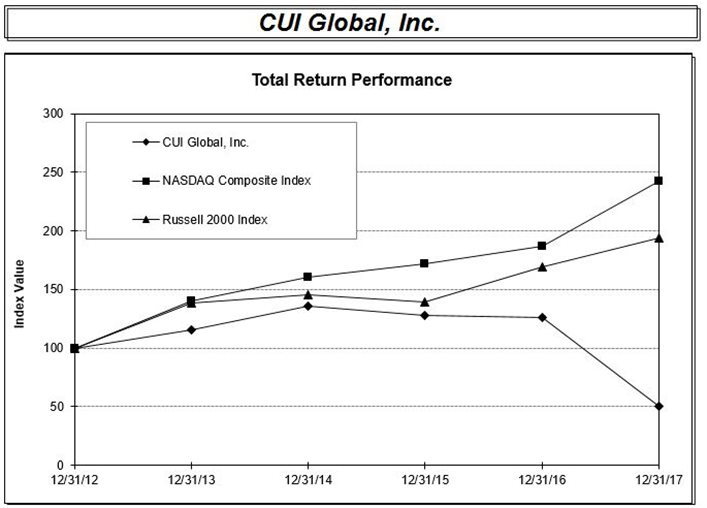
|
Period Ending |
||||||||||||||||||||||||
|
Index |
12/31/2012 * |
12/31/2013 |
12/31/2014 |
12/31/2015 |
12/31/2016 |
12/31/2017 |
||||||||||||||||||
|
CUI Global, Inc. |
$ | 100.00 | $ | 115.12 | $ | 135.70 | $ | 128.23 | $ | 126.23 | $ | 50.09 | ||||||||||||
|
NASDAQ Composite |
100.00 | 140.12 | 160.78 | 171.97 | 187.22 | 242.71 | ||||||||||||||||||
|
Russell 2000 |
100.00 | 138.82 | 145.62 | 139.19 | 168.85 | 193.58 | ||||||||||||||||||
* Assumed $100 invested on 12/31/2012 in stock or index, including reinvestment of dividends. Fiscal year ended December 31.
Source: SNL Financial LC, Charlottesville, VA
©2018
Dividend Policy
The Company has never paid cash dividends on its Common Stock and the Company does not expect to pay dividends in the foreseeable future.
We currently expect to retain future earnings to finance the growth and development of our business. The timing, amount and form of future dividends, if any, will depend on, among other things, our future results of operations and cash flows; our general financial condition and future prospects; our capital requirements and surplus; contractual restrictions; the amount of distributions, if any, received by us from our subsidiaries; and other factors deemed relevant by our board of directors. Any future dividends on our common shares would be declared by and subject to the discretion of our board of directors.
Common Stock Reserved for Future Issuances
Set forth below is a summary of the outstanding securities, transactions and agreements, which relate to 964,180 shares of common stock the Company is required to reserve for potential future issuances.
|
• |
964,180 common shares reserved for outstanding options issued under our Equity Compensation Plans. |
| As of December 31, 2017, there were reserved for issuance an aggregate of 964,180 shares of common stock for options outstanding under the Company’s 2008 Equity Incentive Plan and the Company’s 2009 Equity Incentive Plan (Executive). |
|
• |
1,526,439 common shares authorized for issuance under our Equity Compensation Plans. |
| As of December 31, 2017, the Company has 1,526,439 common shares authorized and available for issuance under the Company option plans. |
Other than as described herein, as of the date of this report, there are currently no plans, arrangements, commitments or understandings for the issuance of additional shares of Common Stock.
RECENT SALES OF UNREGISTERED SECURITIES
Following is a list of all securities we sold within the past three years, which were not registered under the Securities Act. The Company relied on Section 4(2) of the Securities Act of 1933 as the basis for an exemption from registration for the following issuances.
2017 Sales of Unregistered Securities
Common Stock Issued During 2017
|
(Dollars in thousands) |
||||||||||||||||
|
Dates of |
Type of |
Expense/ |
Stock issuance recipient |
Reason for issuance |
Total no. |
Grant date |
||||||||||
|
January, April, August and October 2017 |
Vested restricted common stock |
Expense |
Four board members |
Director compensation |
49,980 | $ | 200 | |||||||||
|
January, February and June 2017 |
Common stock |
Expense |
Three Employees |
Approved bonuses |
28,634 | 182 | (1) | |||||||||
|
January and December 2017 |
Common stock |
Expense |
Related party, James McKenzie |
Pursuant to royalty agreement |
3,293 | 16 | (1) | |||||||||
|
January and February 2017 |
Common stock |
Expense |
Two Employees |
Cashless stock option exercises |
245 | — | (2) | |||||||||
|
May 2017 |
Common stock |
Prepaid expense/expense |
Third-party consultant |
Strategic investor marketing services |
15,000 | 57 | (3) | |||||||||
|
Total 2017 issuances |
97,152 | $ | 455 | (4)(5) | ||||||||||||
|
(1) |
Includes bonuses and royalty of $176 thousand that were accrued and expensed in 2016. |
|
(2) |
The Company received $0 for the issuance in the cashless option exercises. |
|
(3) |
Amount includes $24 thousand that was included in prepaid expense at December 31, 2017. |
|
(4) |
Does not include stock expense of $170 thousand included in accrued liabilities at December 31, 2017 for unissued stock. |
|
(5) |
Does not include registered 7,392,856 shares issued in October 2017 via the S-3 registration statement. See Note 12. Shareholders' Equity for more information on the October share issuances. |
2016 Sales of Unregistered Securities
Common Stock Issued During 2016
|
(Dollars in thousands) |
||||||||||||||||
|
Date of issuance |
Type of issuance |
Expense/ Prepaid/ Cash |
Stock issuance recipient |
Reason for issuance |
Total no. of shares |
Grant date fair value recorded at issuance |
||||||||||
|
January, April, July and October 2016 |
Vested restricted common stock |
Expense |
Five board members |
Director compensation |
46,854 | $ | 267 | (1) | ||||||||
|
January and July 2016 |
Vested restricted common stock |
Expense |
Four Employees |
Approved bonuses |
56,782 | 381 | (2) | |||||||||
|
January, March, September and December 2016 |
Common stock |
Expense |
Related party, James McKenzie |
Pursuant to royalty agreement |
6,275 | 38 | ||||||||||
|
February and April 2016 |
Common stock |
Expense |
Three Employees |
Cashless Stock option exercise |
718 | — | (3) | |||||||||
|
Total 2016 issuances |
110,629 | $ | 686 | (4) | ||||||||||||
|
(1) |
Includes $38 thousand of stock-based expense related to 2015 director fees accrued and expensed in the fourth quarter of 2015. |
|
(2) |
Bonuses of $366 thousand were accrued and expensed in the fourth quarter of 2015. |
|
(3) |
The Company received $0 for issuances via cashless option exercise. |
|
(4) |
Does not include stock expense of $176 thousand included in accrued liabilities at December 31, 2016. |
2015 Sales of Unregistered Securities
Common Stock Issued During 2015
|
(Dollars in thousands) |
||||||||||||||||
|
Dates of issuance |
Type of issuance |
Expense/ Prepaid |
Stock issuance recipient |
Reason for issuance |
Total no. of shares |
Grant date fair value recorded at issuance |
||||||||||
|
January, June, August, November 2015 |
Vested restricted common stock |
Expense |
Directors |
Director compensation |
12,228 | $ | 77 | |||||||||
|
January 2015 |
Vested restricted common stock |
Expense |
New Director of Sales and Marketing - Orbital Gas Systems, North America |
Sign-on bonus |
17,655 | 125 | ||||||||||
|
March 2015 |
Vested restricted common stock |
Prepaid expense/expense |
Consultant |
Compensation for strategic investor marketing services |
10,000 | 63 | (1) | |||||||||
|
April, August 2015 |
Common stock |
Expense |
Former employee and employee |
Cashless stock option exercise |
122 | — | (2) | |||||||||
|
May, June, July 2015 |
Vested restricted common stock |
Expense |
Employee |
Approved bonus |
14,404 | 72 | ||||||||||
|
July 2015 |
Common stock |
Expense |
Related parties, James McKenzie, and IED, Inc. |
Pursuant to royalty agreement |
4,070 | 22 | ||||||||||
|
Total 2015 issuances |
58,479 | $ | 359 | (3) | ||||||||||||
|
(1) |
Amount includes $31 thousand that was included in prepaid expense at December 31, 2015. |
|
(2) |
The Company received $0 for issuances via cashless option exercise. |
|
(3) |
There was $404 thousand of stock-based expense related to employee stock-based bonuses and vested restricted stock units earned in 2015 but not issued until the first quarter of 2016. |
Shares Eligible for Future Sale
As of December 31, 2017, we had outstanding 28,406,856 shares of Common Stock. Of these shares, 27,890,719 shares are freely tradable without restriction or limitation under the Securities Act.
The 516,137 shares of Common Stock held by existing shareholders as of December 31, 2017 that are ‘‘restricted’’ within the meaning of Rule 144 adopted under the Securities Act (the ‘‘Restricted Shares’’), may not be sold unless they are registered under the Securities Act or sold pursuant to an exemption from registration, such as the exemption provided by Rule 144 promulgated under the Securities Act. The Restricted Shares were issued and sold by us in private transactions in reliance upon exemptions from registration under the Securities Act.
Item 6. Selected Financial Data
The following tables contain selected consolidated financial data as of the dates and for the periods presented. The selected consolidated balance sheet data as of December 31, 2017 and 2016 and the selected consolidated statement of operations data for the years ended December 31, 2017, 2016, and 2015 have been derived from our audited consolidated financial statements and related notes that we have included elsewhere in this Form 10-K. The selected consolidated balance sheet data as of December 31, 2015, 2014, and 2013 and the selected consolidated statement of operations data for the years ended December 31, 2014 and 2013 have been derived from audited consolidated financial statements that are not presented in this Form 10-K. The timing of acquisitions and divestitures completed during the years presented affects the comparability of the selected financial data.
The selected historical consolidated financial data as of any date and for any period are not necessarily indicative of the results that may be achieved as of any future date or for any future period. You should read the following selected historical financial data in conjunction with the more detailed information contained in Item 7. Management’s Discussion and Analysis of Financial Condition and Results of Operations and our consolidated financial statements and the related notes that we have presented elsewhere in this Form 10-K.
|
(In thousands, except per share amounts) |
For the Years Ended December 31, |
|||||||||||||||||||
|
2017 |
2016 |
2015 * | 2014 | 2013 * | ||||||||||||||||
|
Selected Statements of Operations Data: |
||||||||||||||||||||
|
Total revenues |
$ | 83,275 | $ | 86,461 | $ | 86,240 | $ | 76,045 | $ | 60,652 | ||||||||||
|
Cost of revenues |
55,406 | 54,200 | 53,948 | 47,494 | 37,147 | |||||||||||||||
|
Gross profit |
27,869 | 32,261 | 32,292 | 28,551 | 23,505 | |||||||||||||||
|
Selling, general and administrative expense |
33,921 | 34,239 | 33,023 | 25,924 | 19,446 | |||||||||||||||
|
Depreciation and amortization |
2,163 | 2,366 | 2,862 | 4,197 | 3,011 | |||||||||||||||
|
Research and development |
2,525 | 2,016 | 1,848 | 1,306 | 943 | |||||||||||||||
|
(Credit to) provision for bad debt |
(13 |
) |
93 | 195 | (39 |
) |
211 | |||||||||||||
|
Impairment of goodwill and intangible assets (a) |
3,155 | — | 4 | 32 | — | |||||||||||||||
|
Other operating expenses |
47 | 57 | 54 | 27 | 10 | |||||||||||||||
|
Loss from operations |
(13,929 |
) |
(6,510 |
) |
(5,694 |
) |
(2,896 |
) |
(116 |
) |
||||||||||
|
Impairment on note receivable (b) |
— | — | — | — | (502 |
) |
||||||||||||||
|
Other income (expense) |
234 | (251 |
) |
(260 |
) |
(123 |
) |
(280 |
) |
|||||||||||
|
Interest expense |
(500 |
) |
(467 |
) |
(441 |
) |
(508 |
) |
(443 |
) |
||||||||||
|
(Loss) before taxes |
(14,195 |
) |
(7,228 |
) |
(6,395 |
) |
(3,527 |
) |
(1,341 |
) |
||||||||||
|
Income tax (benefit) expense |
(1,606 |
) (c) |
38 | (408 |
) |
(726 |
) |
(398 |
) |
|||||||||||
|
Net loss |
$ | (12,589 |
) |
$ | (7,266 |
) |
$ | (5,987 |
) |
$ | (2,801 |
) |
$ | (943 |
) |
|||||
|
Basic and diluted loss per common share |
$ | (0.56 |
) |
$ | (0.35 |
) |
$ | (0.29 |
) |
$ | (0.14 |
) |
$ | (0.05 |
) |
|||||
* Includes the operations of CUI-Canada since its acquisition in March 2015 and the operations of Orbital Gas Systems, Limited since its acquisition in September 2013.
|
(In thousands, except share data) |
As of December 31, |
|||||||||||||||||||
|
2017 |
2016 |
2015 |
2014 |
2013 |
||||||||||||||||
|
Selected Balance Sheet Data: |
||||||||||||||||||||
|
Cash and cash equivalents |
$ | 12,646 | $ | 4,617 | $ | 7,267 | $ | 11,704 | $ | 16,576 | ||||||||||
|
Short-term investments held to maturity |
— | — | — | 11,160 | 10,869 | |||||||||||||||
|
Total current assets |
41,276 | 32,103 | 38,157 | 43,126 | 44,684 | |||||||||||||||
|
Total assets |
87,909 | 79,843 | 90,848 | 93,054 | 99,160 | |||||||||||||||
|
Total current liabilities |
18,914 | 17,738 | 17,055 | 12,355 | 15,296 | |||||||||||||||
|
Total liabilities |
30,423 | 31,208 | 31,332 | 27,084 | 30,602 | |||||||||||||||
|
Total Stockholders' equity |
57,486 | 48,635 | 59,516 | 65,970 | 68,558 | |||||||||||||||
|
Common shares outstanding |
28,406,856 | 20,916,848 | 20,806,219 | 20,747,740 | 20,566,663 | |||||||||||||||
|
(a) |
During the year ended December 31, 2017, management determined that an impairment of $3.2 million was necessary related to goodwill at Orbital-UK. During the year ended December 31, 2014, management determined that an impairment of $32 thousand was necessary related to intangible, technology rights for a product line that was determined to have a shortened expected life. |
|
(b) |
During 2013, it was determined that the note receivable related to the divestment of Comex Electronics had become impaired, at which time the Company recorded an impairment of $0.5 million. |
|
(c) |
There was an $887 thousand tax benefit generated from the effect of the USA Tax Cut and Jobs Act (“Tax Act”) passed in December 2017. See Note 16 Income Taxes for more information on this benefit. |
Item 7. Management's Discussion and Analysis of Financial Condition and Results of Operations
Important Note about Forward-Looking Statements
The following discussion and analysis should be read in conjunction with our audited consolidated financial statements as of December 31, 2017 and notes thereto included in this document and our unaudited 10-Q filings for the first three quarters of 2017 and the notes thereto. In addition to historical information, the following discussion and other parts of this Form 10-K contain forward-looking information that involves risks and uncertainties. Our actual results could differ materially from those anticipated by such forward-looking information due to factors discussed elsewhere in this Form 10-K.
The statements that are not historical constitute ‘‘forward-looking statements.’’ Said forward-looking statements involve risks and uncertainties that may cause the actual results, performance or achievements of the Company to be materially different from any future results, performance or achievements, expressed or implied by such forward-looking statements. These forward-looking statements are identified by the use of such terms and phrases as ‘‘expects,’’ ‘‘intends,’’ ‘‘goals,’’ ‘‘estimates,’’ ‘‘projects,’’ ‘‘plans,’’ ‘‘anticipates,’’ ‘‘should,’’ ‘‘future,’’ ‘‘believes,’’ and ‘‘scheduled.’’
The variables, which may cause differences include, but are not limited to, the following: general economic and business conditions; competition; success of operating initiatives; operating costs; advertising and promotional efforts; the existence or absence of adverse publicity; changes in business strategy or development plans; the ability to retain management; availability, terms and deployment of capital; business abilities and judgment of personnel; availability of qualified personnel; labor and employment benefit costs; availability and costs of raw materials and supplies; and changes in, or failure to comply with various government regulations. Although the Company believes that the assumptions underlying the forward-looking statements contained herein are reasonable, any of the assumptions could be inaccurate; therefore, there can be no assurance that the forward-looking statements included in this Form 10-K will prove to be accurate.
In light of the significant uncertainties inherent in the forward-looking statements included herein, the inclusion of such information should not be regarded as a representation by the Company or any person that the objectives and expectations of the Company will be achieved.
Overview
CUI Global, Inc. is a Colorado corporation organized on April 21, 1998. The Company’s principal place of business is located at 20050 SW 112th Avenue, Tualatin, Oregon 97062, phone (503) 612-2300. CUI Global is a platform company dedicated to maximizing shareholder value through the acquisition, development and commercialization of new, innovative technologies. Through its subsidiaries, CUI Global has built a diversified portfolio of industry leading technologies that touch many markets.
Critical Accounting Policies
Our financial statements and related public financial information are based on the application of accounting principles generally accepted in the United States (‘‘GAAP’’). GAAP requires the use of estimates, assumptions, judgments and subjective interpretations of accounting principles that have an impact on the assets, liabilities, revenue, and expense amounts reported. These estimates can also affect supplemental information contained in our external disclosures including information regarding contingencies, risk and financial condition. We believe our use of estimates and underlying accounting assumptions adhere to GAAP and are consistently applied. We base our estimates on historical experience and on various other assumptions that we believe to be reasonable under the circumstances. Actual results may differ materially from these estimates under different assumptions or conditions. We continue to monitor significant estimates made during the preparation of our financial statements.
While all of our significant accounting policies impact the Company’s financial condition and results of operations, we view certain of these policies as critical. Policies determined to be critical are those policies that have the most significant impact on our financial statements and require management to use a greater degree of judgment and estimates. Actual results may differ from those estimates. Our management believes that given current facts and circumstances, it is unlikely that applying any other reasonable judgments or estimate methodologies would have caused a material change in our results of operations, financial position or liquidity for the periods presented in this report.
Asset Impairment
The Company reviews its long-lived assets including finite-lived intangibles for impairment whenever events or changes in circumstances indicate that the carrying amount of the asset exceeds its fair value and may not be recoverable. In performing the review for recoverability, the Company estimates the future cash flows expected to result from the use of the asset and its eventual disposition. If the sum of the expected future cash flows (undiscounted and without interest charges) is less than the carrying amount of the asset, an impairment loss is recognized as the excess of the carrying amount over the fair value. Otherwise, an impairment loss is not recognized. Management estimates the fair value and the estimated future cash flows expected. Any changes in these estimates could impact whether there was impairment and the amount of the impairment.
During the year ended December 31, 2015, management recorded a $2 thousand impairment for a patent within the Power and Electromechanical segment as the Company chose not to continue pursuit of the related patent grants and a $2 thousand impairment of its capitalized website costs for its Japan site after choosing to translate its U.S.-based website into Japanese.
Indefinite-Lived Intangibles and Goodwill Assets
The Company accounts for business combinations under the acquisition method of accounting in accordance with ASC 805, ‘‘Business Combinations,’’ where the total purchase price is allocated to the tangible and identified intangible assets acquired and liabilities assumed based on their estimated fair values. The purchase price is allocated using the information currently available, and may be adjusted, up to one year from acquisition date, after obtaining more information regarding, among other things, asset valuations, liabilities assumed and revisions to preliminary estimates. The purchase price in excess of the fair value of the tangible and identified intangible assets acquired less liabilities assumed is recognized as goodwill.
Annual Test. The Company tests for indefinite-lived intangibles and goodwill impairment in the second quarter of each year and whenever events or circumstances indicate that the carrying amount of the asset exceeds its fair value and may not be recoverable. The Company’s qualitative assessment of impairment for indefinite-lived assets at May 31, 2017, followed the guidance in ASC 350-30-35-18A and 18B. The Company performed a qualitative analysis of goodwill and indefinite-lived intangibles at May 31, 2017, and determined there was no impairment of indefinite-lived intangibles and goodwill at that time.
Under current accounting guidance, CUI Global is not required to calculate the fair value of a reporting unit unless the entity determines, based on a qualitative assessment, that it is more likely than not that its fair value is less than its carrying amount. The guidance includes a number of factors to consider in conducting the qualitative assessment. The Company tests for goodwill impairment in the second quarter of each year and whenever events or changes in circumstances indicate that the carrying amount of the asset exceeds its fair value and may not be recoverable.
As detailed in ASC 350-20-35-3A, in performing its testing for goodwill, management completes a qualitative analysis to determine whether it was more likely than not that the fair value of a reporting unit is less than its carrying amount, including goodwill. To complete this review, management follows the steps in ASC 350-20-35-3C to evaluate the fair values of the intangibles and goodwill and considers all known events and circumstances that might trigger an impairment of goodwill.
Interim Test. During the fourth quarter of 2017, the Company determined that there were indicators present to suggest that it was more likely than not that the fair value of the Orbital-UK reporting unit was less than its carrying amount. The significant changes for the Orbital-UK reporting unit subsequent to the annual goodwill impairment test performed as of May 31, 2017 included a decline in the 2017 actual revenue, operating income and cash flows compared to previously forecasted results and a decline in the 2018 forecasted revenue, operating income and cash flows due in part to the longer than expected temporary halt in shipping of its GasPT product to a major customer in Italy and market uncertainty due to the continuing effects of Brexit.
To test the Orbital-UK reporting unit for impairment, the Company used a quantitative test. The Company estimated the fair value of the Orbital-UK reporting unit using a blend of a market approach and an income approach, which was deemed to be the most indicative of fair value in an orderly transaction between market participants. Under the income approach, the Company determined fair value based on estimated future cash flows of the Orbital-UK reporting unit discounted by an estimated weighted-average cost of capital, reflecting the overall level of inherent risk of the Orbital-UK reporting unit and the rate of return an outside investor would expect to earn. The Company based its cash flow projections for the Orbital-UK reporting unit using a forecast of cash flows and a terminal value developed by capitalizing an assumed stabilized cash flow figure. The forecast and related assumptions were derived from an updated financial forecast prepared during the fourth quarter of 2017. Under the market approach, appropriate valuation multiples were derived from the historical operating data of selected guideline companies. The valuation multiples were evaluated and adjusted based on the strengths and weaknesses of the Company relative to the selected guideline companies and the multiple was then applied to the appropriate operating data of the Company to arrive at an indication of fair market value. As a result of the analysis, the Company concluded that the carrying value of the Orbital-UK reporting unit exceeded its estimated fair value. The quantitative test for the Orbital-UK reporting unit resulted in an impairment for the Orbital-UK reporting unit, and the Company recorded a goodwill impairment charge of $3.2 million during the fourth quarter of 2017.
The remaining goodwill related to the Orbital-UK reporting unit as of December 31, 2017 was $4.5 million, which is included in the Energy segment. As of December 31, 2017, there was also goodwill remaining for CUI Inc., CUI-Canada and CUI-Japan reporting units, which are included in the Power and Electromechanical segment.
In 2016 and 2015, the analysis, determined there was no impairment necessary to goodwill. Through these reviews, management concluded there were no events or circumstances that triggered an impairment (and there was no expectation that a reporting unit or a significant portion of a reporting unit would be sold or otherwise disposed of in the following year), therefore, no further analysis was necessary to prepare for goodwill impairment beyond the steps in 350-20-35-3C in accordance with current accounting guidance. On a periodic basis, we will also perform a quantitative analysis of goodwill impairment and in 2016, in addition to the qualitative analysis, we performed a quantitative analysis of goodwill impairment and concluded no impairment of goodwill was required.
Stock-Based Compensation
The Company accounts for stock-based compensation using FASB Accounting Standards Codification No. 718 (‘‘FASB ASC 718’’), ‘‘Compensation – Stock Compensation.’’ FASB Codification No. 718 requires the fair value of all stock-based employee compensation awarded to employees to be recorded as an expense over the related vesting period.
Stock bonuses issued to employees are recorded at fair value using the market price of the stock on the date of grant and expensed over the vesting period or immediately if fully vested on date of issuance. Employee stock options are recorded at fair value using the Black-Scholes option pricing model. The underlying assumptions used in the Black-Scholes option pricing model by the Company are taken from publicly available sources including: (1) volatility, which is calculated using historic stock price information from online finance websites such as Google Finance and Yahoo Finance; (2) the stock price on the date of grant is obtained from online finance websites such as those previously noted; (3) the appropriate discount rates are obtained from the United States Federal Reserve economic research and data website; and (4) other inputs are determined based on previous experience and related estimates. With regards to expected volatility, the Company utilizes an appropriate period for historical share prices for CUI Global, Inc. that best reflect the expected volatility for determining the fair value of our stock options.
Valuation of Non-Cash Capital Stock Issuances
The Company values its stock transactions based upon the fair value of the equity instruments. Various methods can be used to determine the fair value of an equity instrument. The Company may use the fair value of the consideration received, the quoted market price of the stock or a contemporaneous cash sale of the common or preferred stock. Each of these methods may produce a different result. Management uses the method it determines most appropriately reflects the stock transaction. If a different method was used it could impact the expense and equity stock accounts.
Revenue Recognition
Power and Electromechanical Segment
Product revenue is recognized in the period when persuasive evidence of an arrangement with a customer exists, the products are shipped and title has transferred to the customer, the price is fixed or determinable, and collection is reasonably assured. The Company sells to distributors pursuant to distribution agreements that have certain terms and conditions such as the right of return and price protection, which inhibit revenue recognition unless they can be reasonably estimated as we cannot assert the price is fixed and determinable and estimate returns. For one distributor that comprises 26% of revenue, we have such history and ability to estimate and therefore recognized revenue upon sale to the distributor and record a corresponding reserve for the estimated returns. For three other distributor arrangements that represents a combined 15% of revenue, we recognize revenue on a sell-through basis, and accordingly defer revenue and the related costs until such time as the distributor resells the product.
Energy Segment
For production-type contracts meeting the Company’s minimum threshold, revenues and related costs on the contracts, are recognized using the ‘‘percentage of completion method’’ of accounting in accordance with ASC 605-35, Accounting for Performance of Construction-Type and Certain Production Type Contracts (‘‘ASC 605-35’’). Under this method, contract revenues and related expenses are recognized over the performance period of the contract in direct proportion to the costs incurred as a percentage of total estimated costs for the entirety of the contract. Costs include direct material, direct labor, subcontract labor and any allocable indirect costs. The Company captures certain job costs as work progresses, including labor, material and costs not invoiced. Margin adjustments are made as information pertaining to contracts changes. All un-allocable indirect costs and corporate general and administrative costs are charged to the periods as incurred. The amount of costs not invoiced is captured to ensure an estimated margin consistent with that expected at the completion of the project. In the event a loss on a contract is foreseen, the Company recognizes the loss when it is determined. Contract costs plus recognized profits are accumulated as deferred assets, and billings and/or cash received are recorded to a deferred revenue liability account. The net of these two accounts for any individual project is presented as ‘‘Costs in excess of billings,’’ an asset account, or ‘‘Billings in excess of costs,’’ a liability account.
Production type contracts that do not qualify for use of the percentage of completion method are accounted for using the ‘‘completed contract method’’ of accounting in accordance with ASC 605-35-25-57. Under this method, contract costs are accumulated as deferred assets, and billings and/or cash received is recorded to a deferred revenue liability account, during the periods of construction, but no revenues, costs, or profits are recognized in operations until the period within which completion of the contract occurs. A contract is considered complete when all costs except insignificant items have been incurred; the equipment is operating according to specifications and has been accepted by the customer.
For product sales in the Energy segment, revenue is recognized in the period when persuasive evidence of an arrangement with a customer exists, the products are shipped and title has transferred to the customer, the price is fixed or determinable, and collection is reasonably assured.
Revenues from warranty and maintenance activities are recognized ratably over the term of the warranty and maintenance period and the unrecognized portion is recorded as deferred revenue.
Liquidity and Capital Resources
General
As of December 31, 2017, CUI Global held Cash and cash equivalents of $12.6 million. Operations, other intangible assets, and equipment have been funded through cash on hand, the October 2017 equity raise and short-term credit facilities during the year ended December 31, 2017.
Cash used in Operations
There was a use of cash from operations of approximately $9.4 million during the year ended December 31, 2017. This was an increase from the use of cash from operations of approximately $0.6 million and approximately $6.2 million for the years ended December 31, 2016 and 2015, respectively. Overall, the change in cash used in operations is primarily the result of the net loss in 2017 before non-cash expenses affected by changes in assets and liabilities.
The cash from operations in 2017 compared to 2016 was negatively affected by a larger net loss attributable to the Energy segment and the timing of accounts receivable collections and accounts payable payments in both the Energy and Power and Electromechanical Segments.
During 2017, in addition to the change in trade accounts receivable and accounts payable, significant factors that impacted the cash used in operations included cash used for inventory purchases of approximately $0.4 million associated with timing of customer orders and ongoing projects, $0.5 million related to the change in deposits and other assets due to the increase in long-term prepaid royalties at Orbital-UK, $0.4 million use of cash related to changes in accrued expenses primarily due to a change in accrued compensation in the Energy segment and a $0.4 million use of cash from changes in prepaid assets that affected all three segments. Changes in costs in excess of billings and billings in excess of cost were a combined approximate $0.3 million source of cash in the period related to billings on projects in the Energy segment and unearned revenue increased $2.7 million primarily in relation to increases in deferred revenue from distributor activity within the Power and Electromechanical segment.
On a segment basis, in 2017, the Power and Electromechanical segment contributed cash from operations of approximately $3.9 million while the Energy segment used cash of approximately $8.4 million and the Other category used cash of approximately $4.9 million. The Energy segment was hampered by the continued costs of building brand awareness in North America and a regulatory issue in Italy unrelated to the technology that delayed the next phase of a significant GasPT project through 2017. The Company expects the project to resume in 2018. The customer is currently working with its regulatory body to implement a program that would improve its ability to more rapidly deploy the new metering solutions.
We believe cash from operations will improve in the Energy segment in 2018 due to the expected resumption of the Italian project and growth in the North American business. As the North American Orbital business matures, this operation is expected to contribute cash and earnings, but not in the short term. The Power and Electromechanical segment is expected to continue to provide cash from operations and we believe the cash usage rate in the Other category to continue to be stable at the new lower level due to cost cutting initiatives put in place during 2017.
The use of cash from operations in 2016 was benefited by lower accounts receivable balances in both segments at December 31, 2016 compared to December 31, 2015 as a result of improved collections in both segments and the transition of Tectrol customers to CUI-Canada that delayed some payments at the end of 2015. CUI-Canada's and Orbital-UK's cash from operations improved significantly from 2015 while Orbital Gas Systems, North America, Inc. continued to use more cash than it produced due to the cost of establishing the Orbital brand in the U.S.
During 2016, in addition to the change in trade accounts receivable, significant factors that impacted the cash used in operations included cash used for inventory purchases that increased approximately $1.7 million associated with timing of customer orders and ongoing projects, changes in costs in excess of billings and billings in excess of cost were a combined approximate $1.3 million use of cash in the period related to billings on projects in the Energy segment and unearned revenue increased $1.2 million primarily in relation to increases in deferred revenue from distributor activity within the Power and Electromechanical segment.
Negative cash flow in 2015 from operations of $6.2 million was significantly affected by operating requirements from Orbital Gas Systems North America and CUI-Canada during the year ended December 31, 2015. The change in cash used in operations is primarily the result of the net loss in 2015 before non-cash expenses as well as changes in assets and liabilities.
During 2015, significant factors that impacted the cash used in operations included the increased receivables of approximately $3.3 million with $1.4 million of it due to credit sales generated following the opening of Orbital Gas Systems North America and the acquisition of CUI-Canada coupled with increased sales volume and the timing of deliveries and related sales terms across the Company. Cash used for inventory purchases increased approximately $3.7 million associated with timing of customer orders and ongoing projects. Additionally, the cash flow from operations was impacted by an approximate $0.9 million increase in prepaid expenses and other current assets associated largely with prepaid insurance premiums, product purchases, royalties and consulting services fees. Also, changes in costs in excess of billings and billings in excess of cost were a combined approximate $2.9 million use of cash in the period related to billings on projects in the Energy segment. The overall use in operating cash was partially offset by an increase in accounts payable of approximately $2.1 million primarily due to the timing of goods receipts and the related terms along with the increase due to the addition of Orbital Gas Systems, North America, Inc. and CUI-Canada. Accrued expenses increased $1.8 million related largely to an increase in accrued compensation. Unearned revenue increased $2.2 million primarily in relation to increases in deferred revenue from distributor activity within the Power and Electromechanical segment.
During 2017, 2016 and 2015, the Company used stock and options as a form of payment to certain vendors, consultants, directors and employees. For years ended December 31, 2017, 2016 and 2015, the Company recorded a total of $0.4 million, $0.7 million and $1.3 million, respectively for share-based compensation related to equity given, or to be given, to employees, directors and consultants for services provided and as payment for royalties earned. The decreases in 2017 compared to 2016 and in 2016 compared to 2015 were due to lower stock-based bonuses and lower stock option vesting expense as all remaining unvested stock options fully vested in 2016.
Capital Expenditures and Investments
During the years ended 2017, 2016 and 2015, CUI Global invested $0.9 million, $0.8 million and $5.0 million, respectively, in fixed assets. These investments typically include additions to equipment for engineering and research and development, tooling for manufacturing, furniture, computer equipment for office personnel, facilities improvements and other fixed assets as needed for operations. The 2015 investments in property and equipment included the construction of a new 46,000 square foot state-of-the-art manufacturing/administration/research and development facility in the UK to supplement existing office space at Orbital. The Company anticipates further investment in fixed assets during 2018 in support of its on-going business and continued development of product lines and technologies.
CUI Global invested $0.6 million, $0.9 million, and $0.1 million in other intangible assets during 2017, 2016 and 2015, respectively. These investments typically include product certifications, technology rights, capitalized website development, software for engineering and research and development and software upgrades for office personnel. Investments in 2017 primarily related to product certifications in the Power and Electromechanical segment and investments in software in the Energy segment. The increased investments in 2016 were due to an increase in product certifications and an ongoing ERP software implementation at Orbital-UK. The Company expects its investment in other intangible assets will continue throughout 2018.
The Company did not invest in short-term investments classified as held to maturity and did not receive any money from maturities in 2017 or 2016. In 2015, the Company received $11.1 million from maturities of these investments. These investments included money market securities, certificates of deposit, commercial paper and corporate notes. Investments made by the Company are subject to an investment policy, which limits our risk of loss exposure by setting appropriate credit quality requirements for investments held, limiting maturities to be one year or less, and setting appropriate concentration levels to prevent concentrations. This includes a requirement that no more than 3% of the portfolio, or $500,000, whichever is greater, may be invested in one particular issue.
On March 5, 2015, the Company closed on an Asset Purchase Agreement to acquire certain assets and assume certain liabilities of Tectrol, Inc., a Toronto, Canada corporation. The acquisition was effective March 1, 2015 and is included from that date in the Company's Power and Electromechanical segment. The final adjusted purchase price for the acquisition of Tectrol was $4.5 million, which included the present value of $0.3 million of royalties to be paid on future sales, which was recorded as $0.2 million of contingent consideration and had a balance of $45 thousand at December 31, 2017. See Note 4 Acquisitions, for more information on the Tectrol acquisition.
Financing Activities
During the years ended December 31, 2017, 2016, and 2015, the Company issued payments of $29 thousand, $41 thousand and $32 thousand, respectively, against capital leases of motor vehicles and equipment. The Company paid $89 thousand, $85 thousand and $81 thousand against the mortgage note payable in 2017, 2016 and 2015, respectively. Also in 2017 and 2016, the Company issued payments of $61 thousand and $59 thousand, respectively, toward the contingent liability associated with the Tectrol acquisition.
At December 31, 2017, the Company had a $6 million two-year revolving line of credit (LOC) and a 1.5 million British pound sterling overdraft facility (approximately $2 million at December 31, 2017). As of January 1, 2018, the credit line for the LOC was lowered to $4 million in accordance with the agreement. For the year ended December 31, 2017, the Company recorded proceeds of $22.3 million from the line of credit and recorded proceeds of $9.8 million from the Company's overdraft facility in the U.K. These proceeds were paid back during 2017 and the balances on each of these credit facilities was zero at December 31, 2017.
S-3 registration
The Company filed an S-3 registration statement on March 14, 2017 containing a prospectus that was effective March 29, 2017. With this filing, CUI Global may from time to time issue various types of securities, including common stock, preferred stock, debt securities and/or warrants, up to an aggregate amount of $100 million.
On October 23, 2017, the Company closed on an underwritten public offering of 7,392,856 shares at a public offering price of $2.80 per share, including 964,285 shares sold at the public offering price pursuant to the underwriter's exercise in full of its option to purchase additional shares to cover over-allotments. The net proceeds to CUI Global (after deducting underwriting discount and other expenses payable by the Company) were approximately $18.9 million. The Company has used and intends to continue to use the net proceeds from the offering primarily for general corporate purposes, which includes operating expenses, working capital to improve and promote its commercially available products, advance product candidates, future acquisitions or share repurchases, to expand international presence and commercialization, for general capital expenditures and for satisfaction of debt obligations. In 2017, the Company used some of the proceeds of the public offering to pay off its line of credit and overdraft facility.
As the Company focuses on strategic acquisitions, technology development, product line additions, developing CUI-Canada operations, and developing Orbital Gas Systems, North America, Inc., it will fund these activities together with related sales and marketing efforts for its various product offerings with cash on hand, including proceeds from the October 2017 issuances through the S-3 registration statement, and available debt.
CUI Global may raise additional capital needed to fund the further development and marketing of its products as well as payment of its debt obligations.
See the section entitled Recent Sales of Unregistered Securities for a complete listing of all unregistered securities transactions.
Financing activities – related party activity
During 2017, 2016 and 2015, $0.3 million, $0.3 million, and $0.3 million, respectively in interest payments were made in relation to the promissory notes issued to related party, IED, Inc. The promissory note terms include a due date of May 15, 2020 and an interest rate of 5% per annum, with interest payable monthly and the principal due as a balloon payment at maturity.
Please see Note 9 Notes Payable and Note 13 Related Party Transactions for further discussion of these transactions.
Recap of Liquidity and Capital Resources
During the year ended December 31, 2017, the Company continued to use cash at Orbital Gas Systems North America in Houston while the CUI-Canada operation was more fully integrated into the Company's Power and Electromechanical segment. As expected in the two years following two major additions, along with an ongoing focus on research and development and growth initiatives, cash usage was greater than what it will be when the businesses are fully mature. The net cash used in operating activities increased to $9.4 million from $0.6 million in 2016 with much of that due to the ongoing efforts to grow the current businesses as well as the effects of the delay in the major GasPT project in Italy and overall economic effects of Brexit and the transition in the UK, which has resulted in considerable delays in economic activities in the UK.
The Wells Fargo mortgage promissory note has a balance at December 31, 2017 of $3.4 million due, of which $94 thousand is the current portion. See Note 9 Notes Payable for more information on this note.
The Company's wholly owned subsidiary, CUI Inc. renewed its two-year revolving Line of Credit (LOC) with Wells Fargo Bank in the principal amount of $6.0 million line of credit, until June 1, 2019 with a scheduled decrease in the LOC limit to $4.0 million as of January 1, 2018. On October 5, 2016, Orbital Gas Systems Ltd. signed a five-year agreement with the London branch of Wells Fargo Bank N.A. for a multi-currency variable rate overdraft facility with a facility limit of 1.5 million pounds sterling ($2.0 million at December 31, 2017) that expires on October 5, 2021. See Note 10 Working Capital Line of Credit and Overdraft Facility for more information on these two credit facilities.
At December 31, 2017, the Company had cash and cash equivalents balances of $12.6 million. At December 31, 2017 and 2016, the Company had $0.9 million and $0.8 million, respectively, of cash and cash equivalents balances at domestic financial institutions, which were covered under the FDIC insured deposits programs and $0.2 million and $0.2 million, respectively, at foreign financial institutions covered under the United Kingdom Financial Services Compensation (FSC) and the Canada Deposit Insurance Corporation (CDIC). At December 31, 2017 and 2016, the Company held $0.1 million and $0.2 million, respectively, in Japanese foreign bank accounts, $0.1 million and $1.0 million, respectively, in European foreign bank accounts and $0.1 million and $0.1 million, respectively, in Canadian bank accounts.
The following tables present our contractual obligations as of December 31, 2017:
|
Payments due by period |
||||||||||||||||||||
|
(In thousands) |
Less than 1 year |
1 to 3 years |
3 to 5 years |
After 5 years |
Total |
|||||||||||||||
|
Capital lease obligations: |
||||||||||||||||||||
|
Minimum lease payments |
$ | 4 | $ | 8 | $ | 2 | $ | — | $ | 14 | ||||||||||
|
Operating lease obligations: |
||||||||||||||||||||
|
Operating leases |
934 | 1,311 | 789 | — | 3,034 | |||||||||||||||
|
Notes payable obligations: |
||||||||||||||||||||
|
Notes payable maturities |
94 | 5,506 | 224 | 2,830 | 8,654 | |||||||||||||||
|
Interest on notes payable (1) |
265 | 365 | — | — | 630 | |||||||||||||||
|
Total Obligations |
$ | 1,297 | $ | 7,190 | $ | 1,015 | $ | 2,830 | $ | 12,332 | ||||||||||
(1) The interest on notes payable includes fixed interest on the related party note payable to IED, Inc. and does not include the variable interest on the mortgage payable. For further information regarding notes payable see Note 9 Notes Payable.
As of December 31, 2017, the Company had an accumulated deficit of $108.6 million.
The Company expects the revenues from its Power and Electromechanical and Energy Segments, cash on hand, and cash available from line of credit and overdraft facility to cover operating and other expenses for the next twelve months of operations. However, in the short-term, the Company expects its Orbital operation in Houston to continue to need cash support until it can firmly establish itself. The CUI-Canada operation in the Power and Electromechanical segment acquired in 2015 will also continue to be near break even in the short-term. If revenues and other funds are not sufficient to cover all operating and other expenses, additional funding may be required. There is no assurance the Company will be able to raise such additional capital. The failure to raise capital or generate product sales in the expected time frame would have a material adverse effect on the Company.
Off-Balance Sheet Arrangements
As of December 31, 2017, the Company had no off-balance sheet arrangements.
Results of Operations
The following tables set forth, for the periods indicated, contain certain financial information regarding revenue and costs by segment:
|
(Dollars in thousands) |
For the Year Ended December 31, 2017 |
|||||||||||||||||||||||||||||||
|
Power and |
Percent |
Energy |
Percent of |
Other |
Percent |
Total |
Percent of |
|||||||||||||||||||||||||
| $ |
% |
$ |
% |
$ |
% |
$ |
% |
|||||||||||||||||||||||||
|
Total Revenues |
$ | 64,432 | 100.0 |
% |
$ | 18,843 | 100.0 |
% |
$ | — | — |
% |
$ | 83,275 | 100.0 |
% |
||||||||||||||||
|
Cost of revenue |
42,493 | 66.0 |
% |
12,913 | 68.5 |
% |
— | — |
% |
55,406 | 66.5 |
% |
||||||||||||||||||||
|
Gross Profit |
21,939 | 34.0 |
% |
5,930 | 31.5 |
% |
— | — |
% |
27,869 | 33.5 |
% |
||||||||||||||||||||
|
Operating expenses: |
||||||||||||||||||||||||||||||||
|
Selling, general and administrative |
16,415 | 25.5 |
% |
12,588 | 66.8 |
% |
4,918 | — |
% |
33,921 | 40.7 |
% |
||||||||||||||||||||
|
Depreciation and amortization |
818 | 1.2 |
% |
1,345 | 7.2 |
% |
— | — |
% |
2,163 | 2.6 |
% |
||||||||||||||||||||
|
Research and development |
2,303 | 3.6 |
% |
222 | 1.2 |
% |
— | — |
% |
2,525 | 3.0 |
% |
||||||||||||||||||||
|
Bad debt |
3 | — |
% |
(16 |
) |
(0.1 |
)% |
— | — |
% |
(13 |
) |
— |
% |
||||||||||||||||||
|
Impairment of goodwill and intangible assets |
3 | — |
% |
3,152 | 16.7 |
% |
— | — |
% |
3,155 | 3.8 |
% |
||||||||||||||||||||
|
Other operating expenses |
42 | 0.1 |
% |
5 | — |
% |
— | — |
% |
47 | 0.1 |
% |
||||||||||||||||||||
|
Total operating expenses |
19,584 | 30.4 |
% |
17,296 | 91.8 |
% |
4,918 | — |
% |
41,798 | 50.2 |
% |
||||||||||||||||||||
|
Income (loss) from operations |
$ | 2,355 | 3.6 |
% |
$ | (11,366 |
) |
(60.3 |
)% |
$ | (4,918 |
) |
— |
% |
$ | (13,929 |
) |
(16.7 |
)% |
|||||||||||||
|
(Dollars in thousands) |
For the Year Ended December 31, 2016 |
|||||||||||||||||||||||||||||||
|
Power and |
Percent |
Energy |
Percent of |
Other |
Percent |
Total |
Percent of |
|||||||||||||||||||||||||
| $ |
% |
$ |
% |
$ |
% |
$ |
% |
|||||||||||||||||||||||||
|
Total Revenues |
$ | 58,403 | 100.0 |
% |
$ | 28,058 | 100.0 |
% |
$ | — | — |
% |
$ | 86,461 | 100.0 |
% |
||||||||||||||||
|
Cost of revenue |
38,059 | 65.2 |
% |
16,141 | 57.5 |
% |
— | — |
% |
54,200 | 62.7 |
% |
||||||||||||||||||||
|
Gross Profit |
20,344 | 34.8 |
% |
11,917 | 42.5 |
% |
— | — |
% |
32,261 | 37.3 |
% |
||||||||||||||||||||
|
Operating expenses: |
||||||||||||||||||||||||||||||||
|
Selling, general and administrative |
16,756 | 28.7 |
% |
12,006 | 42.8 |
% |
5,477 | — |
% |
34,239 | 39.6 |
% |
||||||||||||||||||||
|
Depreciation and amortization |
963 | 1.6 |
% |
1,401 | 5.0 |
% |
2 | — |
% |
2,366 | 2.7 |
% |
||||||||||||||||||||
|
Research and development |
1,873 | 3.2 |
% |
143 | 0.5 |
% |
— | — |
% |
2,016 | 2.3 |
% |
||||||||||||||||||||
|
Bad debt |
49 | 0.1 |
% |
44 | 0.2 |
% |
— | — |
% |
93 | 0.1 |
% |
||||||||||||||||||||
|
Other operating expenses (income) |
58 | 0.1 |
% |
(1 |
) |
— |
% |
— | — |
% |
57 | 0.1 |
% |
|||||||||||||||||||
|
Total operating expenses |
19,699 | 33.7 |
% |
13,593 | 48.5 |
% |
5,479 | — |
% |
38,771 | 44.8 |
% |
||||||||||||||||||||
|
Income (loss) from operations |
$ | 645 | 1.1 |
% |
$ | (1,676 |
) |
(6.0 |
)% |
$ | (5,479 |
) |
— |
% |
$ | (6,510 |
) |
(7.5 |
)% |
|||||||||||||
|
(Dollars in thousands) |
For the Year Ended December 31, 2015 |
|||||||||||||||||||||||||||||||
|
Power and |
Percent |
Energy |
Percent of |
Other |
Percent |
Total |
Percent of |
|||||||||||||||||||||||||
| $ |
% |
$ |
% |
$ |
% |
$ |
% |
|||||||||||||||||||||||||
|
Total Revenues |
$ | 58,037 | 100.0 |
% |
$ | 28,203 | 100.0 |
% |
$ | — | — |
% |
$ | 86,240 | 100.0 |
% |
||||||||||||||||
|
Cost of revenue |
36,287 | 62.5 |
% |
17,661 | 62.6 |
% |
— | — |
% |
53,948 | 62.6 |
% |
||||||||||||||||||||
|
Gross Profit |
21,750 | 37.5 |
% |
10,542 | 37.4 |
% |
— | — |
% |
32,292 | 37.4 |
% |
||||||||||||||||||||
|
Operating expenses: |
||||||||||||||||||||||||||||||||
|
Selling, general and administrative |
16,178 | 27.9 |
% |
12,216 | 43.4 |
% |
4,629 | — |
% |
33,023 | 38.3 |
% |
||||||||||||||||||||
|
Depreciation and amortization |
915 | 1.6 |
% |
1,941 | 6.9 |
% |
6 | — |
% |
2,862 | 3.3 |
% |
||||||||||||||||||||
|
Research and development |
1,707 | 3.0 |
% |
141 | 0.5 |
% |
— | — |
% |
1,848 | 2.1 |
% |
||||||||||||||||||||
|
Bad debt |
70 | 0.1 |
% |
125 | 0.4 |
% |
— | — |
% |
195 | 0.2 |
% |
||||||||||||||||||||
|
Impairment of intangible assets |
4 | — |
% |
— | — |
% |
— | — |
% |
4 | — |
% |
||||||||||||||||||||
|
Other operating expenses |
20 | — |
% |
34 | 0.1 |
% |
— | — |
% |
54 | 0.1 |
% |
||||||||||||||||||||
|
Total operating expenses |
18,894 | 32.6 |
% |
14,457 | 51.3 |
% |
4,635 | — |
% |
37,986 | 44.0 |
% |
||||||||||||||||||||
|
Income (loss) from operations |
$ | 2,856 | 4.9 |
% |
$ | (3,915 |
) |
(13.9 |
)% |
$ | (4,635 |
) |
— |
% |
$ | (5,694 |
) |
(6.6 |
)% |
|||||||||||||
Revenue
|
For the Years Ended December 31, |
||||||||||||||||||||
|
Revenues by Segment |
Percent |
Percent |
||||||||||||||||||
|
(Dollars in thousands) |
2017 |
Change |
2016 |
Change |
2015 |
|||||||||||||||
|
Power and Electromechanical |
$ | 64,432 | 10.3 |
% |
$ | 58,403 | 0.6 |
% |
$ | 58,037 | ||||||||||
|
Energy |
18,843 | (32.8 |
)% |
28,058 | (0.5 |
)% |
28,203 | |||||||||||||
|
Other |
— | — |
% |
— | — |
% |
— | |||||||||||||
|
Total revenues |
$ | 83,275 | (3.7 |
)% |
$ | 86,461 | 0.3 |
% |
$ | 86,240 | ||||||||||
2017 compared to 2016
Revenues in 2017 are attributable to continued sales and marketing efforts, sales through the distribution channel customers, the CUI-Canada related product line, and the revenues generated since the January 2015 opening of Orbital Gas Systems, North America, Inc. Net revenues for the year ended December 31, 2017 were lower than in 2016 due to lower revenues in our Energy segment associated with the timing of customer project delivery schedules and a regulatory issue in Italy unrelated to the technology that delayed the next phase of that project through 2017 as well as lower translated revenue at our UK operations due to the lower value British pound Sterling following Brexit. The value of the British pound Sterling began a slow recovery after bottoming out in the first quarter of 2017 and was no longer a negative factor in the fourth quarter as compared to 2016. The Italian contract is still in place and the Company announced in October 2017 that the tariff issue has been resolved and the Company expects deliveries to resume in 2018. Partially offsetting the decrease in the Energy segment, was an increase in revenue in the Power and Electromechanical segment for the year ended December 31, 2017 due to the timing of customer delivery schedules and sell through activity at distributors.
The customer orders related to the Power and Electromechanical segment are associated with the existing product offering, continued new product introductions, continued sales and marketing programs, new customer engagements, distribution channel sales, and the addition in March 2015 of the products from CUI-Canada. In October 2017, the Company announced its first order for its new power monitoring and switching system (ICE Switch) for data centers that is expected to be delivered in the first quarter of 2018.
The Power and Electromechanical segment held a backlog of customer orders of approximately $20.2 million as of December 31, 2017 compared to a backlog of customer orders of approximately $18.1 million at December 31, 2016. At December 31, 2017, the Energy segment held a backlog of customer orders of approximately $12.6 million compared to approximately $12.1 million at December 31, 2016.
CUI Inc. introduced 1,122 new products during the year ended 2017 compared to 968 new products during the year ended 2016. The continued product expansion including ICE products, and moving smaller sales through the distribution channel is expected to continue to result in revenue growth in future periods as CUI’s sales group and support staff continues to reach new customers, further expand relationships with existing customers and continued new product introductions in efforts to have CUI products designed into new projects.
2016 compared to 2015
Revenues in 2016 were attributable to continued sales and marketing efforts, sales through the distribution channel customers, the CUI-Canada related product line, and the revenues generated since the January 2015 opening of Orbital Gas Systems, North America, Inc. Net revenues in 2016 were generally consistent compared to 2015 but would have been more significantly improved except for lower translated Orbital-UK operations as a result of falling foreign currency rates in the UK following the Brexit vote. However, the lower rates did not have a significant effect on operating or net income.
The Power and Electromechanical segment held a backlog of customer orders of approximately $18.1 million as of December 31, 2016 compared to a backlog of customer orders of approximately $19.7 million as of December 31, 2015. At December 31, 2016, the Energy segment held a backlog of customer orders of approximately $12.1 million compared to approximately $12.5 million as of December 31, 2015. In 2016, the Energy segment's Orbital Gas Systems, North America, Inc. subsidiary completed its first full year of operations and made progress on its goals of self-sustainability with four consecutive quarters of revenue growth. CUI Inc. introduced 968 new products during the year ended 2016 compared to 838 new products during the year ended 2015.
Cost of Revenue
|
For the Years Ended December 31, |
||||||||||||||||||||
|
Cost of Revenues by Segment |
Percent |
Percent |
||||||||||||||||||
|
(Dollars in thousands) |
2017 |
Change |
2016 |
Change |
2015 |
|||||||||||||||
|
Power and Electromechanical |
$ | 42,493 | 11.7 |
% |
$ | 38,059 | 4.9 |
% |
$ | 36,287 | ||||||||||
|
Energy |
12,913 | (20.0 |
)% |
16,141 | (8.6 |
)% |
17,661 | |||||||||||||
|
Other |
— | — |
% |
— | — |
% |
— | |||||||||||||
|
Total cost of revenues |
$ | 55,406 | 2.2 |
% |
$ | 54,200 | 0.5 |
% |
$ | 53,948 | ||||||||||
2017 compared to 2016
The cost of revenues as a percentage of revenue increased to 67% during the year ended December 31, 2017 from 63% during the year ended December 31, 2016. The increase in the cost of revenues as a percentage of revenue was due to a less favorable product mix particularly in the Energy segment in 2017 including a decreased volume of higher margin GasPT sales. The Power and Electromechanical segment also had a slight decrease in its gross margin associated with product mix. As a result of the less favorable product mix in the Energy segment, for the year ended December 31, 2017, the cost of revenues as a percentage of revenue increased 11 percentage points from 58% to 69%. Cost of sales in the Energy segment were lower in 2017 compared to 2016 due to lower sales volumes. The percentage of cost of sales for the Power and Electromechanical segment increased from 65% to 66%. In addition to the increased cost of sales percentage, costs of sales in the Power and Electromechanical segment increased due to higher sales volume in 2017 compared to 2016. The Company expects improved cost of revenues as a percentage of revenues in 2018 as a result of increased sales of higher margin products including GasPT.
2016 compared to 2015
The cost of revenues as a percentage of revenue remained consistent at 63% during the years ended December 31, 2016 and 2015. The cost of revenues as a percentage of revenue was due to the offsetting factors of improved product mix including an increased volume of higher margin GasPT sales in the Energy segment, which were offset by lower margins in the Power and Electromechanical segment. As a result of the improved product mix in the Energy segment, for the year ended December 31, 2016, the cost of revenues as a percentage of revenue dropped 5 percentage points from 63% to 58%. This improvement helped to offset lower margins incurred in the Power and Electromechanical segment as the segment's cost of revenues as a percentage of revenue increased slightly to 65% from 63%.
Selling, General and Administrative Expenses
|
For the Years Ended December 31, |
||||||||||||||||||||
|
Selling, General, and Administrative Expense by Segment |
Percent |
Percent |
||||||||||||||||||
|
(Dollars in thousands) |
2017 |
Change |
2016 |
Change |
2015 |
|||||||||||||||
|
Power and Electromechanical |
$ | 16,415 | (2.0 |
)% |
$ | 16,756 | 3.6 |
% |
$ | 16,178 | ||||||||||
|
Energy |
12,588 | 4.8 |
% |
12,006 | (1.7 |
)% |
12,216 | |||||||||||||
|
Other |
4,918 | (10.2 |
)% |
5,477 | 18.3 |
% |
4,629 | |||||||||||||
|
Total SG&A |
$ | 33,921 | (0.9 |
)% |
$ | 34,239 | 3.7 |
% |
$ | 33,023 | ||||||||||
Selling, General and Administrative (SG&A) expenses includes such items as wages, consulting, general office expenses, business promotion expenses and costs of being a public company including legal and accounting fees, insurance and investor relations.
2017 compared to 2016
During the year ended December 31, 2017, SG&A decreased $0.3 million compared to the prior-year comparative period. The decrease for the year is largely due to $0.6 million in severance costs incurred in 2016 in the Power and Electromechanical segment for the transition of the R&D team to CUI-Canada and for various positions within the Energy segment during the year ended December 31, 2016 compared to severance costs in 2017 primarily in the Energy segment that were less than $0.3 million. The increase in the Energy segment is due to the severance costs at Orbital-UK and increased advertising expense in the Energy segment of $0.2 million. The remaining decreases in SG&A during the year ended December 31, 2017 were associated with various cost saving measures begun in the second quarter of 2017 and due to the lower sales volume in 2017 compared to 2016. SG&A increased to 41% of total revenue in 2017 compared to 40% of total revenue during the year ended December 31, 2016.
2016 compared to 2015
During the year ended December 31, 2016, SG&A increased $1.2 million compared to the year ended December 31, 2015. The increase for the year is largely due to $0.6 million in severance costs incurred in the Power and Electromechanical segment for the transition of the R&D team to CUI-Canada and for various positions within the Energy segment during the year ended December 31, 2016. Increased audit and accounting fees in the year ended December 31, 2016 of $0.7 million, included in the Other category contributed to the increased SG&A. Partially offsetting the increased SG&A for the year ended December 31, 2016 was a $0.3 million decrease in non-severance-related SG&A associated with the activities of Orbital Gas Systems, North America, Inc., which opened in January 2015 and had increased start-up related costs in its first three months of operations. The remaining increases in SG&A during the year ended December 31, 2016 were associated with the ongoing activities to reach new customers, promote new product lines including Novum, GasPT, IRIS and VE, and new product introductions partially offset by foreign currency translation decreases at Orbital-UK. SG&A increased to 40% of total revenue compared to 38% of total revenue during the year ended December 31, 2015.
The Company anticipates the amount of sales and marketing expenditures and general and administrative expenses will improve from the 2017 levels following cost saving measures implemented during the year.
Depreciation and Amortization
|
For the Years Ended December 31, |
||||||||||||||||||||
|
Depreciation and Amortization by Segment |
Percent |
Percent |
||||||||||||||||||
|
(Dollars in thousands) |
2017 |
Change |
2016 |
Change |
2015 |
|||||||||||||||
|
Power and Electromechanical |
$ | 1,505 | 4.2 |
% |
$ | 1,445 | 14.9 |
% |
$ | 1,258 | ||||||||||
|
Energy |
1,345 | (4.0 |
)% |
1,401 | (28.0 |
)% |
1,945 | |||||||||||||
|
Other |
— | — |
% |
2 | (66.7 |
)% |
6 | |||||||||||||
|
Total depreciation and amortization |
$ | 2,850 | 0.1 |
% |
$ | 2,848 | (11.2 |
)% |
$ | 3,209 | ||||||||||
The depreciation and amortization expenses are associated with depreciating buildings, furniture, vehicles, equipment, software and other intangible assets over the estimated useful lives of the related assets. The above table includes $0.7 million, $0.5 million, and $0.3 million of depreciation and amortization, in 2017, 2016 and 2015, respectively that was included in cost of sales in the Power and Electromechanical segment and less than $0.1 million of depreciation and amortization included in cost of sales in the Energy segment in 2015.
2017 compared to 2016
Depreciation and amortization increased slightly for the year ended December 31, 2017 compared to the comparable period in 2016. The increase in depreciation and amortization at the Power and Electromechanical segment was due to additional product certification investments in 2017, which was partially offset by decreased depreciation and amortization at Orbital-UK due to generally lower foreign currency rates in 2017 compared to 2016.
2016 compared to 2015
Depreciation and amortization decreased for the year ended December 31, 2016 compared to the comparable period in 2015 as the intangible asset associated with the order backlog acquired with Orbital-UK was fully amortized during the first quarter of 2015 and UK assets were depreciated at lower foreign currency rates in 2016 compared to 2015. The increase in depreciation and amortization at the Power and Electromechanical segment was due to additional product certification investments in 2016 and the purchase of CUI-Canada in March 2015, which meant that 2016 had two more months of CUI-Canada depreciation and amortization than in 2015.
Research and Development
|
For the Years Ended December 31, |
||||||||||||||||||||
|
Research and Development by Segment |
Percent |
Percent |
||||||||||||||||||
|
(Dollars in thousands) |
2017 |
Change |
2016 |
Change |
2015 |
|||||||||||||||
|
Power and Electromechanical |
$ | 2,303 | 23.0 |
% |
$ | 1,873 | 9.7 |
% |
$ | 1,707 | ||||||||||
|
Energy |
222 | 55.2 |
% |
143 | 1.4 |
% |
141 | |||||||||||||
|
Other |
— | — |
% |
— | — |
% |
— | |||||||||||||
|
Total research and development |
$ | 2,525 | 25.2 |
% |
$ | 2,016 | 9.1 |
% |
$ | 1,848 | ||||||||||
The research and development costs are related to the various technologies for which CUI Global has acquired licensing rights or is developing internally. The expenditures for research and development have been directed primarily towards the further development of advanced power technologies including ICE technology, AMT Capacitive Encoders and towards the development of the GasPT and VE technologies. The Company expects that 2018 research and development expenses will be consistent with 2017 as the Company continues to expand its product offering and technologies due to market acceptance and customer integration.
Impairment Loss
As of December 31, 2017, management calculated an excess carrying amount for its Orbital-UK goodwill resulting in a $3.2 million impairment. See Critical Accounting Policies - Indefinite-Lived Intangibles and Goodwill Assets for more information on the impairment calculation.
Bad Debt
|
For the Years Ended December 31, |
||||||||||||||||||||
|
(Credit to) Provision for Bad Debt by Segment |
Percent |
Percent |
||||||||||||||||||
|
(Dollars in thousands) |
2017 |
Change |
2016 |
Change |
2015 |
|||||||||||||||
|
Power and Electromechanical |
$ | 3 | (93.9 |
)% |
$ | 49 | (30.0 |
)% |
$ | 70 | ||||||||||
|
Energy |
(16 |
) |
(136.4 |
)% |
44 | (64.8 |
)% |
125 | ||||||||||||
|
Other |
— | — |
% |
— | — |
% |
— | |||||||||||||
|
Total (credit to) provision for bad debt |
$ | (13 |
) |
(114.0 |
)% |
$ | 93 | (52.3 |
)% |
$ | 195 | |||||||||
(Credit to) provision for bad debt in 2017, 2016 and 2015 represents less than ½% of total revenues and relates to miscellaneous receivables, which the Company has either recorded an allowance for doubtful collections of the receivable or for which the Company has determined the balance to be uncollectible. Credits to the provision for bad debt are generated when aged receivables are collected at a higher rate than was previously reserved for. This results in the calculated reserve being reduced.
Other Income (expense)
|
For the Years Ended December 31, |
||||||||||||||||||||
|
(Dollars in thousands) |
2017 |
Percent Change |
2016 |
Percent Change |
2015 |
|||||||||||||||
|
Foreign exchange gain (loss) |
$ | 69 | (116.3 |
)% |
$ | (423 |
) |
8.2 |
% |
$ | (391 |
) |
||||||||
|
Earnings from investment |
— | — |
% |
— | (100.0 |
)% |
53 | |||||||||||||
|
Interest income |
20 | 25.0 |
% |
16 | (57.9 |
)% |
38 | |||||||||||||
|
Unrealized gain on derivative |
111 | (1.8 |
)% |
113 | 465.0 |
% |
20 | |||||||||||||
|
Amortization of investment premiums and discounts |
— | — |
% |
— | (100.0 |
)% |
(15 |
) |
||||||||||||
|
Other, net |
34 | (20.9 |
)% |
43 | 22.9 |
% |
35 | |||||||||||||
|
Total Other income (expense) |
$ | 234 | (193.2 |
)% |
$ | (251 |
) |
(3.5 |
)% |
$ | (260 |
) |
||||||||
Investment Income
The Company recognized investment income on equity investment in an affiliate of $0 in both 2017 and 2016, and $53 thousand for the first nine months of 2015. The Company discontinued the equity method of accounting for its investment as of October 1, 2015. During the three months ended March 31, 2016, the investment in TPI was exchanged for a note receivable from TPI of $0.4 million, which was the carrying value of the investment, earning interest at 5% per annum, due June 30, 2019. The Company recorded $18 thousand of interest income for the year ended December 31, 2017 and $19 thousand of interest income from the note in the year ended December 31, 2016. The interest receivable is settled on a quarterly basis via a non-cash offset against the finders-fee royalties earned by TPI on GasPT sales. Any remaining finders-fee royalties balance is offset against the note receivable quarterly. Management reviewed the note receivable for non-collectability as of December 31, 2017 and concluded that no allowance was necessary. For more information on this investment, see Note 2 Summary of Significant Accounting Policies - Investment and Note Receivable, to the Consolidated Financial Statements under Part II, Item 8, ‘‘Financial Statements and Supplementary Data.’’
Interest Expense
The Company incurred $0.5 million, $0.5 million, and $0.4 million of interest expense during 2017, 2016 and 2015, respectively. Interest expense is for interest on the secured note, secured promissory note, and line of credit and overdraft facility. A slight increase in 2017 was due primarily to the increased use of the Company's short-term credit facilities prior to the Company's public issuance of stock in October 2017.
Provision (benefit) for taxes
2017 compared to 2016
The Company is subject to taxation in the U.S., various state and foreign jurisdictions. We continue to record a full valuation allowance against the Company's U.S. net deferred tax assets as it is not more likely than not that the Company will realize a benefit from these assets in a future period. In future periods, tax benefits and related deferred tax assets will be recognized when management concludes realization of such amounts is more likely than not. In 2017, a net benefit of $1.6 million, was recorded to the income tax provision for the year ended December 31, 2017 resulting in an effective tax rate of 11.3% compared to a $38 thousand tax expense for the year ended December 31, 2016 and an effective tax rate of (0.5)%. For the year ended December 31, 2017, the income tax benefit primarily represents benefits from foreign net operating losses and the $0.9 million benefit resulting from the rate changes passed in the December 2017 Tax Act, partially offset by state minimum taxes and taxes on a profitable foreign jurisdiction, whereas, for the year ended December 31, 2016, the income tax provision primarily represents state minimum taxes and taxes on a profitable foreign jurisdiction. See Note 16 Income Taxes, for more information on the effects of the December 2017 Tax Act. As of December 31, 2017, we have federal, state and foreign net operating loss carry forwards of approximately $62.2 million, $57.2 million, and $5.0 million, respectively, and for which the federal and state net operating loss carry-forwards will expire between 2019 and 2037.
2016 compared to 2015
In 2016, a net expense of $38 thousand, was recorded to the income tax provision for the year ended December 31, 2016 resulting in an effective tax rate of (0.5%) compared to a $0.4 million tax benefit for the year ended December 31, 2015 and an effective tax rate of 6.4%. For the year ended December 31, 2016, the income tax provision primarily represents state minimum taxes and taxes on a profitable foreign jurisdiction, whereas, for the year ended December 31, 2015, the income tax benefit primarily represents benefits from foreign net operating losses partially offset by state minimum taxes and taxes on profitable foreign jurisdictions.
Consolidated Net Loss
2017 compared to 2016
The Company had a net loss of $12.6 million for the year ended December 31, 2017 compared to a net loss of $7.3 million for the year ended December 31, 2016. The increase in the consolidated net loss for 2017 was primarily the result of lower revenues coupled with increased cost of revenues due to a less favorable product mix in 2017 compared to 2016, and an impairment to goodwill of $3.2 million.
2016 compared to 2015
The Company had a net loss of $7.3 million for the year ended December 31, 2016 compared to a net loss of $6.0 million for the year ended December 31, 2015. The increase in the consolidated net loss for 2016 was primarily the result of increased selling, general and administrative expenses, and increased tax expense.
Effect of Inflation and Changing Prices
The Company believes, that during fiscal years ended December 31, 2017, 2016 and 2015, the effect of a hypothetical 100 basis point shift in foreign currency exchange rates applicable to our business would not have had a material impact on our consolidated financial statements.
Recently Adopted and Recently Issued Accounting Standards
Information on recently adopted and recently issued accounting standards is included in Note 2 Summary of Significant Accounting Policies - Recent Accounting Pronouncements, to the Consolidated Financial Statements under Part II, Item 8, ‘‘Financial Statements and Supplementary Data.’’
Item 7A. Quantitative and Qualitative Disclosure about Market Risk
We are exposed to market risk in the ordinary course of our business. Market risk represents the risk of loss that may impact our financial position due to adverse changes in financial market prices and rates. This market risk exposure is primarily a result of fluctuations in foreign currency exchange rates and interest rates. The Company neither holds nor issues financial instruments for trading purposes.
The following sections provide quantitative information on the Company’s exposure to foreign currency exchange rate risk and stock price risk. The Company makes use of sensitivity analyses that are inherently limited in estimating actual losses in fair value that can occur from changes in market conditions.
Foreign Currency Exchange Rates
The Company conducts operations in four principal currencies: the U.S. dollar, the British pound sterling, the Canadian dollar and the Japanese yen. These currencies operate primarily as the functional currency for the Company’s U.S., UK, Canadian and Japanese operations, respectively. Cash is managed centrally within each of the four regions with net earnings invested in the U.S. and working capital requirements met from existing U.S. intercompany liquid funds.
Because of fluctuations in currency exchange rates, the Company is subject to currency translation exposure on the results of its operations. Foreign currency translation risk is the risk that exchange rate gains or losses arise from translating foreign entities’ statements of earnings and balance sheets from functional currency to the Company’s reporting currency, the U.S. dollar, for consolidation purposes. As currency exchange rates fluctuate, translation of our Statements of Operations into U.S. dollars affects the comparability of revenues and operating expenses between years.
Revenues and operating expenses are primarily denominated in the currencies of the countries in which our operations are located, the U.S., UK, Canada and Japan. Our consolidated results of operations and cash flows are, therefore, subject to fluctuations due to changes in foreign currency exchange rates and may be adversely affected in the future due to changes in foreign exchange rates.
The table below details the percentage of revenues and expenses by the three principal currencies for the fiscal years ended December 31, 2017, 2016 and 2015:
|
U.S. Dollar |
British Pound Sterling |
Canadian Dollar (1) |
Japanese Yen |
|||||||||||||
|
Fiscal year ended December 31, 2017 |
||||||||||||||||
|
Revenues |
80 |
% |
19 |
% |
— |
% |
1 |
% |
||||||||
|
Operating expenses |
61 |
% |
30 |
% |
8 |
% |
1 |
% |
||||||||
|
Fiscal year ended December 31, 2016 |
||||||||||||||||
|
Revenues |
72 |
% |
27 |
% |
— |
% |
1 |
% |
||||||||
|
Operating expenses |
67 |
% |
25 |
% |
7 |
% |
1 |
% |
||||||||
|
Fiscal year ended December 31, 2015 |
||||||||||||||||
|
Revenues |
69 |
% |
29 |
% |
1 |
% |
1 |
% |
||||||||
|
Operating expenses |
66 |
% |
27 |
% |
6 |
% |
1 |
% |
||||||||
(1) On March 5, 2015, the Company closed on an asset purchase agreement to acquire the assets of Tectrol, Inc. (CUI-Canada) which was effective March 1, 2015, see Note 4 Acquisitions.
To date, we have not entered into any hedging arrangements with respect to foreign currency risk and have limited activity with forward foreign currency contracts or other similar derivative instruments.
Investment Risk
The Company has an Investment Policy that, inter alia, provides an internal control structure that takes into consideration safety (credit risk and interest rate risk), liquidity and yield. Our Investment officers, CEO and CFO, oversee the investment portfolio and compile a quarterly analysis of the investment portfolio.
Cash and cash equivalents are diversified and maintained with several financial institutions. Deposits held with banks may exceed the amount of insurance provided on such deposits. Generally, these deposits may be redeemed upon demand and are maintained with financial institutions of reputable credit, therefore, bear minimal credit risk.
The Company has trade receivable and revenue concentrations with large customers, which include a large concentration of trade receivables and revenues in the United Kingdom.
Item 8. Financial Statements and Supplementary Data
This item includes the following financial information:
|
Page |
||
|
Report of Independent Registered Public Accounting Firm |
47 |
|
|
Consolidated Balance Sheets |
48 |
|
|
Consolidated Statements of Operations |
49 |
|
|
Consolidated Statements of Comprehensive Income and (Loss) |
49 |
|
|
Consolidated Statements of Changes in Stockholders’ Equity |
50 |
|
|
Consolidated Statements of Cash Flows |
51 |
|
|
Notes to Consolidated Financial Statements |
52-84 |
|
|
Quarterly Financial Data (unaudited) |
85 |
|
Report of Independent Registered Public Accounting Firm
Stockholders and Board of Directors
CUI Global, Inc.
Tualatin, Oregon
Opinion on the Consolidated Financial Statements
We have audited the accompanying consolidated balance sheets of CUI Global, Inc. and Subsidiaries (the “Company”) as of December 31, 2017 and 2016, the related consolidated statements of operations, comprehensive income and (loss), changes in stockholders’ equity, and cash flows for each of the three years in the period ended December 31, 2017, and the related notes (collectively referred to as the “consolidated financial statements”). In our opinion, the consolidated financial statements present fairly, in all material respects, the financial position of the Company at December 31, 2017 and 2016, and the results of their operations and their cash flows for each of the three years in the period ended December 31, 2017, in conformity with accounting principles generally accepted in the United States of America.
We also have audited, in accordance with the standards of the Public Company Accounting Oversight Board (United States) (“PCAOB”), the Company's internal control over financial reporting as of December 31, 2017, based on criteria established in Internal Control - Integrated Framework (2013) issued by the Committee of Sponsoring Organizations of the Treadway Commission (“COSO”) and our report dated March 14, 2018 expressed an unqualified opinion thereon.
Basis for Opinion
These consolidated financial statements are the responsibility of the Company’s management. Our responsibility is to express an opinion on the Company’s consolidated financial statements based on our audits. We are a public accounting firm registered with the PCAOB and are required to be independent with respect to the Company in accordance with the U.S. federal securities laws and the applicable rules and regulations of the Securities and Exchange Commission and the PCAOB.
We conducted our audits in accordance with the standards of the PCAOB. Those standards require that we plan and perform the audit to obtain reasonable assurance about whether the consolidated financial statements are free of material misstatement, whether due to error or fraud.
Our audits included performing procedures to assess the risks of material misstatement of the consolidated financial statements, whether due to error or fraud, and performing procedures that respond to those risks. Such procedures included examining, on a test basis, evidence regarding the amounts and disclosures in the consolidated financial statements. Our audits also included evaluating the accounting principles used and significant estimates made by management, as well as evaluating the overall presentation of the consolidated financial statements. We believe that our audits provide a reasonable basis for our opinion.
/s/ Perkins & Company, P.C.
We have served as the Company's auditor since 2014.
Portland, Oregon
March 14, 2018
CUI Global, Inc.
Consolidated Balance Sheets
As of December 31, 2017 and 2016
|
December 31, |
December 31, |
|||||||
|
(In thousands, except share and per share data) |
2017 |
2016 |
||||||
|
Assets: |
||||||||
|
Current Assets: |
||||||||
|
Cash and cash equivalents |
$ | 12,646 | $ | 4,617 | ||||
|
Trade accounts receivable, net of allowance of $135 and $151, respectively |
10,833 | 9,375 | ||||||
|
Inventories, net of allowance of $946 and $774, respectively |
13,892 | 13,202 | ||||||
|
Costs in excess of billings |
2,299 | 2,735 | ||||||
|
Prepaid expenses and other |
1,606 | 2,174 | ||||||
|
Total current assets |
41,276 | 32,103 | ||||||
|
Property and equipment, less accumulated depreciation of $4,155 and $3,299, respectively |
11,242 | 10,952 | ||||||
|
Goodwill |
17,641 | 20,125 | ||||||
|
Other intangible assets, less accumulated amortization of $11,900 and $9,438, respectively |
15,568 | 16,201 | ||||||
|
Note receivable, less current portion |
317 | 362 | ||||||
|
Deposits and other assets |
1,865 | 100 | ||||||
|
Total assets |
$ | 87,909 | $ | 79,843 | ||||
|
Liabilities and Stockholders' Equity: |
||||||||
|
Current Liabilities: |
||||||||
|
Accounts payable |
$ | 5,110 | $ | 6,170 | ||||
|
Mortgage note payable, current portion |
94 | 89 | ||||||
|
Capital lease obligation, current portion |
4 | 28 | ||||||
|
Accrued expenses |
4,182 | 4,542 | ||||||
|
Billings in excess of costs |
1,840 | 1,977 | ||||||
|
Unearned revenue |
7,684 | 4,932 | ||||||
|
Total current liabilities |
18,914 | 17,738 | ||||||
|
Long term mortgage note payable, less current portion |
3,256 | 3,350 | ||||||
|
Long term note payable, related party |
5,304 | 5,304 | ||||||
|
Capital lease obligation, less current portion |
9 | 12 | ||||||
|
Derivative liability |
356 | 467 | ||||||
|
Deferred tax liabilities |
2,414 | 4,120 | ||||||
|
Other long-term liabilities |
170 | 217 | ||||||
|
Total liabilities |
30,423 | 31,208 | ||||||
|
Stockholders' Equity: |
||||||||
|
Preferred stock, par value $0.001; 10,000,000 shares authorized; no shares issued at December 31, 2017 or December 31, 2016 |
— | — | ||||||
|
Common stock, par value $0.001; 325,000,000 shares authorized; 28,406,856 shares issued and outstanding at December 31, 2017 and 20,916,848 shares issued and outstanding at December 31, 2016 |
28 | 21 | ||||||
|
Additional paid-in capital |
169,527 | 150,174 | ||||||
|
Accumulated deficit |
(108,559 |
) |
(95,970 |
) |
||||
|
Accumulated other comprehensive loss |
(3,510 |
) |
(5,590 |
) |
||||
|
Total stockholders' equity |
57,486 | 48,635 | ||||||
|
Total liabilities and stockholders' equity |
$ | 87,909 | $ | 79,843 | ||||
See accompanying notes to consolidated financial statements
CUI Global, Inc.
Consolidated Statements of Operations
For the Years Ended December 31, 2017, 2016 and 2015
|
(In thousands, except share and per share amounts) |
||||||||||||
|
2017 |
2016 |
2015 |
||||||||||
|
Total revenues |
$ | 83,275 | $ | 86,461 | $ | 86,240 | ||||||
|
Cost of revenues |
55,406 | 54,200 | 53,948 | |||||||||
|
Gross profit |
27,869 | 32,261 | 32,292 | |||||||||
|
Operating expenses: |
||||||||||||
|
Selling, general and administrative |
33,921 | 34,239 | 33,023 | |||||||||
|
Depreciation and amortization |
2,163 | 2,366 | 2,862 | |||||||||
|
Research and development |
2,525 | 2,016 | 1,848 | |||||||||
|
(Credit to) provision for bad debt |
(13 |
) |
93 | 195 | ||||||||
|
Impairment of goodwill and intangible assets |
3,155 | — | 4 | |||||||||
|
Other operating expenses |
47 | 57 | 54 | |||||||||
|
Total operating expenses |
41,798 | 38,771 | 37,986 | |||||||||
|
Loss from operations |
(13,929 |
) |
(6,510 |
) |
(5,694 |
) |
||||||
|
Other income (expense) |
234 | (251 |
) |
(260 |
) |
|||||||
|
Interest expense |
(500 |
) |
(467 |
) |
(441 |
) |
||||||
|
Loss before taxes |
(14,195 |
) |
(7,228 |
) |
(6,395 |
) |
||||||
|
Income tax (benefit) expense |
(1,606 |
) |
38 | (408 |
) |
|||||||
|
Net loss |
$ | (12,589 |
) |
$ | (7,266 |
) |
$ | (5,987 |
) |
|||
|
Basic and diluted weighted average number of shares outstanding |
22,397,865 | 20,897,812 | 20,792,494 | |||||||||
|
Basic and diluted loss per common share |
$ | (0.56 |
) |
$ | (0.35 |
) |
$ | (0.29 |
) |
|||
See accompanying notes to consolidated financial statements
CUI Global, Inc.
Consolidated Statements of Comprehensive Income and (Loss)
For the Years Ended December 31, 2017, 2016 and 2015
(In thousands)
|
2017 |
2016 |
2015 |
||||||||||
|
Net loss |
$ | (12,589 |
) |
$ | (7,266 |
) |
$ | (5,987 |
) |
|||
|
Other comprehensive income (loss) |
||||||||||||
|
Foreign currency translation adjustment |
2,080 | (4,150 |
) |
(1,708 |
) |
|||||||
|
Comprehensive loss |
$ | (10,509 |
) |
$ | (11,416 |
) |
$ | (7,695 |
) |
|||
See accompanying notes to consolidated financial statements
CUI Global, Inc.
Consolidated Statements of Changes in Stockholders’ Equity
For the Years Ended December 31, 2017, 2016 and 2015
(In thousands, except share amounts)
|
Additional |
Accumulated Other |
Total |
||||||||||||||||||||||
|
Common Stock |
Paid-in |
Accumulated |
Comprehensive |
Stockholders' |
||||||||||||||||||||
|
Shares |
Amount |
Capital |
Deficit |
Income (Loss) |
Equity |
|||||||||||||||||||
|
Balance, December 31, 2014 |
20,747,740 | $ | 21 | $ | 148,398 | $ | (82,717 |
) |
$ | 268 | $ | 65,970 | ||||||||||||
|
Options granted for services and compensation |
— | — | 478 | — | — | 478 | ||||||||||||||||||
|
Common stock issued for exercises of options |
122 | — | — | — | — | — | ||||||||||||||||||
|
Common stock issued and to be issued for compensation, services, and royalty payments |
58,357 | — | 763 | — | — | 763 | ||||||||||||||||||
|
Net loss for the year ended December 31, 2015 |
— | — | — | (5,987 |
) |
— | (5,987 |
) |
||||||||||||||||
|
Other comprehensive loss |
— | — | — | — | (1,708 |
) |
(1,708 |
) |
||||||||||||||||
|
Balance, December 31, 2015 |
20,806,219 | 21 | 149,639 | (88,704 |
) |
(1,440 |
) |
59,516 | ||||||||||||||||
|
Options granted for services and compensation |
— | — | 227 | — | — | 227 | ||||||||||||||||||
|
Common stock issued for exercises of options |
718 | — | — | — | — | — | ||||||||||||||||||
|
Common stock issued for compensation, services, and royalty payments |
109,911 | — | 308 | — | — | 308 | ||||||||||||||||||
|
Net loss for the year ended December 31, 2016 |
— | — | — | (7,266 |
) |
— | (7,266 |
) |
||||||||||||||||
|
Other comprehensive loss |
— | — | — | — | (4,150 |
) |
(4,150 |
) |
||||||||||||||||
|
Balance, December 31, 2016 |
20,916,848 | 21 | 150,174 | (95,970 |
) |
(5,590 |
) |
48,635 | ||||||||||||||||
|
Issuance of common stock, net |
7,392,856 | 7 | 18,898 | — | — | 18,905 | ||||||||||||||||||
|
Common stock issued for exercises of options |
245 | — | — | — | — | — | ||||||||||||||||||
|
Common stock issued for compensation, services, and royalty payments |
96,907 | — | 455 | — | — | 455 | ||||||||||||||||||
|
Net loss for the year ended December 31, 2017 |
— | — | — | (12,589 |
) |
— | (12,589 |
) |
||||||||||||||||
|
Other comprehensive income |
— | — | — | — | 2,080 | 2,080 | ||||||||||||||||||
|
Balance, December 31, 2017 |
28,406,856 | $ | 28 | $ | 169,527 | $ | (108,559 |
) |
$ | (3,510 |
) |
$ | 57,486 | |||||||||||
See accompanying notes to consolidated financial statements
CUI Global, Inc.
Consolidated Statements of Cash Flows
For the Years Ended December 31, 2017, 2016 and 2015
(In thousands)
|
2017 |
2016 |
2015 |
||||||||||
|
CASH FLOWS FROM OPERATING ACTIVITIES: |
||||||||||||
|
Net loss |
$ | (12,589 |
) |
$ | (7,266 |
) |
$ | (5,987 |
) |
|||
|
Adjustments to reconcile net (loss) to net cash used in operating activities: |
||||||||||||
|
Depreciation |
1,009 | 925 | 854 | |||||||||
|
Amortization of intangibles |
1,841 | 1,923 | 2,355 | |||||||||
|
Amortization of investment premiums and discounts |
— | — | 15 | |||||||||
|
Stock and options issued and stock to be issued for compensation, royalties and services |
425 | 734 | 1,267 | |||||||||
|
Unrealized gain on derivative liability |
(111 |
) |
(113 |
) |
(20 |
) |
||||||
|
Non-cash royalties, net (see Note 2 - Investment and note receivable) |
(3 |
) |
19 | — | ||||||||
|
Non-cash earnings on equity method investment |
— | — | (53 |
) |
||||||||
|
(Credit to) provision for bad debt expense and returns allowances |
(13 |
) |
93 | 192 | ||||||||
|
Credit to warranty reserve |
(16 |
) |
— | — | ||||||||
|
Deferred income taxes |
(1,767 |
) |
(107 |
) |
(534 |
) |
||||||
|
Non-cash unrealized foreign currency (gains)/losses |
(362 |
) |
172 | 219 | ||||||||
|
Impairment of goodwill and intangible assets |
3,155 | — | 4 | |||||||||
|
Inventory reserve |
138 | 312 | 94 | |||||||||
|
Loss on disposal of assets |
47 | 57 | 54 | |||||||||
|
Other, net |
— | — | (5 |
) |
||||||||
|
(Increase) decrease in operating assets: |
||||||||||||
|
Trade accounts receivable |
(1,150 |
) |
4,432 | (3,323 |
) |
|||||||
|
Inventories |
(411 |
) |
(1,672 |
) |
(3,708 |
) |
||||||
|
Costs in excess of billings |
591 | (1,454 |
) |
(1,612 |
) |
|||||||
|
Prepaid expenses and other current assets |
(421 |
) |
105 | (856 |
) |
|||||||
|
Deposits and other assets |
(506 |
) |
(25 |
) |
68 | |||||||
|
Increase (decrease) in operating liabilities: |
||||||||||||
|
Accounts payable |
(1,163 |
) |
495 | 2,050 | ||||||||
|
Accrued expenses |
(448 |
) |
(518 |
) |
1,847 | |||||||
|
Contingent consideration |
3 | (54 |
) |
— | ||||||||
|
Unearned revenue |
2,666 | 1,179 | 2,204 | |||||||||
|
Billings in excess of costs |
(284 |
) |
162 | (1,307 |
) |
|||||||
|
NET CASH USED IN OPERATING ACTIVITIES |
(9,369 |
) |
(601 |
) |
(6,182 |
) |
||||||
|
CASH FLOWS FROM INVESTING ACTIVITIES: |
||||||||||||
|
Acquisition of a business, net of contingent consideration (Note 4) |
— | — | (4,285 |
) |
||||||||
|
Purchase of property and equipment |
(893 |
) |
(824 |
) |
(5,045 |
) |
||||||
|
Proceeds from sale of property and equipment |
8 | 27 | 17 | |||||||||
|
Investments in other intangible assets |
(638 |
) |
(850 |
) |
(128 |
) |
||||||
|
Proceeds from notes receivable |
39 | — | — | |||||||||
|
Maturities of short term investments held to maturity |
— | — | 11,145 | |||||||||
|
Receipts from deferred property grant |
— | — | 425 | |||||||||
|
NET CASH (USED IN) PROVIDED BY INVESTING ACTIVITIES |
(1,484 |
) |
(1,647 |
) |
2,129 | |||||||
|
CASH FLOWS FROM FINANCING ACTIVITIES: |
||||||||||||
|
Proceeds from overdraft facility |
9,782 | — | — | |||||||||
|
Payments on overdraft facility |
(9,782 |
) |
— | — | ||||||||
|
Proceeds from line of credit |
22,332 | — | — | |||||||||
|
Payments on line of credit |
(22,332 |
) |
— | — | ||||||||
|
Payments on capital lease obligations |
(29 |
) |
(41 |
) |
(32 |
) |
||||||
|
Payments on notes and loans payable |
(89 |
) |
(85 |
) |
(81 |
) |
||||||
|
Payments on contingent consideration |
(61 |
) |
(59 |
) |
— | |||||||
|
Proceeds from sales of common stock, net of offering costs |
18,905 | — | — | |||||||||
|
NET CASH PROVIDED BY (USED IN) FINANCING ACTIVITIES |
18,726 | (185 |
) |
(113 |
) |
|||||||
|
Effect of exchange rate changes on cash |
156 | (217 |
) |
(271 |
) |
|||||||
|
Net increase (decrease) in cash and cash equivalents |
8,029 | (2,650 |
) |
(4,437 |
) |
|||||||
|
Cash and cash equivalents at beginning of year |
4,617 | 7,267 | 11,704 | |||||||||
|
CASH AND CASH EQUIVALENTS AT END OF YEAR |
$ | 12,646 | $ | 4,617 | $ | 7,267 | ||||||
|
SUPPLEMENTAL DISCLOSURE OF CASH FLOW INFORMATION: |
||||||||||||
|
Income taxes paid |
$ | 158 | $ | 211 | $ | 44 | ||||||
|
Interest paid, net of capitalized interest |
$ | 500 | $ | 469 | $ | 440 | ||||||
|
SUPPLEMENTAL DISCLOSURE OF NON-CASH INVESTING AND FINANCING ACTIVITIES: |
||||||||||||
|
Common stock issued and issuable for royalties payable pursuant to product agreements, related party |
$ | 16 | $ | 38 | $ | 22 | ||||||
|
Contingent consideration recorded in acquisition |
$ | — | $ | — | $ | 216 | ||||||
|
Common stock issued and to be issued for consulting services and compensation in common stock |
$ | 439 | $ | 270 | $ | 741 | ||||||
|
Exchange of investment in TPI in return for note receivable (Note 2) |
$ | — | $ | 385 | $ | — | ||||||
|
Accrued property and equipment purchases at December 31 |
$ | 27 | $ | 45 | $ | 99 | ||||||
|
Accrued investment in other intangible assets at December 31 |
$ | 15 | $ | 48 | $ | 50 | ||||||
|
Assets acquired via capital leases |
$ | — | $ | 19 | $ | — | ||||||
See accompanying notes to consolidated financial statements
CUI Global, Inc.
Notes to Consolidated Financial Statements
1. NATURE OF OPERATIONS AND BASIS OF PRESENTATION
CUI Global Inc. (CUI Global) is a platform company composed of two segments, the Power and Electromechanical segment and the Energy segment.
The Power and Electromechanical segment is made up of the wholly owned subsidiaries: CUI Inc. (CUI), based in Tualatin, Oregon; CUI Japan, based in Tokyo, Japan; and CUI-Canada, based in Toronto, Canada. All three subsidiaries are providers of power and electromechanical components including power supplies, transformers, converters, connectors and industrial controls for Original Equipment Manufacturers (OEMs).
The Power and Electromechanical segment defines its product offerings into two categories: power solutions, which consists of external and embedded ac-dc power supplies, dc-dc converters, and advanced power solutions including the ICE products, and components including connectors, speakers, buzzers, and control solutions including encoders and sensors. These offerings provide a technology architecture that addresses power and related accessories to industries as broadly ranging as consumer electronics, medical and defense.
The Company’s Energy segment is made up of Orbital Gas Systems Ltd. (Orbital-UK) and Orbital Gas Systems, North America, Inc. (Orbital North America), collectively referred to as "Orbital." This business segment was formed when in April 2013, CUI Global acquired 100% of the capital stock of Orbital-UK, a United Kingdom-based provider of natural gas infrastructure and advanced technology, including metering, odorization, remote telemetry units (‘‘RTU’’) and a diverse range of personalized gas engineering solutions to the gas utilities, power generation, emissions, manufacturing and automotive industries. In January 2015, CUI Global formed and opened Orbital Gas Systems, North America, Inc. a wholly owned subsidiary, to represent the Energy segment in the North American market. GasPT® and VE® Technology products are sold through Orbital.
During the year ended December 31, 2017, total revenues at CUI Global consisted of 77% from the Power and Electromechanical segment and 23% from the Energy segment.
2. SUMMARY OF SIGNIFICANT ACCOUNTING POLICIES
Use of Estimates
The preparation of financial statements in conformity with accounting principles generally accepted in the United States of America requires management to make estimates and assumptions that affect the reported amounts of assets and liabilities, disclosure of contingent assets and liabilities at the date of the financial statements, and the reported amounts of revenues and expenses during the reporting period. Actual results could differ from those estimates. Significant estimates include estimates used to review the Company’s goodwill, impairments and estimations of long-lived assets, revenue recognition on percentage of completion type contracts, allowances for uncollectible accounts, inventory valuation, warranty reserves, valuations of non-cash capital stock issuances and the valuation allowance on deferred tax assets. The Company bases its estimates on historical experience and on various other assumptions that are believed to be reasonable in the circumstances, the results of which form the basis for making judgments about the carrying values of assets and liabilities that are not readily apparent from other sources. Actual results may differ from these estimates under different assumptions or conditions.
Principles of Consolidation
The accompanying consolidated financial statements include the accounts of CUI Global, Inc. and its wholly owned subsidiaries CUI Inc., CUI Japan, CUI-Canada (included since March 1, 2015), CUI Properties, LLC, Orbital Gas Systems, Ltd. and Orbital Gas Systems, North America, Inc. hereafter referred to as the ‘‘Company.’’ Significant intercompany accounts and transactions have been eliminated in consolidation.
Fair Value of Financial Instruments
Accounting Standards Codification (‘‘ASC’’) 820 ‘‘Fair Value Measurements and Disclosures’’ (‘‘ASC 820’’) defines fair value, establishes a framework for measuring fair value under generally accepted accounting principles in the U.S., and enhances disclosures about fair value measurements. ASC 820 describes a fair value hierarchy based on three levels of inputs, of which the first two are considered observable and the last unobservable, that may be used to measure fair value, which are the following:
|
• |
Level 1 – Pricing inputs are quoted prices available in active markets for identical assets or liabilities as of the reporting date. |
|
• |
Level 2 – Pricing inputs are quoted for similar assets, or inputs that are observable, either directly or indirectly, for substantially the full term through corroboration with observable market data. Level 2 includes assets or liabilities valued at quoted prices adjusted for legal or contractual restrictions specific to these investments. |
|
• |
Level 3 – Pricing inputs are unobservable for the assets or liabilities; that is, the inputs reflect the reporting entity’s own assumptions about the assumptions market participants would use in pricing the asset or liability. |
The Company determines when a financial instrument transfers between levels based on management’s judgment of the significance of unobservable inputs used to calculate the fair value of the financial instrument.
Management believes the carrying amounts of the short-term financial instruments, including cash and cash equivalents, accounts receivable, costs in excess of billings, prepaid expense and other assets, accounts payable, accrued liabilities, billings in excess of costs, unearned revenue, and other liabilities reflected in the accompanying balance sheet approximate fair value at December 31, 2017 and 2016 due to the relatively short-term nature of these instruments. Mortgage debt and related notes payable approximate fair value based on current market conditions. The Company measures its derivative liability on a recurring basis using significant observable inputs (Level 2). The Company’s derivative liability is valued using a LIBOR swap curve.
Cash and Cash Equivalents
Cash includes deposits at financial institutions with maturities of three months or less. The Company at times has cash in banks in excess of FDIC insurance limits and places its temporary cash investments with high credit quality financial institutions. The Company considers all highly liquid marketable securities with maturities of 90 days or less at the date of acquisition to be cash equivalents. Cash equivalents include money market funds, certificates of deposit and commercial paper. At December 31, 2017 and 2016, the Company had $0.9 million and $0.8 million, respectively, of cash and cash equivalents balances at domestic financial institutions that were covered under the FDIC insured deposits programs and $0.2 million and $0.2 million, respectively, at foreign financial institutions covered under the United Kingdom Financial Services Compensation (FSC) and the Canada Deposit Insurance Corporation (CDIC). At December 31, 2017 and 2016, the Company held $0.1 million and $0.2 million, respectively, in Japanese foreign bank accounts and $0.1 million and $1.0 million, respectively, in European foreign bank accounts and $0.1 million and $0.1 million, respectively, in Canadian bank accounts.
Investment and Note Receivable
Test Products International, Inc. ("TPI") is a provider of handheld test and measurement equipment. Through the acquisition of CUI Inc., the Company obtained 352,589 common shares (representing an 8.94% interest from January 1 to March 31, 2014 and 8.5% thereafter). Through September 30, 2015, CUI Global enjoyed a close association with TPI through common related parties, IED, Inc. and James McKenzie as well as through participation that allowed for a significant amount of influence over TPI’s business decisions. Accordingly, through September 30, 2015, for financial statement purposes, the Company recognized its investment in TPI under the equity method.
Subsequent to September 30, 2015, CUI Global and its common related parties were unable to obtain a timely financial report, which was inconsistent with prior periods, evidencing a reduction in the influence of CUI Global over TPI. Based on this change in influence, and CUI Global’s level of technical control through its 8.5% equity interest, management determined that effective with the quarter ended December 31, 2015 that CUI Global no longer had significant influence over TPI. Accordingly, the Company's investment in TPI was accounted for under the cost method in the fourth quarter of 2015. During the three months ended March 31, 2016, the investment in TPI was exchanged for a note receivable from TPI of $0.4 million, which was the carrying value of the investment, earning interest at 5% per annum, due June 30, 2019. The Company recorded $18 thousand and $19 thousand of interest income from the note for the years ended December 31, 2017 and 2016, respectively. The interest receivable is settled on a quarterly basis via a non-cash offset against the finders-fee royalties earned by TPI on GasPT sales. Finders-fee royalties of $16 thousand and $37 thousand were earned by TPI in the years ended December 31, 2017 and 2016, respectively, and offset against the note receivable quarterly. The Company also received $39 thousand in cash payments against the note in the year ended December 31, 2017. CUI Global reviewed the note receivable for non-collectability as of December 31, 2017 and concluded that no allowance was necessary.
Presented below are the equity method earnings through nine months ended September 30, 2015, which is the final period that CUI Global had significant influence over TPI:
|
For the |
||||
|
Nine Months Ended September 30, |
||||
|
(In thousands) |
2015 |
|||
|
Revenues |
$ | 10,718 | ||
|
Operating income |
674 | |||
|
Net profit |
621 | |||
|
Other comprehensive profit (loss): |
||||
|
Foreign currency translation adjustment |
— | |||
|
Comprehensive net profit |
$ | 621 | ||
|
Company share of net profit |
$ | 53 | ||
Accounts Receivable and Allowance for Uncollectible Accounts
Accounts receivable consist of the receivables associated with revenue derived from product sales including present amounts due to contracts accounted for under percentage of completion method. An allowance for uncollectible accounts is recorded to allow for any amounts that may not be recoverable, based on an analysis of prior collection experience, customer credit worthiness and current economic trends. Based on management’s review of accounts receivable, an allowance for doubtful accounts of $0.1 million and $0.2 million at December 31, 2017 and 2016, respectively, is considered adequate. The reserve in both periods considers aged receivables that management believes should be specifically reserved for as well as historic experience with bad debts to determine the total reserve appropriate for each period. Receivables are determined to be past due based on the payment terms of original invoices. The Company grants credit to its customers, with standard terms of Net 30 days. The Company routinely assesses the financial strength of its customers and, therefore, believes that its accounts receivable credit risk exposure is limited. Additionally, the Company maintains a foreign credit receivables insurance policy that covers many of the CUI Inc. foreign customer receivable balances in effort to further reduce credit risk exposure. Activity in the allowance for doubtful accounts for the years ended December 31, 2017, 2016 and 2015 is as follows:
|
(In thousands) |
For the Years ended December 31, |
|||||||||||
|
2017 |
2016 |
2015 |
||||||||||
|
Allowance for doubtful accounts, beginning of year |
$ | 151 | $ | 90 | $ | 254 | ||||||
|
(Credit) charge to costs and expenses |
(13 |
) |
93 | 192 | ||||||||
|
Deductions |
(3 |
) |
(32 |
) |
(356 |
) |
||||||
|
Allowance for doubtful accounts, end of year |
$ | 135 | $ | 151 | $ | 90 | ||||||
Inventories
Inventories consist of finished and unfinished products and are stated at the lower of cost or market through either the first-in, first-out (FIFO) method as a cost flow convention or through the moving average cost method.
At December 31, 2017, and 2016, inventory is presented on the balance sheet net of reserves. The Company provides reserves for inventories estimated to be excess, obsolete or unmarketable. The Company’s estimation process for assessing the net realizable value is based upon its known backlog, projected future demand, historical usage and expected market conditions. Manufactured inventory includes material, labor and overhead. Inventory by category consists of:
|
As of December 31, |
||||||||
|
(In thousands) |
2017 |
2016 |
||||||
|
Finished goods |
$ | 10,792 | $ | 9,684 | ||||
|
Raw materials |
3,287 | 3,357 | ||||||
|
Work-in-process |
759 | 935 | ||||||
|
Inventory reserves |
(946 |
) |
(774 |
) |
||||
|
Total inventories |
$ | 13,892 | $ | 13,202 | ||||
Activity in inventory reserves is as follows:
|
(In thousands) |
For the Years ended December 31, |
|||||||||||
|
2017 |
2016 |
2015 |
||||||||||
|
Inventory reserves, beginning of year |
$ | 774 | $ | 483 | $ | 394 | ||||||
|
Charge to costs and expenses |
138 | 312 | 94 | |||||||||
|
Other additions (deductions) |
34 | (21 |
) |
(5 |
) |
|||||||
|
Inventory reserves, end of year |
$ | 946 | $ | 774 | $ | 483 | ||||||
Prepaid Expenses, Deposits and Other
|
As of December 31, |
||||||||
|
(In thousands) |
2017 |
2016 |
||||||
|
Prepaid expenses and other |
$ | 1,606 | $ | 2,174 | ||||
|
Deposits and other assets |
1,865 | 100 | ||||||
During the second quarter of 2017, prepaid royalties in the amount of $1.6 million were transferred to long-term and included in Deposits and other assets from prepaid expenses due to a change in the estimated period of when those prepayments will be amortized based upon management’s assessment of future GasPT sales. There was $1.8 million of prepaid royalties included in Deposits and other assets at December 31, 2017.
Land, Buildings, Improvements, Furniture, Vehicles, Equipment, and Leasehold Improvements
Land is recorded at cost and includes expenditures made to ready it for use. Land is considered to have an infinite useful life.
Buildings and improvements are recorded at cost.
Furniture, vehicles, and equipment are recorded at cost and include major expenditures, which increase productivity or substantially increase useful lives.
Leasehold improvements are recorded at cost and are depreciated over the lesser of the lease term, estimated useful life, or ten years.
The cost of buildings, improvements, furniture, vehicles, and equipment is depreciated over the estimated useful lives of the related assets.
Depreciation is computed using the straight-line method for financial reporting purposes. The estimated useful lives for buildings, improvements, furniture, vehicles, and equipment are as follows:
|
Estimated Useful Life (years) |
|||||
|
Buildings and improvements |
5 | to | 39 | ||
|
Furniture and equipment |
3 | to | 10 | ||
|
Vehicles |
3 | to | 5 | ||
Maintenance, repairs and minor replacements are charged to expenses when incurred. When furniture, vehicles and equipment are sold or otherwise disposed of, the asset and related accumulated depreciation are removed from this account, and any gain or loss is included in the statement of operations.
Long-Lived Assets
Long-lived assets including finite-lived identifiable assets are periodically reviewed for impairment whenever circumstances and situations change such that there is an indication that the carrying amounts may not be recoverable. In performing the review for recoverability, the future cash flows expected to result from the use of the asset and its eventual disposition are estimated. If the sum of the expected future cash flows (undiscounted and without interest charges) is less than the carrying amount of the long-lived asset, an impairment loss is recognized as the excess of the carrying amount over the fair value. Otherwise, an impairment loss is not recognized. Management estimates the fair value and the estimated future cash flows expected. Any changes in these estimates could impact whether there was impairment and the amount of the impairment.
Identifiable Intangible Assets
Intangible assets are stated at cost net of accumulated amortization and impairment. The fair value for intangible assets acquired through acquisitions is measured at the time of acquisition utilizing the following inputs, as needed:
|
1. |
Inputs used to measure fair value are unadjusted quote prices available in active markets for the identical assets or liabilities if available. |
|
2. |
Inputs used to measure fair value, other than quoted prices included in 1, are either directly or indirectly observable as of the reporting date through correlation with market data, including quoted prices for similar assets and liabilities in active markets and quoted prices in inactive markets. This includes assets and liabilities valued using models or other pricing methodologies that do not require significant judgment since the input assumptions used in the models, such as interest rates and volatility factors, are corroborated by readily observable data from actively quoted markets for substantially the full life of the asset. |
|
3. |
Inputs used to measure fair value are unobservable inputs supported by little or no market activity and reflect the use of significant management judgment. These values are generally determined using pricing models for which the assumptions utilize management’s estimates of market participant assumptions. |
|
4. |
Expert appraisal and fair value measurement as completed by third-party experts. |
The following are the estimated useful life for the intangible assets:
|
Estimated |
|||||
|
Useful |
|||||
|
Life (years) |
|||||
|
Finite-lived intangible assets |
|||||
|
Order backlog |
2 | ||||
|
Trade name - Orbital |
10 | ||||
|
Trade name - V-Infinity |
5 | ||||
|
Trade name - CUI-Canada |
3 | ||||
|
Customer list - Orbital |
10 | ||||
|
Customer list - CUI-Canada |
7 | ||||
|
Technology rights |
20 | (1) | |||
|
Technology-Based Asset - Know How |
12 | ||||
|
Technology-Based Asset - Software |
10 | ||||
|
Technology-Based Asset - Power |
7 | ||||
|
Software |
3 | to | 5 | (2) | |
|
Patents |
See endnote |
(3) | |||
|
Other intangible assets |
See endnote |
(4) | |||
|
Indefinite-lived intangible assets |
|||||
|
Trade name - CUI |
See endnote |
(5) | |||
|
Customer list - CUI |
See endnote |
(5) | |||
|
Patents pending technology |
See endnote |
(5) | |||
|
(1) |
Technology rights are amortized over a 20-year life or the term of the rights agreement. |
|
(2) |
Software assets are recorded at cost and include major expenditures, which increase productivity or substantially increase useful lives. |
|
(3) |
Patents are amortized over the life of the patent. Any patents not approved will be expensed at that time. |
|
(4) |
Other intangible assets are amortized over an appropriate useful life, as determined by management in relation to the other intangible asset characteristics. |
|
(5) |
Indefinite-lived intangible assets are reviewed annually for impairment and when circumstances suggest. |
Indefinite-Lived Intangibles and Goodwill Assets
The Company accounts for business combinations under the acquisition method of accounting in accordance with ASC 805, ‘‘Business Combinations,’’ where the total purchase price is allocated to the tangible and identified intangible assets acquired and liabilities assumed based on their estimated fair values. The purchase price is allocated using the information currently available, and may be adjusted, up to one year from the acquisition date, after obtaining more information regarding, among other things, asset valuations, liabilities assumed and revisions to preliminary estimates. The purchase price in excess of the fair value of the tangible and identified intangible assets acquired less liabilities assumed is recognized as goodwill.
Annual Test. The Company tests for indefinite-lived intangibles and goodwill impairment in the second quarter of each year and whenever events or circumstances indicate that the carrying amount of the asset exceeds its fair value and may not be recoverable. The Company’s qualitative assessment of impairment for indefinite-lived assets at May 31, 2017, followed the guidance in ASC 350-30-35-18A and 18B. The Company performed a qualitative analysis of goodwill and indefinite-lived intangibles at May 31, 2017, and determined there was no impairment of indefinite-lived intangibles and goodwill at that time.
Under current accounting guidance, CUI Global is not required to calculate the fair value of a reporting unit unless the entity determines, based on a qualitative assessment, that it is more likely than not that its fair value is less than its carrying amount. The guidance includes a number of factors to consider in conducting the qualitative assessment. The Company tests for goodwill impairment in the second quarter of each year and whenever events or changes in circumstances indicate that the carrying amount of the asset exceeds its fair value and may not be recoverable.
As detailed in ASC 350-20-35-3A, in performing its testing for goodwill, management completes a qualitative analysis to determine whether it was more likely than not that the fair value of a reporting unit is less than its carrying amount, including goodwill. To complete this review, management follows the steps in ASC 350-20-35-3C to evaluate the fair values of the intangibles and goodwill and considers all known events and circumstances that might trigger an impairment of goodwill.
Interim Test. During the fourth quarter of 2017, the Company determined that there were indicators present to suggest that it was more likely than not that the fair value of the Orbital-UK reporting unit was less than its carrying amount. The significant changes for the Orbital-UK reporting unit subsequent to the annual goodwill impairment test performed as of May 31, 2017 included a decline in the 2017 actual revenue, operating income and cash flows compared to previously forecasted results and a decline in the 2018 forecasted revenue, operating income and cash flows due in part to the longer than expected temporary halt in shipping of its GasPT product to a major customer in Italy and market uncertainty due to the continuing effects of Brexit.
To test the Orbital-UK reporting unit for impairment, the Company used a quantitative test. The Company estimated the fair value of the Orbital-UK reporting unit using a blend of a market approach and an income approach, which was deemed to be the most indicative of fair value in an orderly transaction between market participants. Under the income approach, the Company determined fair value based on estimated future cash flows of the Orbital-UK reporting unit discounted by an estimated weighted-average cost of capital, reflecting the overall level of inherent risk of the Orbital-UK reporting unit and the rate of return an outside investor would expect to earn. The Company based its cash flow projections for the Orbital-UK reporting unit using a forecast of cash flows and a terminal value developed by capitalizing an assumed stabilized cash flow figure. The forecast and related assumptions were derived from an updated financial forecast prepared during the fourth quarter of 2017. Under the market approach, appropriate valuation multiples were derived from the historical operating data of selected guideline companies. The valuation multiples were evaluated and adjusted based on the strengths and weaknesses of the Company relative to the selected guideline companies and the multiple was then applied to the appropriate operating data of the Company to arrive at an indication of fair market value. As a result of the analysis, the Company concluded that the carrying value of the Orbital-UK reporting unit exceeded its estimated fair value. The quantitative test for the Orbital-UK reporting unit resulted in an impairment for the Orbital-UK reporting unit, and the Company recorded a goodwill impairment charge of $3.2 million during the fourth quarter of 2017.
The remaining goodwill related to the Orbital-UK reporting unit as of December 31, 2017 was $4.5 million, which is included in the Energy segment. As of December 31, 2017, there was also goodwill remaining for CUI Inc., CUI-Canada and CUI-Japan reporting units, which are included in the Power and Electromechanical segment.
In 2016 and 2015, the analysis, determined there was no impairment necessary to goodwill. Through these reviews, management concluded there were no events or circumstances that triggered an impairment (and there was no expectation that a reporting unit or a significant portion of a reporting unit would be sold or otherwise disposed of in the following year), therefore, no further analysis was necessary to prepare for goodwill impairment beyond the steps in 350-20-35-3C in accordance with current accounting guidance. On a periodic basis, we will also perform a quantitative analysis of goodwill impairment and in 2016, in addition to the qualitative analysis, we performed a quantitative analysis of goodwill impairment and concluded no impairment of goodwill was required.
Patent Costs
The Company estimates the patents it has filed have a future beneficial value; therefore it capitalizes the costs associated with filing for its patents. At the time the patent is approved, the patent costs associated with the patent are amortized over the useful life of the patent. If the patent is not approved, at that time the costs will be expensed.
Accrued expenses
Accrued expenses are liabilities that reflect expenses on the statement of operations that have not been paid or recorded in accounts payable at the end of the period. At December 31, 2017 and December 31, 2016, accrued expenses of $4.2 million and $4.5 million, respectively, included $1.9 million and $2.2 million, respectively, of accrued compensation and $1.3 million and $1.1 million, respectively, of accrued inventory payable.
Derivative instruments
The Company uses various derivative instruments including forward currency contracts, and interest rate swaps to manage certain exposures. These instruments are entered into under the Company’s corporate risk management policy to minimize exposure and are not for speculative trading purposes. The Company recognizes all derivatives as either assets or liabilities in the consolidated balance sheet and measures those instruments at fair value. Changes in the fair value of derivatives are recognized in earnings. The Company has limited involvement with derivative instruments and does not trade them. From time to time, the Company may enter into foreign currency exchange contracts to minimize the risk associated with foreign currency exchange rate exposure from expected future cash flows. The Company has entered into one interest rate swap, which has a maturity date of ten years from the date of inception, and is used to minimize the interest rate risk on the variable rate mortgage. During the years ended December 31, 2017, 2016 and 2015, the Company had unrealized gains of $111 thousand, $113 thousand, and $20 thousand, respectively, related to the derivative liabilities.
Derivative Liabilities
The Company evaluates embedded conversion features pursuant to FASB Accounting Standards Codification No. 815 (‘‘FASB ASC 815’’), ‘‘Derivatives and Hedging,’’ which requires a periodic valuation of the fair value of derivative instruments and a corresponding recognition of liabilities associated with such derivatives.
Stock-Based Compensation
The Company records its stock-based compensation expense under its stock option plans and also issues stock for services. The Company accounts for stock-based compensation using FASB Accounting Standards Codification No. 718 (‘‘FASB ASC 718’’), ‘‘Compensation – Stock Compensation.’’ FASB ASC 718 requires the fair value of all stock-based employee compensation awarded to employees to be recorded as an expense over the related vesting period.
Stock bonuses issued to employees are recorded at fair value using the market price of the stock on the date of grant and expensed over the vesting period or immediately if fully vested on date of issuance. Employee stock options are recorded at fair value using the Black-Scholes option pricing model. The underlying assumptions used in the Black-Scholes option pricing model by the Company are taken from publicly available sources including: (1) volatility, which is calculated using historic stock price information from online finance websites such as Google Finance and Yahoo Finance; (2) the stock price on the date of grant is obtained from online finance websites such as those previously noted; (3) the appropriate discount rates are obtained from the United States Federal Reserve economic research and data website; and (4) other inputs are determined based on previous experience and related estimates. With regards to expected volatility, the Company utilizes an appropriate period for historical share prices for CUI Global that best reflect the expected volatility for determining the fair value of its stock options.
See Note 12 Stockholders' Equity for additional disclosure and discussion of the employee stock plan and activity.
Common stock, stock options and common stock warrants issued to other than employees or directors are also recorded on the basis of their fair value, as required by FASB ASC 505, which is measured as of the date required by FASB ASC 505, ‘‘Equity – Based Payments to Non-Employees.’’ In accordance with FASB ASC 505, the stock options or common stock warrants are valued using the Black-Scholes option pricing model on the basis of the market price of the underlying common stock on the ‘‘valuation date,’’ which for options and warrants related to contracts that have substantial disincentives to non-performance is the date of the contract, and for all other contracts is the performance completion date. Expense related to the options and warrants is recognized on a straight-line basis over the shorter of the period over which services are to be received or the vesting period. Where expense must be recognized prior to a valuation date, the expense is computed based off an estimate of the fair value of the stock award as valued under the Black-Scholes option pricing model on the basis of the market price of the underlying common stock at the end of the period, and any subsequent changes in the market price of the underlying common stock up through the valuation date is reflected in the expense recorded in the subsequent period in which that change occurs.
Common stock issued to other than employees or directors subject to performance (performance based awards) require interpretation to include ASC 505-50-30-13 as to when the counterparty’s performance is complete based on delivery, or other relevant performance criteria in accordance with the relevant agreement. When performance is complete, the common stock is issued and the expense recorded on the basis of their value as required by FASB ASC 505 on the date the performance requirement is achieved.
Defined Contribution Plans
The Company has a 401(k) retirement savings plan that allows employees to contribute to the plan after they have completed 60 days of service and are 18 years of age. The Company matches the employee's contribution up to 6% of total compensation. CUI Inc., Orbital Gas Systems, North America, and CUI Global made total employer contributions, net of forfeitures, of $0.4 million, $0.4 million, and $0.4 million for 2017, 2016 and 2015, respectively.
Orbital-UK operates a defined contribution retirement benefit plan for employees who have been employed with the company at least 12 months and who chose to enroll in the plan. Orbital-UK contributes to its plan the equivalent of 5% of the employee's salary and the employee has the option to contribute pre-tax earnings. Orbital-UK made total employer contributions of $0.2 million, $0.3 million and $0.3 million during 2017, 2016, and 2015, respectively.
Revenue Recognition
Power and Electromechanical segment
Product revenue is recognized in the period when persuasive evidence of an arrangement with a customer exists, the products are shipped and title has transferred to the customer, the price is fixed or determinable, and collection is reasonably assured. The Company sells to distributors pursuant to distribution agreements that have certain terms and conditions such as the right of return and price protection, which inhibit revenue recognition unless they can be reasonably estimated as we cannot assert the price is fixed and determinable and estimate returns. For one distributor that comprises 26% of consolidated revenue, we have such history and ability to estimate and therefore recognize revenue upon sale to the distributor and record a corresponding reserve for the estimated returns. For three other distributor arrangements that represents a combined 15% of revenue, we recognize revenue on a sell-through basis, and accordingly defer revenue and the related costs until such time as the distributor resells the product.
Energy segment
For production-type contracts meeting the Company’s minimum threshold, revenues and related costs on these contracts are recognized using the ‘‘percentage of completion method’’ of accounting in accordance with ASC 605-35, Accounting for Performance of Construction-Type and Certain Production Type Contracts (‘‘ASC 605-35’’). Under this method, contract revenues and related expenses are recognized over the performance period of the contract in direct proportion to the costs incurred as a percentage of total estimated costs for the entirety of the contract. Costs include direct material, direct labor, subcontract labor and any allocable indirect costs. The Company captures certain job costs as work progresses, including labor, material and costs not invoiced. Margin adjustments are made as information pertaining to contracts changes. All un-allocable indirect costs and corporate general and administrative costs are charged to the periods as incurred. The amount of costs not invoiced is captured to ensure an estimated margin consistent with that expected at the completion of the project. In the event a loss on a contract is foreseen, the Company recognizes the loss when it is determined. Contract costs plus recognized profits are accumulated as deferred assets, and billings and/or cash received are recorded to a deferred revenue liability account. The net of these two accounts for any individual project is presented as ‘‘Costs in excess of billings,’’ an asset account, or ‘‘Billings in excess of costs,’’ a liability account. At December 31, 2017, the Costs in excess of billings balance was $2.3 million and the Billings in excess of costs balance was approximately $1.8 million.
Production-type contracts that do not qualify for use of the percentage of completion method are accounted for using the ‘‘completed contract method’’ of accounting in accordance with ASC 605-35-25-57. Under this method, contract costs are accumulated as deferred assets, and billings and/or cash received is recorded to a deferred revenue liability account, during the periods of construction, but no revenues, costs, or profits are recognized in operations until the period within which completion of the contract occurs. A contract is considered complete when all costs except insignificant items have been incurred; the equipment is operating according to specifications and has been accepted by the customer.
For product sales in the Energy segment, revenue is recognized in the period when persuasive evidence of an arrangement with a customer exists, the products are shipped and title has transferred to the customer, the price is fixed or determinable, and collection is reasonably assured.
Revenues from warranty and maintenance activities are recognized ratably over the term of the warranty and maintenance period and the unrecognized portion is recorded as deferred revenue.
Shipping and Handling Costs
Amounts billed to customers in sales transactions related to shipping and handling represent revenues earned for the goods provided and are included in sales, and were approximately $17 thousand, $23 thousand, and $48 thousand, for the years ended December 31, 2017, 2016 and 2015, respectively. The Company expenses inbound shipping and handling costs as cost of revenues.
Warranty Reserves
A warranty reserve liability is recorded based on estimates of future costs on sales recognized. At December 31, 2017 and 2016, the balance of approximately $40 thousand and $52 thousand, respectively, for warranty reserve liability is included in accrued expenses on the balance sheet.
Advertising
The costs incurred for producing and communicating advertising are charged to operations as incurred. Advertising expense for the years ended December 31, 2017, 2016 and 2015 were $1.8 million, $1.7 million, and $1.4 million, respectively. In addition to these advertising costs, the Company also incurs advertising related costs for advertising completed in partnership with its distributors. These costs are offset against revenues. During 2017, 2016 and 2015, the advertising costs offset against revenues were $0.3 million, $0.3 million, and $0.4 million, respectively.
Income Taxes
Income taxes are accounted for under the asset and liability method of FASB Accounting Standards Codification No. 740 (‘‘FASB ASC 740’’), ‘‘Income Taxes.’’ Under FASB ASC 740, deferred tax assets and liabilities are recognized for the future tax consequences attributable to differences between the financial statement carrying amounts of existing assets and liabilities and their respective tax bases. Deferred tax assets and liabilities are measured using enacted tax rates expected to apply to taxable income in the years in which those temporary differences are expected to be recovered or settled. The effect on deferred tax assets and liabilities of a change in tax rates is recognized as income in the period that includes the enactment date. Deferred tax assets are reduced by a valuation allowance to the extent that management believes it is more likely than not that such deferred tax assets will not be realized.
Valuation allowances have been established against all domestic based deferred tax assets due to uncertainties in the Company’s ability to generate sufficient taxable income in future periods to make realization of such assets more likely than not. In future periods, tax benefits and related domestic deferred tax assets will be recognized when management considers realization of such amounts to be more likely than not. The Company has not provided for valuation allowances on deferred tax assets in any other jurisdiction.
The Company recognizes interest and penalties, if any, related to its tax positions in income tax expense.
CUI Global files consolidated income tax returns with its U.S. based subsidiaries for federal and many state jurisdictions in addition to separate subsidiary income tax returns in Japan, the United Kingdom and Canada. As of December 31, 2017, the Company is not under examination by any income tax jurisdiction. The Company is no longer subject to USA examination for years prior to 2014.
Net Loss per Share
In accordance with FASB Accounting Standards Codification No. 260 (‘‘FASB ASC 260’’), ‘‘Earnings per Share,’’ basic net loss per share is computed by dividing the net loss available to common stockholders for the period by the weighted average number of common shares outstanding during the period. Diluted net income (loss) per share is computed by dividing net income (loss) available to common stockholders by the weighted average number of diluted shares outstanding during the period calculated using the treasury stock method. Due to the Company’s net loss in 2017, 2016 and 2015, the assumed exercise of stock options using the treasury stock method would have had an antidilutive effect and therefore all options for the three years were excluded from the calculation of diluted net loss per share for each of the three years. Accordingly, diluted net loss per share is the same as basic net loss per share for 2017, 2016 and 2015. The weighted average shares outstanding included 63,602; 25,811 and 61,548 of shares that are considered outstanding, but unissued as of December 31, 2017, 2016 and 2015, respectively, for shares to be issued in accordance with a royalty agreement pertaining to sales of the GasPT devices and unpaid equity share bonuses in all three years, and unpaid director compensation in 2015.
The following table summarizes the number of stock options outstanding excluding amounts applicable to contingent conversion option, which may dilute future earnings per share:
|
As of December 31, |
||||||||||||
|
2017 |
2016 |
2015 |
||||||||||
|
Options, outstanding |
964,180 | 966,681 | 970,847 | |||||||||
Any common shares issued as a result of stock options or warrants would come from newly issued common shares, from our remaining authorized shares.
The following is the calculation of basic and diluted earnings per share:
|
For the Years Ended December 31, |
||||||||||||
|
(In thousands, except share and per share amounts) |
2017 |
2016 |
2015 |
|||||||||
|
Net loss |
$ | (12,589 |
) |
$ | (7,266 |
) |
$ | (5,987 |
) |
|||
|
Basic and diluted weighted average number of shares outstanding |
22,397,865 | 20,897,812 | 20,792,494 | |||||||||
|
Basic loss per common share |
$ | (0.56 |
) |
$ | (0.35 |
) |
$ | (0.29 |
) |
|||
|
Diluted loss per common share |
$ | (0.56 |
) |
$ | (0.35 |
) |
$ | (0.29 |
) |
|||
Foreign Currency Translation
The financial statements of the Company's foreign offices have been translated into U.S. dollars in accordance with FASB ASC 830, ‘‘Foreign Currency Matters’’ (FASB ASC 830). All balance sheet accounts have been translated using the exchange rate in effect at the balance sheet date. Statement of Operations amounts have been translated using an appropriately weighted average exchange rate for the year. The translation gains and losses resulting from the changes in exchange rates during 2017, 2016 and 2015 have been reported in accumulated other comprehensive income (loss), except for gains and losses resulting from the translation of intercompany receivables and payables, which are included in earnings for the period.
Segment Reporting
Operating segments are defined in accordance with ASC 280-10 as components of an enterprise for which separate financial information is available that is evaluated regularly by the chief operating decision maker, or decision-making group, in deciding how to allocate resources and in assessing performance. The measurement basis of segment profit or loss is income (loss) from operations. Management has identified six operating segments based on the activities of the Company in accordance with ASC 280-10. These operating segments have been aggregated into three reportable segments. The three reportable segments are Power and Electromechanical, Energy and Other. The Power and Electromechanical segment is focused on the operations of CUI Inc., CUI-Canada, Inc. and CUI Japan for the sale of internal and external power supplies and related components and industrial controls. The Energy segment is focused on the operations of Orbital Gas Systems Ltd. and Orbital Gas Systems, North America, Inc. which includes gas related test and measurement systems, including the GasPT. The Other segment represents the remaining activities that are not included as part of the other reportable segments and represent primarily corporate activity.
The following information represents segment activity as of and for the year ended December 31, 2017:
|
(In thousands) |
Power and |
Energy |
Other |
Total |
||||||||||||
|
Revenues from external customers |
$ | 64,432 | $ | 18,843 | $ | — | $ | 83,275 | ||||||||
|
Depreciation and amortization (1) |
1,505 | 1,345 | — | 2,850 | ||||||||||||
|
Interest expense |
249 | 1 | 250 | 500 | ||||||||||||
|
Impairment of goodwill and intangible expense |
3 | 3,152 | — | 3,155 | ||||||||||||
|
Income (loss) from operations |
2,355 | (11,366 |
) |
(4,918 |
) |
(13,929 |
) |
|||||||||
|
Segment assets |
49,392 | 26,512 | 12,005 | 87,909 | ||||||||||||
|
Other intangibles assets, net |
8,899 | 6,669 | — | 15,568 | ||||||||||||
|
Goodwill |
13,092 | 4,549 | — | 17,641 | ||||||||||||
|
Expenditures for segment assets (2) |
955 | 576 | — | 1,531 | ||||||||||||
The following information represents segment activity as of and for the year ended December 31, 2016:
|
(In thousands) |
Power and Electro- Mechanical |
Energy |
Other |
Total |
||||||||||||
|
Revenues from external customers |
$ | 58,403 | $ | 28,058 | $ | — | $ | 86,461 | ||||||||
|
Depreciation and amortization (1) |
1,445 | 1,401 | 2 | 2,848 | ||||||||||||
|
Interest expense |
221 | 6 | 240 | 467 | ||||||||||||
|
Income (loss) from operations |
645 | (1,676 |
) |
(5,479 |
) |
(6,510 |
) |
|||||||||
|
Segment assets |
49,830 | 29,632 | 381 | 79,843 | ||||||||||||
|
Other intangibles assets, net |
9,262 | 6,939 | — | 16,201 | ||||||||||||
|
Goodwill |
13,083 | 7,042 | — | 20,125 | ||||||||||||
|
Expenditures for segment assets (2) |
1,032 | 642 | — | 1,674 | ||||||||||||
The following information represents segment activity as of and for the year ended December 31, 2015:
|
(In thousands) |
Power and Electro- Mechanical |
Energy |
Other |
Total |
||||||||||||
|
Revenues from external customers |
$ | 58,037 | $ | 28,203 | $ | — | $ | 86,240 | ||||||||
|
Depreciation and amortization (1) |
1,258 | 1,945 | 6 | 3,209 | ||||||||||||
|
Earnings on equity method investment |
53 | — | — | 53 | ||||||||||||
|
Interest expense |
226 | 4 | 211 | 441 | ||||||||||||
|
Income (loss) from operations |
2,856 | (3,915 |
) |
(4,635 |
) |
(5,694 |
) |
|||||||||
|
Segment assets |
51,600 | 37,029 | 2,219 | 90,848 | ||||||||||||
|
Other intangibles assets, net |
9,577 | 9,167 | 2 | 18,746 | ||||||||||||
|
Goodwill |
13,077 | 8,450 | — | 21,527 | ||||||||||||
|
Expenditures for segment assets (2) |
859 | 4,314 | — | 5,173 | ||||||||||||
|
(1) |
For the years ended December 31, 2017, 2016 and 2015, depreciation and amortization totals included $0.7 million, $0.5 million and $0.3 million, respectively that were classified as cost of revenues in the Consolidated Statements of Operations. |
|
(2) |
Includes purchases of property, plant and equipment and the investment in other intangible assets. Excludes amounts for the CUI – Canada, Inc. acquisition in 2015. |
The following information represents revenue by country:
|
For the Years Ended December 31, |
||||||||||||||||||||||||
|
(In thousands) |
2017 |
2016 |
2015 |
|||||||||||||||||||||
|
Amount |
% |
Amount |
% |
Amount |
% |
|||||||||||||||||||
|
USA |
$ | 50,875 | 61 |
% |
$ | 46,514 | 54 |
% |
$ | 46,641 | 54 |
% |
||||||||||||
|
United Kingdom |
14,522 | 17 |
% |
17,337 | 20 |
% |
21,407 | 25 |
% |
|||||||||||||||
|
China |
5,381 | 7 |
% |
5,930 | 7 |
% |
4,950 | 6 |
% |
|||||||||||||||
|
All Others |
12,497 | 15 |
% |
16,680 | 19 |
% |
13,242 | 15 |
% |
|||||||||||||||
|
Total |
$ | 83,275 | 100 |
% |
$ | 86,461 | 100 |
% |
$ | 86,240 | 100 |
% |
||||||||||||
The following information represents long-lived assets (excluding deferred tax assets) by country:
|
As of December 31, |
||||||||
|
(In thousands) |
2017 |
2016 |
||||||
|
USA |
$ | 27,662 | $ | 28,089 | ||||
|
United Kingdom |
17,739 | 18,431 | ||||||
|
Other |
1,232 | 1,205 | ||||||
| $ | 46,633 | $ | 47,725 | |||||
Revisions
Immaterial revisions were made to the consolidated statement of cash flows. For the years ended December 31, 2016 and 2015, $172 thousand and $219 thousand, respectively, were reclassified from effect of exchange rate changes on cash to non-cash unrealized foreign currency losses included as a reconciling item to cash provided by operating activities. This change was related primarily to unrealized foreign currency losses on intercompany advances to Orbital-UK.
Recent Accounting Pronouncements
In January 2017, the FASB issued Accounting Standards Update ("ASU") No. 2017-04, Intangibles - Goodwill and Other (Topic 350): Simplifying the Test for Goodwill Impairment. ASU 2017-04 simplifies the goodwill impairment test by eliminating Step 2 from the test among other technical changes intended to streamline the impairment test. The amendment requires an entity to perform its annual, or interim goodwill impairment test by comparing the fair value of a reporting unit with its carrying amount. The amendments should be applied on a prospective basis.
The Company is required to adopt ASU 2017-04 for its annual or any interim goodwill impairment tests in fiscal years beginning after December 15, 2019 and may early adopt as early as its first annual or interim impairment testing date following January 1, 2017. The Company elected to early adopt the amendments of this standard effective with its May 31, 2017 goodwill impairment test. The early adoption of this standard did not impact the Company’s financial condition, results of operations, and cash flows for its annual impairment test.
In August 2016, the FASB issued Accounting Standards Update (“ASU”) No. 2016-15, Statement of Cash Flows (Topic 230): Classification of Certain Cash Receipts and Cash Payments (“ASU 2016-15”). ASU 2016-15 clarifies whether eight specifically identified cash flow issues should be categorized as operating, investing or financing activities in the statement of cash flows. The guidance will be effective for the fiscal year beginning after December 15, 2017, including interim periods within that year. The Company is currently assessing the impact of this ASU on its consolidated financial statements.
In June 2016, the FASB issued ASU No. 2016-13, Financial Instruments – Credit Losses (Topic 326): Measurement of Credit Losses on Financial Instruments (“ASU 2016-13”). ASU 2016-13 is intended to provide financial statement users with more useful information about expected credit losses on financial assets held by a reporting entity at each reporting date. The new standard replaces the existing incurred loss impairment methodology with a methodology that requires consideration of a broader range of reasonable and supportable forward-looking information to estimate all expected credit losses. This ASU is effective for fiscal years and interim periods within those years beginning after December 15, 2019 and early adoption is permitted for fiscal years and interim periods within those years beginning after December 15, 2018. The Company is currently assessing the impact of this ASU on its consolidated financial statements.
In February 2016, the FASB issued ASU No. 2016-02, Leases (Topic 842) (‘‘ASU 2016-02’’). ASU 2016-02 requires lessees to present right-of-use assets and lease liabilities (with the exception of short-term leases) on the balance sheet. The new guidance will be effective for public business entities for fiscal years beginning after December 15, 2018 including interim periods within that fiscal year. We are currently evaluating the impact of the Company’s pending adoption of ASU 2016-02 on the Company’s consolidated financial statements and will adopt the standard in 2019.
In July 2015, the FASB issued ASU No. 2015-11, Simplifying the Measurement of Inventory (“ASU 2015-11”) that requires entities to measure inventory at the lower of cost or net realizable value. Net realizable value is defined as the estimated selling prices in the ordinary course of business, less reasonably predictable costs of completion, disposal and transportation. The guidance is effective for fiscal years beginning after December 15, 2016 including interim periods within those fiscal years. The guidance must be applied on a prospective basis. The guidance has not had a material impact on our financial statements.
In May 2014, the Financial Accounting Standards Board (“FASB”) issued ASU No. 2014-09, Revenue from Contracts with Customers (“ASU 2014-09”), which supersedes nearly all existing revenue recognition guidance under U.S. GAAP. The core principle of ASU 2014-09 is to recognize revenues when promised goods or services are transferred to customers in an amount that reflects the consideration to which an entity expects to be entitled for those goods or services. ASU 2014-09 defines a five-step process to achieve this core principle and, in doing so, more judgment and estimates may be required within the revenue recognition process than are required under existing U.S. GAAP. The standard was originally effective for annual periods beginning after December 15, 2016, and interim periods therein, using either of the following transition methods: (i) a full retrospective approach reflecting the application of the standard in each prior reporting period with the option to elect certain practical expedients, or (ii) a modified retrospective approach with the cumulative effect of initially adopting ASU 2014-09 recognized at the date of adoption (which includes additional note disclosures). On July 9, 2015, the FASB affirmed its proposal to defer the effective date of the new revenue standard for public entities by one year to annual reporting periods beginning after December 15, 2017, and interim periods beginning in the first interim period within the year of adoption. After evaluating the transition options, the Company has chosen to implement using the modified retrospective method.
The cumulative effect adjustment to be recorded as of January 1, 2018 is expected to be approximately a net $1.9 million decrease to accumulated deficit due to an approximate $2.8 million from the Power and Electromechanical segment transition adjustment partially offset by a $0.9 million from the Energy segment transition adjustment. Certain Power and Electromechanical revenue recorded as sell through under previous guidance will be recorded at the time of sale net of appropriate reserves consistent with other sales in the Power and Electromechanical segment. The Energy segment transition adjustment is due to certain production-type contracts that lacked a specific enforceable right to payment for revenue recorded using percentage of completion method under the previous guidance. These contracts typically contained termination clauses based on milestones that were not deemed specific enough to warrant revenue recognition over time under the new guidance.
3. INVESTMENTS AND FAIR VALUE MEASUREMENTS
The Company’s fair value hierarchy for its cash equivalents, marketable securities and derivative instruments as of December 31, 2017 and December 31, 2016, respectively, was as follows:
|
(In thousands) |
||||||||||||||||
|
December 31, 2017 |
Level 1 |
Level 2 |
Level 3 |
Total |
||||||||||||
|
Money market securities |
$ | 16 | $ | — | $ | — | $ | 16 | ||||||||
|
Total assets |
$ | 16 | $ | — | $ | — | $ | 16 | ||||||||
|
Derivative instrument payable |
$ | — | $ | 356 | $ | — | $ | 356 | ||||||||
|
Contingent consideration |
— | — | 45 | 45 | ||||||||||||
|
Total liabilities |
$ | — | $ | 356 | $ | 45 | $ | 401 | ||||||||
|
December 31, 2016 |
Level 1 |
Level 2 |
Level 3 |
Total |
||||||||||||
|
Money market securities |
$ | 16 | $ | — | $ | — | $ | 16 | ||||||||
|
Total assets |
$ | 16 | $ | — | $ | — | $ | 16 | ||||||||
|
Derivative instrument payable |
$ | — | $ | 467 | $ | — | $ | 467 | ||||||||
|
Contingent consideration |
— | — | 103 | 103 | ||||||||||||
|
Total liabilities |
$ | — | $ | 467 | $ | 103 | $ | 570 | ||||||||
Fair Value Measurements
Using Significant Unobservable Inputs (Level 3 - recurring basis)
|
(In thousands) |
Contingent |
|||
|
consideration |
||||
|
Balance at December 31, 2016 |
$ | 103 | ||
|
Payment |
(61 |
) |
||
|
Quarterly fair value adjustment |
3 | |||
|
Balance at December 31, 2017 |
$ | 45 | ||
There were no transfers between Level 3 and Level 2 in 2017 as determined at the end of the reporting period. The contingent consideration liability is associated with the acquisition of Tectrol in March 2015 and represents the present value of the expected future contingent payment based on revenue projections of select Tectrol legacy products. The inputs used to measure contingent consideration are classified as Level 3 within the valuation hierarchy. The valuation is not supported by market criteria and reflects the Company’s internal revenue forecasts. Since the valuation is not supported by market criteria, the valuation is completely dependent on unobservable inputs. During quarterly updates of the valuation, the calculation of the value is based on actual and reasonably estimated future revenues. Based on the Company’s fourth quarter 2017 analysis, the Company adjusted the current value of the contingent consideration based on updated revenue projections.
The fair values of the reporting units subject to the Company’s quantitative impairment analysis were determined utilizing a blend of a market and an income approach to determine the estimated fair values of the reporting units, as discussed in Note 2. The fair value measurements and models were classified as non-recurring Level 3 measurements.
4. ACQUISITION
CUI-Canada, Inc.
On March 5, 2015, the Company closed on an Asset Purchase Agreement to acquire certain assets and assume certain liabilities of Tectrol, Inc., a Toronto, Canada corporation. The acquisition was effective March 1, 2015 and is included from that date in the Company’s Power and Electromechanical segment. As a part of this acquisition strategy, CUI Global, Inc. formed a wholly owned Canadian corporate subsidiary, CUI-Canada, Inc., to receive these acquired assets and liabilities. That entity entered into a five-year lease of the Toronto facility where Tectrol, Inc. was operating its business. CUI-Canada, Inc. operations include the design and manufacture assembly of electronic power conversion devices such as AC/DC power supplies, DC/DC power supplies, linear power supplies and uninterruptable power supplies.
The purchase price for the acquisition of the assets was $5.2 million subject to good faith adjustments by the parties according to the final value of the non-obsolete inventory conveyed and other closing adjustments. In addition, the agreement calls for an earn-out/royalty payment of two percent of the gross sales (for specific, identified customers) over a period of three years from the closing date, up to a maximum of $0.3 million that may or may not be paid to the seller within 90 days of each calendar year-end, depending on performance by the identified customer(s). The final adjusted purchase price for the acquisition of Tectrol was $4.5 million, which included the present value of $0.3 million of royalties to be paid on future sales, which was recorded as $0.2 million of contingent consideration. At December 31, 2017, $45 thousand of contingent consideration is included on the balance sheet in accrued expenses. The full purchase price less the contingent consideration was paid in cash. The Company funded the consideration paid to the shareholder of Tectrol with existing cash and cash equivalents and funds from short-term investments that had matured.
The acquisition was accounted for using the acquisition method of accounting and the purchase price was allocated to the assets acquired and liabilities assumed based upon their estimated fair values at the date of acquisition.
The allocation of the purchase price is as follows:
|
(In thousands) |
||||
|
Purchase price |
$ | 4,501 | ||
|
Inventory |
$ | 2,302 | ||
|
Property and equipment |
831 | |||
|
Software |
73 | |||
|
Intangible, customer lists |
270 | |||
|
Intangible, trademark and trade name |
130 | |||
|
Intangible, technology-based asset |
1,000 | |||
|
Goodwill |
64 | |||
|
Liabilities assumed |
(169 |
) |
||
| $ | 4,501 |
The table below summarizes the condensed pro forma information of the results of operations of the Company, for the year ended December 31, 2015 and 2014 as though the acquisition had been completed as of January 1, 2014:
For the year ended December 31, 2015
|
(In thousands) |
CUI Global, Inc. |
Tectrol, Inc. |
Adjustment (1) |
Pro forma |
||||||||||||
|
Gross revenue |
$ | 86,240 | $ | 4,837 | $ | — | $ | 91,077 | ||||||||
|
Total expenses |
92,227 | 5,212 | 31 | 97,470 | ||||||||||||
|
Net loss |
$ | (5,987 |
) |
$ | (375 |
) |
$ | (6,393 |
) |
|||||||
For the year ended December 31, 2014
|
(In thousands) |
CUI Global, Inc. |
Tectrol, Inc. |
Adjustment (1) |
Pro forma |
||||||||||||
|
Gross revenue |
$ | 76,045 | $ | 16,494 | $ | — | $ | 92,539 | ||||||||
|
Total expenses |
78,846 | 17,804 | 186 | 96,836 | ||||||||||||
|
Net loss |
$ | (2,801 |
) |
$ | (1,310 |
) |
$ | (4,297 |
) |
|||||||
|
(1) |
Adjustment to recognize the estimated depreciation and amortization expense for each of the presented periods assuming amortization of the intangible assets and depreciation of tangible assets over their estimated useful lives. Estimated depreciation and amortization for the unaudited pro forma condensed consolidated statements of operations are $31 thousand and $0.2 million for 2015 and 2014, respectively. |
The above unaudited condensed pro forma information does not purport to represent what the Companies’ combined results of operations would have been if such transactions had occurred at the beginning of the period presented, and are not indicative of future results.
5. PROPERTY AND EQUIPMENT, NET
Property and equipment is summarized as follows:
|
At December 31, |
||||||||
|
(In thousands) |
2017 |
2016 |
||||||
|
Land |
$ | 1,205 | $ | 1,170 | ||||
|
Buildings and improvements |
8,476 | 8,069 | ||||||
|
Equipment |
5,716 | 5,012 | ||||||
| 15,397 | 14,251 | |||||||
|
Less accumulated depreciation |
(4,155 |
) |
(3,299 |
) |
||||
| $ | 11,242 | $ | 10,952 | |||||
Depreciation expense for the years ended December 31, 2017, 2016 and 2015 was $1.0 million, $0.9 million, and $0.9 million, respectively.
During the year ended December 31, 2017, the Company disposed of $0.3 million of property and equipment with an accumulated depreciation at disposal of $0.3 million. During the year ended December 31, 2016, the Company disposed of $0.9 million of property and equipment with an accumulated depreciation at disposal of $0.8 million.
6. GOODWILL AND OTHER INTANGIBLE ASSETS
At December 31, 2017 and 2016, the gross carrying amount and accumulated amortization of intangible assets, other than goodwill, are as follows:
|
December 31, 2017 |
Identifiable Intangible |
December 31, 2016 |
Identifiable Intangible |
||||||||||||||||||||||||||
|
(In thousands) |
*Estimated |
Gross |
Assets, less |
Gross |
Assets, less |
||||||||||||||||||||||||
|
Useful |
Carrying |
Accumulated |
Accumulated |
Carrying |
Accumulated |
Accumulated |
|||||||||||||||||||||||
|
Life (years) |
Amount |
Amortization |
Amortization |
Amount |
Amortization |
Amortization |
|||||||||||||||||||||||
|
Finite-lived intangible assets |
|||||||||||||||||||||||||||||
|
Power and Electro-Mechanical Segment |
|||||||||||||||||||||||||||||
|
Trademark and trade name - V-Infinity |
5 | $ | 1,095 | $ | (1,095 |
) |
$ | — | $ | 1,095 | $ | (986 |
) |
$ | 109 | ||||||||||||||
|
Trademark and trade name - AMP Group |
3 | 27 | (23 |
) |
4 | 27 | (14 |
) |
13 | ||||||||||||||||||||
|
Trademark and trade name - CUI-Canada |
3 | 128 | (121 |
) |
7 | 128 | (79 |
) |
49 | ||||||||||||||||||||
|
Technology rights |
7 | and | 20** | 1,291 | (578 |
) |
713 | 1,291 | (410 |
) |
881 | ||||||||||||||||||
|
Computer software |
3 | to | 5 | 971 | (850 |
) |
121 | 926 | (807 |
) |
119 | ||||||||||||||||||
|
Product certifications |
3 | 1,412 | (820 |
) |
592 | 1,059 | (479 |
) |
580 | ||||||||||||||||||||
|
Customer relationships - CUI-Canada |
7 | 267 | (108 |
) |
159 | 267 | (70 |
) |
197 | ||||||||||||||||||||
|
Other intangible assets |
*** | 114 | (113 |
) |
1 | 121 | (109 |
) |
12 | ||||||||||||||||||||
|
Total Power and Electro-Mechanical |
5,305 | (3,708 |
) |
1,597 | 4,914 | (2,954 |
) |
1,960 | |||||||||||||||||||||
|
Energy Segment |
|||||||||||||||||||||||||||||
|
Order backlog |
2 | 3,006 | (3,006 |
) |
— | 2,748 | (2,748 |
) |
— | ||||||||||||||||||||
|
Trade name - Orbital-UK |
10 | 1,616 | (768 |
) |
848 | 1,478 | (554 |
) |
924 | ||||||||||||||||||||
|
Customer list - Orbital-UK |
10 | 6,284 | (2,985 |
) |
3,299 | 5,746 | (2,155 |
) |
3,591 | ||||||||||||||||||||
|
Technology rights |
20** | 337 | (150 |
) |
187 | 308 | (106 |
) |
202 | ||||||||||||||||||||
|
Technology-Based Asset - Know How |
12 | 2,546 | (1,008 |
) |
1,538 | 2,328 | (727 |
) |
1,601 | ||||||||||||||||||||
|
Technology-Based Asset - Software |
10 | 552 | (262 |
) |
290 | 505 | (189 |
) |
316 | ||||||||||||||||||||
|
Computer software |
3 | to | 5 | 520 | (13 |
) |
507 | 301 | (2 |
) |
299 | ||||||||||||||||||
|
Other intangible assets |
*** | — | — | — | 9 | (3 |
) |
6 | |||||||||||||||||||||
|
Total Energy Segment |
14,861 | (8,192 |
) |
6,669 | 13,423 | (6,484 |
) |
6,939 | |||||||||||||||||||||
|
Indefinite-lived intangible assets |
|||||||||||||||||||||||||||||
|
Power and Electro-Mechanical Segment |
|||||||||||||||||||||||||||||
|
Trade mark and trade name - CUI Inc. |
4,893 | — | 4,893 | 4,893 | — | 4,893 | |||||||||||||||||||||||
|
Customer list - CUI Inc. |
1,857 | — | 1,857 | 1,857 | — | 1,857 | |||||||||||||||||||||||
|
Patents pending - Technology |
552 | — | 552 | 552 | — | 552 | |||||||||||||||||||||||
| 7,302 | — | 7,302 | 7,302 | — | 7,302 | ||||||||||||||||||||||||
|
Total Identifiable other intangible assets |
$ | 27,468 | $ | (11,900 |
) |
$ | 15,568 | $ | 25,639 | $ | (9,438 |
) |
$ | 16,201 | |||||||||||||||
* All intangibles are reviewed annually for impairment, or sooner if circumstances change.
** Technology rights include $1.0 million of capitalized costs that are related to our CUI-Canada acquisition in March 2015. The CUI-Canada technology rights are amortized over a 7-year life. The rest of the technology rights are amortized over a 20-year life.
*** Other intangible assets are amortized over an appropriate useful life, as determined by management in relation to the other intangible asset characteristics.
Intangible asset amortization by category was as follows:
|
For the Years Ended December 31, |
||||||||||||
|
(In thousands) |
2017 |
2016 |
2015 |
|||||||||
|
Order backlog |
$ | — | $ | — | $ | 422 | ||||||
|
Trademarks and trade name |
316 | 434 | 442 | |||||||||
|
Customer lists/relationships |
638 | 669 | 744 | |||||||||
|
Technology rights |
198 | 193 | 177 | |||||||||
|
Technology-based assets |
255 | 269 | 303 | |||||||||
|
Computer software |
83 | 76 | 69 | |||||||||
|
Product certifications |
343 | 260 | 170 | |||||||||
|
Other intangibles |
8 | 22 | 28 | |||||||||
|
Total amortization |
$ | 1,841 | $ | 1,923 | $ | 2,355 | ||||||
Estimated Future Amortization by Category of Finite-lived Intangible Assets at December 31, 2017 was as follows:
|
For the Years Ending December 31, |
||||||||||||||||||||||||||||
|
(In thousands) |
2018 |
2019 |
2020 |
2021 |
2022 |
2023 and thereafter |
Totals |
|||||||||||||||||||||
|
Trademarks and trade name |
$ | 173 | $ | 162 | $ | 162 | $ | 162 | $ | 162 | $ | 38 | $ | 859 | ||||||||||||||
|
Customer lists/relationships |
667 | 667 | 667 | 667 | 635 | 155 | 3,458 | |||||||||||||||||||||
|
Technology rights |
201 | 193 | 185 | 185 | 67 | 69 | 900 | |||||||||||||||||||||
|
Technology-based assets |
267 | 267 | 267 | 267 | 267 | 493 | 1,828 | |||||||||||||||||||||
|
Computer software |
168 | 174 | 146 | 71 | 58 | 11 | 628 | |||||||||||||||||||||
|
Product Certifications |
350 | 189 | 53 | — | — | — | 592 | |||||||||||||||||||||
|
Other Intangibles |
1 | — | — | — | — | — | 1 | |||||||||||||||||||||
|
Total amortization |
$ | 1,827 | $ | 1,652 | $ | 1,480 | $ | 1,352 | $ | 1,189 | $ | 766 | $ | 8,266 | ||||||||||||||
Management reviews other intangible assets for impairment when facts or circumstances suggest. As of December 31, 2017, management has evaluated the finite-lived and indefinite-lived intangible assets and believes no impairment exists.
The following table reflects the carrying amount of goodwill as of December 31, 2017 and 2016, and the 2017 and 2016 activity:
|
(In thousands) |
Power and Electro - Mechanical |
Energy |
Other |
Total |
||||||||||||
|
Balance, December 31, 2015 |
$ | 13,077 | $ | 8,450 | $ | — | $ | 21,527 | ||||||||
|
Currency translation adjustments |
6 | (1,408 |
) |
— | (1,402 |
) |
||||||||||
|
Balance, December 31, 2016 |
13,083 | 7,042 | — | 20,125 | ||||||||||||
|
Currency translation adjustments |
9 | 659 | — | 668 | ||||||||||||
|
Goodwill impairment |
— | (3,152 |
) |
— | $ | (3,152 |
) |
|||||||||
|
Balance, December 31, 2017 |
$ | 13,092 | $ | 4,549 | $ | — | $ | 17,641 | ||||||||
See Note 2 Summary of Significant Accounting Policies - Indefinite-Lived Intangibles and Goodwill Assets for information on the impairment to goodwill in 2017.
7. CAPITAL LEASES
The following is an analysis of the leased property under capital leases by major classes:
|
(In thousands) |
Asset Balances at December 31, |
|||||||
|
2017 |
2016 |
|||||||
|
Classes of Property |
||||||||
|
Motor vehicles |
$ | — | $ | 98 | ||||
|
Equipment |
19 | 19 | ||||||
|
Less: Accumulated depreciation |
(7 |
) |
(65 |
) |
||||
| $ | 12 | $ | 52 | |||||
The following summarizes the current and long-term portion of capital leases:
|
(In thousands) |
Balances at December 31, |
|||||||
|
2017 |
2016 |
|||||||
|
Current leases payable |
$ | 4 | $ | 28 | ||||
|
Long-term leases payable |
9 | 12 | ||||||
| $ | 13 | $ | 40 | |||||
The following summarizes total future minimum lease payments at December 31, 2017:
|
(In thousands) |
||||
|
2018 |
$ | 4 | ||
|
2019 |
4 | |||
|
2020 |
4 | |||
|
2021 |
2 | |||
|
Total minimum lease payments |
14 | |||
|
Amount representing interest |
1 | |||
|
Present value of minimum lease payments with average interest rate of 5.0% |
13 | |||
|
Current portion of capital lease obligation |
4 | |||
|
Capital lease obligation, less current portion |
$ | 9 |
8. INSTRUMENTS AND RISK MANAGEMENT
The Company has limited involvement with derivative instruments and does not trade them. The Company does use derivatives to manage certain interest rate and foreign currency exchange rate exposures.
At December 31, 2017 and 2016, the Company had no derivative instruments designated as effective hedges.
From time to time, to minimize risk associated with foreign currency exposures on receivables for sales denominated in foreign currencies, the Company enters into various foreign currency forward exchange contracts, which are intended to minimize the currency exchange rate exposure from expected future cash flows. The forward currency contracts have maturity dates of up to one year at the date of inception. At December 31, 2017 and 2016, no foreign currency forward exchange contracts were outstanding.
The Company also entered into an interest rate swap, which has a maturity date of ten years from the date of inception.
In conjunction with the mortgage note payable for the purchase of the headquarters facility completed in 2013, the Company entered into a Swap Transaction Confirmation agreement effective October 1, 2013 incorporating the terms and definitions of the International Swaps and Derivatives Association, Inc. (ISDA) that effectively fixes our effective annual interest rate at 6.27%.
The amount of gain recognized in income on the statement of operations is summarized below:
|
Location of Gain |
|||||||||||||
|
Recognized in Income |
For the Years Ended December 31, |
||||||||||||
|
(In thousands) |
2017 |
2016 |
2015 |
||||||||||
|
Interest rate swap: |
Other income (expense) |
$ | 111 | $ | 113 | $ | 20 | ||||||
9. NOTES PAYABLE
Notes payable is summarized as follows:
|
As of December 31, |
||||||||
|
(In thousands) |
2017 |
2016 |
||||||
|
(a) Mortgage note payable |
$ | 3,350 | $ | 3,439 | ||||
|
(b) Acquisition note payable - related party |
5,304 | 5,304 | ||||||
|
Ending balance |
$ | 8,654 | $ | 8,743 | ||||
|
(a) |
On October 1, 2013, the funding of the purchase of the Company’s Tualatin, Oregon corporate offices from Barakel, LLC was completed. The purchase price for this asset was $5.1 million. The purchase was funded, in part, by a promissory note payable to Wells Fargo Bank in the amount of $3.7 million plus interest at the rate of 2% above LIBOR, payable over ten years with a balloon payment due at maturity. It was secured by a deed of trust on the purchased property, which was executed by CUI Properties, LLC and guaranteed by CUI Global, Inc. During 2017 and 2016, the Company made principal payments of approximately $89 thousand and $85 thousand, respectively, against the mortgage promissory note payable. At December 31, 2017, the balance owed on the mortgage promissory note payable was $3.4 million of which $94 thousand and $3.3 million were in current and long-term liabilities, respectively. At December 31, 2016, the balance owed on the mortgage promissory note payable was $3.4 million of which $89 thousand and $3.4 million were in current and long-term liabilities, respectively. |
|
(b) |
The note payable to International Electronic Devices, Inc. (IED) (formerly CUI Inc.) is associated with the acquisition of CUI Inc. The promissory note is due May 15, 2020 and includes a 5% interest rate per annum, with interest payable monthly and the principal due as a balloon payment at maturity. The note contains a contingent conversion feature, such that in the event of default on the note the holder of the note can, at the holder’s option, convert the note principal into common stock at $0.001 per share. As of December 31, 2017, the Company is in compliance with all terms of this promissory note and the conversion feature is not effective. |
The following table details the maturity of the notes payable and mortgage note payable for CUI Global, Inc.:
|
(In thousands) |
||||
|
As of December 31, 2017 |
||||
|
2018 |
$ | 94 | ||
|
2019 |
99 | |||
|
2020 |
5,407 | |||
|
2021 |
109 | |||
|
2022 |
115 | |||
|
Thereafter |
2,830 | |||
|
Total |
$ | 8,654 | ||
10. WORKING CAPITAL LINE OF CREDIT AND OVERDRAFT FACILITY
On September 27, 2013, the Company’s wholly owned subsidiary, CUI Inc., closed on a two-year revolving Line of Credit (LOC) with Wells Fargo Bank with the following terms:
|
(In thousands) |
|||||||||||
|
Credit Limit |
12/31/17 balance |
Expiration Date |
Interest rate |
||||||||
| $ | 6,000 | $ | — | (2) |
June 1, 2019 |
(1) |
Fixed rate at 2.25% above the LIBOR in effect on the first day of the applicable fixed-rate term, or variable rate at 2.25% above the daily one-month LIBOR rate. |
||||
|
(1) |
During the second quarter of 2017, the Company modified its LOC agreement, which included extending the expiration date, adding CUI-Canada assets as collateral, and modifying restrictive debt covenants and increasing the interest rate on the facility. |
|
(2) |
As a result of the Company’s cash management system, checks issued but not presented to the bank for payment may create negative book cash balances. When those checks are presented for payment if there isn't sufficient cash in the bank account, the checks would be honored by the bank with a corresponding increase to CUI's draw on its line of credit. There were no negative book cash balances included in the balance on the line of credit as of December 31, 2017. |
At December 31, 2017, the LOC is secured by the following collateral via a security agreement on CUI Inc. and CUI-Canada:
|
(In thousands) |
||||
|
CUI Inc. and CUI-Canada General intangibles, net |
$ | 8,899 | ||
|
CUI Inc. and CUI-Canada Accounts receivable, net |
6,996 | |||
|
CUI Inc. and CUI-Canada Inventory, net |
12,157 | |||
|
CUI Inc. and CUI-Canada Equipment, net |
1,626 |
CUI Global, Inc., the parent company, is a payment guarantor of the LOC. Other terms included in this revolving line of credit for CUI limit capital expenditures by CUI Inc. and CUI-Canada to $1.75 million in any fiscal year. The LOC is supported by a single long-term note that does not require repayment until maturity although the Company at its option can repay and re-borrow amounts up to the LOC limit. Since the maturity date is June 1, 2019, which is more than one year in the future, the LOC is classified as long-term. The LOC contains certain financial covenants. In the second quarter of 2017, the Company renegotiated the terms of the LOC and its related covenants. The Company is currently in compliance with its covenants. At December 31, 2017, there was no balance outstanding on the LOC and $6.0 million of credit was available. As of January 1, 2018, the credit line for the LOC was lowered to $4.0 million in accordance with the agreement.
On October 5, 2016, Orbital Gas Systems Ltd. signed a five-year agreement with the London branch of Wells Fargo Bank N.A. for a multi-currency variable rate overdraft facility with a facility limit of 1.5 million pounds sterling ($2.0 million at December 31, 2017) that expires on October 5, 2021. The interest rate on the facility is a base rate plus a 2.25% margin. The facility had an interest rate of 2.5% at December 31, 2017. The overdraft facility is primarily secured by land, equipment, intellectual property rights, and rights to potential future insurance proceeds held by Orbital Gas Systems Ltd. At December 31, 2017 and 2016, there was no balance outstanding on the overdraft facility.
11. COMMITMENTS AND CONTINGENCIES
Legal Matters
The Company may be involved in certain legal actions arising from the ordinary course of business. While it is not feasible to predict or determine the outcome of these matters, we do not anticipate that any of these matters, or these matters in the aggregate, will have a material adverse effect on the financial position or results of operations.
Commissions, Royalty and License Fee Agreements
The Company has minimum commitments under certain royalty agreements. Royalty and license fees are paid in accordance with their related agreements, either on a monthly or quarterly basis. We deal with a number of independent licensors for whose intellectual property we compete with other manufacturers. Rights to such intellectual property, when acquired by us, are usually exclusive and the agreements require us to pay the licensor a royalty on our net sales of the item. These license agreements, in some cases, also provide for advance royalties and minimum guarantees in order to maintain technical rights and exclusivity. As of December 31, 2017 and 2016, $36 thousand and $0.2 million, respectively, was accrued for royalty and license fees payable in accrued expenses and an additional, $65 thousand related to royalty and license fees payable was included in accounts payable as of December 31, 2016.
External Sales Representative Commissions
Commissions to external sales representatives are paid in accordance with their related agreements, either on a monthly or annual basis. As of December 31, 2017 and 2016, $0.3 million and $0.3 million, respectively, was accrued for commissions to external sales representatives, and is reported as a current liability in accrued expenses.
Employment Agreements
As of the year ended December 31, 2017, the following employment agreements were in place:
William J. Clough, President/Chief Executive Officer and General Counsel of CUI Global, Inc., Chief Executive Officer of all CUI Global subsidiaries
Mr. Clough is employed under a multi-year employment contract with the Company, which was recently extended to run to and through December 31, 2018. Said contract provides, in relevant part, for an initial annual salary of $460 thousand, which became effective July 1, 2013 and includes bonus provisions for each calendar year up to 125% of base salary to be based on performance objectives, goals and milestones for each calendar year including revenue performance and entitles Mr. Clough to a two-year severance package and an annual 4% cost of living adjustment (2017 salary of $538 thousand). Bonuses are approved quarterly based on various performance-related factors and an evaluation of current performance and includes a discretionary bonus of up to twenty-five percent of salary based upon the reasonable judgment of the compensation committee. Employee has the ability to earn a larger bonus based on the performance criteria set forth and the reasonable judgment and discretion of the compensation committee. All such bonus payments shall be paid to Mr. Clough in equal monthly installments following the period in which the bonus is earned and shall be paid on the 15th day of each month. At December 31, 2017 and 2016, there was an accrual of $33 thousand and $29 thousand, respectively, for compensation owed to Mr. Clough.
Daniel N. Ford, Chief Financial Officer of CUI Global Inc. and Subsidiaries, Chief Operating Officer of the Energy Division
Mr. Ford is employed under a three-year employment contract with the Company, which was extended to December 31, 2018 and provides, in relevant part, for an initial annual salary of $250 thousand effective July 1, 2013 (2017 salary of $320 thousand), an annual 4% cost of living adjustment, an eighteen-month severance package and bonus provisions up to 125% of base salary to be based on performance objectives, goals and milestones for each calendar year including revenue performance. The bonus includes a discretionary bonus of up to twenty-five percent of salary based upon the reasonable judgment of the compensation committee. Employee has the ability to earn a larger bonus based on the performance criteria set forth and the reasonable judgment and discretion of the compensation committee. Bonuses are approved quarterly based on the above factors and an evaluation of current performance. All such bonus payments shall be paid to Mr. Ford in equal monthly installments following the period in which the bonus is earned and shall be paid on the 15th day of each month. During 2017, Mr. Ford's base pay was raised to $320,000 per annum. At December 31, 2017 and 2016 there was an accrual of $22 thousand and $19 thousand, respectively, for compensation owed to Mr. Ford.
Matthew M. McKenzie, President of CUI Inc., Chief Operating Officer of the Power and Electromechanical Division and Corporate Secretary of CUI Global, Inc.
Mr. McKenzie is employed under a three-year employment contract with the Company, which was extended to December 31, 2018 and provides, in relevant part, for an initial annual salary of $250 thousand effective July 1, 2013, an annual 4% cost of living adjustment (2017 salary of $292 thousand), an eighteen-month severance package and bonus provisions up to 125% of base salary to be based on performance objectives, goals, and milestones for each calendar year, including revenue performance in the Power and Electromechanical segment. The bonus includes a discretionary bonus of up to twenty-five percent of salary based upon the reasonable judgment of the compensation committee. Employee has the ability to earn a larger bonus based on the performance criteria set forth and the reasonable judgment and discretion of the compensation committee. Bonuses are approved quarterly based on the above factors and an evaluation of current performance. All such bonus payments shall be paid to Mr. McKenzie in equal monthly installments following the period in which the bonus is earned and shall be paid on the 15th day of each month. At December 31, 2017 and 2016 there was an accrual of $12 thousand and $5 thousand, respectively, for compensation owed to Mr. McKenzie.
Paul D. White, President of Orbital Gas Systems, Limited
Mr. White is employed under a three-year employment contract with the Company through December 1, 2020 and provides, in relevant part, for an initial annual salary of $225 thousand in year 1 along with a $30 thousand one-time signing bonus, and increases to $250 thousand and $275 thousand in years 2 and 3, respectively, a severance of the Executive’s salary for the remainder of his severance term upon termination, bonus provisions to be based on performance objectives, goals, and milestones for each calendar year, including revenue performance at Orbital-UK. Mr. White served as President of Orbital Gas Systems, Ltd. since July 2017, initially in a consulting role. Upon accepting the permanent role of President of Orbital Gas Systems, Ltd. effective December 1, 2017, Mr. White ceased to be independent as a director of the Company. The bonus includes a discretionary bonus of up to twenty-five percent of salary based upon the reasonable judgment of the compensation committee. Employee has the ability to earn a larger bonus based on the performance criteria set forth and the reasonable judgment and discretion of the compensation committee. Bonuses are approved on an ongoing basis based on the above factors and an evaluation of current performance. All such bonus payments shall be paid to Mr. White following the period in which the bonus is earned. At December 31, 2017, there was an accrual of $40 thousand for compensation owed to Mr. White.
Leases
Orbital-UK has a number of leases, on vehicles, equipment, and on accommodations for visiting personnel. During the year ended December 31, 2017, the total monthly rent on these leases was approximately $25 thousand.
In January 2015, the Company rented office and warehouse space in Houston, TX for its Orbital North America operations. During the year ended December 31, 2017, the monthly rent of this lease, which terminates in January 2018, was approximately $10 thousand. In November 2017, the Company relocated to another rented office and warehouse space in Houston, TX. Rent expense on this lease is approximately $30 thousand per month.
In March 2015, as part of the Tectrol acquisition, the Company leased the Toronto facility. During the year ended December 31, 2017, the monthly rent of this lease was approximately $34 thousand dollars per month.
Additionally, CUI Japan leases office space. During the year ended December 31, 2017, the monthly base rent of this lease was approximately $3 thousand.
Rental expense was $0.9 million, $0.8 million, and $0.8 million in 2017, 2016 and 2015, respectively, and is included in selling, general and administrative on the statement of operations.
Future minimum operating lease obligations are as follows:
|
(In thousands) |
As of December 31, 2017 |
|||
|
2018 |
$ | 934 | ||
|
2019 |
837 | |||
|
2020 |
474 | |||
|
2021 |
397 | |||
|
2022 |
392 | |||
|
Thereafter |
— | |||
|
Total |
$ | 3,034 | ||
12. STOCKHOLDERS’ EQUITY
Common Stock Dividend Restrictions
As of December 31, 2017, there are no restrictions on common stock dividends. Also, at December 31, 2017 and 2016, retained earnings were not restricted upon involuntary liquidation.
Common Stock Issuances
|
(Dollars in thousands) |
||||||||||||||||
|
Date of |
Type of |
Expense/ Prepaid/ |
Stock issuance recipient |
Reason for issuance |
Total no. of |
Grant date or net proceeds |
||||||||||
|
January, April, August and October 2017 |
Vested restricted common stock |
Expense |
Four board members |
Director compensation |
49,980 | $ | 200 | |||||||||
|
January, February and June 2017 |
Common stock |
Expense |
Three Employees |
Approved bonuses |
28,634 | 182 | (1) | |||||||||
|
January and December 2017 |
Common stock |
Expense |
Related party, James McKenzie |
Pursuant to royalty agreement |
3,293 | 16 | (1) | |||||||||
|
January and February 2017 |
Common stock |
Expense |
Two Employees |
Cashless stock option exercises |
245 | — | (2) | |||||||||
|
May 2017 |
Common stock |
Prepaid expense/expense |
Third-party consultant |
Strategic investor marketing services |
15,000 | 57 | (3) | |||||||||
|
October 2017 |
Common stock |
Cash |
Various third-party shareholders |
Equity raise |
7,392,856 | 18,905 | ||||||||||
|
Total 2017 issuances |
7,490,008 | $ | 19,360 | (4)(9) | ||||||||||||
|
January, April, July and October 2016 |
Vested restricted common stock |
Expense |
Five board members |
Director compensation |
46,854 | $ | 267 | (5) | ||||||||
|
January and July 2016 |
Vested restricted common stock |
Expense |
Four Employees |
Approved bonuses |
56,782 | 381 | (6) | |||||||||
|
January, March September and December 2016 |
Common stock |
Expense |
Related party, James McKenzie |
Pursuant to royalty agreement |
6,275 | 38 | ||||||||||
|
February and April 2016 |
Common stock |
Expense |
Three Employees |
Cashless stock option exercise |
718 | — | (2) | |||||||||
|
Total 2016 issuances |
110,629 | $ | 686 | (7) | ||||||||||||
|
January, June, August, November 2015 |
Vested restricted common stock |
Expense |
Directors |
Director compensation |
12,228 | $ | 77 | |||||||||
|
January 2015 |
Vested restricted common stock |
Expense |
New Director of Sales and Marketing - Orbital Gas Systems, North America |
Sign-on bonus |
17,655 | 125 | ||||||||||
|
March 2015 |
Vested restricted common stock |
$31 thousand included in Prepaid expense at December 31, 2015 and $32 thousand of expense in 2015 |
Consultant |
Compensation for strategic investor marketing services |
10,000 | 63 | ||||||||||
|
April, August 2015 |
Common stock |
Expense |
Former employee and employee |
Cashless stock option exercise |
122 | — | (2) | |||||||||
|
May, June, July 2015 |
Vested restricted common stock |
Expense |
Employee |
Approved bonus |
14,404 | 72 | ||||||||||
|
July 2015 |
Common stock |
Expense |
Related parties, James McKenzie, and IED, Inc. |
Pursuant to royalty agreement |
4,070 | 22 | ||||||||||
|
Total 2015 issuances |
58,479 | $ | 359 | (8) | ||||||||||||
|
(1) |
Includes bonuses and royalty of $176 thousand that were accrued and expensed in 2016. |
|
(2) |
The Company received $0 for the issuance in the cashless option exercises. |
|
(3) |
Amount includes $24 thousand that was included in prepaid expense at December 31, 2017. |
|
(4) |
Does not include stock expense of $170 thousand included in accrued liabilities at December 31, 2017 for unissued stock. |
|
(5) |
Includes $38 thousand of stock-based expense related to 2015 director fees accrued and expensed in the fourth quarter of 2015. |
|
(6) |
Bonuses of $366 thousand were accrued and expensed in the fourth quarter of 2015. |
|
(7) |
Does not include stock expense of $176 thousand included in accrued liabilities at December 31, 2016. |
|
(8) |
There was $404 thousand of stock-based expense related to employee stock-based bonuses and vested restricted stock units held by a Director that were earned in 2015 but not issued until the first quarter of 2016. |
|
(9) |
The second phase of a 2014 consulting agreement could result in up to an additional 150,000 shares of common stock being granted subject to sales related performance criteria being achieved. At December 31, 2017, those criteria have not been achieved and no shares have been granted for the second phase of the agreement. |
S-3 registration
The Company filed an S-3 registration statement on March 14, 2017 containing a prospectus that was effective March 29, 2017. With this filing, CUI Global may from time to time issue various types of securities, including common stock, preferred stock, debt securities and/or warrants, up to an aggregate amount of $100 million.
On October 23, 2017, the Company closed on an underwritten public offering of 7,392,856 shares at a public offering price of $2.80 per share, including 964,285 shares sold at the public offering price pursuant to the underwriter's exercise in full of its option to purchase additional shares to cover over-allotments. The net proceeds to CUI Global (after deducting underwriting discount and other expenses payable by the Company) were approximately $18.9 million. The Company has used and intends to continue to use the net proceeds from the offering primarily for general corporate purposes, which includes operating expenses, working capital to improve and promote its commercially available products, advance product candidates, future acquisitions or share repurchases, to expand international presence and commercialization, for general capital expenditures and for satisfaction of debt obligations. In 2017, the Company used some of the proceeds of the public offering to pay off its line of credit and overdraft facility.
Employee Stock Options
All options issued are presented at post reverse quantities.
On May 16, 2008 the Company’s board of directors adopted the Waytronx, Inc. 2008 Equity Incentive Plan (the ‘‘Equity Incentive Plan’’) and authorized 1,500,000 shares of Common Stock to fund the Plan. At the 2008 Annual Meeting of Shareholders held on September 15, 2008, the Equity Incentive Plan was approved by the Company shareholders. At the 2009 Annual Meeting of Shareholders held on September 29, 2009, the shareholders approved an amendment to the 2008 Equity Incentive Plan to increase the number of common shares issuable under the plan from 1,500,000 to 3,000,000. All of these shares have been registered under Form S-8.
The 2008 Equity Incentive Plan is intended to: (a) provide incentive to employees of the Company and its affiliates to stimulate their efforts toward the continued success of the Company and to operate and manage the business in a manner that will provide for the long-term growth and profitability of the Company; (b) encourage stock ownership by employees, directors and independent contractors by providing them with a means to acquire a proprietary interest in the Company by acquiring shares of stock or to receive compensation, which is based upon appreciation in the value of Stock; and (c) provide a means of obtaining and rewarding employees, directors, independent contractors and advisors.
The 2008 Equity Incentive Plan provides for the issuance of incentive stock options (ISOs) and Non-Statutory Options (NSOs) to employees, directors and independent contractors of the Company. The Board shall determine the exercise price per share in the case of an ISO at the time an option is granted and such price shall be not less than the fair market value or 110% of fair market value in the case of a ten percent or greater stockholder. In the case of an NSO, the exercise price shall not be less than the fair market value of one share of stock on the date the option is granted. Unless otherwise determined by the Board, ISOs and NSOs granted under the both plans have a maximum duration of ten years.
On January 5, 2009 the Company board of directors received and approved a written report and recommendations of the Compensation Committee, which included a detailed executive equity compensation report and market analysis and the recommendations of Compensia, Inc., a management consulting firm that provides executive compensation advisory services to compensation committees and senior management of knowledge-based companies. The Compensation Committee used the report and analysis as a basis for its formal written recommendation to the board. Pursuant to a January 8, 2009 board resolution the 2009 Equity Incentive Plan (Executive), a Non-Qualified Stock Option Plan, was created and funded with 4,200,000 shares of $0.001 par value common stock. The Compensation Committee was appointed as the Plan Administrator to manage the plan. On October 11, 2010, CUI Global authorized an additional 3,060,382 options under the 2009 Equity Incentive Plan (Executive). On September 21, 2012, CUI Global authorized an additional 330,000 options under the 2009 Equity Incentive Plan (Executive).
The 2009 Equity Incentive Plan (Executive) provides for the issuance of Incentive Non Statutory Options to attract, retain and motivate executive and management employees and directors and to encourage these individuals to acquire an equity interest in the Company, to make monetary payments to certain management employees and directors based upon the value of the Company’s stock and to provide these individuals with an incentive to maximize the success of the Company and further the interest of the shareholders. The Administrator of the plan is authorized to determine the exercise price per share at the time the option is granted, but the exercise price shall not be less than the fair market value on the date the option is granted. Stock options granted under the 2009 Plan have a maximum duration of ten years.
At December 31, 2017, there are 1,325,078 shares of common stock available under the 2008 Equity Incentive Stock Plan and 201,361 available under the 2009 Equity Incentive Plan (Executive).
During the years ended 2017, 2016 and 2015, the Company recorded expense for services and compensation in the amount of $0, $0.2 million, and $0.5 million, respectively, for stock options that the requisite service was performed during the year. The compensation expense was recorded over the vesting period based upon fair market value of the options using the Black-Scholes option model in accordance with FASB ASC 718 as discussed in section Employee Stock Options.
All expense related to option awards was fully recognized as of December 31, 2016.
A summary of the options issued to employees and directors and changes during the years are presented below:
|
For the Year Ended December 31, 2015 |
||||||||||||||||
|
Number of Options |
Weighted Average Exercise Price ($) |
Weighted Average Remaining Contract Life (years) |
Aggregate Intrinsic Value ($ '000) |
|||||||||||||
|
Balance at beginning of year |
998,432 | $ | 6.34 | 7.58 | $ | 1,206 | ||||||||||
|
Exercised |
(1,334 |
) |
5.28 | 1 | ||||||||||||
|
Expired |
(26,251 |
) |
7.27 | |||||||||||||
|
Balance at end of year |
970,847 | $ | 6.32 | 6.54 | 850 | |||||||||||
|
Exercisable |
853,460 | $ | 6.35 | 6.47 | 736 | |||||||||||
|
For the Year Ended December 31, 2016 |
||||||||||||||||
|
Number of Options |
Weighted Average Exercise Price ($) |
Weighted Average Remaining Contract Life (years) |
Aggregate Intrinsic Value ($ '000) |
|||||||||||||
|
Balance at beginning of year |
970,847 | $ | 6.32 | 6.54 | $ | 850 | ||||||||||
|
Exercised |
(2,333 |
) |
5.46 | 4 | ||||||||||||
|
Expired |
(1,833 |
) |
5.40 | |||||||||||||
|
Balance at end of year |
966,681 | $ | 6.32 | 5.55 | 751 | |||||||||||
|
Exercisable |
966,681 | $ | 6.32 | 5.55 | 751 | |||||||||||
|
For the Year Ended December 31, 2017 |
||||||||||||||||
|
Number of Options |
Weighted Average Exercise Price ($) |
Weighted Average Remaining Contract Life (years) |
Aggregate Intrinsic Value ($ '000) |
|||||||||||||
|
Balance at beginning of year |
966,681 | $ | 6.32 | 5.55 | $ | 751 | ||||||||||
|
Exercised |
(2,001 |
) |
5.70 | |||||||||||||
|
Expired |
(500 |
) |
4.58 | |||||||||||||
|
Balance at end of year |
964,180 | $ | 6.32 | 4.56 | — | |||||||||||
|
Exercisable |
964,180 | $ | 6.32 | 4.56 | — | |||||||||||
As of December 31, 2017 and 2016, all issued and outstanding stock options were fully vested. As of December 31, 2015, there were 117,387 stock options issued and outstanding to employees and directors that were not yet vested. There were no options granted during 2017, 2016 or 2015.
13. RELATED PARTY TRANSACTIONS
The Company recorded investment income through September 30, 2015 of $53 thousand, related to its interest in Test Products International (‘‘TPI’’). For further details regarding TPI, see Note 2 discussion - Investment and Note Receivable.
During 2017, 2016 and 2015, $0.3 million, $0.3 million and $0.3 million, respectively in principal and interest payments were made in relation to the promissory notes issued to related party, IED, see Note 9 Notes Payable, for further details.
Chief Executive Officer, and Chairman of the Board of Directors, William J. Clough’s son Nicholas J. Clough, serves as President at Orbital Gas Systems, North America, Inc., a wholly owned subsidiary of the Company, and as Chief Sales Officer for the Energy Division. In 2017, 2016, and 2015, Mr. Clough received an aggregate salary of $200 thousand, $188 thousand, and $150 thousand, respectively, and received a cash bonus of $150 thousand, $113 thousand and $50 thousand in fiscal 2017, 2016, and 2015, respectively. He also received stock compensation in 2016 and 2015 valued at $50 thousand and $50 thousand, respectively, and other benefits valued at $41 thousand, $30 thousand and $21 thousand in 2017, 2016 and 2015, respectively. As of December 31, 2017, there was an accrual of $13 thousand for compensation accrued to Nicholas Clough. Nicholas Clough does not report to the Chief Executive Officer nor does the Chief Executive Officer have input regarding Mr. Clough’s salary, bonus, or performance. Mr. Clough’s salary and bonus is set by his direct supervisor and relevant market conditions, while his performance is evaluated and monitored by his direct supervisor. In addition, pursuant to Company policy, any related-party bonus and/or salary change in excess of $50,000 is independently reviewed and approved by the Company’s Compensation Committee, comprised of Independent Board Members from the Company’s Board of Directors.
Orbital employs two minority owners of EnDet, Ltd. from which the Company licenses its VE Technology. See Note 11 - Commitments and Contingencies - Commissions, Royalty and License Fee Agreements for more information on license fee agreements.
14. ACCUMULATED OTHER COMPREHENSIVE LOSS
The components of accumulated other comprehensive loss are as follows:
|
(In thousands) |
As of December 31, |
|||||||||||
|
2017 |
2016 |
2015 |
||||||||||
|
Foreign currency translation adjustment |
$ | (3,510 |
) |
$ | (5,590 |
) |
$ | (1,440 |
) |
|||
|
Accumulated other comprehensive loss |
$ | (3,510 |
) |
$ | (5,590 |
) |
$ | (1,440 |
) |
|||
15. CAPITALIZED INTEREST
The cost of constructing facilities, equipment and project assets includes interest costs incurred during the assets’ construction period. The components of interest expense and capitalized interest are as follows:
|
For the Years Ended December 31, |
||||||||||||
|
(In thousands) |
2017 |
2016 |
2015 |
|||||||||
|
Interest cost incurred |
$ | 521 | $ | 492 | $ | 496 | ||||||
|
Interest cost capitalized - property and equipment |
(21 |
) |
(25 |
) |
(55 |
) |
||||||
|
Interest expense, net |
$ | 500 | $ | 467 | $ | 441 | ||||||
16. INCOME TAXES
Consolidated loss before income taxes consisted of the following:
|
For the Years Ended December 31, |
||||||||||||
|
(In thousands) |
2017 |
2016 |
2015 |
|||||||||
|
U.S. operations |
$ | (7,420 |
) |
$ | (8,442 |
) |
$ | (5,937 |
) |
|||
|
Foreign operations |
(6,775 |
) |
1,214 | (458 |
) |
|||||||
|
(Loss) before income taxes |
$ | (14,195 |
) |
$ | (7,228 |
) |
$ | (6,395 |
) |
|||
The income tax (benefit) expense consisted of the following:
|
For the Years Ended December 31, |
||||||||||||
|
(In thousands) |
2017 |
2016 |
2015 |
|||||||||
|
Current: |
||||||||||||
|
Federal |
$ | — | $ | — | $ | — | ||||||
|
State and local |
60 | 81 | 59 | |||||||||
|
Foreign |
101 | 64 | 67 | |||||||||
|
Total current provision |
161 | 145 | 126 | |||||||||
|
Deferred: |
||||||||||||
|
Federal |
(887 |
) |
— | — | ||||||||
|
State and local |
— | — | — | |||||||||
|
Foreign |
(880 |
) |
(107 |
) |
(534 |
) |
||||||
|
Total deferred (benefit) |
(1,767 |
) |
(107 |
) |
(534 |
) |
||||||
|
Total income tax (benefit) expense |
$ | (1,606 |
) |
$ | 38 | $ | (408 |
) |
||||
The following table provides a reconciliation of the federal statutory tax rate to the recorded tax provision (benefit):
|
For the Years Ended December 31, |
||||||||||||
|
(In thousands) |
2017 |
2016 |
2015 |
|||||||||
|
Computed federal income taxes at the statutory rate (benefit) |
$ | (4,826 |
) |
$ | (2,457 |
) |
$ | (2,174 |
) |
|||
|
State income taxes (net of federal benefit) |
39 | 53 | 37 | |||||||||
|
Permanent tax differences |
(262 |
) |
(415 |
) |
(372 |
) |
||||||
|
Foreign tax rates and tax credits differing from USA |
887 | 4 | (60 |
) |
||||||||
|
Purchased goodwill impairment |
1,072 | — | — | |||||||||
|
Net operating loss and other adjustment |
(256 |
) |
216 | — | ||||||||
|
Change in enacted tax rates applied to foreign deferred taxes |
122 | (38 |
) |
(114 |
) |
|||||||
|
Change in valuation allowance |
2,505 | 2,675 | 2,275 | |||||||||
|
Change in enacted tax rates applied to USA deferred taxes |
(887 |
) |
— | — | ||||||||
|
Total income tax (benefit) prvision |
$ | (1,606 |
) |
$ | 38 | $ | (408 |
) |
||||
The Company accounts for income taxes under the asset-liability method. Deferred income taxes reflect the net tax effects of temporary differences between the carrying amounts of assets and liabilities for financial reporting purposes and the amounts used for income tax purposes. Valuation allowances are provided when it is ‘‘more likely than not’’ that the benefits of existing deferred tax assets will not be realized in a future period. Significant components of the Company’s deferred tax assets and liabilities are as follows:
|
As of December 31, |
||||||||
|
(In thousands) |
2017 |
2016 |
||||||
|
Deferred tax assets: |
||||||||
|
Net operating loss carryforwards |
$ | 16,905 | $ | 21,704 | ||||
|
Contribution and other carryforwards |
218 | 370 | ||||||
|
Inventory and accounts receivable reserves |
549 | 441 | ||||||
|
Other |
676 | 1,051 | ||||||
|
Valuation allowance |
(17,662 |
) |
(23,503 |
) |
||||
|
Deferred tax assets after valuation allowance |
686 | 63 | ||||||
|
Deferred tax liabilities |
||||||||
|
Intangible assets |
(2,914 |
) |
(3,754 |
) |
||||
|
Property, plant and equipment |
(186 |
) |
(414 |
) |
||||
|
Total deferred tax liabilities |
(3,100 |
) |
(4,168 |
) |
||||
|
Net deferred tax liabilities |
$ | (2,414 |
) |
$ | (4,105 |
) |
||
The Company adopted the provisions of ASU 2015-17 in 2015. ASU 2015-17 requires that all deferred tax assets and liabilities be classified as noncurrent on the balance sheet. The net deferred tax liability is recorded as follows:
|
As of December 31, |
||||||||
|
(In thousands) |
2017 |
2016 |
||||||
|
Noncurrent deferred tax assets |
$ | — | $ | 15 | ||||
|
Noncurrent deferred tax liability |
(2,414 |
) |
(4,120 |
) |
||||
|
Net deferred tax liability |
$ | (2,414 |
) |
$ | (4,105 |
) |
||
Noncurrent deferred tax assets are included in the Deposits and other assets line of the balance sheet. The Company’s consolidated deferred tax liability as of December 31, 2017 relates to intangibles recorded in connection with prior acquisitions. Approximately $1.9 million of the liability relates to indefinite-lived intangibles, which will only reverse at the time of ultimate sale or impairment of the underlying intangible assets. Additionally, $1.1 million of the deferred tax liability relates to finite-lived intangibles as a result of a foreign acquisition, which reverses as the intangibles are amortized. The foreign deferred tax liabilities are decreased by the deferred tax assets from foreign net operating losses, which are netted against the deferred tax liabilities.
As of December 31, 2017 and 2016, the Company recorded a valuation allowance of $17.7 million and $23.5 million, respectively. During the years ended December 31, 2017, 2016 and 2015, the Company recorded a decrease in valuation allowance of $5.8 million, and an increase in valuation allowance of $2.7 million, and $2.3 million, respectively. The Company has provided for a full valuation on existing deferred tax assets in the United States. As of December 31, 2017, the Company has available federal, state and foreign net operating loss carry forwards of approximately $62.2 million, $57.2 million, and $5.0 million respectively, and for which the federal and state net operating loss carry-forwards will expire between 2018 and 2037. Our ability to utilize federal net operating loss (NOL) carry-forwards to reduce future taxable income may be limited under Section 382 of the Internal Revenue Code if certain ownership changes in our company occur during a rolling three-year period. If such ownership changes by 5-percent-shareholders result in aggregate increases that exceed 50 percentage points during the three-year period, then Section 382 imposes an annual limitation on the amount of our taxable income that may be offset by the federal NOL carry forwards or tax credit carry-forwards at the time of ownership change.
CUI Global files consolidated income tax returns with its domestic subsidiaries for federal and many state jurisdictions in addition to separate subsidiary income tax returns in Japan, the United Kingdom and Canada. As of December 31, 2017, the Company is not under examination by any income tax jurisdiction. The Company is no longer subject to examination in the USA for years prior to 2014.
The Company accounts for income tax uncertainties using a threshold of ‘‘more-likely-than-not’’ in accordance with the provisions of ASC Topic 740, Income Taxes (‘‘ASC 740’’). As of December 31, 2017, the Company has reviewed all of its tax filings and positions taken on its returns and has not identified any material current or future effect on its consolidated results of operations, cash flows or financial position. As such, the Company has not recorded any tax, penalties or interest on tax uncertainties. It is Company policy to record any interest on tax uncertainties as a component of income tax expense.
On December 22, 2017, the USA passed sweeping tax legislation, which reduced the federal corporate tax rate for years beginning after December 31, 2017 to a flat 21% (with an approximate 5% state tax effect) in addition to requiring the deemed repatriation of all foreign undistributed earnings. As such, as of December 22, 2017, the Company restated existing USA deferred tax assets and liabilities to 26% resulting in a net income tax benefit of approximately $887 thousand. As of December 31, 2017, the Company does not have any undistributed foreign earnings subject to deemed repatriation. The Company has no plans to repatriate any excess cash balances which may be available from its foreign subsidiaries in the foreseeable future. The new tax provisions surrounding the repatriation of foreign earnings are extremely complex and may require further evaluation to determine the correct reporting and inclusion for USA purposes. The Company does not anticipate any material changes to the amounts determined as of December 31, 2017.
The Company adopted ASU 2016-09, Compensation - Stock Compensation (Topic 718) effective January 1, 2017 on a modified retrospective basis, whereby a cumulative-effect adjustment to equity as of the beginning of the period is required. Upon evaluation, no adjustment was required as of January 1, 2017.
17. CONCENTRATIONS
During 2017, 36% of revenues were derived from two customers that individually had over 10% of our total revenues: Digi-Key Electronics with 26% and Future Electronics with 10% in the Power and Electromechanical segment. During 2016, 19% of revenues were derived from one customer that individually had over 10% of our total revenues: Digi-Key Electronics. During 2015, 31% of revenues were derived from two customers that individually had over 10% of our total revenues: Digi-Key Electronics with 20% and National Grid with 11%.
The Company’s major product lines in 2017, 2016 and 2015 were power and electromechanical products and natural gas infrastructure and high-tech solutions.
At December 31, 2017, of the gross trade accounts receivable totaling approximately $11.0 million, approximately 21% was due from two customers: GL Industrial Services UK Ltd. in the Energy segment at 11% and Digi-Key Electronics in the Power and Electromechanical segment at 10%. At December 31, 2016, of the gross trade accounts receivable totaling approximately $9.5 million, approximately 30% was due from three customers in the Energy segment: Scotia Gas Networks plc, Socrate S.p.A., and National Grid at 10% each.
There was one supplier that supplied 12% of our purchases in 2017 from a vendor in the Power and Electromechanical segment and no supplier concentration greater than 10% in 2016 or 2015.
With the United Kingdom operations of Orbital, the Company also has foreign revenue and trade accounts receivable concentrations in the United Kingdom of 17% and 28%, respectively for the year ended and at December 31, 2017. In 2016, the Company had foreign revenue and trade accounts receivable in the United Kingdom of 20% and 27%, respectively. In 2015, the Company had foreign revenue and trade accounts receivable in the United Kingdom of 25% and 28%, respectively. Additionally, at December 31, 2017 the Company had accounts receivable concentrations of 11% in Canada and at December 31, 2016, the Company had accounts receivable concentrations of 11% in China and 10% in Italy.
Currently, 23% of our total labor force and 58% of our labor force in Canada is subject to a collective bargaining agreement.
18. SUBSEQUENT EVENTS
Management has reviewed for subsequent events and identified the following:
Stock Issuances in 2018
On January 4, 2018, pursuant to board service agreements, four independent board members were issued a total of 18,180 shares of common stock with a grant date fair value of $50 thousand for first quarter 2018 board fees.
On January 11, 2018, an employee was granted 60,862 shares of common stock as bonus compensation pursuant to an employment agreement, which had been accrued for at December 31, 2017. The stock had a grant date fair value of $163 thousand.
QUARTERLY FINANCIAL DATA - UNAUDITED
CUI Global, Inc.
(In thousands, except share and per share information)
|
March 31 |
June 30 |
September 30 |
December 31(1) |
|||||||||||||
|
Quarter ended: |
||||||||||||||||
|
2017 |
||||||||||||||||
|
Total revenue |
$ | 17,844 | $ | 22,500 | $ | 21,796 | $ | 21,135 | ||||||||
|
Total cost of revenue |
12,160 | 14,276 | 14,356 | 14,614 | ||||||||||||
|
Gross profit |
5,684 | 8,224 | 7,440 | 6,521 | ||||||||||||
|
Gross profit percent |
32 |
% |
37 |
% |
34 |
% |
31 |
% |
||||||||
|
Selling, general and administrative |
8,554 | 8,712 | 8,212 | 8,443 | ||||||||||||
|
Depreciation and amortization |
552 | 564 | 521 | 526 | ||||||||||||
|
Research and development |
610 | 614 | 696 | 605 | ||||||||||||
|
Bad debt |
(27 |
) |
(23 |
) |
30 | 7 | ||||||||||
|
Impairment of goodwill and intangible assets |
— | 3 | — | 3,152 | ||||||||||||
|
Other operating expenses |
5 | 4 | — | 38 | ||||||||||||
|
Operating loss |
(4,010 |
) |
(1,650 |
) |
(2,019 |
) |
(6,250 |
) |
||||||||
|
Net loss |
$ | (3,854 |
) |
$ | (1,568 |
) |
$ | (1,902 |
) |
$ | (5,265 |
) |
||||
|
Loss per common share: |
. | |||||||||||||||
|
Basic and diluted loss per common share |
$ | (0.18 |
) |
$ | (0.07 |
) |
$ | (0.09 |
) |
$ | (0.20 |
) |
||||
|
Basic and diluted weighted average common shares outstanding |
20,949,251 | 20,967,957 | 20,991,534 | 26,635,684 | ||||||||||||
|
Quarter ended: |
||||||||||||||||
|
2016 |
||||||||||||||||
|
Total revenue |
$ | 20,661 | $ | 23,140 | $ | 23,257 | $ | 19,403 | ||||||||
|
Total cost of revenue |
12,626 | 13,983 | 14,660 | 12,931 | ||||||||||||
|
Gross profit |
8,035 | 9,157 | 8,597 | 6,472 | ||||||||||||
|
Gross profit percent |
39 |
% |
40 |
% |
37 |
% |
33 |
% |
||||||||
|
Selling, general and administrative |
9,238 | 9,009 | 8,080 | 7,912 | ||||||||||||
|
Depreciation and amortization |
608 | 616 | 585 | 557 | ||||||||||||
|
Research and development |
506 | 527 | 512 | 471 | ||||||||||||
|
Bad debt |
7 | 42 | — | 44 | ||||||||||||
|
Other operating expenses |
— | — | 5 | 52 | ||||||||||||
|
Operating loss |
(2,324 |
) |
(1,037 |
) |
(585 |
) |
(2,564 |
) |
||||||||
|
Net loss |
$ | (2,668 |
) |
$ | (1,481 |
) |
$ | (507 |
) |
$ | (2,610 |
) |
||||
|
Loss per common share: |
||||||||||||||||
|
Basic and diluted loss per common share |
$ | (0.13 |
) |
$ | (0.07 |
) |
$ | (0.02 |
) |
$ | (0.12 |
) |
||||
|
Basic and diluted weighted average common shares outstanding |
20,878,549 | 20,889,052 | 20,906,781 | 20,916,559 | ||||||||||||
|
(1) |
Net loss for the fourth quarter of 2017 includes a discrete income tax benefit of $887 thousand associated with the USA Tax Cut and Jobs Act enacted in December 2017. |
Item 9. Changes In and Disagreements with Accountants on Accounting and Financial Disclosure
None.
Item 9A. Controls and Procedures
Evaluation of Disclosure Controls and Procedures
The Company's management, with the participation of the Company's Chief Executive Officer and its Chief Financial Officer, evaluated the effectiveness of the Company's disclosure controls and procedures (as defined in Exchange Act Rules 13a-15(e) and 15d-15(e)) as of the end of the period covered by this annual report. In designing and evaluating our disclosure controls and procedures, our management recognizes that any controls and procedures, no matter how well designed and operated, can provide only reasonable assurance of achieving the desired control objectives, and our management is required to apply their judgment in evaluating the cost-benefit relationship of possible controls and procedures. Based upon that evaluation, the Company's management, including the CEO and the CFO, concluded that, as of December 31, 2017, the Company’s disclosure controls and procedures were effective.
Management's Annual Report on Internal Control over Financial Reporting
Management of CUI Global, Inc. is responsible for establishing and maintaining effective internal control over financial reporting. The Company’s internal control over financial reporting is a process designed to provide reasonable assurance regarding the reliability of financial reporting and the preparation of financial statements for external purposes in accordance with generally accepted accounting principles in the United States of America (“U.S. GAAP”). Our internal control over financial reporting includes those policies and procedures that (i) pertain to the maintenance of records that, in reasonable detail, accurately and fairly reflect the transactions and dispositions of the assets of the Company; (ii) provide reasonable assurance that transactions are recorded as necessary to permit preparation of financial statements in accordance with U.S. GAAP and that receipts and expenditures of the Company are being made only in accordance with authorizations of the Company’s management and directors; and (iii) provide reasonable assurance regarding prevention or timely detection of unauthorized acquisition, use, or disposition of the Company assets that could have a material effect on the financial statements.
Internal control over financial reporting, no matter how well designed, has inherent limitations. Because of such inherent limitations, internal control over financial reporting may not prevent or detect misstatements. Also, projections of any evaluation of effectiveness to future periods are subject to the risk that controls may become inadequate because of changes in conditions, or that the degree of compliance with the policies or procedures may deteriorate.
Management assessed the effectiveness of the Company’s internal control over financial reporting as of December 31, 2017, based on the criteria set forth by the Committee of Sponsoring Organizations of the Treadway Commission (“COSO”) in Internal Control-Integrated Framework (“2013 framework”). Based on this evaluation, management concluded that the Company's internal control over financial reporting was effective as of December 31, 2017.
Changes in Internal Control over Financial Reporting
There have been no changes in our internal control over financial reporting during the quarter ended December 31, 2017 that materially affected, or are reasonably likely to materially affect, our internal control over financial reporting.
Registered Public Accounting Firm’s Report on Internal Control over Financial Reporting
Perkins & Company, P.C., an independent registered public accounting firm, has audited CUI Global, Inc.’s and Subsidiaries internal control over financial reporting as of December 31, 2017, based on criteria established in Internal Control - Integrated Framework (2013) issued by the Committee of Sponsoring Organizations of the Treadway Commission.
Report of Independent Registered Public Accounting Firm
Stockholders and Board of Directors
CUI Global, Inc.
Tualatin, Oregon
Opinion on Internal Control over Financial Reporting
We have audited CUI Global, Inc. and Subsidiaries’ (the “Company’s”) internal control over financial reporting as of December 31, 2017, based on criteria established in Internal Control - Integrated Framework (2013) issued by the Committee of Sponsoring Organizations of the Treadway Commission (the “COSO criteria”). In our opinion, the Company maintained, in all material respects, effective internal control over financial reporting as of December 31, 2017, based on the COSO criteria.
We also have audited, in accordance with the standards of the Public Company Accounting Oversight Board (United States) (“PCAOB”), the consolidated balance sheets of the Company as of December 31, 2017 and 2016, the related consolidated statements of operations, comprehensive income and (loss), changes in stockholders’ equity, and cash flows for each of the three years in the period ended December 31, 2017, and the related notes and our report dated March 14, 2018 expressed an unqualified opinion thereon.
Basis for Opinion
The Company’s management is responsible for maintaining effective internal control over financial reporting and for its assessment of the effectiveness of internal control over financial reporting, included in the accompanying Item 9A, Management’s Annual Report on Internal Control over Financial Reporting. Our responsibility is to express an opinion on the Company’s internal control over financial reporting based on our audit. We are a public accounting firm registered with the PCAOB and are required to be independent with respect to the Company in accordance with U.S. federal securities laws and the applicable rules and regulations of the Securities and Exchange Commission and the PCAOB.
We conducted our audit of internal control over financial reporting in accordance with the standards of the PCAOB. Those standards require that we plan and perform the audit to obtain reasonable assurance about whether effective internal control over financial reporting was maintained in all material respects. Our audit included obtaining an understanding of internal control over financial reporting, assessing the risk that a material weakness exists, and testing and evaluating the design and operating effectiveness of internal control based on the assessed risk. Our audit also included performing such other procedures as we considered necessary in the circumstances. We believe that our audit provides a reasonable basis for our opinion.
Definition and Limitations of Internal Control over Financial Reporting
A company’s internal control over financial reporting is a process designed to provide reasonable assurance regarding the reliability of financial reporting and the preparation of financial statements for external purposes in accordance with generally accepted accounting principles. A company’s internal control over financial reporting includes those policies and procedures that (1) pertain to the maintenance of records that, in reasonable detail, accurately and fairly reflect the transactions and dispositions of the assets of the company; (2) provide reasonable assurance that transactions are recorded as necessary to permit preparation of financial statements in accordance with generally accepted accounting principles, and that receipts and expenditures of the company are being made only in accordance with authorizations of management and directors of the company; and (3) provide reasonable assurance regarding prevention or timely detection of unauthorized acquisition, use, or disposition of the company’s assets that could have a material effect on the financial statements.
Because of its inherent limitations, internal control over financial reporting may not prevent or detect misstatements. Also, projections of any evaluation of effectiveness to future periods are subject to the risk that controls may become inadequate because of changes in conditions, or that the degree of compliance with the policies or procedures may deteriorate.
/s/ Perkins & Company, P.C.
Portland, Oregon
March 14, 2018
Item 9B. Other Information
There are no matters to be reported under this Item.
PART III
Item 10. Directors, Executive Officers and Corporate Governance
Our Bylaws permit the number of directors to be fixed by resolution of the board of directors, but to be no less than one. The board of directors has set the maximum number of members to no more than eight members. Directors are elected by a majority of the votes cast by the stockholders and serve a one-year term or until their successors have been elected and qualified or their earlier resignation or removal. At December 31, 2017, we have seven directors, four of whom are ‘‘independent’’ in accordance with applicable rules promulgated by the Securities and Exchange Commission and within the meaning of Rule 5605(a)(2) of the NASDAQ Stock Market.
The board of directors has four standing committees: Audit Committee, Disclosure Committee, Compensation Committee and Nomination Committee, each of which has a written charter and/or statement of policy approved by our board. Our board currently appoints the members of each committee. Copies of the current committee charters and/or statement of policy for each committee are posted on our website at www.CUIGlobal.com. Except for two separate instances by two different directors, all directors attended, either in person or electronically, all of the meetings held by the committees on which such director served.
The following are officers and directors of the Company with their ages as of December 31, 2017, and a list of the members of our four standing committees: Audit Committee, Disclosure Committee, Compensation Committee and Nomination Committee.
William J. Clough, Esq., President/Chief Executive Officer, and General Counsel of CUI Global, Inc. Mr. Clough is also a Director and Chairman of the Company’s board of directors, as well as Chief Executive Officer of all of the Company’s wholly owned subsidiaries, age 66 (Seat 1)
Mr. Clough has served on the board of directors since 2006. Mr. Clough was reelected at the 2017 Annual Meeting of Shareholders to serve a one-year term.
During his tenure, he has led several strategic initiatives, including the Company’s acquisition of Orbital Gas Systems Ltd. and the Company’s natural gas technology line, as well as recently opening Orbital Gas Systems, North America, Inc. Mr. Clough steered the Company through its 2012, 2013 and 2017 equity raises and its listing onto the Nasdaq Capital Market.
Before joining the Company, Clough, an attorney and former law enforcement officer, operated his own law firm for 14 years, with offices in Los Angeles, San Francisco and Honolulu. In that capacity, he has successfully represented leading movie studios and media conglomerates.
Mr. Clough received his Juris Doctorate, cum laude, from Hastings College of the Law in 1990. He obtained one of the largest ever non-wrongful death jury verdicts in Los Angeles County Superior Court in 2000 and successfully represented parties in multi-million dollar cases throughout the United States. Mr. Clough is certified to practice law in state and federal courts in California, Illinois, Hawaii, and before the United States Supreme Court. Mr. Clough worked as a police officer for 16 years at the local, state, and federal level including as a Federal Air Marshall flying in Southern Europe and the Middle East.
Thomas A. Price, Director, age 74 (Seat 2)
Mr. Price was elected to serve as a director at the 2008 Annual Meeting of Shareholders and continues to serve on the board of directors and was reelected at the 2017 Annual Meeting of Shareholders to serve a one-year term.
Mr. Price is a business veteran with more than 30 years of business and operational management experience. He is the founder of Tom Price Dealership Group, a leading auto dealership that he grew to 11 franchises at six locations across California.
Throughout the course of his career, Mr. Price has been involved in investor and manufacturer relations, and orchestrated the successful acquisition of his company, FirstAmerica Automotive by Sonic Automotive, one of the nation's largest automotive retailers. Mr. Price has been credited for the successful completion of Serramonte Auto Plaza, an advanced, large-scale campus with innovative, industry-leading design features. Mr. Price also developed the multi-brand San Francisco Auto Repair Center and a conference facility in Larkspur, California.
Currently, Mr. Price is the owner of nine car dealerships in Northern California. He has received numerous awards for dealership excellence from manufacturers and has served on the National Dealer Advisory Boards of several major automobile manufacturers. He was Chairman of the Lexus National Dealer Advisory Board and charter member of the J.D. Power Dealer Roundtable.
Mr. Price is also an active philanthropist. The Price Family Dealerships are major sponsors of Special Olympics of Marin, Dedication to Special Education, CASA/Advocates for Children, Marin Breast Cancer Council and the Golden Gate Shootout.
Matthew M. McKenzie, President of CUI Inc., Chief Operating Officer of the Power and Electromechanical Division, Corporate Secretary of CUI Global, Inc. and Director, age 37 (Seat 3)
Mr. McKenzie was elected to the board of directors at the 2008 Annual Meeting of Shareholders and continues to serve on the board of directors. Mr. McKenzie was reelected at the 2017 Annual Meeting of Shareholders to serve a one-year term.
Mr. McKenzie has been working in various functions for CUI for over 15 years (including serving as president for 10 years), gaining him intimate knowledge of the business, its operations and its opportunities for growth.
Over the past several years, Mr. McKenzie has worked to position CUI for growth through sales and operation expansion as well as channel development. Among many other things, he has facilitated ISO 9001 certification, a quality management system, provided structure to global logistics, expanded the distribution channel, and implemented CUI’s ERP system, which allows for more visibility and analysis opportunities. Currently, Matt spearheads the research, development, and implementation of the advanced power products including the ICE technology products.
Mr. McKenzie brings a background in leadership from a variety of fields, giving him valuable insight into leadership in the 21st century. He also brings an MBA from George Fox University, a program that is diverse and well-connected to the community.
Sean P. Rooney, Director, age 46 (Seat 4)
Mr. Rooney was elected to serve as a Director at the 2008 Annual Meeting of Shareholders and continues to serve on the board of directors. Mr. Rooney was reelected at the 2017 Annual Meeting of Shareholders to serve a one-year term.
Mr. Rooney is a veteran of the financial markets and has served on the board of CUI Global since 2008. He brings over 20 years of financial management experience to the board of directors. Mr. Rooney currently is a Financial Advisor at the Pinnacle Financial Group, which is part of LPL Financial, the largest independent broker dealer in the United States.
Prior to working with LPL, Mr. Rooney served as Senior Director of Investments at Oppenheimer & Co., a full-service investment banking, securities and wealth management firm. He has also worked in a similar capacity at Investec Ernst & Company, an international specialist bank headquartered in South Africa and the UK. Mr. Rooney currently advises a clientele of high net worth investors, institutions and foundations. He is an active member of various industry and charitable organizations.
Mr. Rooney graduated from C.W. Post University in 1993 with a Bachelors of Arts degree in Business Administration and holds Series 7 (General Securities Representative), Series 63 (Uniform Securities Law), and Series 24 (General Securities Principal) licenses.
Paul D. White, President of Orbital Gas Systems, Ltd. and Director, age 56 (Seat 5)
Mr. White was appointed as a Director by the board of directors pursuant to the bylaws during April 2014 to fill a vacancy. Mr. White was elected at the 2017 Annual Meeting of Shareholders to serve a one-year term.
Mr. White is a graduate of Humboldt State University and brings to the CUI Global board over 25 years of upper-level business management skills. Mr. White has served as President of Orbital Gas Systems, Ltd. since July 2017. Upon accepting the role of President of Orbital Gas Systems, Ltd., Mr. White ceased to be an independent director. Previously Mr. White served as Vice President of the Healthcare Division for North America of a global security company where his responsibilities included direct responsibility for profit and loss statements with approximately $120 million in revenues, along with management, control, and supervision of approximately 3,000 employees working at 44 medical centers & hospitals and over 600 medical office buildings throughout the United States. He previously served in the Office of the General Counsel and Risk Services, as an Environmental Risk Consultant with Sutter Health Support Services – Corporate Services. His key responsibilities included: formulating best practice solutions to minimize/eliminate existing and potential employee health & safety and security exposures as well as consultations of state, federal, and professional standards for Risk Control/Environmental Health & Safety programs such as OSHA, TJC, DHS, EPA, NFPA, and DOT.
As a results-oriented business leader with achievement in developing, managing and expanding business portfolios, with expertise at the senior management level in complex matrix organizations, Mr. White has senior management experience in contract management, public relations, program strategy and design and has been consistently recognized for effective financial management, leadership, integrity, team-building, and program management skills.
Corey A. Lambrecht, Director, age 48 (Seat 6)
Mr. Lambrecht was elected to serve as a director at the 2007 Annual Meeting of Shareholders and continues to serve on the board of directors. Mr. Lambrecht was reelected at the 2017 Annual Meeting of Shareholders to serve a one-year term.
Mr. Lambrecht is a 10+ year public company executive with broad experience in strategic acquisitions, new business development, pioneering consumer products, corporate licensing and interactive technology services. Mr. Lambrecht serves as Executive Vice President of Global Alerts, a leading Cause Media company. He most recently served as Director of Sales for Leveraged Marketing Associates, the worldwide leader in licensed brand extension strategies.
While Executive Vice President for Smith & Wesson Holding Corporation, he was responsible for Smith & Wesson Licensing, Advanced Technologies and Interactive Marketing divisions. He was the former President of A For Effort, an interactive database marketing company specializing in online content (advergaming) for clients such as the National Hockey League.
Mr. Lambrecht's prior experience also includes pre-IPO founder for Premium Cigars International and VP Sales/Marketing for ProductExpress.com. Mr. Lambrecht also has prior operational experience with a Scottsdale, Arizona residential and commercial development company.
C. Stephen Cochennet, Director, age 61 (Seat 7)
Mr. Cochennet was appointed to serve as a director by the CUI Global Board of Directors at its December 1, 2017 annual meeting pursuant to Section 3.12 of the CUI Global Amended and Restated Bylaws. Mr. Cochennet will stand for election to the Board at the 2018 annual meeting.
C. Stephen Cochennet has served as CEO/President of Kansas Resource Development Company, a private oil and gas exploration company since 2011. From 2011 through 2015 he was also the CEO and president of Guardian 8 Corporation. From 2005-2010, Mr. Cochennet was the Chairman, President, and Chief Executive Officer of EnerJex Resources, Inc., a publicly traded SEC registered Oil and Gas Company. Prior to joining EnerJex, Mr. Cochennet was President of CSC Group, LLC. in which he supported a number of Fortune 500 corporations, international companies, and natural gas/electric utilities, as well as various start up organizations. The services he provided included strategic planning, capital formation, corporate development, executive networking and transaction structuring. From 1985 to 2002, he held several executive positions with UtiliCorp United Inc. (Aquila) in Kansas City, Missouri. His responsibilities included finance, administration, operations, human resources, corporate development, natural gas/energy marketing, and managing several new startup operations. Prior to his experience at Aquila Mr. Cochennet served 6 years with the Federal Reserve System managing failed and problem banking institutions primarily within the oil and gas markets.
Mr. Cochennet graduated from the University of Nebraska with a B.A. in Finance and Economics.
Daniel N. Ford, Chief Financial Officer of CUI Global Inc. and Subsidiaries and Chief Operating Officer of the Energy Division, age 38
With a background in the big 4 accounting firms, including KPMG, Daniel Ford brings a large company perspective to a small company with big potential. As CFO of CUI, Mr. Ford has consistently moved CUI into a position of profitability, efficiency, and forward thinking, transforming many of CUI's accounting, inventory management, and vendor relations processes.
Mr. Ford has implemented improved ERP systems, was instrumental in financing CUI Inc.’s move into its current 62,380 square foot facility, worked in conjunction with Mr. Clough on the 2012, 2013 and 2017 equity raises and listing onto the Nasdaq Capital Market, as well as worked to facilitate the acquisitions of Orbital Gas Systems Ltd. and CUI-Canada.
Mr. Ford earned his B.B.A with a double major in Finance and Accounting from the University of Portland and holds an MBA from George Fox University.
Corporate Governance and Board of Directors Matters
We are committed to maintaining the highest standards of business conduct and corporate governance, which we believe are essential to running our business efficiently, serving our stockholders well and maintaining our integrity in the marketplace. We have adopted a Corporate Code of Ethics and Business Conduct, a code of business conduct and ethics for employees, directors and officers (including our principal executive officer and principal financial and accounting officer). We have also adopted the following governance guides: Charter of the Audit Committee, Charter of the Compensation Committee, policy for Director Independence, Nominating Committee guide, Disclosure Controls and Procedures and, Whistleblower Policy, all of which, in conjunction with our certificate of incorporation and bylaws, form the framework for our corporate governance. These corporate governance documents are available on the Internet at our website www.CUIGlobal.com.
Our Corporate Governance Practices
We have always believed in strong and effective corporate governance procedures and practices. In that spirit, we have summarized several of our corporate governance practices below.
The Board of Director’s Role in Risk Oversight
The board of directors and its committees have an important role in the Company’s risk oversight, management and assessment process. The board regularly reviews with management the Company’s financial and business strategies, which include a discussion of relevant material risks as appropriate. The board discusses with the Company’s outside general counsel, as appropriate, its risk oversight and assessment as well as any material risks to the Company. In addition, the board delegates risk management responsibilities to the Audit Committee and Compensation Committee, which committees are each comprised of independent directors. The Audit Committee, as part of its charter, oversees the Company’s risk oversight, management and assessment of the Company and oversees and assesses the risks associated with the corporate governance and ethics of the Company. Risk considerations are a material aspect of the Compensation Committee. The Compensation Committee is responsible for overseeing the management of risks relating to executive compensation. In addition, the Compensation Committee also, as appropriate, assesses the risks relating to the Company’s overall compensation programs. While the Audit Committee and Compensation Committee oversee the management of the risk areas identified above, the entire board is regularly informed through committee reports about such risks. This enables the board and its committees to coordinate the risk management, assessment and oversight roles.
Adopting Governance Guidelines
Our board of directors has adopted a set of corporate governance guidelines to establish a framework within which it will conduct its business and to guide management in its running of the Company. The governance guidelines can be found on our website at www.CUIGlobal.com and are summarized below.
Monitoring Board Effectiveness
It is important that our board of directors and its committees are performing effectively and in the best interest of the Company and its stockholders. The board of directors and each committee are responsible for annually assessing their effectiveness in fulfilling their obligations.
Conducting Formal Independent Director Sessions
On a regular basis, at the conclusion of regularly scheduled board meetings, the independent directors are encouraged to meet privately, without our management or any non-independent directors.
Hiring Outside Advisors
The board and each of its committees may retain outside advisors and consultants of their choosing at our expense, without management's consent.
Avoiding Conflicts of Interest
We expect our directors, executives and employees to conduct themselves with the highest degree of integrity, ethics and honesty. Our credibility and reputation depend upon the good judgment, ethical standards and personal integrity of each director, executive and employee. In order to provide assurances to the Company and its stockholders, we have implemented standards of business conduct, which provide clear conflict of interest guidelines to its employees and directors, as well as an explanation of reporting and investigatory procedures.
Providing Transparency
We believe that it is important that stockholders understand our governance practices. In order to help ensure transparency of our practices, we have posted information regarding our corporate governance procedures on our website at www.CUIGlobal.com.
Whistleblower Policy
In furtherance of our governance transparency and ethical standards, we adopted a comprehensive Whistleblower Policy that encourages employees to report to proper authorities incorrect financial reporting, unlawful activity, activities that are not in line with the CUI Global Code of Business Conduct or activities, which otherwise amount to serious improper conduct. Our Whistleblower Policy is posted on our website at www.CUIGlobal.com.
Accuracy of All Public Disclosure
It is the Company's policy that all public disclosure made by the Company should be accurate and complete, fairly present, in all material respects, the Company's financial condition and results of operations, and be made on a timely basis as required by applicable laws and securities exchange requirements. In order to oversee this policy, a Disclosure Committee Charter has been adopted by the Chief Executive Officer and Chief Financial Officer and ratified by our Audit Committee. You can view a copy of this document on our website at www.CUIGlobal.com or obtain a copy by making a written request to the Company at CUI Global, Inc., 20050 SW 112th Avenue, Tualatin, Oregon 97062.
Communications with the Board of Directors
Stockholders may communicate with the board of directors by writing to the Company at CUI Global, Inc., 20050 SW 112th Avenue, Tualatin, Oregon 97062, or via phone (503) 612-2300. Stockholders who would like their submission directed to a member of the board may so specify and the communication will be forwarded as appropriate.
Standards of Business Conduct
The board of directors has adopted a Code of Ethics and Business Conduct for all our employees and directors, including the Company's principal executive and senior financial officers. You can obtain a copy of these documents on our website at www.CUIGlobal.com or by making a written request to the Company at CUI Global, Inc., 20050 SW 112th Avenue, Tualatin, Oregon 97062. We will disclose any amendments to the Code of Ethics and Business Conduct or waiver of a provision therefrom on our website at www.CUIGlobal.com.
Ensuring Auditor Independence
We have taken several steps to ensure the continued independence of our independent registered public accounting firm. That firm reports directly to the Audit Committee, which also has the ability to pre-approve or reject any non-audit services proposed to be conducted by our independent registered public accounting firm.
Committees of the Board and Meetings
At December 31, 2017, our board of directors consists of seven directors. Four of our seven directors are ‘‘independent’’ as defined in Rule 5605(a)(2) of The NASDAQ Stock Market. Our board of directors has the following standing committees: Audit Committee, Nominating Committee, Compensation Committee and Disclosure Committee. Each of the committees operates under a written charter adopted by the board of directors. All committee charters are available on our website at www.CUIGlobal.com.
Audit Committee
The Audit Committee is established pursuant to the Sarbanes-Oxley Act of 2002 for the purposes of overseeing the company’s accounts and financial reporting processes and audits of its financial statements. The Audit Committee reviews the financial information that will be provided to the stockholders and others, the systems of internal controls established by management and the board and the independence and performance of the Company’s audit process. The Audit Committee is directly responsible for, among other things, the appointment, compensation, retention and oversight of our independent registered public accounting firm, review of financial reporting, internal company processes of business/financial risk and applicable legal, ethical and regulatory requirements. During 2017, the Audit Committee held nine formal meetings.
At December 31, 2017, the Audit Committee is comprised of Sean P. Rooney, Chairman, Thomas A. Price, Deputy Chairman, and Corey A. Lambrecht. Messrs. Rooney, Price and Lambrecht are independent in accordance with Rule 10A-3 under the Securities Exchange Act of 1934 and Rule 5605(a)(2) of The NASDAQ Stock Market.
Audit Committee Report
THE FOLLOWING REPORT OF THE AUDIT COMMITTEE DOES NOT CONSTITUTE SOLICITING MATERIAL AND SHOULD NOT BE DEEMED FILED OR INCORPORATED BY REFERENCE INTO ANY OTHER COMPANY FILING UNDER THE SECURITIES ACT OF 1933 OR THE SECURITIES EXCHANGE ACT OF 1934, EXCEPT TO THE EXTENT THE COMPANY SPECIFICALLY INCORPORATES THIS REPORT BY REFERENCE THEREIN.
Audit Committee Report
The Audit Committee reviews the financial information that will be provided to the stockholders and others, the systems of internal controls established by management and the board and the independence and performance of the Company’s audit process.
The Audit Committee has:
|
• |
reviewed and discussed with management the audited consolidated financial statements included in the Company’s Annual Report on Form 10-K and the most recent Quarterly Report on Form 10-Q; |
|
• |
discussed with Perkins & Company, P.C., the Company’s independent registered public accounting firm, the matters required to be discussed by General Auditing Standard 1301: Communications with Audit Committees as adopted by the Public Company Accounting Oversight Board; and |
|
• |
received the written disclosures and letter from Perkins & Company, P.C. as required by applicable requirements of the Public Company Accounting Oversight Board regarding the independent accountant’s communications with the Audit Committee concerning independence and has discussed with Perkins & Company, P.C. its independence from CUI Global. |
Based on these reviews and discussions, the Audit Committee has recommended that the audited consolidated financial statements be included in the Company’s Annual Report on Form 10-K for the year ended December 31, 2017. The Audit Committee has also considered whether the amount and nature of non-audit services provided by Perkins & Company, P.C. is compatible with the auditor’s independence and determined that it is compatible.
Submitted by: Audit Committee by
Sean P. Rooney
Thomas A. Price
Corey A. Lambrecht
Nominating Committee
The nominating committee consists of all of the members of the board of directors who are ‘‘independent directors’’ within the meaning of Rule 5605(a)(2) of The NASDAQ Stock Market. The nominating committee is responsible for the evaluation of nominees for election as director, the nomination of director candidates for election by the stockholders and evaluation of sitting directors. The board has developed a formal policy for the identification and evaluation of nominees, Charter of the Nominating Committee of the Board of Directors, which can be reviewed on our website at www.CUIGlobal.com. In general, when the board determines that expansion of the board or replacement of a director is necessary or appropriate, the nominating committee will review, through candidate interviews with members of the board and management, consultation with the candidate's associates and through other means, a candidate's honesty, integrity, reputation in and commitment to the community, judgment, personality and thinking style, willingness to invest in the Company, residence, willingness to devote the necessary time, potential conflicts of interest, independence, understanding of financial statements and issues, and the willingness and ability to engage in meaningful and constructive discussion regarding Company issues. The committee reviews any special expertise, for example, that qualifies a person as an audit committee financial expert, membership or influence in a geographic or business target market, or other relevant business experience. To date the Company has not paid any fee to any third party to identify or evaluate, or to assist it in identifying or evaluating, potential director candidates.
The nominating committee considers director candidates nominated by stockholders during such times as the Company is actively considering obtaining new directors. Candidates recommended by stockholders will be evaluated based on the same criteria described above. Stockholders desiring to suggest a candidate for consideration should send a letter to the Company's secretary and include: (a) a statement that the writer is a shareholder (providing evidence if the person's shares are held in street name) and is proposing a candidate for consideration; (b) the name and contact information for the candidate; (c) a statement of the candidate's business and educational experience; (d) information regarding the candidate's qualifications to be director, including but not limited to an evaluation of the factors discussed above which the board would consider in evaluating a candidate; (e) information regarding any relationship or understanding between the proposing shareholder and the candidate; (f) information regarding potential conflicts of interest and (g) a statement that the candidate is willing to be considered and willing to serve as director if nominated and elected. Because of the small size of the Company and the limited need to seek additional directors, there is no assurance that all shareholder proposed candidates will be fully considered, that all candidates will be considered equally or that the proponent of any candidate or the proposed candidate will be contacted by the Company or the board and no undertaking to do so is implied by the willingness to consider candidates proposed by stockholders.
Disclosure Committee
We have formed a Disclosure Committee, which has been adopted by our CEO and CFO (‘‘Principal Officers’’) and ratified by our Audit Committee. The Disclosure Committee assists our Principal Officers in fulfilling their responsibility for oversight of the accuracy, completeness and timeliness of our public disclosures including, but not limited to our SEC filings, press releases, correspondence disseminated to security holders, presentations to analysts and release of financial information or earnings guidance to security holders or the investment community. The Disclosure Committee consists of our Principal Officers, the individual or representative of the firm primarily charged with investor/public relations, the Audit Committee Chairman and outside SEC counsel. Our CEO is Chairman of the committee. Our Senior Officers may replace or add new members from time to time. Our Senior Officers have the option to assume all the responsibilities of this committee or designate a committee member, who shall be a person with expertise in SEC and SRO rules and regulations with respect to disclosure, who shall have the power, acting together with our Senior Officers, to review and approve disclosure statements when time or other circumstances do not permit the full committee to meet. You may review the full text of our Disclosure Committee Charter on our website, www.CUIGlobal.com, under the link, governance.
Generally, the committee serves as a central point to which material information should be directed and a resource for people who have questions regarding materiality and the requirement to disclose. In discharging its duties, the committee has full access to all Company books, records, facilities and personnel, including the board of directors, Audit Committee, independent public accountants and outside counsel.
Compensation Committee
The Compensation Committee discharges the board’s responsibilities relating to general compensation policies and practices and to compensation of our executives. In discharging its responsibilities, the Compensation Committee establishes principles and procedures in order to ensure to the board and the shareholders that the compensation practices of the Company are appropriately designed and implemented to attract, retain and reward high quality executives and are in accordance with all applicable legal and regulatory requirements. In this context, the Compensation Committee’s authority, duties and responsibilities are:
|
• |
To annually review the Company’s philosophy regarding executive compensation. |
|
• |
To periodically review market and industry data to assess the Company’s competitive position, and to retain any compensation consultant to be used to assist in the evaluation of directors’ and executive officers’ compensation. |
|
• |
To establish and approve the Company goals and objectives, and associated measurement metrics relevant to compensation of the Company’s executive officers. |
|
• |
To establish and approve incentive levels and targets relevant to compensation of the executive officers. |
|
• |
To annually review and make recommendations to the board to approve, for all principal executives and officers, the base and incentive compensation, taking into consideration the judgment and recommendation of the Chief Executive Officer for the compensation of the principal executives and officers. |
|
• |
To separately review, determine and approve the Chief Executive Officer’s applicable compensation levels based on the Committee’s evaluation of the Chief Executive Officer’s performance considering the Company’s and the individual goals and objectives. |
|
• |
To review for any related party employee situations, to ensure appropriate controls are implemented surrounding compensation changes, bonuses and performance reviews of the related party employee, and to participate in such controls as appropriate. |
|
• |
To periodically review and make recommendations to the board with respect to the compensation of directors, including board and committee retainers, meeting fees, equity-based compensation and such other forms of compensation as the Compensation Committee may consider appropriate. |
|
• |
To administer and annually review the Company’s incentive compensation plans and equity-based plans. |
|
• |
To review and make recommendations to the board regarding any executive employment agreements, any proposed severance arrangements or change in control and similar agreements/provisions, and any amendments, supplements or waivers to the foregoing agreements, and any perquisites, special or supplemental benefits. |
|
• |
To review and discuss with management, the Compensation Discussion and Analysis (CD&A), and determine the Committee’s recommendation for the CD&A’s inclusion in the Company’s annual report filed with the SEC on Form 10-K and proxy statement on Schedule 14A. |
|
• |
The Committee may, in its sole discretion, retain or obtain the advice of a compensation consultant, legal counsel or other adviser. |
|
• |
The Committee shall be directly responsible for the appointment, compensation and oversight of the work of any compensation consultant, legal counsel and other adviser retained by the Committee. The Company must provide for appropriate funding, as determined by the Committee, for payment of reasonable compensation to a compensation consultant, legal counsel or any other adviser retained by the Committee. |
|
• |
The Committee may select, or receive advice from, a compensation consultant, legal counsel or other adviser to the Committee, other than in-house legal counsel, only after taking into consideration the following factors: |
|
(i) |
the provision of other services to the Company by the person that employs the compensation consultant, legal counsel or other adviser; |
|
(ii) |
the amount of fees received from the Company by the person that employs the compensation consultant, legal counsel or other adviser, as a percentage of the total revenue of the person that employs the compensation consultant, legal counsel or other adviser; |
|
(iii) |
the policies and procedures of the person that employs the compensation consultant, legal counsel or other adviser that are designed to prevent conflicts of interest; |
|
(iv) |
any business or personal relationship of the compensation consultant, legal counsel or other adviser with a member of the Committee; |
|
(v) |
any stock of the Company owned by the compensation consultant, legal counsel or other adviser; and |
|
(vi) |
any business or personal relationship of the compensation consultant, legal counsel, other adviser or the person employing the adviser with an executive officer of the Company. |
|
• |
The Committee is not required to implement or act consistently with the advice or recommendations of the compensation consultant, legal counsel or other adviser to the Committee. |
Compensation Committee Members
The Compensation Committee of the board of directors is appointed by the board of directors to discharge the board’s responsibilities with respect to all forms of compensation of the Company’s executive officers, to administer the Company’s equity incentive plans and to produce an annual report on executive compensation for use in the Company’s Form 10-K and the proxy statement on Schedule 14A. At December 31, 2017, the Compensation Committee consists of two independent members of the board of directors, Messrs. Corey A. Lambrecht, and C. Stephen Cochennet, both of whom are ‘‘independent directors’’ within the meaning of Rule 5605(a) (2) of the NASDAQ Stock Market.
Committee Meetings
Our Compensation Committee meets formally and informally as often as necessary to perform its duties and responsibilities. The Compensation Committee held one formal meeting during fiscal 2017. On an as requested basis, our Compensation Committee receives and reviews materials prepared by management, consultants or committee members, in advance of each meeting. Depending on the agenda for the particular meeting, these materials may include, among other factors:
|
• |
minutes and materials from the previous meeting(s); |
|
• |
reports on year-to-date Company financial performance versus budget; |
|
• |
reports on progress and levels of performance of individual and Company performance objectives; |
|
• |
reports on the Company’s financial and stock performance versus a peer group of companies; |
|
• |
reports from the Committee’s compensation consultant regarding market and industry data relevant to executive officer compensation; |
|
• |
reports and executive compensation summary worksheets, which sets forth for each executive officer: current total compensation and incentive compensation target percentages, current equity ownership holdings and general partner ownership interest and current and projected value of each and all such compensation elements, including distributions and dividends therefrom, over a five-year period. |
Compensation Committee Charter
Our Compensation Committee Charter is posted on our website at www.CUIGlobal.com.
Compensation Committee Interlocks and Insider Participation
None of the members of the Company’s Compensation Committee is or has at any time during the last completed fiscal year been an officer or employee of the Company. None of the Company’s executive officers has served as a member of the board of directors, or as a member of the compensation or similar committee, of any entity that has one or more executive officers who served on the Company’s board of directors or Compensation Committee during the last completed fiscal year.
Compensation Committee Report
We have reviewed and discussed the Compensation Discussion and Analysis with management and based on our review and discussion with management, we have recommended to the board of directors that the Compensation Discussion and Analysis be included in the Company’s Annual Report on Form 10-K for the year ended December 31, 2017 and the proxy statement on Schedule 14A for the 2018 Annual Meeting of Shareholders.
|
Submitted by: |
Compensation Committee by |
|
Corey A. Lambrecht, Chairman |
|
|
C. Stephen Cochennet |
Item 11. Executive Compensation
Compensation Discussion and Analysis
General Philosophy
Our compensation philosophy is based on the premise of attracting, retaining and motivating exceptional leaders, setting high goals, working toward the common objectives of meeting the expectations of customers and stockholders and rewarding outstanding performance. Following this philosophy, in determining executive compensation, we consider all relevant factors, such as the competition for talent, our desire to link pay with performance, the use of equity to align executive interests with those of our stockholders, individual contributions, teamwork and performance, each executive’s total compensation package and internal pay equity. We strive to accomplish these objectives by compensating all employees with total compensation packages consisting of a combination of competitive base salary and incentive compensation.
Pay for Performance
At the core of our compensation philosophy is our strong belief that pay should be directly linked to performance. We believe in a pay for performance culture that places a significant portion of executive officer total compensation as contingent upon, or variable with, individual performance, Company performance and achievement of strategic goals including increasing shareholder value.
The performance based compensation for our executives may be in the form of (i) annual cash incentives to promote achievement of, and accountability for, shorter term performance plans and strategic goals and (ii) equity grants, designed to align the long-term interests of our executive officers with those of our shareholders, by creating a strong and direct link between executive compensation and shareholder return over a multiple year performance cycle. Long-term incentive equity awards are typically granted in restricted stock or stock options. These awards generally vest over a two to four-year period. This opportunity for share ownership was to provide incentive and retain key employees and align their interests with our long-term strategic goals.
Base Compensation to be Competitive within Industry
A key component of an executive’s total compensation base salary is designed to compensate executives commensurate with their respective level of experience, scope of responsibilities, sustained individual performance and future potential. The goal has been to provide for base salaries that are sufficiently competitive with other similar-sized companies, both regionally and nationally, to attract and retain talented leaders.
Compensation Setting Process
Management’s Role in the Compensation Setting Process
Management plays a significant role in the compensation-setting process. The most significant aspects of management’s role are:
|
• |
assisting in establishing business performance goals and objectives; |
|
• |
evaluating employee and Company performance; |
|
• |
CEO recommending compensation levels and awards for executive officers; |
|
• |
implementing the board approved compensation plans; and |
|
• |
assistance in preparing agenda and materials for the Committee meetings. |
The Chief Executive Officer generally attends the Committee meetings; however, the Committee also regularly meets in executive session. The Chief Executive Officer makes recommendations with respect to financial and corporate goals and objectives and makes non-CEO executive compensation recommendations to the Compensation Committee based on Company performance, individual performance and the peer group compensation market analysis. The Compensation Committee considers and deliberates on this information and in turn makes recommendations to the board of directors, for the board’s determination and approval of the executives’ and other members of senior management’s compensation, as necessary, including base compensation, short-term cash incentives and long-term equity incentives. For related party employee matters, appropriate personnel meet with the Compensation Committee to determine compensation and incentives and to review ongoing performance of the employee. The Chief Executive Officer’s performance and compensation is reviewed, evaluated and established separately by the Compensation Committee and ratified and approved by the board of directors.
Setting Compensation Levels
To evaluate whether total compensation is competitive and provides appropriate rewards to attract and retain talented leaders, as discussed above, we may rely on analyses of peer companies performed by independent compensation consultants and on other industry and occupation specific survey data available. Our general benchmark is to establish both base salary and total compensation for the executive officers at or near the compensation of peer group data, recognizing that a significant portion of executive officer total compensation should be contingent upon, or variable with, achievement of individual and Company performance objectives and strategic goals, as well as being variable with stockholder value. Further, while the objective for base salary is at that of peer group data, executives’ base salaries are designed to reward core competencies and contributions to the Company and may be increased above this general benchmark based on (i) the individual’s increased contribution over the preceding year; (ii) the individual’s increased responsibilities over the preceding year; and (iii) any increase in median competitive pay levels.
Setting Performance Objectives
The Company’s business plans and strategic objectives are generally presented by management annually and as needed to the board of directors. The board engages in an active discussion concerning the financial targets, the appropriateness of the strategic objectives and the difficulty in achieving the same. In establishing the compensation plan, our Compensation Committee then utilizes the primary financial objectives from the adopted business plan and operating cash flow as the primary targets for determining the executive officers’ short-term cash incentives and long-term equity incentive compensation. The Committee also establishes additional non-financial performance goals and objectives, the achievement of which is required for funding of a significant portion, approximately twenty five percent, of the executive officers’ incentive compensation. In 2017, these non-financial performance goals and objectives included among other factors, the continued growth of the Orbital Gas Systems, North America operations; continued integration of CUI-Canada; continued expansion within the global natural gas market, expansion of distribution and direct customer relationships through CUI Inc.; continued product development and new product introductions including the ICE technology and various VE technology-based sample systems; and general and administrative management responsibilities. In addition, such factors as revenue growth; new product adoption; market penetration; M&A activities; and investment banking transactions were and are considered in setting compensation levels.
Annual Evaluation
The Chief Executive Officer recommends the actual incentive award amounts for all other executives based on actual Company performance relative to the targets set as well as on individual performance and recommends the executives’ base salary levels. The Compensation Committee considers these recommendations generally following the end of each fiscal year in determining its recommendations to the board of directors for the final short-term cash incentive and long-term equity award amounts for each executive. Executive base salary levels are reviewed in accordance with their respective employment agreements. The actual incentive amounts awarded to each executive are ultimately subject to the discretion of the Compensation Committee and the board of directors.
Voting Results on Executive Compensation (Say-on-Pay) Advisory Vote
As required by Section 14A of the Exchange Act, under the Dodd–Frank Wall Street Reform and Consumer Protection Act, the Compensation Committee considers the prior year shareholder advisory vote on the compensation of the Named Executive Officers as appropriate for making compensation decisions. At the annual meeting of shareholders held December 1, 2017, more than 79% percent of the shareholders present and voting on the proposal approved, on an advisory basis, the compensation disclosed in the Company’s proxy statement for the meeting filed with the Securities and Exchange Commission on October 5, 2017. As a result, the Compensation Committee concluded that the Company's shareholders were supportive of the Company's executive compensation philosophy, policies and programs and the Compensation Committee will continue to reach out to shareholders regarding compensation matters. The Compensation Committee determined to continue such philosophy, policies and programs, with such updates and modifications as appropriate for changing circumstances.
Special Evaluation
Additional equity-based awards may also be granted to executives, as well as other employees, upon commencement of employment, promotions, for special performance recognition or for retention purposes, based on the recommendation of the Chief Executive Officer or Chief Financial Officer. In determining whether to recommend additional grants to an executive, the Chief Executive Officer typically considers the individual’s performance and any planned change in functional responsibility.
Elements of Executive Compensation
Total Compensation
Total compensation for our executives consists of three elements: (i) base salary; (ii) incentive cash award based on achieving specific performance targets as measured by revenues, cash flow and other objectives and (iii) equity incentive award, which is also performance based and may be paid out over a future period in the form of stock, restricted stock or stock purchase options. Base salaries are the value upon which both the incentive compensation percentage targets are measured against. For evaluation and comparison of overall compensation of the executives and to assist it in making its compensation decisions, the Compensation Committee reviews an executive compensation summary, which sets forth for each executive: current compensation and current equity ownership holdings as well as the projected value of each and all such compensation elements, including distributions and dividends therefrom. Also included in the summary are comparative performance numbers, specific milestones, strategic objectives, and other elements used to measure each executive's individual performance.
Base Salaries
Base salaries are designed to compensate executives commensurate with their respective level of experience, scope of responsibilities and to reward sustained individual performance and future potential. The goal has been to provide for base salaries that are sufficiently competitive with other similar-sized companies, both regionally and nationally, to attract and retain talented leaders.
Incentive Compensation
Incentive compensation is intended to align compensation with business objectives and performance and enable the Company to attract, retain and reward high quality executive officers whose contributions are critical to both the short and long-term success of the Company. The executives’ incentive awards are based upon three key performance metrics: (i) the Company’s earnings before interest, depreciation, taxes and amortization (EBIDTA); (ii) achievement of agreed-upon strategic and corporate performance goals; and/or (iii) existing Employment Agreement.
The strategic and corporate performance goals are not intended to be a specific agreed-upon goal, but rather a general objective. Management and the board of directors discuss these factors and set objectives that are dynamic and change periodically. In setting these periodic goals, the board of directors discusses with management the nature of the objective and management’s proposed method of achieving the goal. These goals change throughout the operational process because of changing dynamics such as economic conditions, current success of marketing, availability of materials, availability of funding and overall momentum toward achieving the goal.
Incentive Plan Compensation
Incentive awards are typically paid out in cash, restricted common stock or option awards. The incentive award targets for the executives are established at the beginning of the year, generally, as a percentage of their base salary and the actual awards are determined in the following year at a board of directors’ meetings based on actual Company performance relative to established goals and objectives, as well as on evaluation of the executive’s relevant departmental and individual performance during the past year. In many instances the award of restricted common stock and stock options vests over a multi-year term in equal periodic tranches. The award of restricted common stock purchased through options generally, although not in every instance, vests immediately upon exercise of the option and generally has a validity of up to ten years and a per share purchase price of no less than the fair market value of our common stock on the date of grant. The awards are intended to serve as a means of incentive compensation for performance.
Retirement Plans
Our wholly owned subsidiaries, CUI Inc. and Orbital Gas Systems, North America, Inc. maintain a 401(k) plan. The Company 401(k) retirement savings plan allows employees to contribute to the plan after they have completed 60 days of service and are 18 years of age. The Company matches the employee’s contribution up to 6% of total compensation. Total employer contributions, net of forfeitures were $0.4 million, $0.4 million, and $0.4 million for 2017, 2016 and 2015, respectively.
Our wholly owned subsidiary, Orbital Gas Systems Ltd., operates a defined contribution retirement benefit plan for employees who have been employed with the company at least 12 months and who chose to enroll in the plan. Orbital contributes to its plan the equivalent of 5% of the employee’s salary and the employee has the option to contribute pre-tax earnings. Orbital made total employer contributions of $0.2 million, $0.3 million and $0.3 million during 2017, 2016 and 2015, respectively.
Change in Control Agreements
Our executives are awarded protection upon a change in control as specifically provided in their employment contracts. The Chief Executive Officer contract includes a provision for a two-year severance package upon termination. The Chief Financial Officer and Chief Operations Officer contracts include a provision for an eighteen-month severance package upon termination.
Perquisites
The Company does not provide for any perquisites or any other benefits for its senior executives that are not generally available to all employees.
Employment Agreements
During fiscal year 2017, four executive officers were employed under employment agreements. Those executive officers are:
|
• |
Chief Executive Officer and General Counsel; |
|
• |
Chief Financial Officer of CUI Global, Inc. and Chief Operating Officer of the Energy Division; |
|
• |
President of CUI Inc., and Chief Operating Officer of the Power and Electromechanical Division; and |
|
• |
President of Orbital Gas Systems Ltd. |
To see the material terms of each named executive officer’s employment agreement, please see the footnotes to the Summary Compensation Table.
Executive Salary and Bonus Performance Assessment Considerations
Bonuses for certain executive officers and employees of CUI Global and subsidiaries are calculated based on historical financial and non-financial information and accomplishments based on an ongoing review and approval by the Compensation Committee and the Chief Executive Officer. Accordingly, the Company accrues bonuses through components calculated on prior data. This review also considers ongoing performance and incentives for those officers and employees to increase their performance. As such, bonuses calculated based on fiscal 2017 data are not necessarily earned or owed to the employees as of December 31, 2017 and there is no legal right by the employees to receive such bonuses upon either termination by the Company or voluntary termination, unless they have been approved based on the subsequent review of subjective items.
The performance assessment considerations for William J. Clough, Esq. in his capacity as Chief Executive Officer and General Counsel of CUI Global, Inc. and subsidiaries, include his successful management and implementation of acquisition and growth strategy, both domestically and internationally, that resulted in the March 2015 asset acquisition of Tectrol, Inc., a Canadian electronics company by CUI Inc. and the highly lucrative February 2016 purchase order from Europe’s largest natural gas transmission company for our GasPT product. This purchase order culminates several years of Mr. Clough’s personal effort. The Tectrol asset purchase entailed complex labor union negotiations and ongoing management support. Mr. Clough continues to expand new technology development, implementation, branding and sales by strategically expanding the VE Technology product recognition through adoption of mercury sampling and thermowells. As a primary initiator of the Company’s growth strategy, he engineered the Company’s launch of Orbital Gas Systems, North America, Inc. as a unified international GasPT and VE Technology sales headquarters. Mr. Clough continues to expand investor relations and strengthen investment banking relationships through regular investor meetings and conferences. As Corporate General Counsel, he is “hands on” in his management of corporate governance and legal issues, addressing employee concerns, providing personal direction and oversight of drafting fully revised and restated corporate bylaws and regularly communicating with the directors pertaining to various corporate matters as they arise.
During 2017, Mr. Clough’s employment contract was extended through December 31, 2018 and allows for performance and discretionary bonuses. During 2017, he earned a performance and discretionary cash bonus of one hundred percent (100%) of his annual base salary based on 2016 performance metrics.
The performance assessment considerations for Daniel N. Ford, Chief Financial Officer of CUI Global, Inc. and subsidiaries and Chief Operating Officer of the Energy Division include his successful management of financial resources for CUI Global and subsidiaries including investments, corporate portfolio, cash and debt positions. Mr. Ford’s daily duties include ongoing development and oversight of global banking relationships and overall financial performance oversight and management of the accounting staff of CUI Global, Inc. and all subsidiaries. In 2016, Mr. Ford added the responsibility of Chief Operating Officer for the Energy Division including direct management of the Division's leadership teams as well as coordinating ongoing activities, planning and initiatives to continue growth within this division on a global basis. Mr. Ford efficiently communicates with the board pertaining to company activities, audit results and findings, growth and acquisition strategy and investment tactics. Mr. Ford oversees SEC filing compliance, internal reporting matters, and works directly with internal and external audit and tax firms. As an integral part of this management, it is necessary that he continue to be up to date on all current accounting and SEC regulatory standards such as ICFR and SOX. Mr. Ford works closely with Mr. Clough regarding financial reporting, the Energy Division activities, investor management and investor relations activities. During 2017 Mr. Ford’s employment contract was extended through December 31, 2018 and allows for performance and discretionary bonuses. During 2017, Mr. Ford's base pay was raised to $320 thousand per annum and he earned a performance and discretionary cash bonus of ninety percent (90%) of his annual base salary based on 2016 performance metrics.
The performance assessment considerations for Matthew M. McKenzie, President of CUI Inc. are directed toward corporate operations for the Power and Electromechanical Division. Mr. McKenzie manages the daily operations of CUI Inc., CUI Japan, and CUI-Canada, Inc., the entity that received the assets purchased from Tectrol in March 2015. He continues to direct and manage the integration of CUI-Canada and has been instrumental in the acquisition and development of the ICE technology. Mr. McKenzie handles distributor contract procurement and contract management and oversight of key contracts with Digi-Key Electronics, Mouser Electronics, Future Electronics, Arrow Electronics and many others. Through Mr. McKenzie’s efforts and oversight, CUI Inc.’s power and electromechanical product sales, bookings, deliveries and revenue continue to perform and are well set for future growth opportunities. The Power and Electromechanical Division that Mr. McKenzie manages requires his oversight of employees, hiring specialized technical individuals and applicable job descriptions. Mr. McKenzie successfully managed the construction of our research and development facility and implementation of our ICE product development project. During 2017 Mr. McKenzie’s employment contract was extended through December 31, 2018 and allows for performance and discretionary bonuses. During 2017, he earned a performance and discretionary cash bonus of fifty percent (50%) of his annual base salary based on 2016 performance metrics.
The performance assessment considerations for Paul D. White, President of Orbital Gas Systems, Limited, include his performance during the time from July 2017 until December 1, 2017 when Mr. White served in a consulting role as President of Orbital Gas Systems, Limited. In 2017, Mr. White went from serving as one of the Company’s independent directors to serving as president of one of the Company’s key subsidiaries, while continuing to serve on the board of directors. Mr. White works closely with Mr. Ford and Mr. Clough on Energy Division activities. During 2017, Mr. White entered into a three-year employment contract through December 2020 that allows for performance and discretionary bonuses. During 2017, Mr. White’s initial base pay was set at $225 thousand, with increases to $250 thousand and $275 thousand in years 2 and 3, respectively. In addition, he earned a sign-on bonus of $30 thousand.
Pay Ratio Disclosure Rule
In August 2015, pursuant to a mandate of the Dodd-Frank Wall Street Reform and Consumer Protection Act (the “Dodd - Frank Act”), the Securities and Exchange Commission (“SEC”) adopted a rule requiring annual disclosure of the ratio of the median employee’s annual total compensation to the total annual compensation of the principal executive officer (‟PEO”). The Company’s PEO is Mr. William Clough. The purpose of the new required disclosure is to provide a measure of the equitability of pay within the organization. The Company believes its compensation philosophy and process yield an equitable result and is presenting such information in compliance with the required disclosure as follows:
|
Median Employee total annual compensation |
$ | 46,397 | ||
|
Mr. Clough ("PEO") total annual compensation |
$ | 1,066,676 | ||
|
Ratio of PEO to Median Employee Compensation |
23:1 |
|||
When determining the median employee, we included the following compensation in our calculations:
|
• |
Salary or wages |
|
• |
Bonuses |
|
• |
Stock awards |
|
• |
Other compensation including health insurance benefits, disability insurance benefits, life insurance benefits and 401(k) match benefits provided by the Company but excluding health and pension benefits provided by certain governments. |
Mr. Clough’s compensation can be reviewed in more detail in the Summary Compensation Table and includes the same benefits that were included in the calculation of the median employee’s compensation.
We elected to exclude our CUI-Japan sales office from the calculation due to there being less than 5% of the total number of employees there (4 employees). We elected to include 5 contract employees in determining the median employee.
Full and part-time employee compensation for employees that were hired during the year was annualized based on the average compensation they received during the period they were employed. The number of employees was determined as of December 31, 2017 when there were 334 total employees (Excluding CUI-Japan and including 5 contract employees), 91 of which are considered US employees and 243 of which were considered non-US employees.
Summary Compensation Table
The following table sets forth the compensation paid and accrued to be paid by the Company for the fiscal years 2017, 2016 and 2015 to the Company’s Chief Executive Officer, Chief Financial Officer and President of CUI Inc.
Summary Compensation Table
|
Stock |
Option |
Non- |
||||||||||||||||||||||||||
|
|
Salary |
Awards |
(9) |
Plan |
All Other |
Total |
||||||||||||||||||||||
|
Name and Principal Position |
Year |
($) | ($) | ($) |
Compensation ($) (10) |
Compensation ($) |
$ | |||||||||||||||||||||
|
William J. Clough, CEO/ |
2017 |
538,135 | (2) | — | — | 497,672 | (2) | 30,869 | 1,066,676 | |||||||||||||||||||
|
President/Counsel/ |
2016 |
517,438 | (2) | — | — | 575,751 | (2) | 24,801 | 1,117,990 | |||||||||||||||||||
|
Director (1) |
2015 |
497,536 | (2) | — | — | 443,802 | (2) | 20,882 | 962,220 | |||||||||||||||||||
|
Daniel N. Ford, CFO |
2017 |
320,000 | (4) | — | — | 244,888 | (4) | 38,532 | 603,420 | |||||||||||||||||||
|
COO - Energy Division (3) |
2016 |
281,216 | (4) | — | — | 260,650 | (4) | 37,153 | 579,019 | |||||||||||||||||||
|
2015 |
270,400 | (4) | — | — | 217,500 | (4) | 36,782 | 524,682 | ||||||||||||||||||||
|
Matthew M. McKenzie, |
2017 |
292,465 | (6) | — | — | 107,105 | (6) | 37,848 | 437,418 | |||||||||||||||||||
|
COO - PEM Division/President |
2016 |
281,216 | (6) | — | — | 225,117 | (6) | 36,508 | 542,841 | |||||||||||||||||||
|
of CUI, Inc./Director (5) |
2015 |
270,400 | (6) | — | — | 325,500 | (6) | 36,137 | 632,037 | |||||||||||||||||||
|
Paul D. White, |
2017 |
114,759 | (8) | 49,991 | — | 30,000 | (8) | — | 194,500 | |||||||||||||||||||
|
President of Orbital Gas Systems, Ltd., Director (7) |
2016 |
50,000 | (8) | 67,275 | — | — | (8) | — | 117,275 | |||||||||||||||||||
|
2015 |
29,253 | (8) | 27,897 | — | — | (8) | — | 57,150 | ||||||||||||||||||||
Footnotes:
|
1. |
Mr. Clough joined the Company on September 1, 2005. Effective September 13, 2007, Mr. Clough was appointed CEO/President of CUI Global and Chief Executive Officer of all wholly owned subsidiaries of the Company. |
|
2. |
Mr. Clough is employed under a multi-year employment contract with the Company, which was extended to run to and through December 31, 2018. Said contract provides, in relevant part, for an initial annual salary of $460 thousand, which became effective July 1, 2013 and includes bonus provisions for each calendar year up to one hundred twenty-five percent of base salary to be based on performance objectives, goals and milestones for each calendar year including revenue performance and entitles Mr. Clough to a two-year severance package and an annual 4% cost of living adjustment (2017 salary of $538 thousand). Bonuses are approved quarterly based on various performance-related factors and an evaluation of current performance and includes a discretionary bonus of up to twenty-five percent of salary based upon the reasonable judgment of the compensation committee. Employee has the ability to earn a larger bonus based on the performance criteria set forth and the reasonable judgment and discretion of the compensation committee. All such bonus payments shall be paid to Mr. Clough in equal monthly installments following the period in which the bonus is earned and shall be paid on the 15th day of each month. At December 31, 2017, 2016, and 2015, there was an accrual of $33 thousand, $29 thousand and $4 thousand, respectively, for compensation owed to Mr. Clough. |
|
3. |
Mr. Ford joined the Company May 15, 2008 and serves as Chief Financial Officer of CUI Global and subsidiaries, and Chief Operating Officer of the Energy Division. |
|
4. |
Mr. Ford is employed under a three-year employment contract with the Company, which was extended to December 31, 2018 and provides, in relevant part, for an initial annual salary of $250 thousand effective July 1, 2013 (2017 salary of $320 thousand), an annual 4% cost of living adjustment, an eighteen-month severance package and bonus provisions up to one hundred twenty-five percent of base salary to be based on performance objectives, goals and milestones for each calendar year including revenue performance. The bonus includes a discretionary bonus of up to twenty-five percent of salary based upon the reasonable judgment of the compensation committee. Employee has the ability to earn a larger bonus based on the performance criteria set forth and the reasonable judgment and discretion of the compensation committee. Bonuses are approved quarterly based on the above factors and an evaluation of current performance. All such bonus payments shall be paid to Mr. Ford in equal monthly installments following the period in which the bonus is earned and shall be paid on the 15th day of each month. At December 31, 2017, 2016 and 2015 there was an accrual of $22 thousand, $19 thousand and $18 thousand, respectively, for compensation owed to Mr. Ford. |
|
5. |
Mr. McKenzie joined the Company May 15, 2008 and serves as President of CUI Inc. and Chief Operating Officer of the Power and Electromechanical Division. |
|
6. |
Mr. McKenzie is employed under a three-year employment contract with the Company, which was extended to December 31, 2018 and provides, in relevant part, for an initial annual salary of $250 thousand effective July 1, 2013, an annual 4% cost of living adjustment (2017 salary of $292 thousand), an eighteen-month severance package and bonus provisions up to one hundred twenty-five percent of base salary to be based on performance objectives, goals, and milestones for each calendar year, including revenue performance in the Power and Electromechanical segment. The bonus includes a discretionary bonus of up to twenty-five percent of salary based upon the reasonable judgment of the compensation committee. Employee has the ability to earn a larger bonus based on the performance criteria set forth and the reasonable judgment and discretion of the compensation committee. Bonuses are approved quarterly based on the above factors and an evaluation of current performance. All such bonus payments shall be paid to Mr. McKenzie in equal monthly installments following the period in which the bonus is earned and shall be paid on the 15th day of each month. At December 31, 2017, 2016 and 2015 there was an accrual of $12 thousand, $5 thousand and $23 thousand, respectively, for compensation owed to Mr. McKenzie. |
|
7. |
Mr. White served as President of Orbital Gas Systems, Ltd. since July 2017, initially in a consulting role. Upon accepting the permanent role of President of Orbital Gas Systems, Ltd. effective December 1, 2017, Mr. White ceased to be independent as a director of the Company. |
|
8. |
Mr. White is employed under a three-year employment contract with the Company through December 1, 2020 and provides, in relevant part, for an initial annual salary of $225 thousand in year 1 along with a $30 thousand one-time signing bonus, and increases to $250 thousand and $275 thousand in years 2 and 3, respectively, a severance of the Executive’s salary for the remainder of his severance term upon termination, bonus provisions to be based on performance objectives, goals, and milestones for each calendar year, including revenue performance at Orbital-UK. The bonus includes a discretionary bonus of up to twenty-five percent of salary based upon the reasonable judgment of the compensation committee. Employee has the ability to earn a larger bonus based on the performance criteria set forth and the reasonable judgment and discretion of the compensation committee. Bonuses are approved on an ongoing basis based on the above factors and an evaluation of current performance. All such bonus payments shall be paid to Mr. White following the period in which the bonus is earned. During 2017, Mr. White received $50 thousand of cash compensation and $50 thousand of stock awards for his services as an independent director. Further, during his time during the year ended December 31, 2017 serving as a consultant as interim President of Orbital Gas Systems, Limited, Mr. White received $46 thousand of compensation. At December 31, 2017, there was an accrual of $40 thousand for compensation owed to Mr. White. Mr. White's cash and equity compensation shown for 2016 and 2015 was payment for his services as an independent director of CUI Global, Inc for those years. |
|
9. |
As of December 31, 2017, William J. Clough, CEO/Director held 558,085 outstanding options, Daniel N. Ford, CFO held 137,794 outstanding options, Matthew M. McKenzie, COO/Director held 112,796 outstanding options, which includes shares owned by his spouse, and Paul D. White, President of Orbital-UK/Director held 7,500 options. |
|
10. |
All other compensation includes health care and 401(k) matching benefits. |
2017 Grants of Plan-Based Awards
|
Estimated Future Payouts Under Non-Equity Incentive Plan Awards (1) |
||||||||||||||
|
Name |
Grant Date |
Threshold |
Target |
Maximum |
||||||||||
| ($) | ($) | ($) | ||||||||||||
|
William J. Clough |
Non-equity award |
— | 269,068 | 672,669 | ||||||||||
|
Daniel N. Ford |
Non-equity award |
— | 160,000 | 400,000 | ||||||||||
|
Matthew M. McKenzie |
Non-equity award |
— | 146,233 | 365,581 | ||||||||||
|
Paul D. White |
Non-equity award |
— | — | — | ||||||||||
(1) These columns show the possible payouts for each named executive officer under the Incentive Plan for 2017 based on the goals set in 2017. Additional information is included in the Compensation Discussion and Analysis, and detail regarding actual awards under the Incentive Plan is reported in the Summary Compensation Table.
Outstanding Equity Awards at Fiscal Year-End
The following table sets forth the outstanding equity awards at December 31, 2017 to each of the named executive officers:
|
OUTSTANDING EQUITY AWARDS AT FISCAL YEAR END |
|||||||||
|
Name |
Number of Securities Underlying Unexercised Options (#) Exercisable |
Option Exercise Price ($) |
Option Expiration |
||||||
|
Daniel N. Ford (1) |
12,598 | 7.50 |
1/1/2019 |
||||||
|
Matthew M. McKenzie (1) |
15,100 | 7.50 |
1/1/2019 |
||||||
|
Matthew M. McKenzie (1) |
8,100 | 7.50 |
1/1/2019 |
||||||
|
William J. Clough (2) |
5,422 | 9.00 |
10/11/2020 |
||||||
|
Daniel N. Ford (2) |
12,598 | 9.00 |
10/11/2020 |
||||||
|
Matthew M. McKenzie (2) |
15,100 | 9.00 |
10/11/2020 |
||||||
|
Matthew M. McKenzie (2) |
3,300 | 9.00 |
10/11/2020 |
||||||
|
William J. Clough (3) |
19,363 | 4.56 |
4/16/2022 |
||||||
|
William J. Clough (3) |
3,300 | 4.56 |
4/16/2022 |
||||||
|
Daniel N. Ford (3) |
12,598 | 4.56 |
4/16/2022 |
||||||
|
Matthew M. McKenzie (3) |
15,100 | 4.56 |
4/16/2022 |
||||||
|
Matthew M. McKenzie (3) |
3,300 | 4.56 |
4/16/2022 |
||||||
|
William J. Clough (4) |
330,000 | 6.00 |
9/21/2022 |
||||||
|
William J. Clough (5) |
200,000 | 6.25 |
6/24/2023 |
||||||
|
Daniel N. Ford (5) |
100,000 | 6.25 |
6/24/2023 |
||||||
|
Matthew M. McKenzie (5) |
50,000 | 6.25 |
6/24/2023 |
||||||
|
Paul D. White (6) |
7,500 | 8.15 |
8/31/2024 |
||||||
Footnotes:
|
1. |
Effective January 1, 2009, Mr. Ford and Mr. McKenzie received fully vested bonus options to purchase 12,598, and 15,100 common shares, respectively, within ten years from date of issuance, at a price of $7.50 per share. Also effective January 1, 2009, for service as a director of the Company, Mr. McKenzie received an option to purchase 4,800 common shares, within ten years from date of issuance, at a price of $7.50, that vested over four years, 25% after the first year and in equal monthly installments over the balance of the four year term and an option to purchase 3,300 common shares, within ten years from date of issuance, at a price of $7.50 per share that vested one year after issuance. |
|
2. |
Effective October 11, 2010, Mr. Clough, Mr. Ford and Mr. McKenzie received bonus options to purchase 37,177 (5,422 remaining outstanding), 12,598 and 15,100 common shares, respectively, within ten years from date of issuance, at a price of $9.00 per share that vested over 4 years: 25% at year one and thereafter in equal monthly installments. Additionally, effective October 11, 2010, for service as a director of the Company, Mr. McKenzie received an option to purchase 3,300 common shares within ten years from date of issuance at a price of $9.00 per share that vested one year after issuance. |
|
3. |
Effective April 16, 2012, Mr. Clough, Mr. Ford and Mr. McKenzie received bonus options to purchase 37,177 (19,363 remaining outstanding), 12,598, and 15,100 common shares, respectively, within ten years from date of issuance, at a price of $4.56 per share that vested over 4 years: 25% at year one and thereafter in equal monthly installments. Additionally, effective April 16, 2012, for their service as directors of the Company, Mr. Clough and Mr. McKenzie each received an option to purchase 3,300 common shares, within ten years from date of issuance, at a price of $4.56 per share that vested one year after issuance. |
|
4. |
Effective September 21, 2012, under the terms of his contract extension, Mr. Clough received a bonus option to purchase 330,000 common shares, within ten years from date of issuance, at a price of $6.00 per share that vested in equal monthly installments over 4 years. |
|
5. |
Effective June 24, 2013, Mr. Clough, Mr. Ford and Mr. McKenzie received bonus options to purchase 200,000, 100,000 and 50,000 common shares, respectively, within ten years from date of issuance, at a price of $6.25 per share that vested one third per year over 3 years. |
|
6. |
Effective August 31, 2014, Mr. White received, for service as Director, an option to purchase 7,500 common shares within ten years from date of issuance at a price of $8.15 per share that vested one year after issuance. |
Director Compensation
For 2017, each of our directors received the following compensation pursuant to our director compensation plan:
Non-employee directors received annual compensation of $100,000.
|
• |
The $100,000 annual compensation for non-employee directors is issued in the form of $50,000 cash compensation and $50,000 common stock calculated by using the Nasdaq Stock Market closing price per share on the date of issuance. |
|
• |
At the election of each director, all or any portion of the cash compensation may be converted to stock purchase options calculated by using the strike price of ten percent (10%) above the Nasdaq Stock Market closing price per share on the date of grant. |
|
• |
At the election of each director, all or any portion of the cash compensation may be converted to stock calculated by using the Nasdaq Stock Market closing price per share on the date of conversion. |
The following table sets forth the compensation of the non-employee directors for the fiscal year ended December 31, 2017:
|
Fees |
Non- |
|||||||||||||||||||||||||||
|
earned or |
Equity Incentive |
Nonqualified Deferred |
All |
|||||||||||||||||||||||||
|
paid in Cash |
Stock Awards |
Option Awards |
Plan Compensation |
Compensation Earnings |
Other Compensation |
Total |
||||||||||||||||||||||
| Name | ($) | ($) | ($) | ($) | ($) | ($) | ($) | |||||||||||||||||||||
|
C. Stephen Cochennet (1) |
$ | — | $ | — | $ | — | $ | — | $ | — | $ | — | $ | — | ||||||||||||||
|
Corey A. Lambrecht, Director |
50,009 | 49,991 | — | — | — | — | 100,000 | |||||||||||||||||||||
|
Thomas A. Price, Director |
50,009 | 49,991 | — | — | — | — | 100,000 | |||||||||||||||||||||
|
Sean P. Rooney, Director |
50,009 | 49,991 | — | — | — | — | 100,000 | |||||||||||||||||||||
Footnotes:
|
(1) |
Mr. Cochennet was appointed to the Board of Directors in December 2017 and will receive director compensation beginning fiscal year 2018. |
Item 12. Security Ownership of Certain Beneficial Owners and Management and Related Stockholder Matters
Security Ownership of Certain Beneficial Owners and Management
The following table sets forth certain information regarding beneficial ownership of our voting shares as of December 31, 2017 by: (i) each shareholder known by us to be the beneficial owner of 5% or more of the outstanding voting shares, (ii) each of our directors and executives and (iii) all directors and executive officers as a group. Except as otherwise indicated, we believe that the beneficial owners of the voting shares listed below, based on information furnished by such owners, have sole investment and voting power with respect to such shares, subject to community property laws where applicable. Shares of common stock issuable upon exercise of options and warrants that are currently exercisable or that will become exercisable within 60 days of December 31, 2017 have been included in the table.
No shares of preferred stock are outstanding at the date of this report.
Beneficial Interest Table
|
Name and Address of Beneficial Owner (1) |
Number of Securities Owned |
Percentages of Shares Beneficially Owned (2) |
||||||
|
William J. Clough (3) |
620,751 | 2.14 |
% |
|||||
|
C. Stephen Cochennet (4) |
9,545 | * | ||||||
|
Daniel N. Ford (5) |
189,848 | * | ||||||
|
Corey A. Lambrecht (6) |
58,119 | * | ||||||
|
Matthew M. McKenzie (7) |
123,263 | * | ||||||
|
Thomas A. Price (8) |
121,488 | * | ||||||
|
Sean P. Rooney (9) |
75,946 | * | ||||||
|
Paul D. White (10) |
50,727 | * | ||||||
|
First Eagle Investment Management, LLC, |
||||||||
|
1345 Avenue of the Americas, New York, NY 10105 |
3,755,542 | 13.22 |
% |
|||||
|
Heartland Advisors, Inc. |
||||||||
|
789 North Water Street, Milwaukee, WI 53202 |
2,407,523 | 8.48 |
% |
|||||
|
Royce & Associates, LP |
||||||||
|
745 Fifth Avenue, New York, NY 10151 |
1,621,107 | 5.71 |
% |
|||||
|
Officers, Directors, Executives as Group |
1,249,687 | 4.35 |
% |
|||||
Footnotes:
|
1. |
Except as otherwise indicated, the address of each beneficial owner is c/o CUI Global, Inc., 20050 SW 112th Avenue, Tualatin, Oregon 97062. |
|
2. |
Calculated on the basis of 28,406,856 shares of common stock issued and outstanding at December 31, 2017 except that shares of common stock underlying options exercisable within 60 days of the date hereof are deemed to be outstanding for purposes of calculating the beneficial ownership of securities of such holder of options and shares. A * denotes less than 1 percent beneficially owned. |
|
3. |
Mr. Clough’s common stock includes vested options to purchase 558,085 common shares. Mr. Clough is a Director, Chairman and Chief Executive Officer/President of CUI Global, Inc. |
|
4. |
Mr. Cochennet was appointed to the board of directors in December 2017. |
|
5. |
Mr. Ford’s shares include vested options to purchase 137,794 common shares. Mr. Ford is the Chief Financial Officer of CUI Global, Inc. and Chief Operating Officer for the Energy Division. |
|
6. |
Mr. Lambrecht’s shares include vested options to purchase 24,700 common shares. Mr. Lambrecht is a Director. |
|
7. |
Mr. McKenzie’s shares include vested options to purchase 112,796 common shares, which includes an option to purchase 2,796 common shares owned by his spouse. Mr. McKenzie is a Director and Chief Operating Officer of the Power and Electromechanical Segment and President of CUI Inc. |
|
8. |
Mr. Price’s shares include vested options to purchase 24,700 common shares. Mr. Price is a Director. |
|
9. |
Mr. Rooney’s shares include vested options to purchase 45,087 common shares. Mr. Rooney is a Director. |
|
10. |
Mr. White’s shares include vested options to purchase 7,500 common shares. Mr. White is a Director and President of Orbital-UK. |
We relied upon Section 4(2) of the Securities Act of 1933 as the basis for an exemption from registration for the issuance of the above securities.
Employee Equity Incentive Plans
At December 31, 2017, the Company had outstanding the following equity compensation plan information:
|
Number of securities to be issued upon exercise of outstanding options, warrants and rights |
Weighted-average exercise price of outstanding options warrants and rights |
Future issuance under equity compensation plans (excluding securities reflected in column (a) |
||||||||||
|
Plan Category |
(a) |
(b) |
(c) |
|||||||||
|
Equity compensation plans approved by security holders |
36,915 | $ | 5.53 | 1,325,078 | ||||||||
|
Equity compensation plans not approved by security holders |
927,265 | 6.35 | 201,361 | |||||||||
| 964,180 | $ | 6.32 | 1,526,439 | |||||||||
Equity Compensation Plans Approved by Shareholders
On May 16, 2008 the Company’s board of directors adopted the 2008 Equity Incentive Plan and authorized 1,500,000 shares of Common Stock to fund the Plan. At the 2008 Annual Meeting of Shareholders the Equity Incentive Plan was approved by the Company shareholders. At the 2009 Annual Meeting of Shareholders the shareholders approved an amendment to the 2008 Equity Incentive Plan to increase the number of common shares issuable under the plan from 1,500,000 to 3,000,000. These shares have been registered under Form S-8.
The 2008 Equity Incentive Plan is intended to: (a) provide incentive to employees of the Company and its affiliates to stimulate their efforts toward the continued success of the Company and to operate and manage the business in a manner that will provide for the long-term growth and profitability of the Company; (b) encourage stock ownership by employees, directors and independent contractors by providing them with a means to acquire a proprietary interest in the Company by acquiring shares of stock or to receive compensation, which is based upon appreciation in the value of Stock; and (c) provide a means of obtaining and rewarding employees, directors, independent contractors and advisors.
The 2008 Equity Incentive Plan provides for the issuance of incentive stock options (ISOs) and Non-Statutory Options (NSOs) to employees, directors and independent contractors of the Company. The Board shall determine the exercise price per share in the case of an ISO at the time an option is granted and such price shall be not less than the fair market value or 110% of fair market value in the case of a ten percent or greater stockholder. In the case of an NSO, the exercise price shall not be less than the fair market value of one share of stock on the date the option is granted. Unless otherwise determined by the Board, ISOs and NSOs granted under the both plans have a maximum duration of ten years.
Equity Compensation Plans Not Approved by Shareholders
In January 2009 the Company board of directors received and approved a written report and recommendations of the Compensation Committee, which included a detailed executive equity compensation report and market analysis and the recommendations of Compensia, Inc., a management consulting firm that provides executive compensation advisory services to compensation committees and senior management of knowledge-based companies. The Compensation Committee used the report and analysis as a basis for its formal written recommendation to the board. Pursuant to a board resolution the 2009 Equity Incentive Plan (Executive), a Non-Qualified Stock Option Plan, was created and funded with 4,200,000 shares of $0.001 par value common stock. The Compensation Committee was appointed as the Plan Administrator to manage the plan.
On October 11, 2010, the board of directors authorized an additional 3,060,382 options under the 2009 Equity Incentive Plan (Executive) that were to be granted at post-reverse split quantities. On September 21, 2012, CUI Global authorized an additional 330,000 options under the 2009 Equity Incentive Plan (Executive).
The 2009 Equity Incentive Plan (Executive) provides for the issuance of stock options to attract, retain and motivate executive and management employees and directors and to encourage these individuals to acquire an equity interest in the Company, to make monetary payments to certain management employees and directors based upon the value of the Company’s stock and to provide these individuals with an incentive to maximize the success of the Company and further the interest of the shareholders. The 2009 Plan provides for the issuance of Incentive Non-Statutory Options. The Administrator of the plan is authorized to determine the exercise price per share at the time the option is granted, but the exercise price shall not be less than the fair market value on the date the option is granted. Stock options granted under the 2009 Plan have a maximum duration of ten years.
The Company has outstanding at December 31, 2017, the following options issued under equity compensation plans not approved by security holders:
|
• |
During 2009, the Company issued under the 2009 Equity Incentive Plan (Executive) to officers and directors options to purchase restricted common stock at $7.50 per share as follows: 85,009 fully vested options, 28,800 options that vest over four years, 25% at the end of year one and thereafter in equal monthly installments; and 19,800 options that fully vested one year after the date of grant. Of these 2009 grants, 71,196 remain outstanding and fully vested at December 31, 2017. |
|
• |
During 2010, the Company issued options to purchase restricted common stock at $9.00 per share to officers and directors as follows: 19,800 options that vest one year after the October 11, 2010 grant date and 82,213 options that vest over four years, 25% at one year after the grant date, thereafter in equally monthly installments. Of these 2010 grants, 54,621 remain outstanding and fully vested at December 31, 2017. |
|
• |
During 2012, the Company granted options to purchase restricted common stock at $4.56 per share to officers and directors as follows: 19,800 options that vest one year after the April 16, 2012 grant date; 64,875 options that vest over four years, 25% at one year after the grant date, thereafter in equal monthly installments, and 330,000 options to purchase restricted common stock at $6.00 per share were granted to an officer that vest in equal monthly installments over the course of forty-eight consecutive months beginning September 2012. Of these 2012 grants, 393,561 remain outstanding and fully vested at December 31, 2017. |
|
• |
During 2013, the Company issued 350,000 options to purchase restricted common stock at $6.25 per share to three officers as follows: one third that vest one year after the June 24, 2013 grant date, one third that vest two years after the grant date and the balance that vest three years after the grant date. At December 31, 2017, 350,000 of these 2013 granted options are outstanding and fully vested. |
|
• |
During 2014, the Company issued options to purchase 10,000 shares of restricted common stock at a price of $6.92 per share to each board member who is not an employee of the Company. The options vested in twelve equal installments during 2014. The Company issued options to purchase 42,890 restricted shares of common stock at a price of $6.92 per share to two board members, who chose to receive a portion of their annual board compensation in the form of equity. The Company granted options to purchase 7,500 restricted shares of common stock at a price of $8.15 per share to each of the two newly elected directors that vested August 31, 2015. Of these 2014 options grants, 57,887 options are outstanding and fully vested at December 31, 2017. |
The description of the Company’s capital stock does not purport to be complete and is subject to and qualified by its Articles of Incorporation, Bylaws, and amendments thereto and by the provisions of applicable Colorado law. The Company’s transfer agent is Computershare Trust Company, Inc., 350 Indiana Street, Suite 800, Golden, Colorado 80401.
Item 13. Certain Relationships and Related Transactions and Director Independence
The Board of Directors is responsible for the review and approval of all related party transactions. Although the Board does not have written policies and procedures with respect to the review of related party transactions, we intend that any such transactions will be reviewed by the Board of Directors or one of its committees, which will consider all relevant facts and circumstances and will consider, among other factors:
|
• |
the material terms of the transaction; |
|
• |
the nature of the relationship between the Company and the related party; |
|
• |
the significance of the transaction to the Company; and |
|
• |
whether or not the transaction would be likely to impair (or create the appearance of impairing) the judgment of a director or executive officer to act in the best interest of the Company. |
Except as set forth herein, no related party of the Company, including, but not limited to, any director, officer, nominee for director, immediate family member of a director or officer, immediate family member of any nominee for director, security holder that beneficially owns, directly or indirectly, shares carrying more than 5% of the voting rights attached to its outstanding shares, or immediate family member of any such security holder, since the beginning of fiscal year 2017, has any material interest, direct or indirect, in any transaction or in any presently proposed transaction with the Company where the amount involved exceeds $120,000 which has or will materially affect the Company.
Chief Executive Officer and Chairman of the Board of Directors, William J. Clough’s son, Nicholas J. Clough, serves as President at Orbital Gas Systems, North America, Inc., a wholly owned subsidiary of the Company. Additional Information on Nicholas Clough’s compensation is included in Note 13 Related Party Transactions, to the Consolidated Financial Statements under Part II, Item 8, ‘‘Financial Statements and Supplementary Data.’’
IED and Other Affiliates Related Matters
Effective May 16, 2008 the Company formed a wholly owned subsidiary into which CUI Inc., an Oregon corporation, merged all of its assets. The funding for this acquisition was provided by a bank note, a seller’s note and a convertible seller’s note. Matthew McKenzie, COO and Daniel Ford, CFO each were partial owners in CUI Inc. prior to the acquisition and they each, along with James McKenzie are shareholders in International Electronic Devices, Inc. (IED). The convertible seller’s note was satisfied in 2010 and the bank note was satisfied in 2012. The remaining seller's note is described below:
|
• |
The $5.3 million note payable to International Electronic Devices, Inc. (IED) (the former CUI shareholders) is associated with the acquisition of CUI Inc. The promissory note is due May 15, 2020 and includes a 5% interest rate per annum, with interest payable monthly and the principal due as a balloon payment at maturity. The note contains a contingent conversion feature, such that in the event of default on the note the holder of the note can, at the holder’s option, convert the note principal into common stock at $0.001 per share. As of December 31, 2017, the Company is in compliance with all terms of this promissory note and the conversion feature is not effective. |
|
• |
During 2017, 2016, and 2015, $0.3 million, $0.3 million and $0.3 million, respectively, of interest payments were made in relation to the promissory note issued to IED. |
Item 14. Principal Accountants Fees and Services
Fees or controlled billings for services billed by the Company’s principal accountant, Perkins & Company, P.C., were as follows:
|
For the Years Ended December 31, |
||||||||
|
(In thousands) |
2017 |
2016 |
||||||
|
Audit fees (1) |
$ | 669 | $ | 611 | ||||
|
Audit related fees |
133 | 280 | ||||||
|
Tax fees and other fees |
141 | 70 | ||||||
|
Total Fees |
$ | 943 | $ | 961 | ||||
|
(1) |
Fees and expenses for professional services rendered in connection with the audit of the Company's financial statements and internal control over financial reporting and the reviews of the financial statements included in each of the Company's quarterly reports on Form 10-Q. |
In accordance with the requirements of the Sarbanes-Oxley Act of 2002 and the rules and regulations promulgated thereunder, the Audit Committee has adopted an informal approval policy that it believes will result in an effective and efficient procedure to pre-approve services performed by the independent registered public accounting firm.
Section 16(A) Beneficial Ownership Reporting Compliance
Section 16(a) of the Securities Exchange Act of 1934 requires our executive officers, directors and persons owning more than 10% of our common stock to file reports of ownership and reports of changes of ownership with the Securities and Exchange Commission. These reporting persons are required to furnish us with copies of all Section 16(a) forms that they file. We have made all officers and directors aware of their reporting obligations and have appointed an employee to oversee Section 16 compliance for future filings.
Shareholder Communications
Company shareholders who wish to communicate with the board of directors or an individual director may write to CUI Global, Inc., 20050 SW 112th Avenue, Tualatin, Oregon 97062, phone (503) 612-2300 or to the attention of an individual director. Your letter should indicate that you are a shareholder and whether you own your shares in street name. Letters received will be retained until the next Board meeting when they will be available to the addressed director. Such communications may receive an initial evaluation to determine, based on the substance and nature of the communication, a suitable process for internal distribution, review and response or other appropriate treatment. There is no assurance that all communications will receive a response.
Certain Provisions of the Articles of Incorporation and Colorado Business Corporation Act Relating to Indemnification of Directors and Officers
The Colorado General Corporation Act, as revised, provides that if so provided in the articles of incorporation, the corporation shall eliminate or limit the personal liability of a director to the corporation or to its shareholders for monetary damages for breach of fiduciary duty as a director; except that any such provision shall not eliminate or limit the liability of a director to the corporation or to its shareholders for monetary damages for any breach of the director's duty of loyalty to the corporation or to its shareholders, acts or omissions not in good faith or, which involve intentional misconduct or a knowing violation of law, unlawful distributions, or any transaction from which the director directly or indirectly derived an improper personal benefit.
Our Articles of Incorporation and By-Laws provide that a person who is performing his or her duties shall not have any liability by reason of being or having been a director of the corporation and that the Company shall indemnify and advance expenses to a director or officer in connection with a proceeding to the fullest extent permitted or required by and in accordance with the indemnification sections of Colorado statutes.
Insofar as indemnification for liabilities may be invoked to disclaim liability for damages arising under the Securities Act of 1933, as amended, or the Securities Act of 1934 (collectively, the ‘‘Acts’’), as amended, it is the position of the Securities and Exchange Commission that such indemnification is against public policy as expressed in the Acts and are therefore, unenforceable.
Reports to Shareholders
We intend to voluntarily send Form 10-Ks to our shareholders, which will include audited consolidated financial statements. We are a reporting company and file reports with the Securities and Exchange Commission (SEC), including this Form 10-K as well as quarterly reports under Form 10-Q. The public may read and copy any materials filed with the SEC at the SEC's Public Reference Room at 100 F Street, N.E., Washington, D.C. 20549. Information on the operation of the Public Reference Room may be obtained by calling the SEC at 1-800-SEC-0330. The company files its reports electronically and the SEC maintains an Internet site that contains reports, proxy and information statements and other information filed by the company with the SEC electronically. The address of that site is www.sec.gov.
The company also maintains an Internet site, which contains information about the company, news releases, governance documents and summary financial data. The address of that site is www.CUIGlobal.com.
Part IV
Item 15. Exhibits, Financial Statement Schedules
No schedules are included because the required information is inapplicable, not required or are presented in the financial
statements or the related notes thereto.
EXHIBITS
The following exhibits are included as part of this Form 10-K.
|
32.2 16 |
|
|
101 16 |
XBRL-Related Documents. |
|
101.INS16 |
XBRL Instance Document. |
|
101.SCH16 |
XBRL Taxonomy Extension Schema Document. |
|
101.CAL16 |
XBRL Taxonomy Extension Calculation Linkbase Document. |
|
101.DEF16 |
XBRL Taxonomy Extension Definition Linkbase Document. |
|
101.LAB16 |
XBRL Taxonomy Extension Label Linkbase Document. |
|
101.PRE16 |
XBRL Taxonomy Extension Presentation Linkbase Document. |
Footnotes to Exhibits:
|
1. |
Incorporated by reference to our Proxy Statement and Notice of 2013 Annual Shareholder Meeting filed with the Commission September 17, 2013. |
|
2. |
Incorporated by reference to our Report on Form 8-K filed with the Commission on December 11, 2015. |
|
3. |
Incorporated by reference to our Report on Form 8-K filed with the Commission on January 18, 2013. |
|
4. |
Incorporated by reference to our Report on Form 8-K filed with the Commission on February 14, 2013. |
|
5. |
Incorporated by reference to our Report on Form 8-K filed with the Commission on July 30, 2013. |
|
6. |
Intentionally blank. |
|
7. |
Incorporated by reference to our Report on Form 8-K filed with the Commission on October 3, 2013. |
|
8. |
Incorporated by reference to our Report on Form 8-K filed with the Commission on December 20, 2013. |
|
9. |
Incorporated by reference to our Report on Form 8-K filed with the Commission on September 2, 2014. |
|
10. |
Incorporated by reference to our Report on Form 8-K filed with the Commission on March 3, 2015 and Form 8-K/A filed with the Commission on May 13, 2015. |
|
11. |
Incorporated by reference to our Report on Form 10-K filed with the Commission on March 16, 2015. |
|
12. |
Filed with the Commission on October 5, 2017. |
|
13. |
Incorporated by reference to our Report on Form 10-K filed with the Commission on March 14, 2017. |
|
14. |
Incorporated by reference to our Report on Form 10-Q filed with the Commission on August 9, 2017. |
|
15. |
Incorporated by reference to our Report on Form 10-Q filed with the Commission on November 9, 2017. |
|
16. |
Filed herewith. |
Item 16. Form 10-K Summary
None.
Signatures
Pursuant to the requirements of Section 13 or 15(d) of the Securities Exchange Act of 1934, the registrant has duly caused this report to be signed on its behalf by the undersigned thereunto duly authorized.
CUI Global, Inc.
|
Signature |
Title |
Date |
|||
|
By |
/s/ William J. Clough |
CEO/Principal Executive |
March 14, 2018 |
||
|
William J. Clough |
Officer/President/Director |
||||
|
By |
/s/ Daniel N. Ford |
CFO/ Principal Financial |
March 14, 2018 |
||
|
Daniel N. Ford |
and Accounting Officer |
||||
Pursuant to the requirements of the Securities Exchange Act of 1934, this report has been signed by the following persons on behalf of the registrant and in the capacities on the dates indicated.
|
Signature |
Title |
Date |
|||
|
By |
/s/ William J. Clough |
CEO/Principal Executive |
March 14, 2018 |
||
|
William J. Clough |
Officer/President/Director |
||||
|
By |
/s/ Daniel N. Ford |
CFO/ Principal Financial |
March 14, 2018 |
||
|
Daniel N. Ford |
and Accounting Officer |
||||
|
By |
/s/ Matthew M. McKenzie |
Director |
March 14, 2018 |
||
|
Matthew M. McKenzie |
|||||
|
By |
/s/ Paul D. White |
Director |
March 14, 2018 |
||
|
Paul D. White |
|||||
|
By |
/s/ C. Stephen Cochennet |
Director |
March 14, 2018 |
||
|
C. Stephen Cochennet |
|||||
|
By |
/s/ Corey A. Lambrecht |
Director |
March 14, 2018 |
||
|
Corey A. Lambrecht |
|||||
|
By |
/s/ Thomas A. Price |
Director |
March 14, 2018 |
||
|
Thomas A. Price |
|||||
|
By |
/s/ Sean P. Rooney |
Director |
March 14, 2018 |
||
|
Sean P. Rooney |
|||||
116