Attached files
| file | filename |
|---|---|
| 8-K - FORM 8-K - REGIONS FINANCIAL CORP | d284494d8k.htm |
| EX-99.2 - SUPPLEMENTAL FINANCIAL INFORMATION - REGIONS FINANCIAL CORP | d284494dex992.htm |
| EX-99.1 - PRESS RELEASE - REGIONS FINANCIAL CORP | d284494dex991.htm |
 Regions Financial
4th Quarter Earnings Conference Call
January 24, 2012
Exhibit 99.3 |
 Disciplined Execution of Business Plans
Full-Year 2011 Results
4Q11 Results
Net loss of ($429) million or ($0.34) Earnings Per Share
$211
million
net
income
from
continuing
operations
1
or $0.17 Earnings Per Share
Net loss of ($602) million or ($0.48) Earnings Per Share
$118
million
net
income
from
continuing
operations
1
or $0.09 Earnings Per Share
Sharply reduced credit related costs; loan loss provision
down 47%
Pre-tax Pre-provision
²
income has exceeded loan loss
provision for three straight quarters
Continued
to
improve
efficiency;
lowered
expenses
²
5%
and reduced headcount 3%
Broad based credit quality improvement; net charge-offs
Successful re-mixing of balance sheet;
C&I loans up 11%, IRE loans down 33%
As expected, non-interest revenue negatively impacted by
implementation of Durbin Amendment
Grew low cost deposits 6% and lowered deposit costs 29
basis points full year 2011
Continued improvement in both deposit mix and deposit
costs
Steady non-interest revenues despite legislative and
interest rate challenges
Excluding goodwill charge, ended the year fundamentally
stronger
Strengthened
regulatory
capital;
Tier
1
common
³
rose
65
basis points to 8.5%
Recently announced sale of Morgan Keegan to Raymond James Financial
2
declined 16%, NPL inflows declined 26%
Highest level of Tier 1
Common
³
in more than 3 years
1 Non-GAAP - Excludes goodwill impairment charge of $253M in 4Q11 and excludes regulatory
charge of $75M in 2Q10 offset by $16M related tax benefit in 2Q11 – See
GAAP to non-GAAP reconciliation on slide 17
2 Non-GAAP – See reconciliation on slide 18 3 Non-GAAP
– See reconciliation on slide 19 |
 Divestiture of Morgan Keegan
›
Announced
an
agreement
to
sell
Morgan
Keegan
to
Raymond
James
on
January
11,
2012
›
Total consideration for sale is $1.18 billion: purchase price of
$930 million and expected
pre-close $250 million dividend payment by Morgan Keegan to Regions
›
Summary of transaction benefits:
3
›
Expected to close first quarter 2012
›
Reduces overall risk profile
›
Provides liquidity at the Holding Company
›
Improves key capital ratios
›
Establishes a strong long-term partnership with Raymond James
›
Provides incremental revenue opportunities while enhancing our ability to serve
our existing customers
›
Low cost deposits, loan referrals and processing relationships
›
Divestiture serves to strengthen Regions’
overall focus on our core banking franchise |
 4Q11
Financial Highlights ›
Results demonstrated lower credit costs
›
Net
interest
income
was
steady
linked
quarter
while
net
interest
margin
was
up
4
basis
points
›
Non-interest revenue linked quarter decline driven by lower service charges
and mortgage income
›
Non-interest
expenses
¹
decreased
12%
year-over-year
due
to
lower
credit-related
expenses
and legal and professional fees
4
($ in millions, except EPS)
4Q10
3Q11
4Q11
From Continuing Operations
Net Interest Income
$ 863
$ 850
$ 849
$ (1)
0%
$ (14)
-2%
Non-Interest Revenue
920
513
507
(6)
-1%
(413)
NM
Non-Interest Expense
1
990
850
871
21
2%
(119)
-12%
Pre-tax
Pre-provision
Income
(PPI)
(non-GAAP)
793
513
485
(28)
-5%
(308)
-39%
Net Charge-Offs
682
511
430
(81)
-16%
(252)
-37%
Loan Loss Reserve Build / (Reduction)
-
(156)
(135)
21
NM
(135)
NM
Loan Loss Provision
682
355
295
(60)
-17%
(387)
-57%
Net Income / (Loss) Available to Common Shareholders
from Continuing Operations
14
87
(135)
(222)
-255%
(149)
NM
Net Income / (Loss) from Discontinued Operations
22
14
(467)
(481)
NM
(489)
NM
Net Income / (Loss) Available to Common Shareholders
$ 36
$ 101
$ (602)
$ (703)
NM
$ (638)
NM
Diluted EPS
$0.03
$0.08
($0.48)
($0.56)
NM
($0.51)
NM
Diluted
EPS
from
Continuing
Operations
2
$0.01
$0.07
$0.09
$0.02
29%
$0.08
NM
4Q11 vs. 3Q11
4Q11 vs. 4Q10
1 Non-GAAP excludes goodwill impairment charge of $253M in 4Q11 – See slide 18 for GAAP to
non-GAAP reconciliation
2 Non-GAAP excludes goodwill impairment charge of $253M in 4Q11 – See slide 17 for GAAP to
non-GAAP reconciliation 1 |
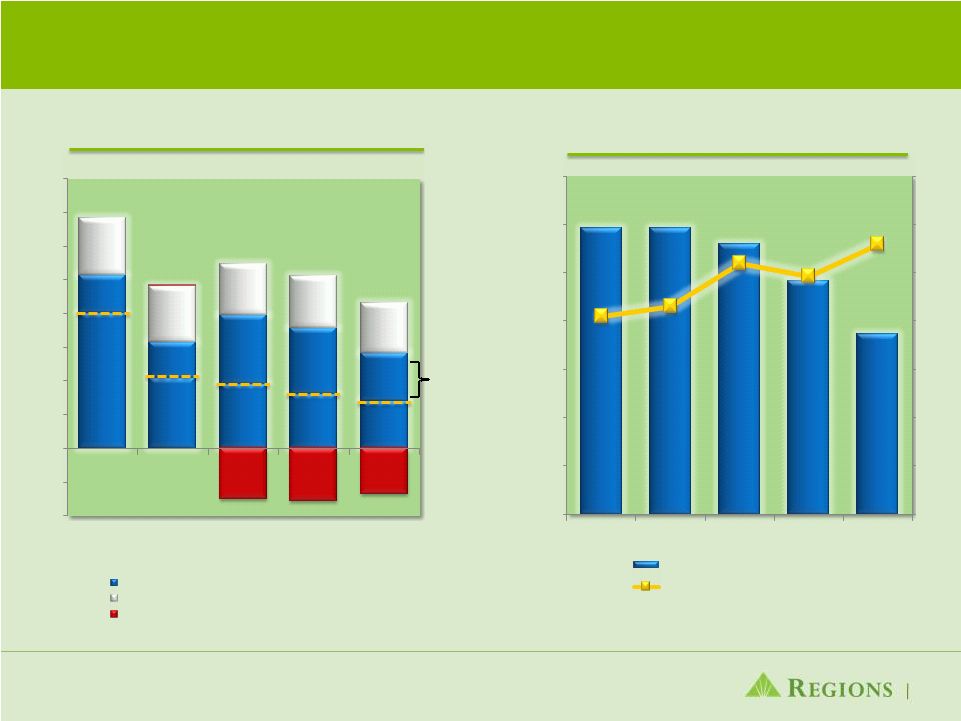
 NPL
Inflows Decreased / NPLs Current and Paying as Agreed Increased 3%
NPL Inflows by Type
Business Services Gross NPLs
Current and Paying as Agreed
Note:
53%
of
4Q11
NPL
Additions
remaining
at
12/31/11
are
current
and
paying
as
agreed
5
$ in millions
Ending Balances
Land/Condo/Single Family
Business and Community
Commercial
Income Producing
$948
$730
$555
$755
$561
4Q10
1Q11
2Q11
3Q11
4Q11
37%
38%
42%
45%
48%
4Q10
1Q11
2Q11
3Q11
4Q11 |
 Non-Performing Assets Declined 12%
›
Non-performing loans,
excluding loans held for
sale, declined $338 million
or 12%
›
Non-performing assets
declined $395 million or
12%
›
Early-stage delinquencies
declined 5%
›
Business Services
criticized loans declined
approximately $935 million
or 13%
Non-Performing Assets
6
$3.2
$3.1
$2.8
$2.7
$2.4
$0.4
$0.4
$0.4
$0.3
$0.3
$0.3
$0.4
$0.4
$0.4
$0.3
$3.9
$3.9
$3.6
$3.4
$3.0
4Q10
1Q11
2Q11
3Q11
4Q11
NPL
OREO & Repo
Held For Sale
$ in billions |
 Loan
Loss Provision Declined 17% Sales/
HFS
(1)
(1) Loan charge-offs related to Sales and Transfer to Held for Sale
(2) Excludes loans held for sale
Loan Loss Provision
Allowance and Coverage
7
402
210
190
160
141
111
106
207
198
141
169
165
151
153
148
(150)
(156)
(135)
$682
$482
$398
$355
$295
($200)
($100)
$0
$100
$200
$300
$400
$500
$600
$700
$800
4Q10
1Q11
2Q11
3Q11
4Q11
$3,185
$3,186
$3,120
$2,964
$2,745
101%
103%
112%
109%
60%
70%
80%
90%
100%
110%
120%
130%
$2,000
$2,200
$2,400
$2,600
$2,800
$3,000
$3,200
$3,400
4Q10
1Q11
2Q11
3Q11
4Q11
116%
Allowance for loan loss
ALL/NPL (2)
Business Services and HFS
Consumer
Reserve Reduction
$ in millions
$ in millions |
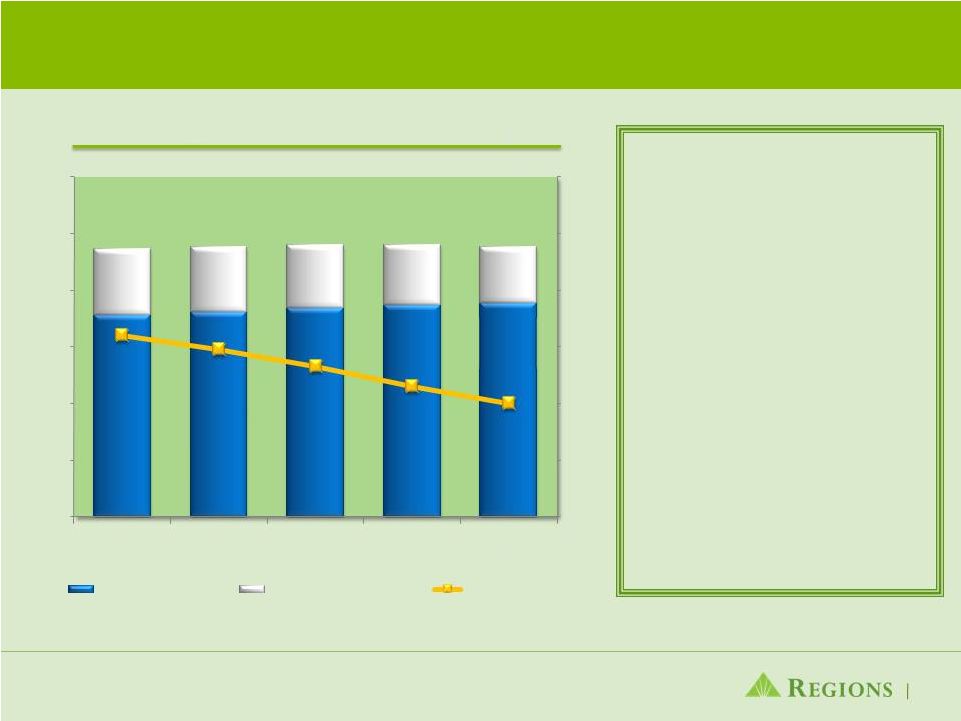
 Loan
Yields Increased 4 bps Linked Quarter ›
Loan yield increased 4 bps
linked quarter driven by
disciplined pricing and an
increase in LIBOR rates
›
Commercial & industrial loan
balances on an average basis
increased 11% from one year
ago reflecting strength in our
middle market portfolio
›
Commercial & industrial loan
balances increased $357 million
or 1.5% linked quarter to $24.3
billion
›
Commercial & industrial
commitments rose 14% in 2011
›
Investor real estate reduced to
14% of total loans down from
19% one year ago
* Average Balances
Loan Balances* and Loan Yields
8
4.00%
4.05%
4.10%
4.15%
4.20%
4.25%
4.30%
4.35%
4.40%
4.45%
4.50%
$0
$10,000
$20,000
$30,000
$40,000
$50,000
$60,000
$70,000
$80,000
$90,000
$100,000
4Q10
1Q11
2Q11
3Q11
4Q11
Avg. Loan Balance
Loan Yield
4.34%
4.31%
4.27%
4.31%
4.35%
$ in millions
$84,108
$82,412
$81,106
$80,513
$78,702 |
 Low
Cost Deposits Grew 6% Year Over Year, Which Drove a 24 bps Decline in
Deposit Costs ›
Improved deposit mix is
resulting in lower deposit costs
›
Low cost deposits as a % of
total deposits increased to
79.2% in 4Q11 from 75.3% in
4Q10
›
Repricing opportunities remain
with over $11.7 billion of
certificate of deposits maturing
over the next 4 quarters at an
average rate of 1.46%
›
Deposit costs declined 6 bps
linked quarter; down 24 bps
year-over-year
* Average Balances
Deposit Balances* and Deposit Costs
9
$71,273
$72,286
$73,616
$74,778
$75,381
23,369
22,971
22,506
21,369
19,774
$94,642
$95,257
$96,122
$96,147
$95,155
64 bps
59 bps
53 bps
46 bps
40 bps
0 bps
20 bps
40 bps
60 bps
80 bps
100 bps
120 bps
$0
$20,000
$40,000
$60,000
$80,000
$100,000
$120,000
4Q10
1Q11
2Q11
3Q11
4Q11
$ in millions
Low Cost Deposits
Time Deposits + Other
Deposit Cost |
 Net
Interest Margin Impacted by Higher Prepayments in Investment Portfolio and Cash
Reserves ›
Net Interest Margin
1
up 4 bps
linked quarter
›
Net interest margin impacted by
higher prepayment activity and
premium amortization in the
investment portfolio, balance
sheet hedges, offset by lower
deposit cost
›
Cash reserves negatively
impacted net interest margin 14
bps in 4Q11 versus 16 bps in
3Q11
Net
Interest
Income
and
Net
Interest
Margin
1
1
From continuing operations
10
2.60%
2.70%
2.80%
2.90%
3.00%
3.10%
3.20%
$750
$775
$800
$825
$850
$875
$900
$925
Net Interest Income (FTE)
Net Interest Margin
3.01%
3.09%
3.07%
3.04%
3.08%
$873
$864
$864
$859
$858
4Q10
1Q11
2Q11
3Q11
4Q11 |
 Decline in Non-Interest Revenues Due to Impact from
Lower Interchange Revenue
›
Service charges decrease reflects
first full quarter impact of Durbin
Amendment, resulting in lower
interchange revenue
›
Interchange income benefited from
increased transaction volume year
to date
›
Mortgage revenue decreased 16%
linked quarter reflecting reduced
benefit from MSR and related
hedging activities
›
4Q11 mortgage production totaled
$1.8 billion; full year production $6.3
billion
Non-Interest Revenue
¹
11
1 From continuing operations
290
287
308
310
263
33
31
19
19
77
75
83
85
96
51
45
50
68
57
$920
$580
$543
$513
$507
$0
$100
$200
$300
$400
$500
$600
4Q10
1Q11
2Q11
3Q11
4Q11
$ in millions
Service Charges on Deposit Accounts
Brokerage, Investment Banking and Capital Markets
Other
Mortgage Income |
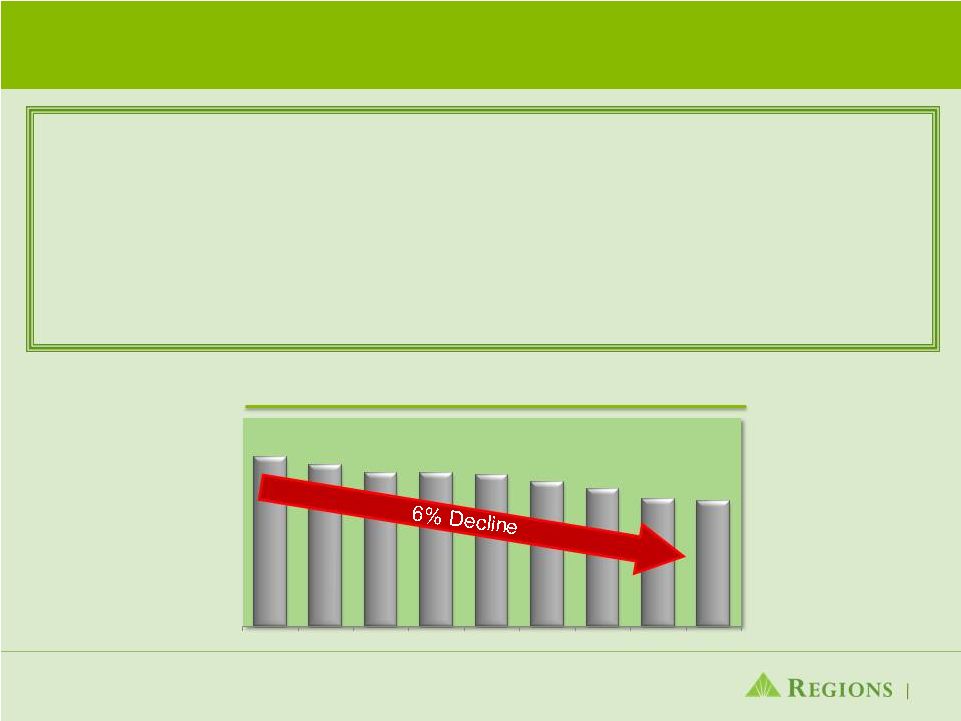 Focused Expense
Management ›
Non-interest expenses from continuing operations increased $274 million, which included $253
million goodwill impairment
›
Excluding
the goodwill
impairment
non-interest
expenses¹
were
2% higher than prior quarter; however, down 5% from
2010
›
Salaries and benefits costs increased $9 million linked quarter due to deferred compensation
adjustments although it was down 5% compared to 4Q10
›
Credit-related expenses decreased $23 million over prior quarter and accounted for 9% of fourth
quarter’s non-interest expenses¹ as compared to
14% in fourth quarter 2010 ›
Headcount reduced another 68 positions this quarter, down 6% over the last 2 years
1
Non-GAAP
-
From
continuing
operations
excluding
goodwill
impairment
and
regulatory
charges
–
See GAAP to
non-GAAP reconciliation on slide 18
12
28,509
28,213
27,895
27,898
27,829
27,557
27,261
26,881
26,813
4Q09
1Q10
2Q10
3Q10
4Q10
1Q11
2Q11
3Q11
4Q11
Headcount Trends |
 Capital Ratios Remain Strong;
Liquidity Profile Solid
›
Well-positioned with respect to the Liquidity Coverage Ratio prescribed under
Basel III ›
Solid liquidity at both the bank and holding company
›
Loan-to-deposit ratio of 81% and cash held at the Federal Reserve totaled
$4.9 billion Capital Ratios
Liquidity
13
3
1
2
4
7.9%
7.9%
8.2%
8.5%
7.7%
12.5%
12.6%
12.8%
13.2%
11.3%
1Q11
2Q11
3Q11
4Q11
4Q11
Basel III
Tier 1 Common
Tier 1
84%
84%
83%
81%
1Q11
2Q11
3Q11
4Q11
Loan to Deposit Rato
1
Current Quarter ratios are estimated 2
Non-GAAP - Subject to change as interpretation of Basel III rules is ongoing and dependent on
guidance from Basel and regulators; see slide 20 in appendix for reconciliation 3
Non-GAAP – See slide 19 in appendix for reconciliation 4
Based on ending balances
|
 Looking Ahead to 2012
Economic Headwinds
›
Low growth GDP
›
Persistent high unemployment
›
Low interest rate, slow growth environment
›
Weak housing market
Legislative Challenges
›
Durbin Amendment (~$180mm negative
impact)
›
Regulation E (~$100mm negative impact)
›
Basel III requirements
›
2012 Elections
Regions’
Business Plan
›
Improving fundamentals
›
Competitive advantage: customer loyalty and service quality
›
New revenue initiatives
›
Changes in checking account fee structure
›
Product innovation and expansion
›
Continued emphasis on cost control
›
De-risking portfolio: liquidating problem assets and
foreclosed properties
›
Continued credit quality improvement
Despite ongoing economic and legislative challenges, we believe we have the right
plan in place to provide shareholders an attractive long-term
return. 14 |
 |
 Forward-Looking Statements
This
presentation
may
include
forward-looking
statements
which
reflect
Regions’
current
views
with
respect
to
future
events
and
financial
performance.
The
Private
Securities
Litigation
Reform
Act
of
1995
(“the
Act”)
provides
a
“safe
harbor”
for
forward-looking
statements
which
are
identified
as
such
and
are
accompanied
by
the
identification
of
important
factors
that
could
cause
actual
results
to
differ
materially
from
the
forward-looking
statements.
For
these
statements,
we,
together
with
our
subsidiaries,
claim
the
protection
afforded
by
the
safe
harbor
in
the
Act.
Forward-looking
statements
are
not
based
on
historical
information,
but
rather
are
related
to
future
operations,
strategies,
financial
results
or
other
developments.
Forward-looking
statements
are
based
on
management’s
expectations
as
well
as
certain
assumptions
and
estimates
made
by,
and
information
available to,
management
at
the
time
the
statements
are
made.
Those
statements
are
based
on
general
assumptions
and
are
subject
to
various
risks,
uncertainties
and
other
factors
that
may
cause
actual
results
to
differ
materially
from
the
views,
beliefs
and
projections
expressed
in
such
statements.
These
risks,
uncertainties
and
other
factors
include,
but
are
not
limited
to,
those
described
below:
›
The
Dodd-Frank
Wall
Street
Reform
and
Consumer
Protection
Act
(the
“Dodd-Frank
Act”)
became
law
on
July
21,
2010,
and
a
number
of
legislative,
regulatory
and
tax
proposals
remain
pending.
Additionally,
the
U.S.
Treasury
and
federal
banking
regulators
continue
to
implement,
but
are
also
beginning
to
wind
down,
a
number
of
programs
to
address
capital
and
liquidity
in
the
banking
system.
Proposed
rules,
including
those
that
are
part
of
the
Basel
III
process,
could
require
banking
institutions
to
increase
levels
of
capital.
All
of
the
foregoing
may
have
significant
effects
on
Regions
and
the
financial
services
industry,
the
exact
nature
of
which
cannot be determined at this time.
›
Regions'
ability
to
mitigate
the
impact
of
the
Dodd-Frank
Act
on
debit
interchange
fees
through
revenue
enhancements
and
other
revenue
measures,
which
will
depend
on
various
factors,
including
the
acceptance by
our customers of modified fee structures for Regions' products and services.
›
The impact of compensation and other restrictions imposed under the Troubled Asset
Relief Program (“TARP”) until Regions repays the outstanding preferred stock and warrant issued under the TARP, including
restrictions on Regions’
ability to attract and retain talented executives and associates.
›
Possible additional loan losses, impairment of goodwill and other intangibles, and
adjustment of valuation allowances on deferred tax assets and the impact on earnings and capital.
›
Possible changes in interest rates may increase funding costs and reduce earning
asset yields, thus reducing margins. Increases in benchmark interest rates would also increase debt service requirements for
customers whose terms include a variable interest rate, which may negatively impact
the ability of borrowers to pay as contractually obligated. ›
Possible changes in general economic and business conditions in the United States in
general and in the communities Regions serves in particular, including any prolonging or worsening of the current unfavorable
economic conditions including unemployment levels.
›
Possible changes in the creditworthiness of customers and the possible impairment of
the collectability of loans. ›
Possible
changes
in
trade,
monetary
and
fiscal
policies,
laws
and
regulations
and
other
activities
of
governments,
agencies,
and
similar
organizations,
may
have
an
adverse
effect
on
business.
›
The current stresses in the financial and real estate markets, including possible
continued deterioration in property values. ›
Regions' ability to manage fluctuations in the value of assets and liabilities and
off-balance sheet exposure so as to maintain sufficient capital and liquidity to support Regions' business.
›
Regions' ability to expand into new markets and to maintain profit margins in the
face of competitive pressures. ›
Regions' ability to develop competitive new products and services in a timely manner
and the acceptance of such products and services by Regions' customers and potential customers.
›
Regions' ability to keep pace with technological changes.
›
Regions' ability to effectively manage credit risk, interest rate risk, market risk,
operational risk, legal risk, liquidity risk, and regulatory and compliance risk.
›
Regions’
ability to ensure adequate capitalization which is impacted by inherent
uncertainties in forecasting credit losses. ›
The cost and other effects of material contingencies, including litigation
contingencies, and any adverse judicial, administrative or arbitral rulings or proceedings.
›
The effects of increased competition from both banks and non-banks.
›
The effects of geopolitical instability and risks such as terrorist attacks.
›
Possible changes in consumer and business spending and saving habits could affect
Regions' ability to increase assets and to attract deposits. ›
The effects of weather and natural disasters such as floods, droughts, wind,
tornados and hurricanes, and the effects of man-made disasters.
›
Possible downgrades in ratings issued by rating agencies.
›
Potential
dilution
of
holders
of
shares
of
Regions’
common
stock
resulting
from
the
U.S.
Treasury’s
investment
in
TARP.
›
Possible
changes
in
the
speed
of
loan
prepayments
by
Regions’
customers
and
loan
origination
or
sales
volumes.
›
Possible acceleration of prepayments on mortgage-backed securities due to low
interest rates and the related acceleration of premium amortization on those securities.
›
The
effects
of
problems
encountered
by
larger
or
similar
financial
institutions
that
adversely
affect
Regions
or
the
banking
industry
generally.
›
Regions’
ability to receive dividends from its subsidiaries.
›
The
effects
of
the
failure
of
any
component
of
Regions’
business
infrastructure
which
is
provided
by
a
third
party.
›
Changes in accounting policies or procedures as may be required by the Financial
Accounting Standards Board or other regulatory agencies. ›
The
effects
of
any
damage
to
Regions’
reputation
resulting
from
developments
related
to
any
of
the
items
identified
above.
›
With regard to the sale of Morgan Keegan:
›
the
possibility
that
regulatory
and
other
approvals
and
conditions
to
the
transaction
are
not
received
on
a
timely
basis
or
at
all;
the
possibility
that
modifications
to
the
terms
of
the
transaction
may
be
required
in
order
to
obtain
or
satisfy
such
approvals
or
conditions;
changes
in
the
anticipated
timing
for
closing
the
transaction;
business disruption
during
the
pendency
of
or
following
the
transaction;
diversion
of
management
time
on
transaction-related
issues;
reputational
risks
and
the
reaction
of
customers
and
counterparties
to
the
transaction
›
The
foregoing
list
of
factors
is
not
exhaustive.
For
discussion
of
these
and
other
factors
that
may
cause
actual
results
to
differ
from
expectations,
look
under
the
captions
“Forward-Looking
Statements”
and
“Risk
Factors”
in Regions’
Annual Report on Form 10-K for the year ended December 31, 2010 and quarterly
report on Forms 10-Q for the quarters ended September 30, 2011, June 30, 2011 and March 31, 2011, as on
file with the Securities and Exchange Commission.
›
The words "believe," "expect," "anticipate,"
"project," and similar expressions often signify forward-looking statements. You should not place undue reliance on any forward-looking statements, which speak only as of
the date made. We assume no obligation to update or revise any forward-looking
statements that are made from time to time. 16
|
 Non-GAAP Reconciliation: Net Income / (Loss)
and Earnings Per Share
1
There
are
no
preferred
shares
allocable
to
discontinued
operations.
2
In
the
second
quarter
of
2010,
Regions
recorded
a
$200
million
charge
to
account
for
a
probable,
reasonably
estimable
loss
related
to
a
pending
settlement of
regulatory matters. At that time, Regions assumed that the entire charge would be
non-deductible for income tax purposes. $75 million of the regulatory charge relates
to
continuing
operations.
The
settlement
was
finalized
during
the
second
quarter
of
2011.
At
the
time
of
settlement,
Regions
had
better
information
related
to
tax
implications. Approximately $125 million of the settlement charge will be deductible
for federal income tax purposes. Accordingly, during the second quarter of 2011,
Regions
adjusted
federal
income
taxes
to
account
for
the
impact
of
the
deduction.
The
adjustment
reduced
Regions'
provision
for
income
taxes
by
approximately
$44
million for the second quarter of 2011, of which approximately $17 million relates
to continuing operations. 2011
2010
4Q11
3Q11
2Q11
1Q11
4Q10
Net income (loss) (GAAP)
(215)
$
(539)
$
(548)
$
155
$
109
$
69
$
89
$
Preferred dividends and accretion (GAAP)
(214)
(224)
(54)
(54)
(54)
(52)
(53)
Net income (loss) available to common shareholders (GAAP)
(429)
$
(763)
$
(602)
$
101
$
55
$
17
$
36
$
Income (loss) from discontinued operations, net of tax (GAAP)
(1)
(404)
(71)
(467)
14
30
19
22
Income (loss) from continuing operations available to common shareholders
(GAAP) (25)
$
(692)
$
(135)
$
87
$
25
$
(2)
$
14
$
Goodwill impairment from continuing operations (non-deductible)
253
-
253
-
-
-
-
Regulatory charge and related tax benefit from continuing operations
(2)
(17)
75
-
-
(17)
-
-
Income (loss) from continuing operations available to common shareholders,
excluding goodwill impairment and regulatory charge and related tax benefit
(non-GAAP) 211
$
(617)
$
118
$
87
$
8
$
(2)
$
14
$
GAAP to non-GAAP EPS Reconciliation
Earnings (loss) per share as reported (GAAP)
($0.34)
($0.62)
($0.48)
$0.08
$0.04
$0.01
$0.03
Earnings (loss) per share from discontinued operations (GAAP)
($0.32)
($0.06)
($0.37)
$0.01
$0.02
$0.01
$0.02
Earnings (loss) per share from continuing operations (GAAP)
($0.02)
($0.56)
($0.11)
$0.07
$0.02
($0.00)
$0.01
Goodwill impairment and related regulatory charge net of tax benefit from
continuing operations
($0.19)
($0.06)
($0.20)
$0.00
$0.01
$0.00
$0.00
Adjusted earnings per share from continuing operations, excluding goodwill
impairment and regulatory charge (non-GAAP)
$0.17
($0.50)
$0.09
$0.07
$0.01
($0.00)
$0.01
Year Ended December 31
As of and for Quarter Ended
17
The tables below and on the next slide present computations of earnings (loss) and certain other
financial measures, excluding goodwill impairment and regulatory charge and related tax benefit
(non-GAAP). The goodwill impairment charge and the regulatory charge and related tax benefit are included in financial results presented in accordance with generally
accepted accounting principles (GAAP). A table also presents computations of full year and quarterly
pre-tax pre-provision income (non-GAAP). Non-interest expense (GAAP) is
presented excluding certain adjustments to arrive at adjusted non-interest expense (non-GAAP).
Regions believes that the exclusion of the goodwill impairment and the regulatory charge and
related tax benefit in expressing earnings (loss) and certain other financial measures, including "earnings (loss) per common share, excluding goodwill impairment and
regulatory charge and related tax benefit“ provides a meaningful base for
period-to-period comparisons, which management believes will assist investors in analyzing the operating
results of the Company and predicting future performance. These non-GAAP financial measures
are also used by management to assess the performance of Regions' business because
management does not consider the goodwill impairment and regulatory charge and related tax benefit to be relevant to ongoing operating results. Management and the
Board of Directors utilize these non-GAAP financial measures for the following purposes:
preparation of Regions' operating budgets; monthly financial performance reporting; monthly
close-out "flash" reporting of consolidated results (management only); and
presentations to investors of company performance. Management uses these measures to monitor
performance and believes these measures provide meaningful information to investors. |
 Non-GAAP Reconciliation: Pre-Tax Pre-Provision
Income and Adjusted Expenses
18
1
Adjusted non-interest expense declined 5% for the full year 2011 and 12%
comparing 4Q10 to 4Q11, while increasing 2% on a linked quarter basis in
4Q11 2011
2010
4Q11
3Q11
2Q11
1Q11
4Q10
Pre-Tax Pre-Provision Income (non-GAAP)
Income (loss) from continuing operations available to common shareholders
(GAAP) $ (25)
$ (682)
$ (135)
$ 87
$ 25
$ (2)
$ 14
Preferred dividends and accretion (GAAP)
214
224
54
54
54
52
53
Income tax expense (GAAP)
(28)
(376)
18
17
(34)
(29)
44
Pre-tax income (loss) from continuing operations (GAAP)
161
(834)
(63)
158
45
21
111
Provision for loan losses (GAAP)
1,530
2,863
295
355
398
482
682
Pre-tax pre-provision income from continuing operations
(non-GAAP) $ 1,691
$ 2,029
$ 232
$ 513
$ 443
$ 503
$ 793
Goodwill impairment from continuing operations
253
-
253
-
-
-
-
Regulatory Charge from continuing operations
-
75
-
-
-
-
-
Pre-tax pre-provision income from continuing operations, excluding goodwill
impairment and regulatory charge (non-GAAP)
$ 1,944
$ 2,104
$ 485
$ 513
$ 443
$ 503
$ 793
Non-interest Expense (GAAP)
$ 3,862
$ 3,859
$ 1,124
$ 850
$ 956
$ 932
$ 990
Adjustments:
Goodwill impairment from continuing operations
253
-
253
-
-
-
-
Regulatory Charge from continuing operations
-
75
-
-
-
-
-
Adjusted non-interest expense (non-GAAP)
(1)
$ 3,609
$ 3,784
$ 871
$ 850
$ 956
$ 932
$ 990
As of and for Quarter Ended
Year Ended December 31
Continuing Operations - Non-interest Expense |
 Non-GAAP Reconciliation: Tier 1 Common
($ amounts in millions)
12/31/11
9/30/11
6/30/11
3/31/11
12/31/10
TIER 1 COMMON RISK-BASED RATIO CONSOLIDATED
-
Stockholders' equity (GAAP)
16,499
$
17,263
$
16,888
$
16,619
$
16,734
$
Accumulated other comprehensive (income) loss
69
(92)
177
387
260
Non-qualifying goodwill and intangibles
(4,900)
(5,649)
(5,668)
(5,686)
(5,706)
Disallowed deferred tax assets
(432)
(506)
(498)
(463)
(424)
Disallowed servicing assets
(35)
(35)
(35)
(28)
(27)
Qualifying non-controlling interests
92
92
92
92
92
Qualifying trust preferred securities
846
846
846
846
846
Tier 1 capital (regulatory)
12,139
$
11,919
$
11,802
$
11,767
$
11,775
$
Qualifying non-controlling interests
(92)
(92)
(92)
(92)
(92)
Qualifying trust preferred securities
(846)
(846)
(846)
(846)
(846)
Preferred stock
(3,419)
(3,409)
(3,399)
(3,389)
(3,380)
Tier 1 common equity (non-GAAP)
7,782
$
7,572
$
7,465
$
7,440
$
7,457
$
Risk-weighted assets (regulatory)
91,663
92,786
93,865
93,929
94,966
Tier 1 common risk-based ratio (non-GAAP)
8.5%
8.2%
7.9%
7.9%
7.9%
As of and for Quarter Ended
19
The following table provides a reconciliation of stockholder’ equity to "Tier 1 common
equity" (non-GAAP). Traditionally, the Federal Reserve and other banking
regulatory bodies have assessed a bank's capital adequacy based on Tier 1 capital, the calculation of which is codified in federal
banking regulations. In connection with the Company's Comprehensive Capital Assessment and
Review ("CCAR"), these regulators are supplementing their assessment of the capital
adequacy of a bank based on a variation of Tier 1 capital, known as Tier 1 common equity. While
not codified, analysts and banking regulators have assessed Regions' capital adequacy using the
Tier 1 common equity measure. Because and Tier 1 common equity is not formally defined by
GAAP or codified in the federal banking regulations, this measures is considered to be non-GAAP
financial measures and other entities may calculate them differently than Regions' disclosed
calculations. Since analysts and banking regulators may assess Regions' capital adequacy
using tangible common stockholders' equity and Tier 1 common equity, we believe that it is useful to
provide investors the ability to assess Regions' capital adequacy on these same bases. Tier
1 common equity is often expressed as a percentage of risk-weighted assets. Under the risk-based capital framework, a company's balance
sheet assets and credit equivalent amounts of off-balance sheet items are assigned to one of four
broad risk categories. The aggregated dollar amount in each category is then multiplied
by the risk-weighted category. The resulting weighted values from each of the four categories are
added together and this sum is the risk-weighted assets total that, as adjusted, comprises the
denominator of certain risk-based capital ratios. Tier 1 capital is then divided by
this denominator (risk-weighted assets) to determine the Tier 1 capital ratio. Adjustments are made to Tier 1
capital to arrive at Tier 1 common equity. Tier 1 common equity is also divided by the
risk-weighted assets to determine the Tier 1 common equity ratio. The amounts
disclosed as risk-weighted assets are calculated consistent with banking regulatory requirements. |
 Non-GAAP Reconciliation: Basel III
1
2
20
($ amounts in millions)
12/31/11
BASEL III
Stockholders' equity (GAAP)
16,499
$
Non-qualifying goodwill and intangibles
(1)
(5,065)
Adjustments, including other comprehensive income related to cash flow hedges,
disallowed deferred tax assets, threshold deductions and other
adjustments (857)
10,577
$
Qualifying non-controlling interests
4
Basel III Tier 1 Capital (non-GAAP)
10,581
$
Basel III Tier 1 Capital (non-GAAP)
10,581
$
Preferred Stock
(3,419)
Qualifying non-controlling interests
(4)
Basel III Tier 1 Common (non-GAAP)
7,158
$
Basel I risk-weighted assets
91,663
Basel III risk-weighted assets
(2)
93,267
Minimum
Basel III Tier 1 Capital Ratio
11.3%
8.5%
Basel III Tier 1 Common Ratio
7.7%
7.0%
The
following
table
provides
calculations
of
Tier
1
capital
and
Tier
1
common,
based
on
Regions’
current
understanding
of
Basel
III
requirements.
Regions
currently
calculates
its
risk-based
capital
ratios
under
guidelines
adopted
by
the
Federal
Reserve
based
on
the
1988
Capital
Accord
(“Basel I”)
of
the
Basel
Committee
on
Banking
Supervision
(the
“Basel
Committee”).
In
December
2010,
the
Basel
Committee
released
its
final
framework
for
Basel
III,
which
will
strengthen
international
capital
and
liquidity
regulation.
When
implemented
by
U.S.
bank
regulatory
agencies
and
fully
phased-in,
Basel
III
will
change
capital
requirements
and
place
greater
emphasis
on
common
equity.
Implementation
of
Basel
III
will
begin
on
January
1,
2013,
and
will
be
phased
in
over
a
multi-year
period.
The
U.S.
bank
regulatory
agencies
have
not
yet
finalized
regulations
governing
the
implementation
of
Basel
III.
Accordingly,
the
calculations
provided
below
are
estimates,
based
on
Regions’
current
understanding
of
the
framework,
including
the
Company’s
reading
of
the
requirements,
and
informal
feedback
received
through
the
regulatory
process.
Regions’
understanding
of
the
framework
is
evolving
and
will
likely
change
as
the
regulations
are
finalized.
Because
the
Basel
III
implementation
regulations
are
not
formally
defined
by
GAAP
and
have
not
yet
been
finalized
and
codified,
these
measures
are
considered
to
be
non-GAAP
financial
measures,
and
other
entities
may
calculate
them
differently
from
Regions’
disclosed
calculations.
Since
analysts
and
banking
regulators
may
assess
Regions’
capital
adequacy
using
the
Basel
III
framework,
we
believe
that
it
is
useful
to
provide
investors
the
ability
to
assess
Regions’
capital
adequacy
on
the
same
basis.
Under Basel III, regulatory capital must be reduced by purchased credit card relationship intangible
assets. These assets are Regions continues to develop systems and internal controls to
precisely calculate risk-weighted assets as required by Basel III. partially allowed
in Basel I capital. The amount included above is a reasonable approximation, based on our understanding of the
requirements. |