Attached files
| file | filename |
|---|---|
| 8-K - FORM 8-K - CVR PARTNERS, LP | d282801d8k.htm |
 Exhibit 99.1 |
 2
The
following
information
contains
forward-looking
statements
based
on
management’s
current
expectations
and
beliefs,
as
well
as
a
number
of
assumptions
concerning
future
events.
These
statements
are
subject
to
risks,
uncertainties,
assumptions
and
other
important
factors.
You
are
cautioned
not
to
put
undue
reliance
on
such
forward-looking
statements
(including
forecasts
and
projections
regarding
our
future
performance)
because
actual
results
may
vary
materially
from
those
expressed
or
implied
as
a
result
of
various
factors,
including,
but
not
limited
to
those
set
forth
under
“Risk
Factors”
and
“Cautionary
Note
Regarding
Forward-Looking
Statements”
in
the
CVR
Partners,
LP
Prospectus
dated
April
7,
2011
and
any
other
filings
CVR
Partners,
LP
makes
with
the
Securities
and
Exchange
Commission.
CVR
Partners,
LP
assumes
no
obligation
to,
and
expressly
disclaims
any
obligation
to,
update
or
revise
any
forward-looking
statements,
whether
as
a
result
of
new
information,
future
events
or
otherwise.
Safe Harbor |
 Company
Overview |
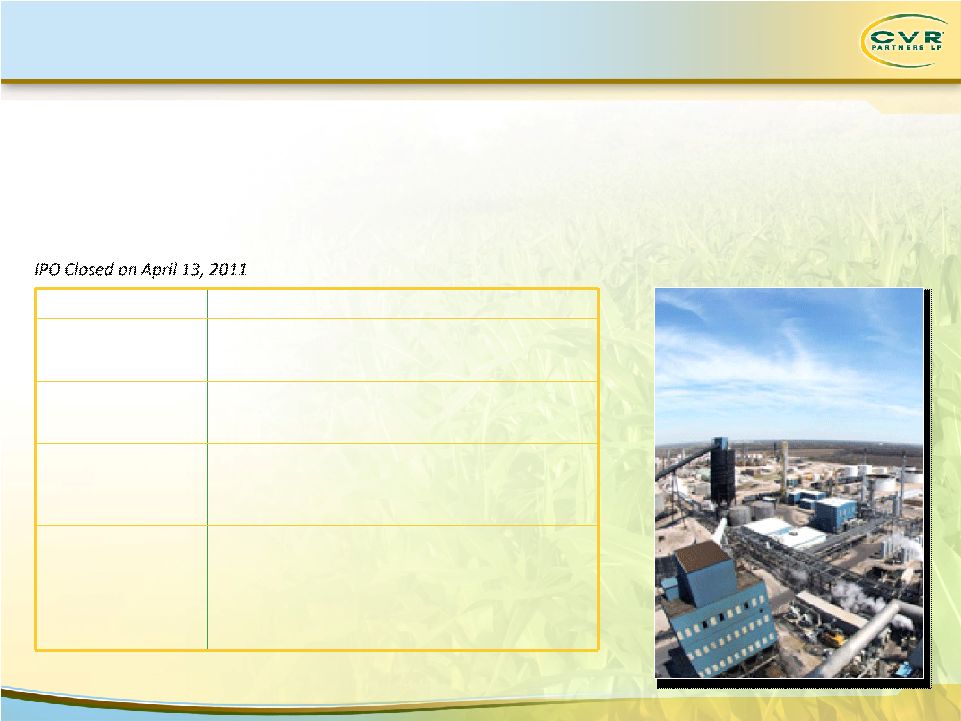   CVR Partners
Offering CVR Partners Offering
NYSE Ticker:
UAN
Total units with
over-allotment:
22.1m common units (30.2%)
Pricing:
$16 per LP unit ($3 higher than original mid-point)
March 31, 2012 LTM
estimated
distribution/yield:
$1.92 per unit / 12%
Use of proceeds:
Buy the GP and extinguish IDR’s, distribution to
Coffeyville Resources, general growth projects
including UAN expansion
As of January 12, 2012, CVR Partners market cap was $1.9 billion, of which $1.3 billion is
controlled by CVR Energy. CVR
Partners
is
a
growth
oriented
partnership
formed
by
CVR
Energy,
Inc.
in
June
2007.
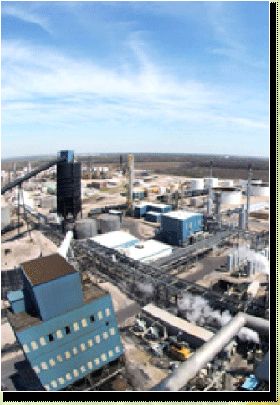
CVR
Partners’
nitrogen
fertilizer
manufacturing
facility
produces
ammonia
and
Urea
Ammonium
Nitrate
(UAN).
The
facility
is
located
in
Coffeyville,
Kansas
and
produces
5%
of
the
total
UAN
demand
in
the
United
States.
4 |
 5
Company Overview
Key Strategic Factors
Experienced management team
Fully utilized capacity
High run time rates
Strategically located plant
Favorable rail logistics
Stable & economic feedstock |
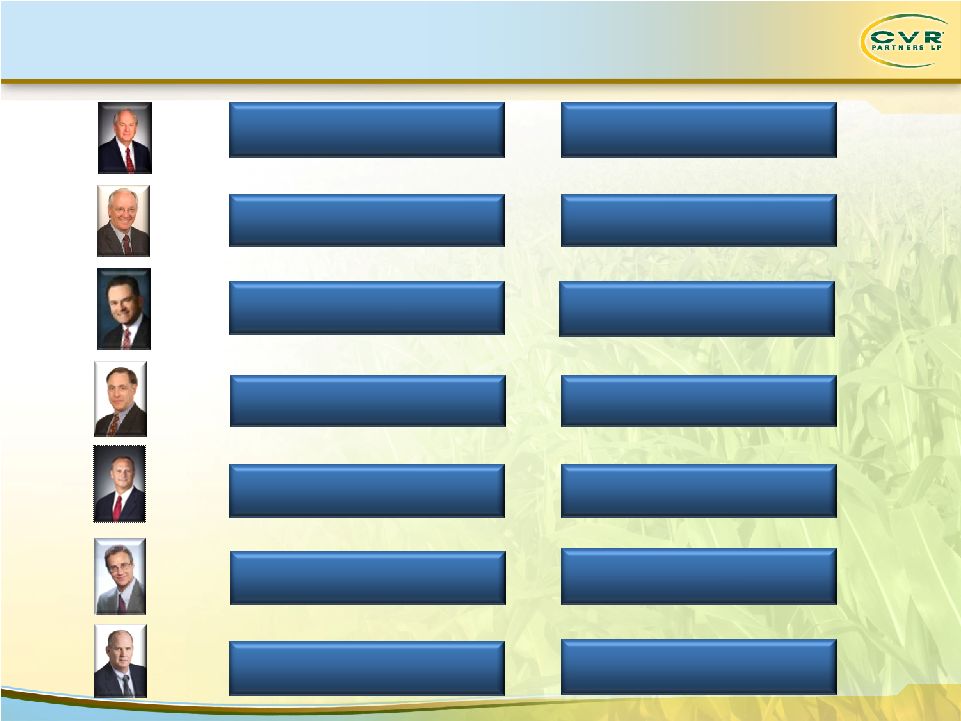 Company
Overview Experienced Management Team
Byron R. Kelley
CEO
Stan A. Riemann
COO
Frank A. Pici
CFO and Treasurer
Randal T. Maffett
EVP Business Development
Edmund S. Gross
SVP, General Counsel & Secretary
Years Experience: 41
Years Experience: 37
Years Experience: 28
Years Experience: 31
Years Experience: 33
6
Kevan A. Vick
EVP & GM Nitrogen Manufacturing
Years Experience: 36
Christopher G. Swanberg
VP Environmental, Health & Safety
Years Experience: 31 |
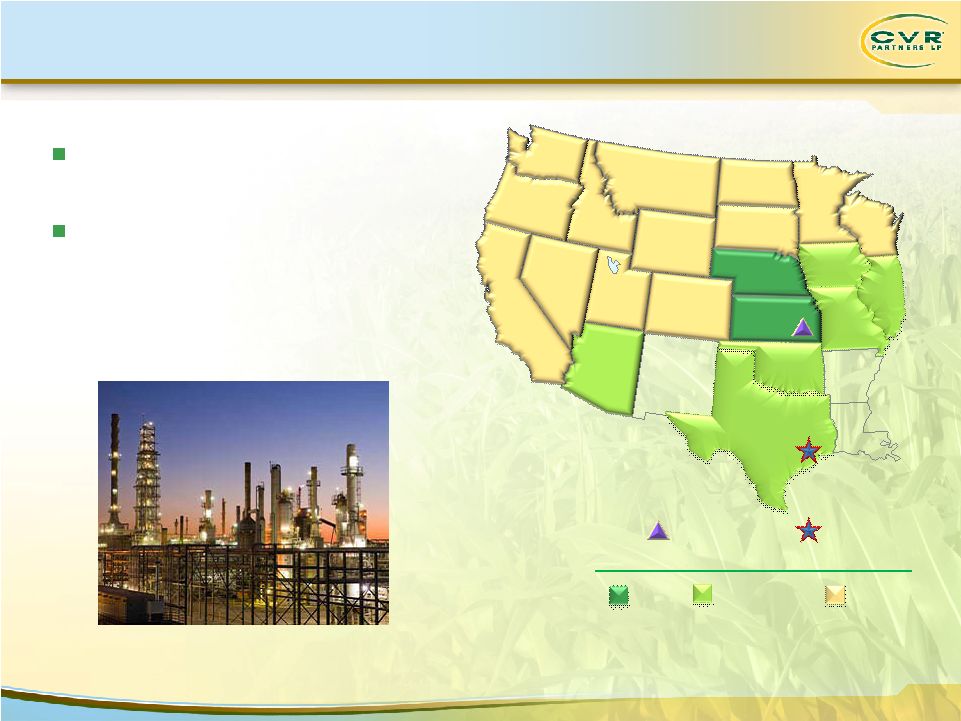 Company
Overview
Fully
Utilized
Capacity
/
High
Utilization
Rates
1)
Adjusted for major scheduled turnaround, third-party outage on air separation unit and UAN
vessel rupture. WA
OR
CA
NV
ID
MT
WY
UT
CO
NM
AZ
TX
OK
KS
NE
SD
ND
MN
IA
MO
AR
LA
WI
IL
Fertilizer Plant
Corporate
Headquarters
LTM Q3 2011 Tons Sold by State
100,000+
10,000 to 100,000
Up to 10,000
7
LTM Q3 2011 Total Tons Sold ~ 731,350
Capacity:
1,225
tons-per-day
ammonia
unit,
2,025
tons-per-day
UAN
unit
LTM
Q3
2011
on-stream
efficiency
(1)
—
Gasifier:
98.9%
—
Ammonia:
97.6%
—
UAN:
97.3% |
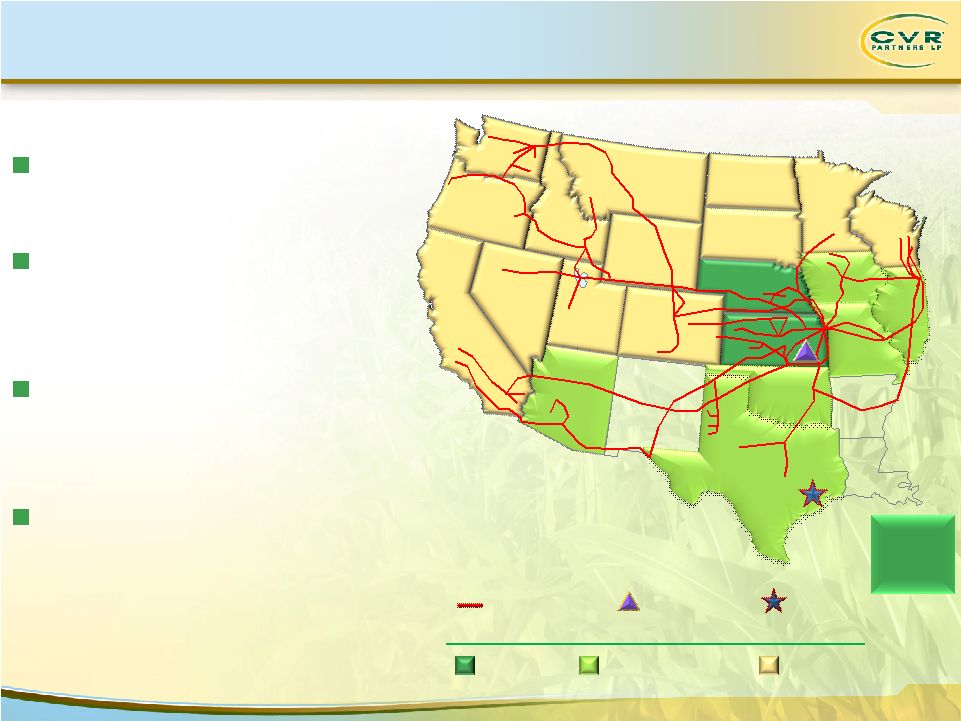 Company
Overview Strategically Located Assets & Logistics
8
WA
OR
CA
NV
ID
MT
WY
UT
CO
NM
AZ
TX
OK
KS
NE
SD
ND
MN
IA
MO
AR
LA
WI
IL
Additional
Shipments
East of the
Mississippi
Rail Distribution
LTM Q3 2011 Tons Sold by State
100,000+
10,000 to 100,000
Up to 10,000
Corporate
Headquarters
Fertilizer Plant
LTM Q3 2011 Total Tons Sold ~ 731,350
Located in the corn belt (on Union
Pacific
mainline)
45% of corn planted in 2010 was
within $35/UAN ton freight rate
of our plant
$25/ton transportation
advantage to corn belt vs. U.S.
Gulf
Coast
No intermediate transfer,
storage, barge freight or pipeline
freight charges |
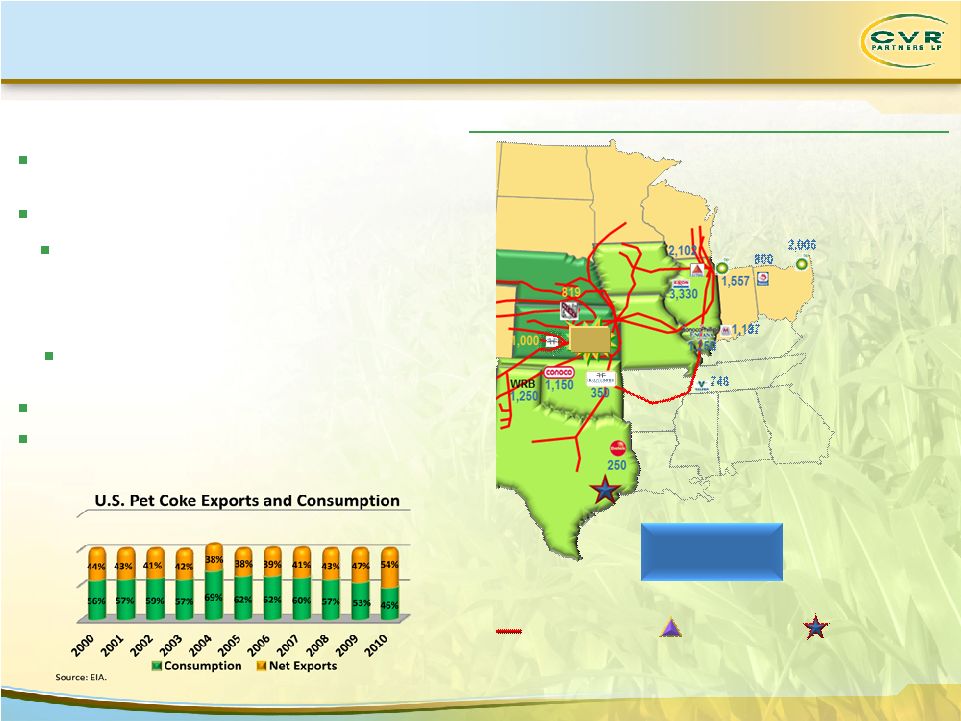 Company
Overview Stable & Economic Feedstock
Rail Distribution
Corporate
Headquarters
Fertilizer Plant
Abundant
Supply
of
Third-Party
Pet
Coke
in
the
Region
9
Texas Gulf Coast
Coke
Production = 40,000
tons/day
Source: Oil & Gas Journal
CVR Partners LP 2008 –
2010 average daily coke demand ~ 1,378
tons/day
Coke gasification technology uses petroleum coke as a feedstock
Dual train gasifier configuration ensures reliability
Ammonia synthesis loop and UAN synthesis use same processes
as natural gas based producers
Pet
coke
costs
lower
than
natural
gas
costs
per
ton
of
ammonia
produced,
and
pet
coke prices are significantly more stable
than natural gas prices
Over 70% of pet coke supplied by refinery
through long-term contract |
 Market
Fundamentals Market Fundamentals |
 Market
Fundamentals Key Growth Factors
11
Fertilizer
consumption
is
driven
by:
—
Population growth
—
Decline in farmland per capita
—
Income growth in emerging markets, preference for proteins
—
Ethanol production |
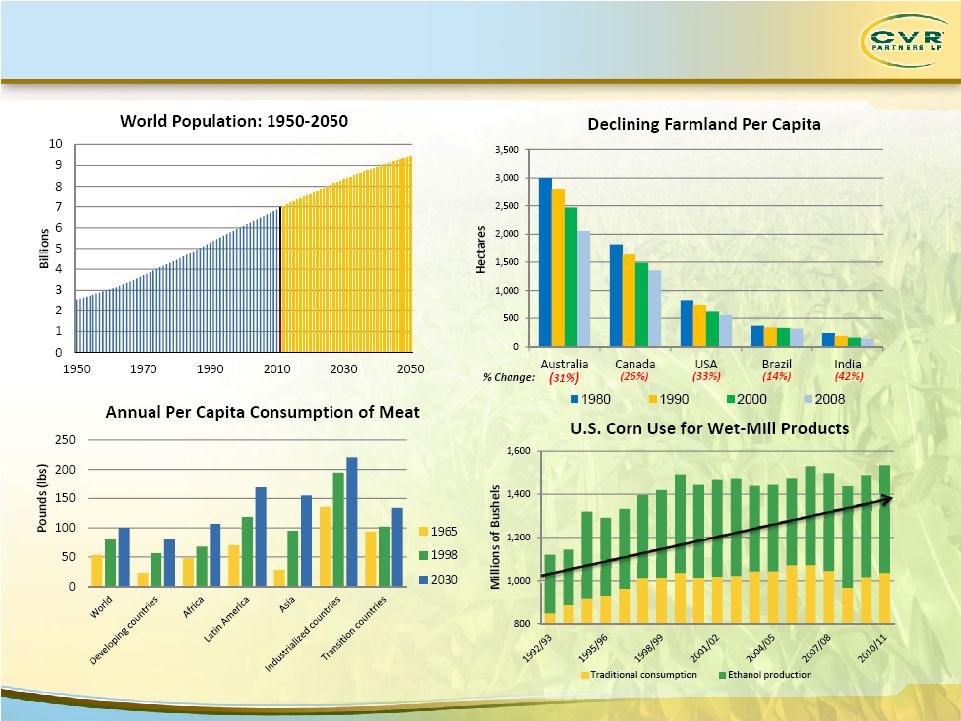 Market
Fundamentals Key Growth Factors
12
Source:
USDA, Census Bureau, World Bank, http://data.worldbank.org/indicator/AG.LND.ARBL.HA.PC
|
 Market
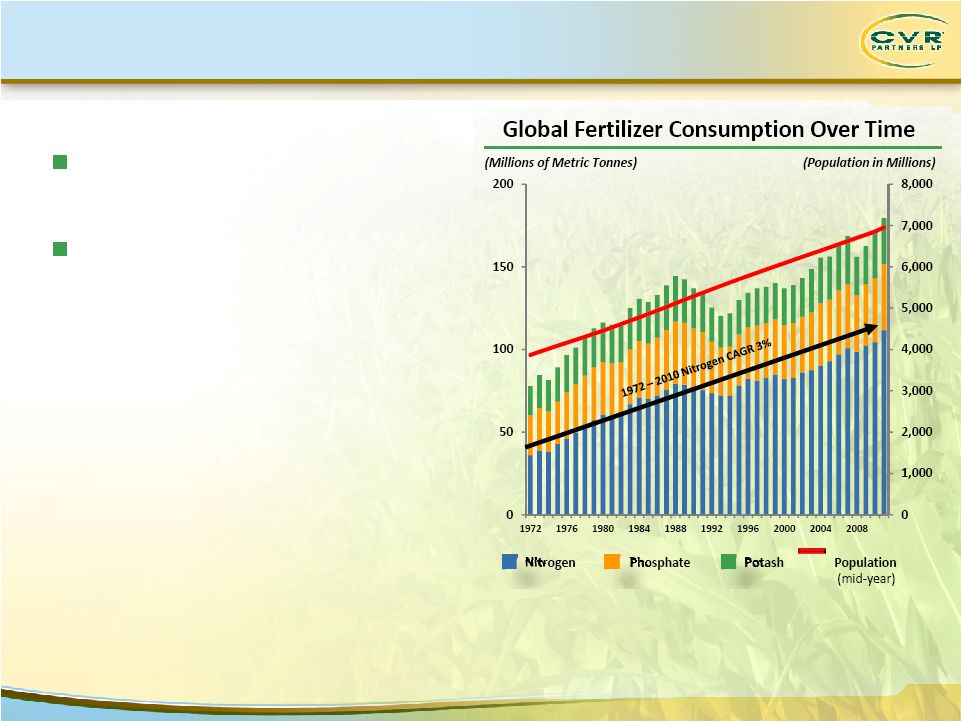
Fundamentals Consistent Fertilizer Demand Growth
13
1)
Per the International Fertilizer Industry Association
Nitrogen represents ~63% of fertilizer
consumption
(1)
Nitrogen based fertilizers have the
most stable demand because they all
must be applied annually
—
Primary determinant of crop yield
Note:
Nutrient Tonnes; Fertilizer Years.
Source:
International Fertilizer Industry Association; U.S. Bureau of the Census, International Data
Base |
 Market
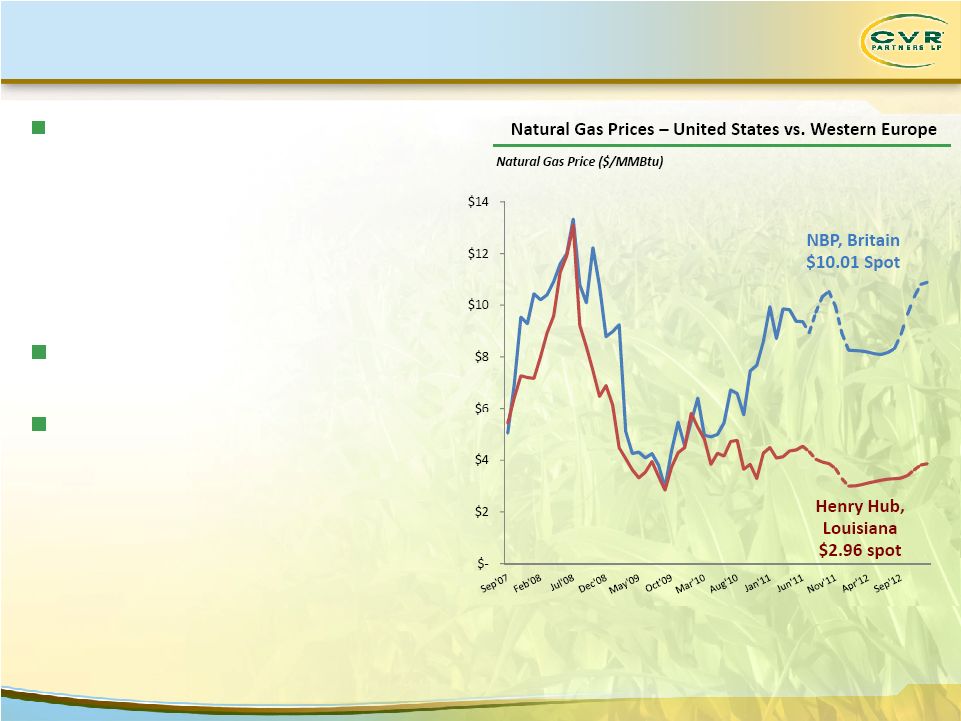
Fundamentals Global Shift in Cost of Production
14
Source:
European prices converted from GBP/Therm to $/MMBtu, based on daily exchange rate
Historical Sources: Capital IQ NBP Monthly Spot Rate, Henry Hub Monthly Spot Rate
Forecast Sources: Capital IQ NBP Forward Rate 01/06/12, Henry Hub Futures Nymex Exchange
01/06/12 Spot price as of 01/06/12
North America has shifted from being
a
high
cost region globally to a lower
cost
region
—
Shale gas has increased natural gas supply
—
Natural gas costs in North America have
declined
—
Russian gas to Ukraine increasingly priced on
market basis
U.S. imports nitrogen from Eastern Europe,
represents price floor for domestic product
Change in dynamics has served to
strengthen economic position of all North
American producers |
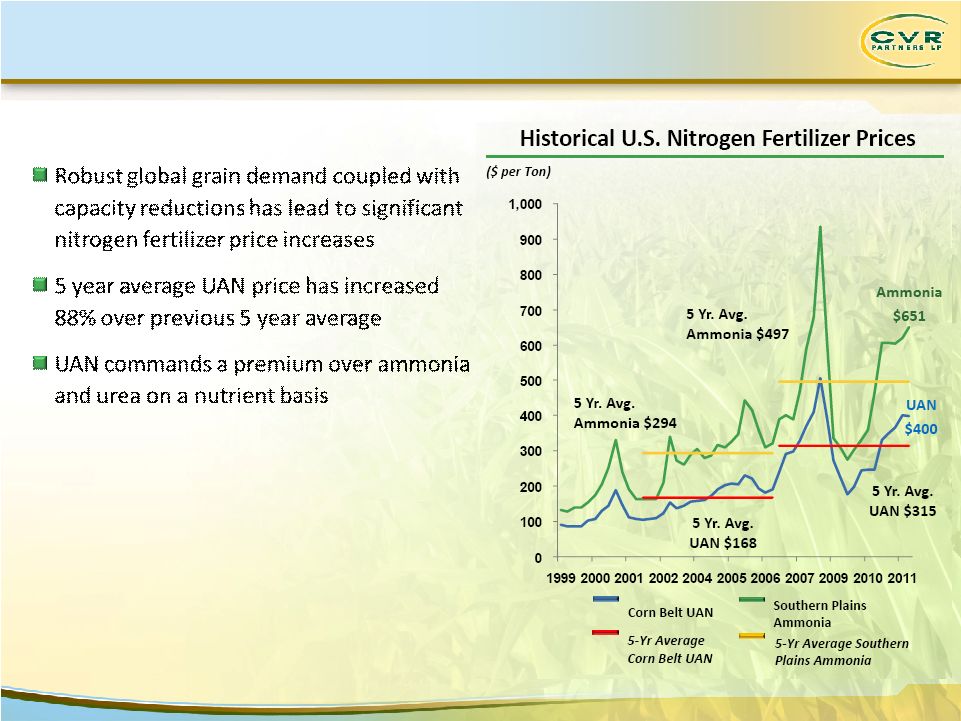
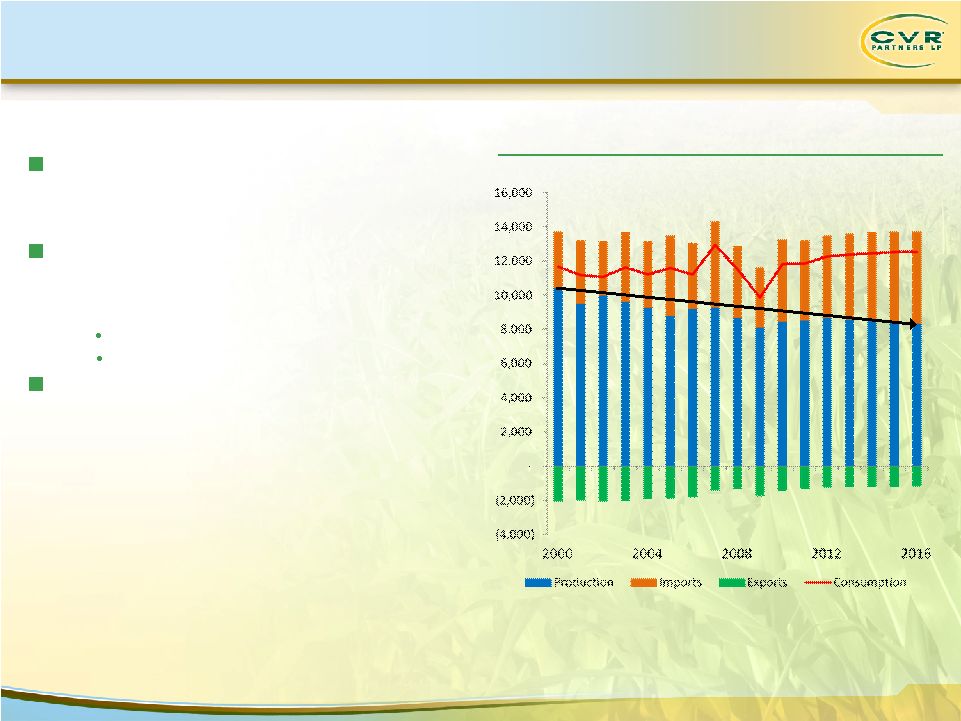 Market
Fundamentals Supply Rationalization and Consolidation
(000 Tonnes N)
Historical U.S. Nitrogen Production and Consumption
Source:
Fertecon
15
Between 1999 to 2010, U.S. nitrogen
fertilizer capacity was reduced by 34% as
producers shut down less attractive plants
Industry has also consolidated significantly
through mergers and acquisitions
—
Top 5 producers market share:
Today: 78%
2000: 56%
U.S. will continue to increase its net imports
of Nitrogen fertilizer |
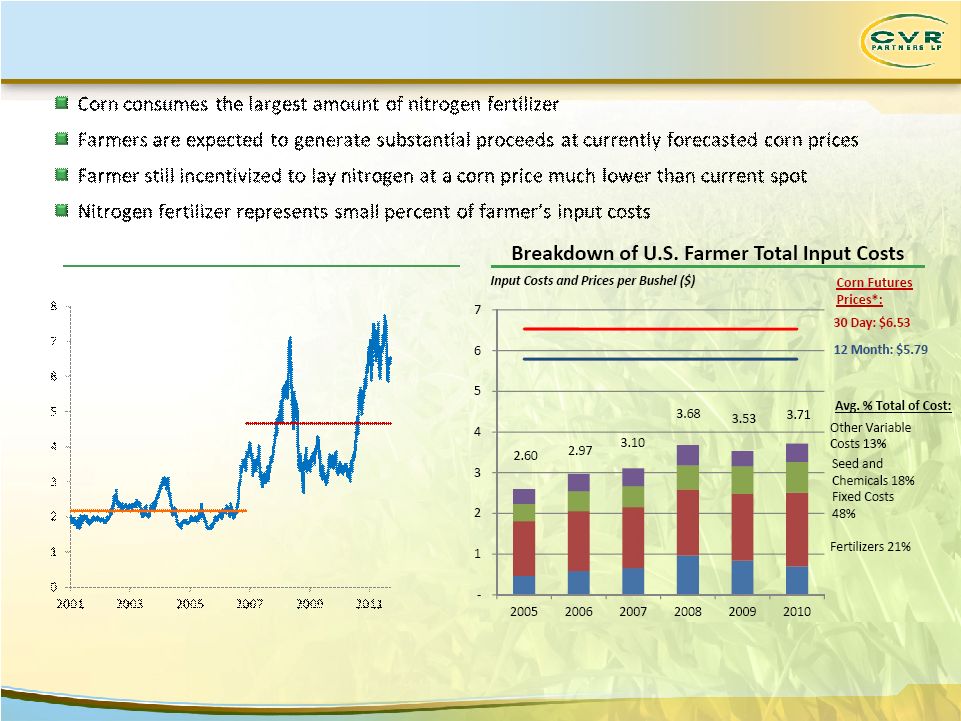 16
Market Fundamentals
Farmer Profitability Supports Fertilizer Pricing
Corn Spot Prices
Note: Fixed Costs include labor, machinery, land, taxes, insurance, and
other. 5-Yr Prior Avg.
$2.17
5-Yr Avg.
$4.67
Current
$6.43*
*As of Jan. 06, 2012
Source:
CIQ
*As of Jan. 06, 2012
Source:
CIQ,
USDA |
 Source:
Green Markets Data, Fertecon
17
Market Fundamental
Strong Pricing Environment |
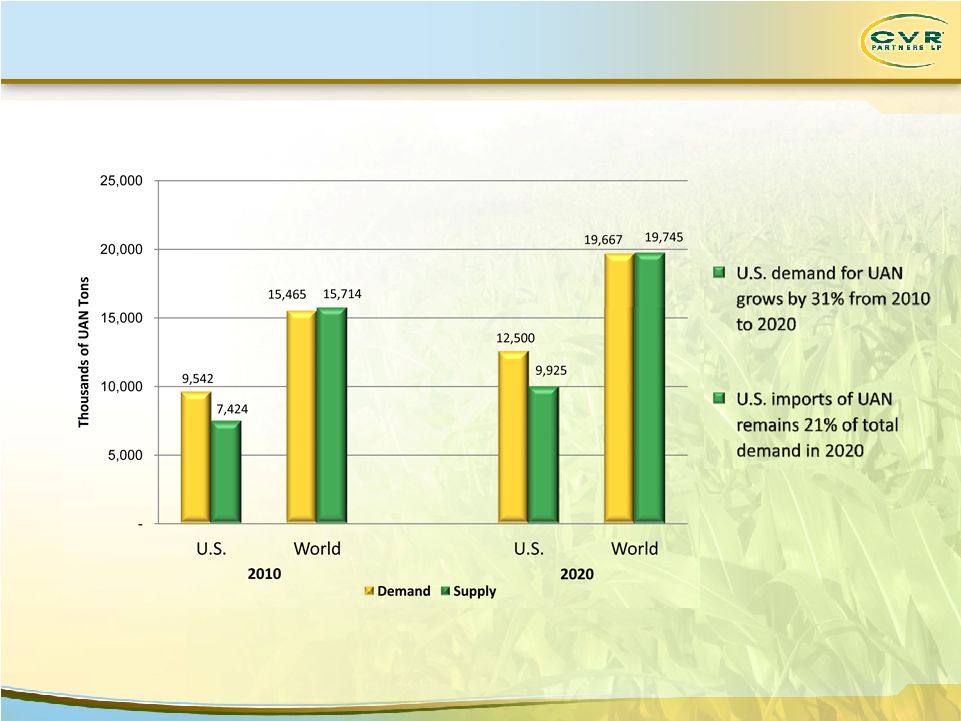 Market
Fundamentals UAN Demand Growth
Source:
Integer Focus Report 2011: Global Outlook for UAN
18
Demand Growth |
 Growth
Opportunities Growth Opportunities |
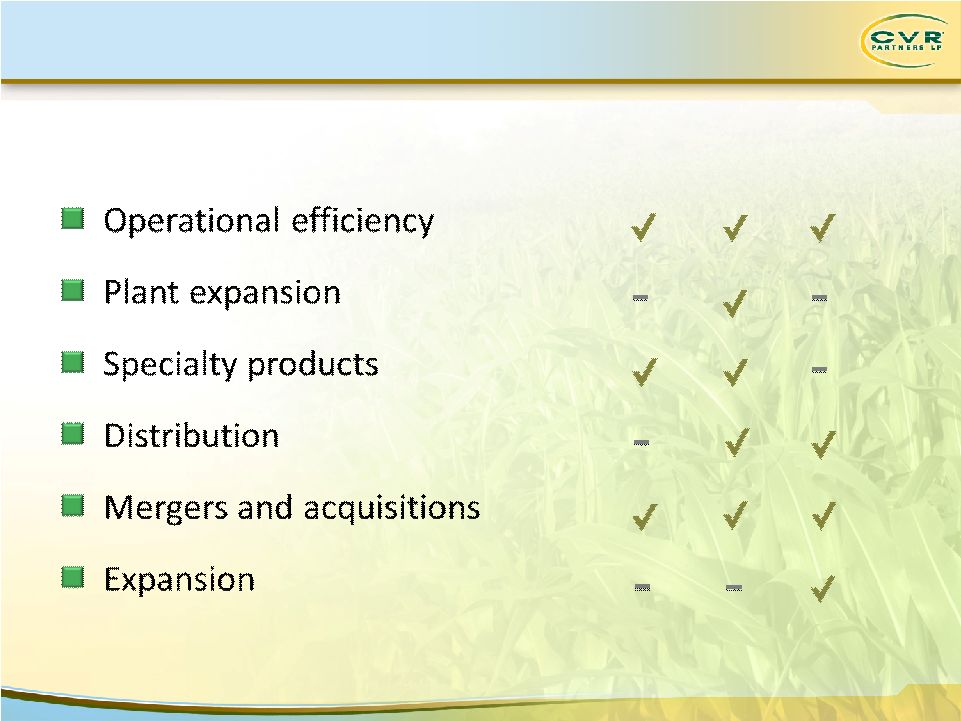 Growth
Opportunities 20
Current
12-24
Months
3-5
Years |
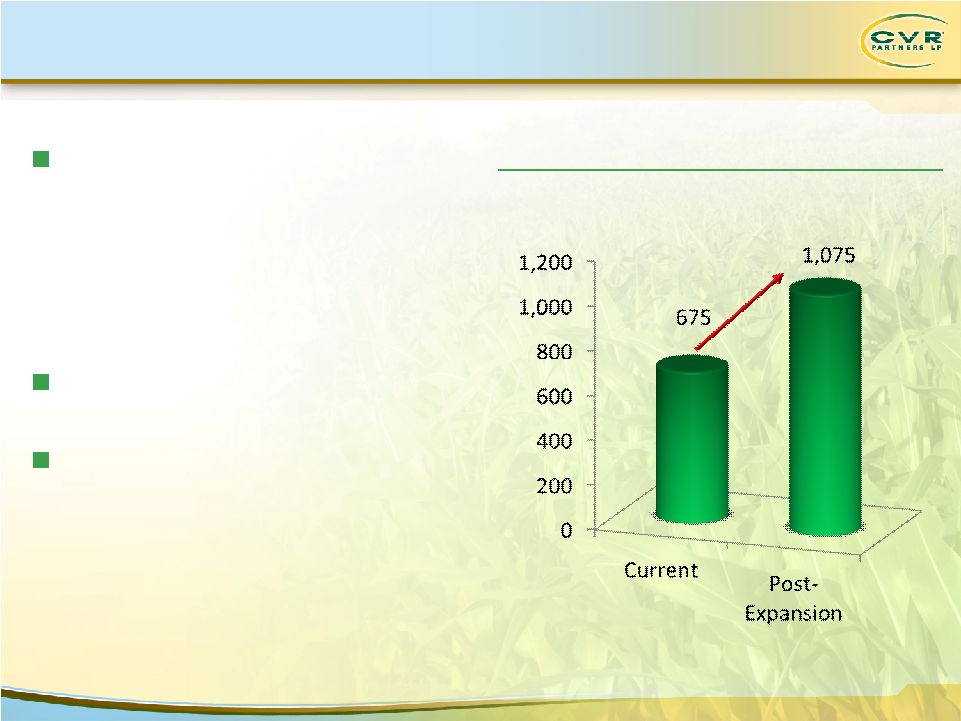 Growth
Opportunities UAN Expansion
(000’s Tons of UAN)
UAN Upgrading Capacity
1)
Excludes $5MM of capitalized interest
21
UAN expansion project
—
Increase exposure to strong UAN
market
dynamics
—
Expand UAN capacity by 400,000 tons per
year
or by ~50%
—
Provides flexibility to upgrade 100% of
ammonia
to
UAN
—
On-line in Q1 2013
Approximately $100MM cost to
complete
(1)
At current pricing, ROI exceeds 24% |
 Growth
Opportunities Diesel Emission Fluid (DEF)
22
* FERTECON
Ammonia
Outlook
–
Issue
2011
(3)
P.
81
DEF is the most widely accepted technology for reducing NOX and particulate
matter from diesel vehicle exhaust emissions
Solution
of
32.5%
urea
and
67.5%
water
injected
at
approximately
2%
of
fuel
consumption
North America forecasted DEF consumption in vehicle emission reduction*:
2011: 240,000 tones
2013: 530,000 tones
2015: 1,525,000 tones
2020: 3,462,000 tones |
 Growth
Opportunities Enhanced Distribution
23
Logistic assets are key to enhancing annual
margin during the shift between
application and fill season Target 60,000 –
70,000 tons per year of sales through
off premise storage facilities
Net margin increased by $15 per ton |
 Financial
Statistics Financial Statistics |
 1)
Plant gate price per ton represents net sales less freight costs
and hydrogen revenue (from hydrogen sales to CVR Energy’s refinery) divided by product
sales volume in tons in the reporting period. Plant gate price per ton is shown in order
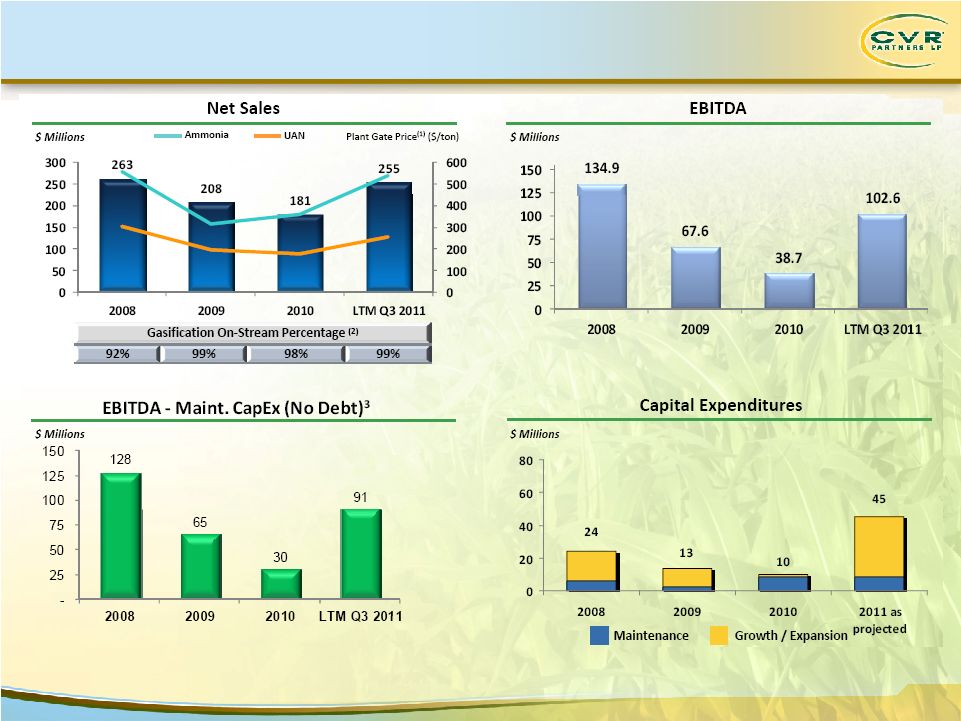
to provide a pricing measure that is comparable across the fertilizer industry. 2)
Adjusted for major scheduled turnaround, third-party outage on air separation unit and UAN
vessel rupture. 3)
Not Pro Forma for $125MM Term Loan
25
Financial Statistics |
 26
We expect our distribution for the 12 months ending March 31, 2012 to be at
least $1.92 per common unit yielding 7.3% as of January 12, 2012.
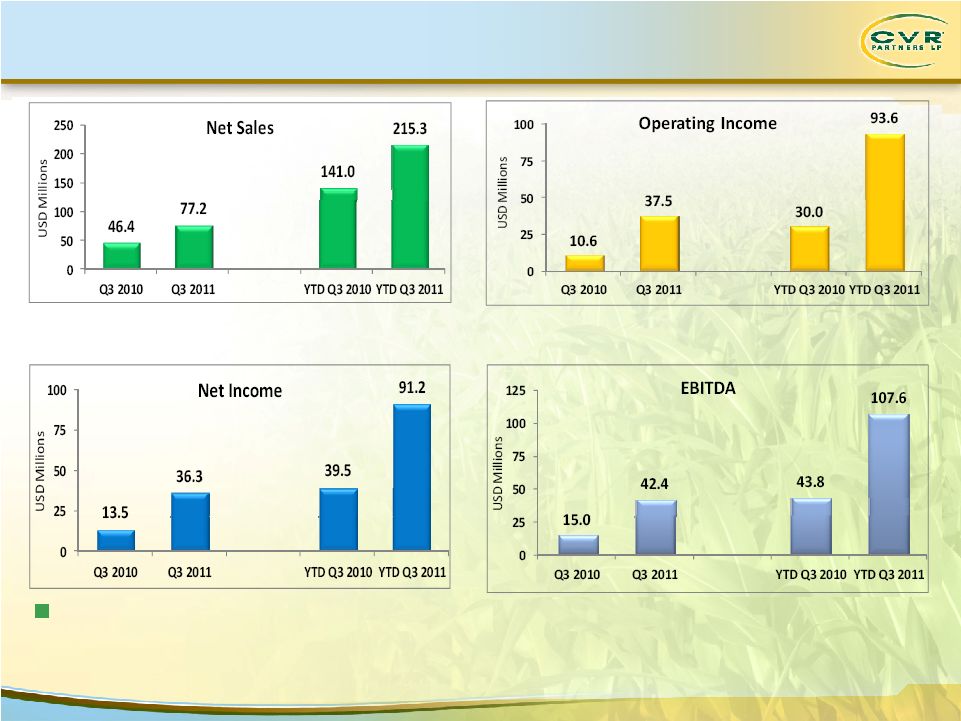
Financial Statistics
Strong YTD Financial Performance |
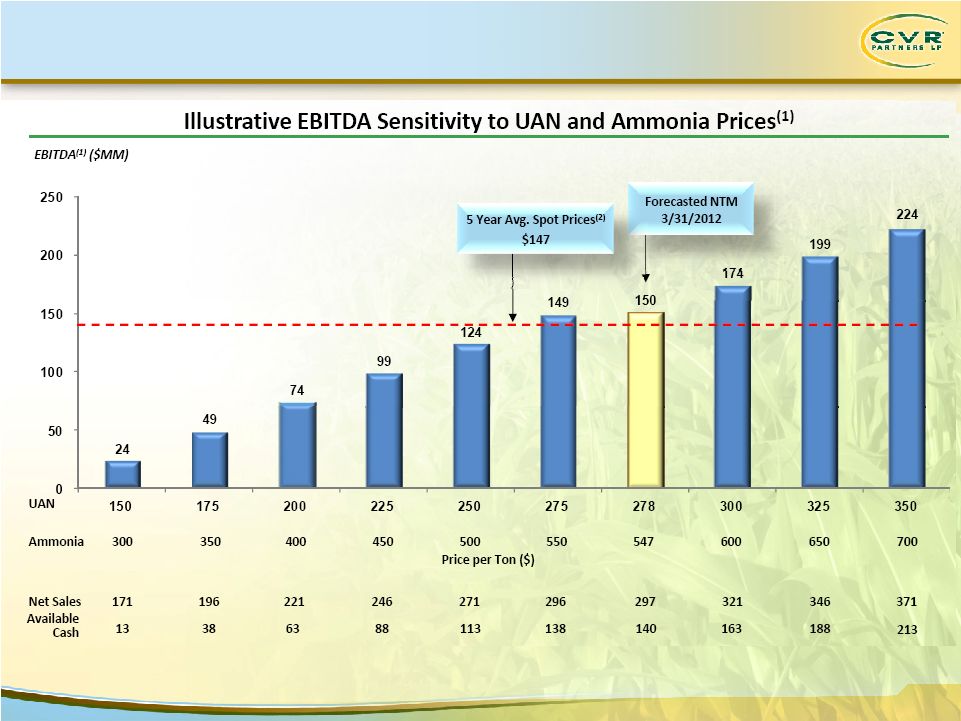 Financial
Statistics Forecasted Distributable Cash
1)
Based on projected cost structure as provided in our prospectus dated April 7, 2011.
2)
Based
on
5
year
average
Ammonia
and
UAN
spot
prices
of
$467/ton
and
$292/ton
respectively
and
forecasted
next
twelve
months
cost
structure.
27 |
 28
Strong industry fundamentals
High quality, strategically located assets
Premium product focus
Attractive growth opportunities
Pay out 100% of available cash each
quarter to Common Unitholders
No IDR’s
Experienced management team |
 29
Q & A |
 Appendix
 |
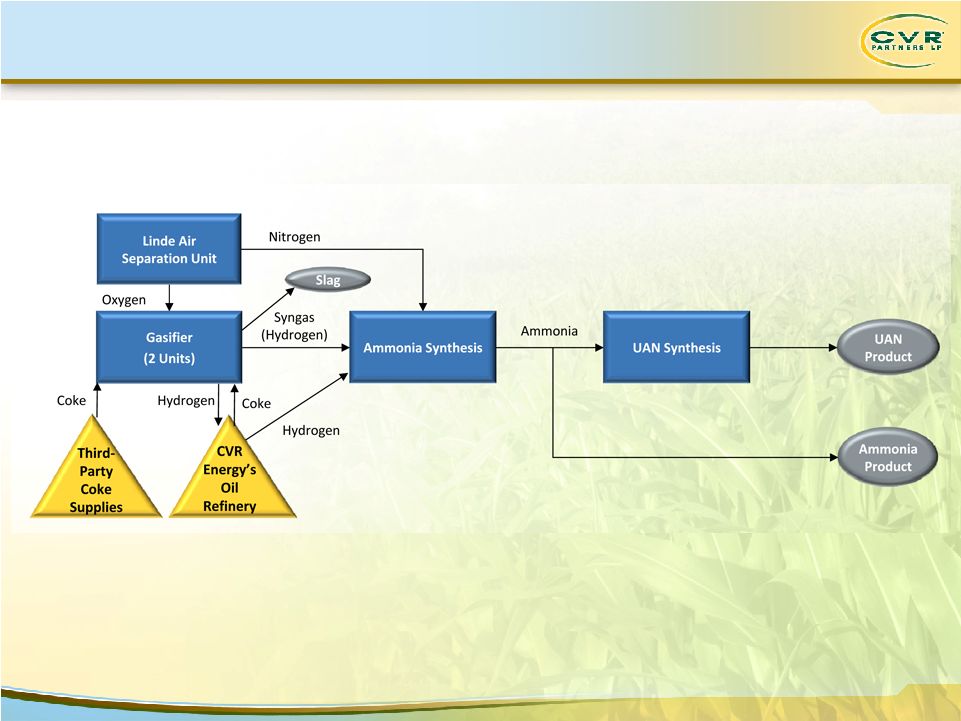 31
Manufacturing Process |
 32
To
supplement
the
actual
results
in
accordance
with
U.S.
generally
accepted
accounting
principles
(GAAP),
for
the
applicable
periods,
the
Company
also
uses
certain
non-GAAP
financial
measures
as
discussed
below,
which
are
adjusted
for
GAAP-based
results.
The
use
of
non-GAAP
adjustments
are
not
in
accordance
with
or
an
alternative
for
GAAP.
The
adjustments
are
provided
to
enhance
the
overall
understanding
of
the
Company’s
financial
performance
for
the
applicable
periods
and
are
also
indicators
that
management
utilizes
for
planning
and
forecasting
future
periods.
The
non-GAAP
measures
utilized
by
the
Company
are
not
necessarily
comparable
to
similarly
titled
measures
of
other
companies.
The
Company
believes
that
the
presentation
of
non-GAAP
financial
measures
provides
useful
information
to
investors
regarding
the
Company’s
financial
condition
and
results
of
operations
because
these
measures,
when
used
in
conjunction
with
related
GAAP
financial
measures
(i)
together
provide
a
more
comprehensive
view
of
the
Company’s
core
operations
and
ability
to
generate
cash
flow,
(ii)
provide
investors
with
the
financial
analytical
framework
upon
which
management
bases
financial
and
operational
planning
decisions,
and
(iii)
presents
measurements
that
investors
and
rating
agencies
have
indicated
to
management
are
useful
to
them
in
assessing
the
Company
and
its
results
of
operations.
Non-GAAP Financial Measures |
 33
EBITDA:
EBITDA
represents
net
income
before
the
effect
of
interest
expense,
interest
income,
income
tax
expense
(benefit)
and
depreciation
and
amortization.
EBITDA
is
not
a
calculation
based
upon
GAAP;
however,
the
amounts
included
in
EBITDA
are
derived
from
amounts
included
in
the
consolidated
statement
of
operations
of
the
Company.
Non-GAAP Financial Measures |
 34
Below is a reconciliation of Net Income to EBITDA
(In USD Millions)
2008
2009
2010
LTM Q3 2011
Net Income
$118.9
$57.9
$33.3
$85.0
Interest expense
-
-
-
2.7
Interest (income)
(2.0)
(9.0)
(13.1)
(3.6)
Depreciation and amortization
18.0
18.7
18.5
18.5
Income tax expense
-
-
-
-
EBITDA
$ 134.9
$ 67.6
$38.7
$102.6
Non-GAAP Financial Measures |
 35
Below is a reconciliation of Net Income to EBITDA
Three Months Ended
Nine Months Ended
September 30,
September 30,
2011
2010
2011
2010
(in millions)
(unaudited)
Net Income
$ 36.3
$ 13.5
$ 91.2
$ 39.5
Adjustments:
Depreciation and amortization
4.7
4.5
13.9
13.9
Interest (income) expense
1.4
(3.0)
2.5
(9.6)
Tax provision
-
-
-
EBITDA
$ 42.4
$ 15.0
$ 107.6
$ 43.8
Non-GAAP Financial Measures |