Attached files
| file | filename |
|---|---|
| 8-K - FORM 8-K - rue21, inc. | d279550d8k.htm |
 Exhibit 99.1 |
 Safe
Harbor Statement Certain statements in this presentation and responses to various
questions may be “forward-looking statements” which reflect the
company’s current expectations or beliefs concerning future events.
Actual results of operations may differ materially from historical
results or current expectations. Any such forward-looking statements
are subject to various risks and uncertainties, including the strength
of the economy, changes in the overall level of consumer spending or
preferences in apparel, our ability to compete with other retailers, the
performance of the company’s products within the prevailing retail
environment, our strategy and expansion plans, reliance on key
personnel, trade restrictions, political or financial instability in
countries where the company’s goods are manufactured, availability
of suitable store locations at appropriate terms and other factors
which are set forth in the company’s SEC filings, which are available
on our website. |
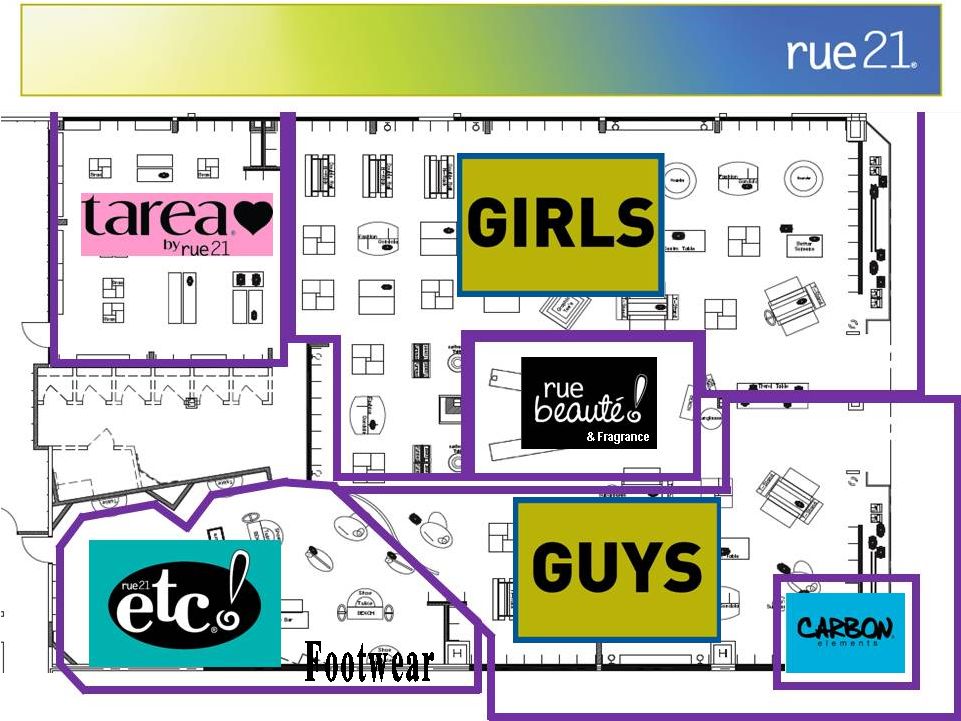
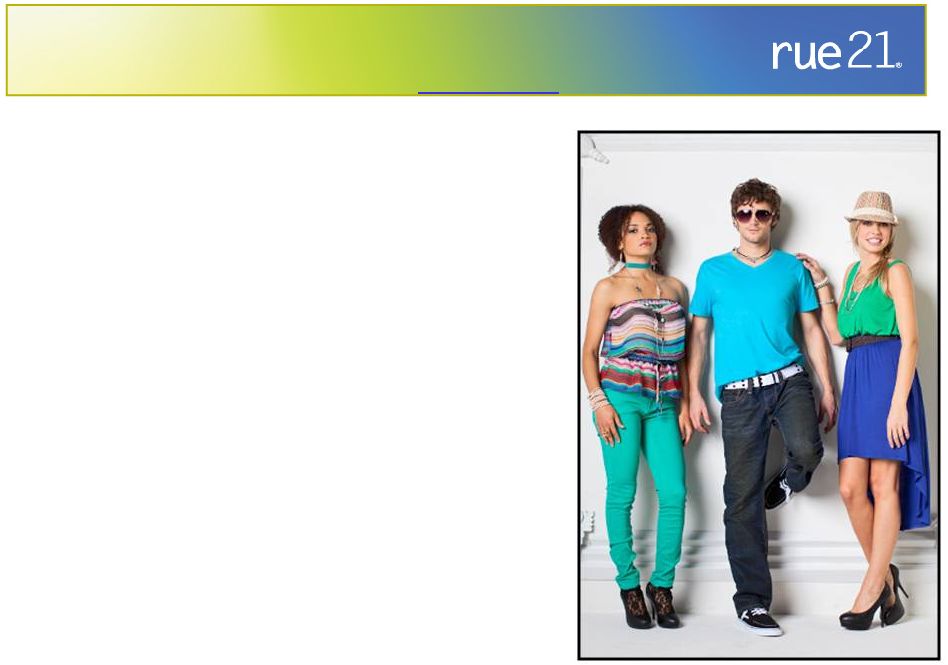
 Product:
diversified, branded, exclusive labels
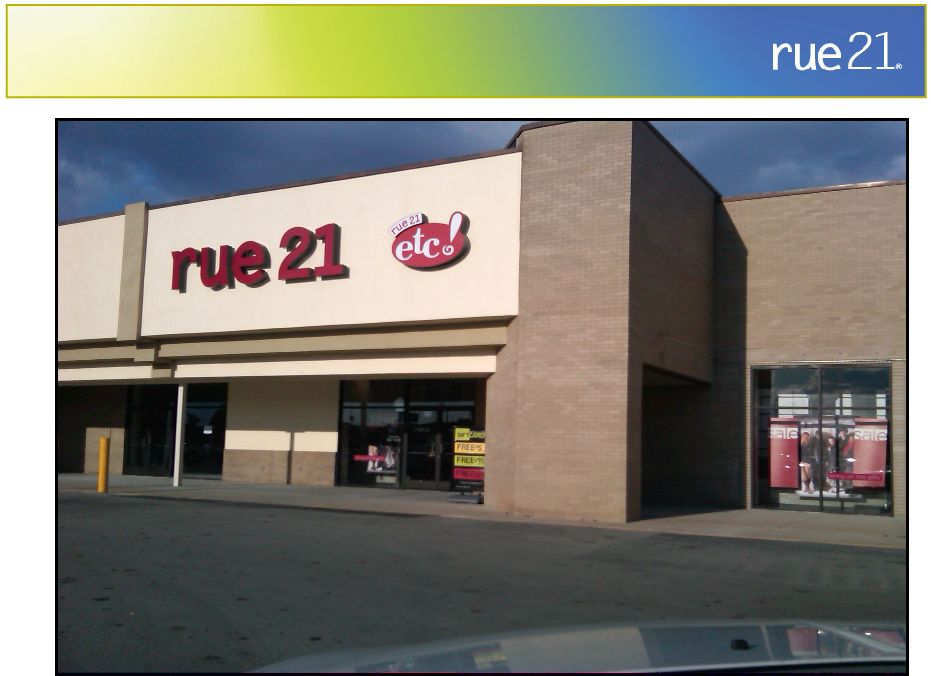
Real Estate
flexibility
Square Footage Growth
opportunity
Management
Team
depth
and
experience
System Infrastructure
continually
investing for the future
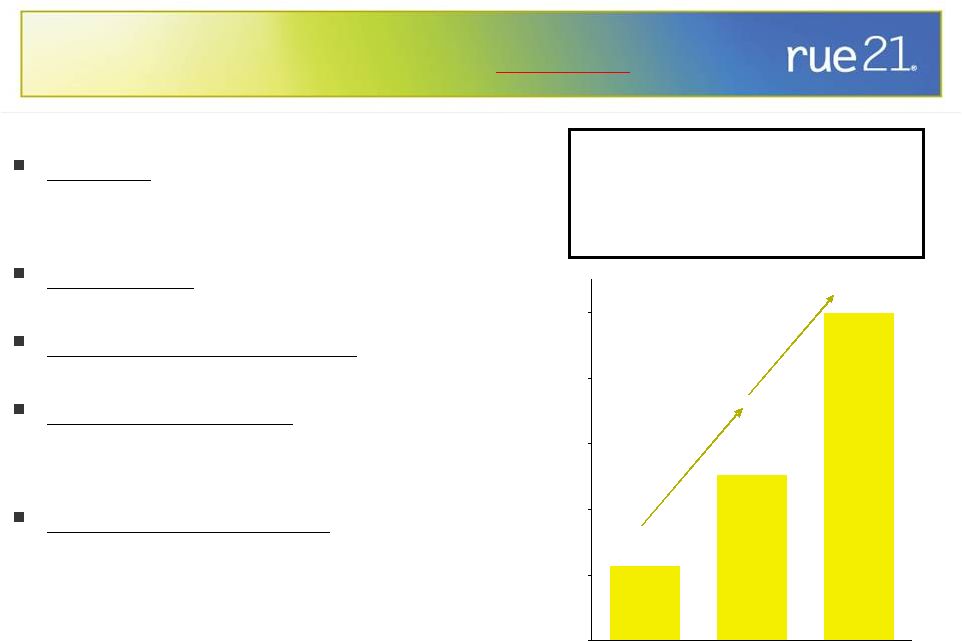
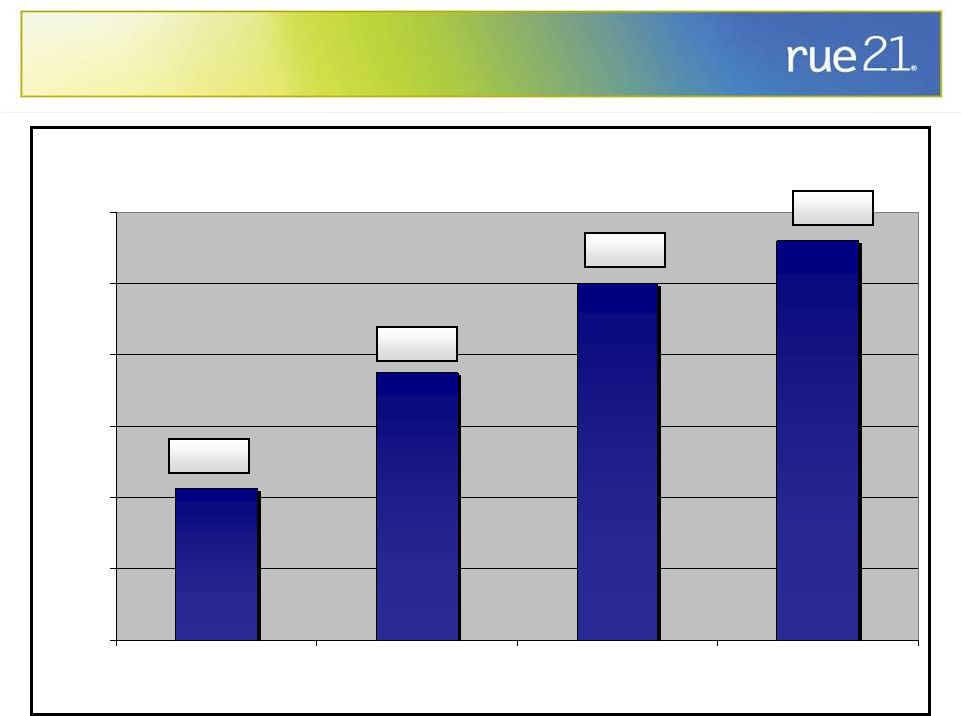
Doubled Store Base Twice!
and Plan to Do It Again!
352
755
1,500
0
300
600
800
1,000
1,500
2007
2011
2018E
Over 2x
Over 2x
Who
is
rue21
and
how
do
we
generate
predictable
growth? |
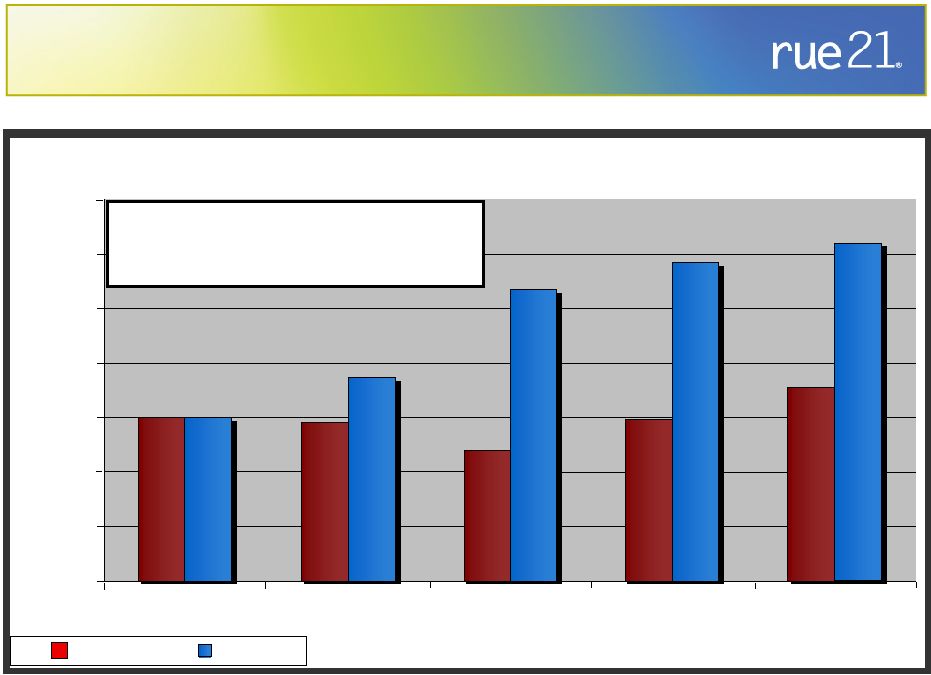
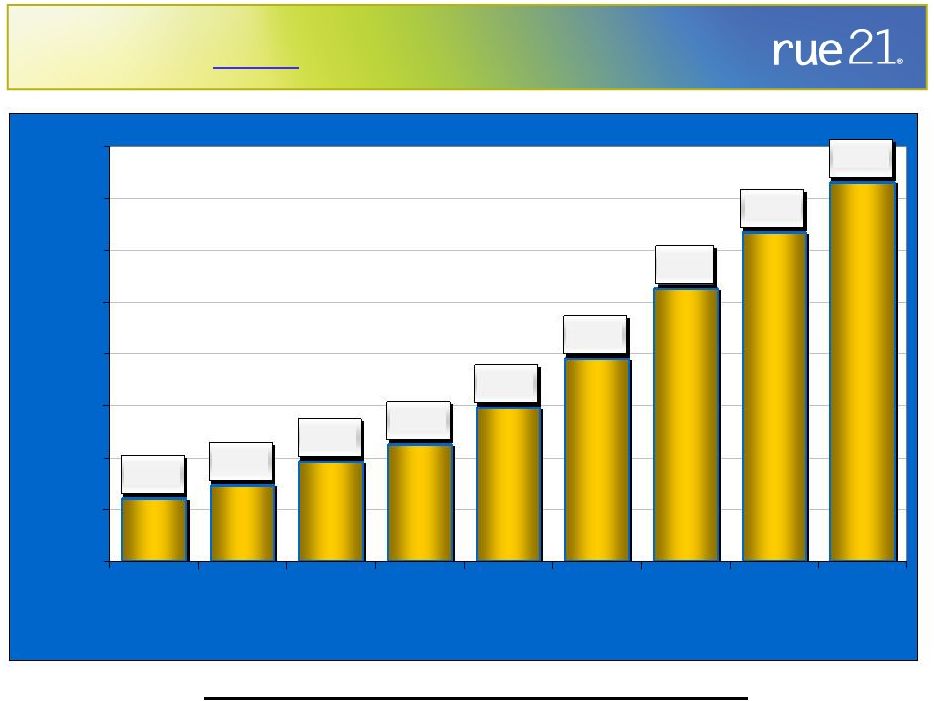 Consistent
Total Sales Growth
Compound Sales Growth of 28% over 7 yrs.
Millions
$0.0
$100.0
$200.0
$300.0
$400.0
$500.0
$600.0
$700.0
$800.0
2003
2004
2005
2006
2007
2008
2009
2010
3Q '11
TTM
$120.6
$146.9
$192.8
$225.6
$296.9
$391.4
$730.5
$634.7
$525.6 |
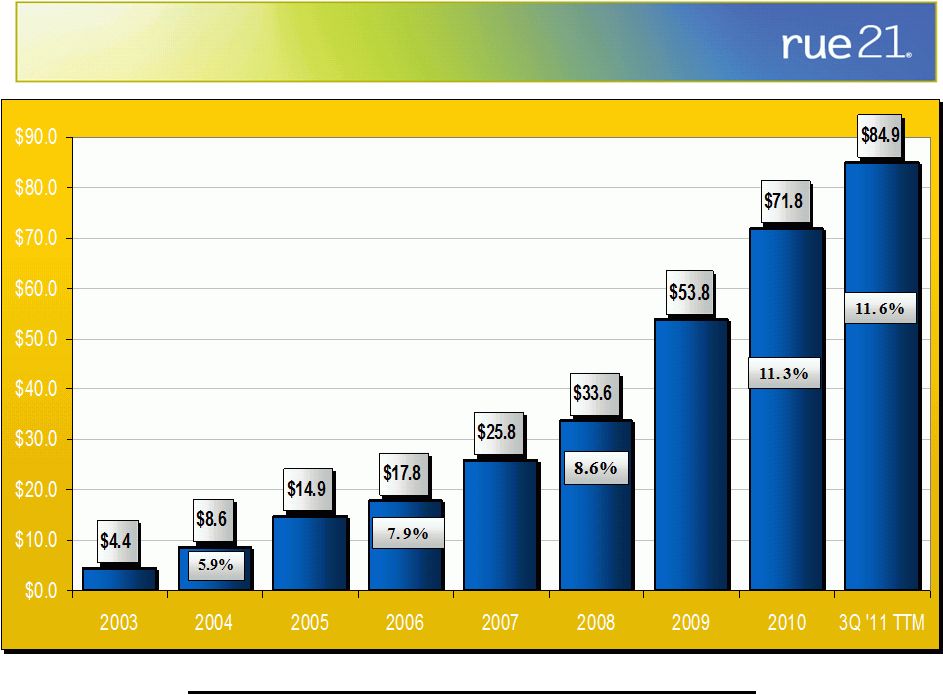 Compound
EBITDA Growth of 49% over 7 yrs. Proven Earnings Growth and Margin Expansion
Millions |
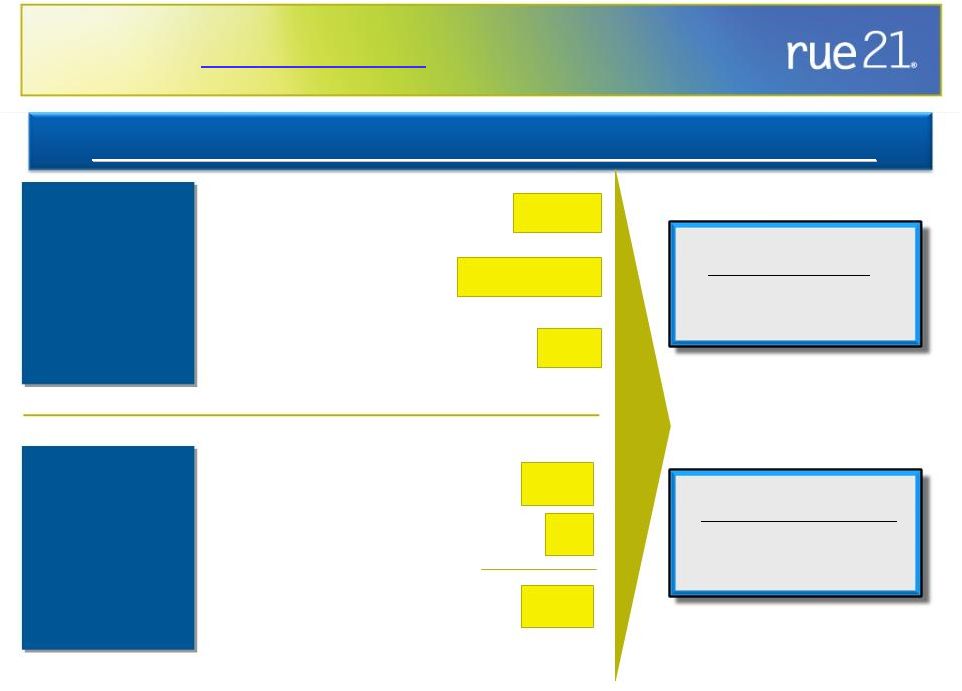
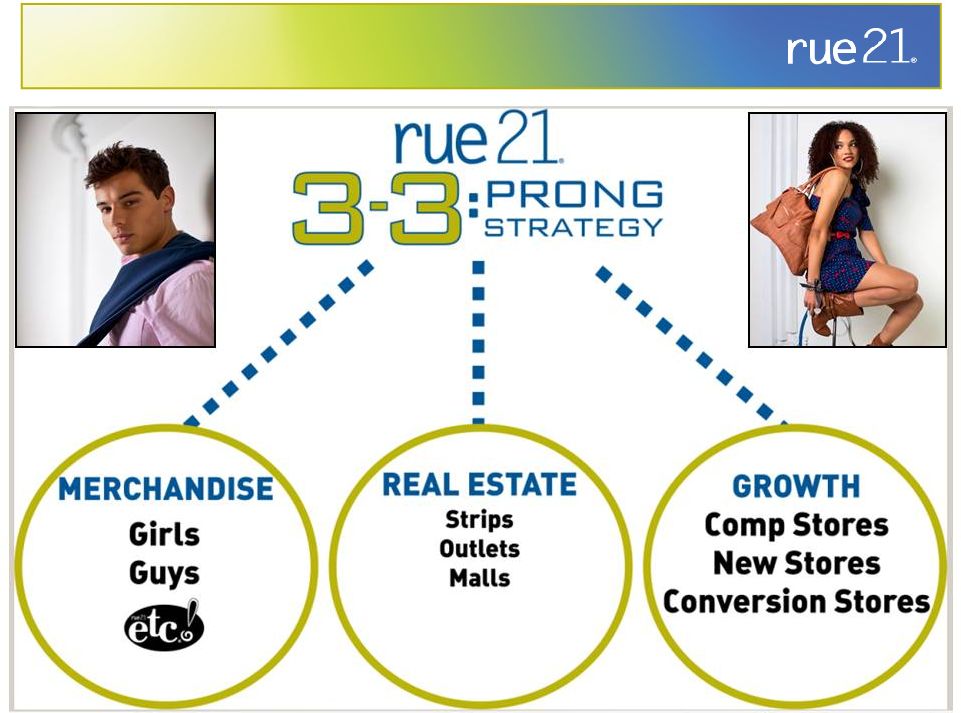 Historical
Predictable Growth From 3 –
3 Pronged Strategy |
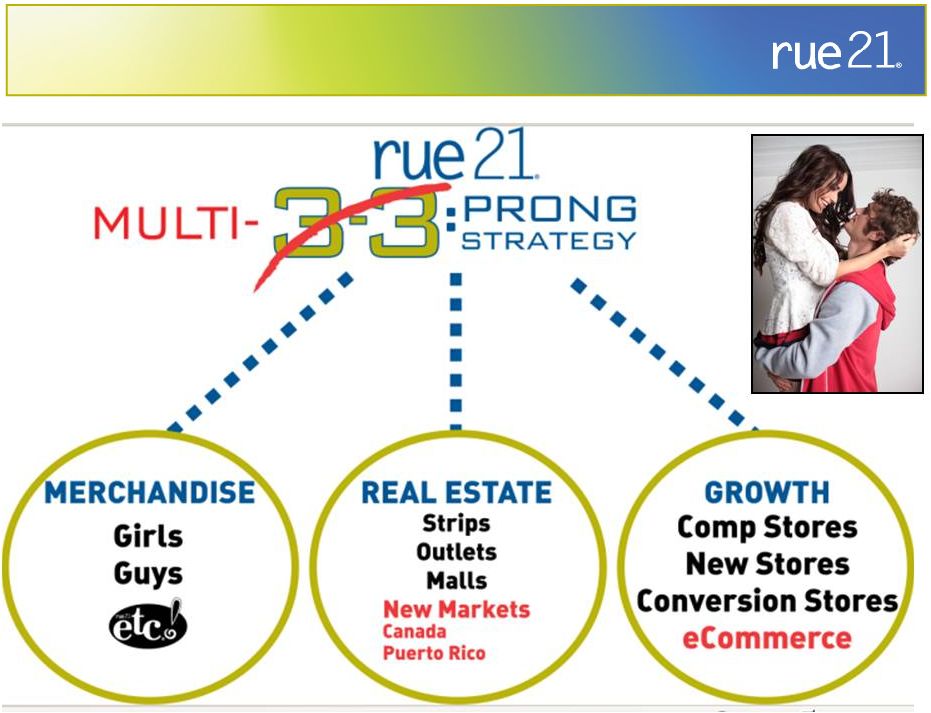 Future
Predictable Growth From Multi-Pronged Strategy Future Predictable Growth From Multi-Pronged Strategy |
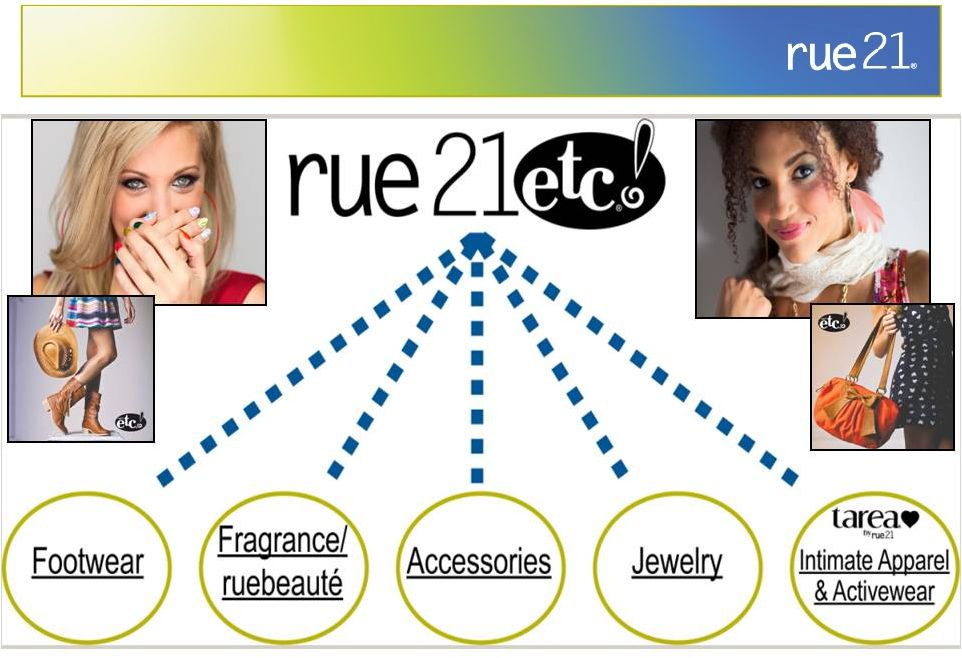 Comp
Drivers–Continuing Accessories Diversification Represents
26%
of business and growing |
 &
Fragrance Comp Drivers
Comp Drivers
–
–
Diverse
Diverse
Branded
Branded
Product
Product
Offerings
Offerings |
 Comp
Drivers – Expanding Fashion Offerings
at everyday
rue21 value
•
“club rue”
•
active sportswear
•
denim, good, better, best
•
guys business including
denim and accessories
•
dresses
•
buy back programs |
 Continuing Attractive U.S. Real Estate Opportunities
Growth Potential by U.S. Shopping Center Type
rue21 Current Store Count
Identified Location
Share
Strip Centers
Regional Mall
Outlet Center
395
250
110
2,500
1,100
175
16%
23%
63%
Total
755
3,775
20%
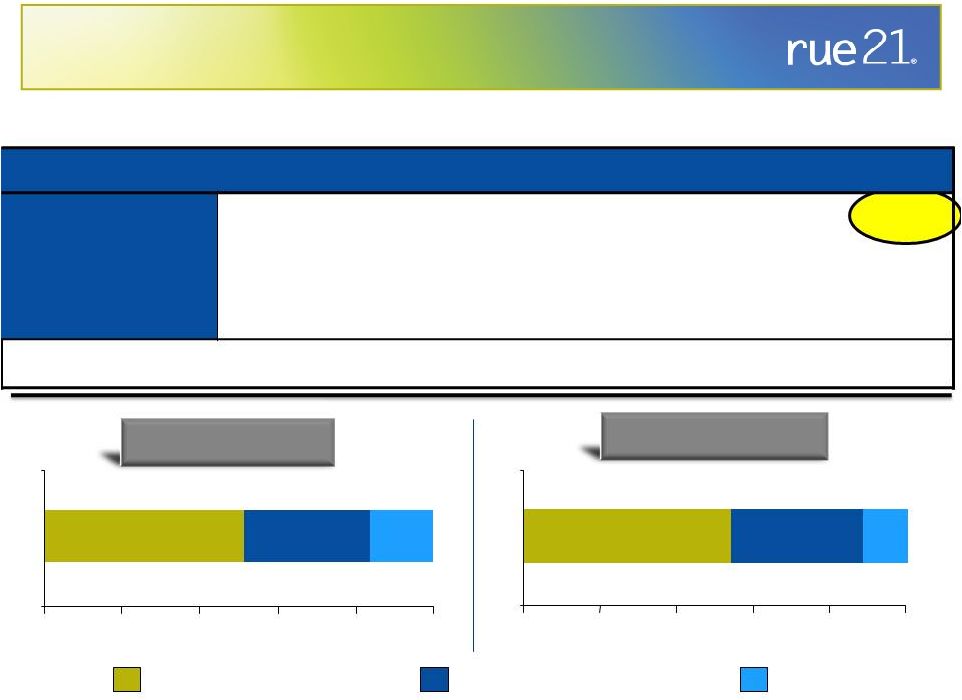
Current Store Mix
Current Store Mix
Future Store Mix
Future Store Mix
51.6%
33.0%
15.4%
0%
20%
40%
60%
80%
100%
Strip Centers
Regional Malls
Outlet
35%
0%
20%
40%
60%
80%
100%
10%
55% |
 London,
KY |
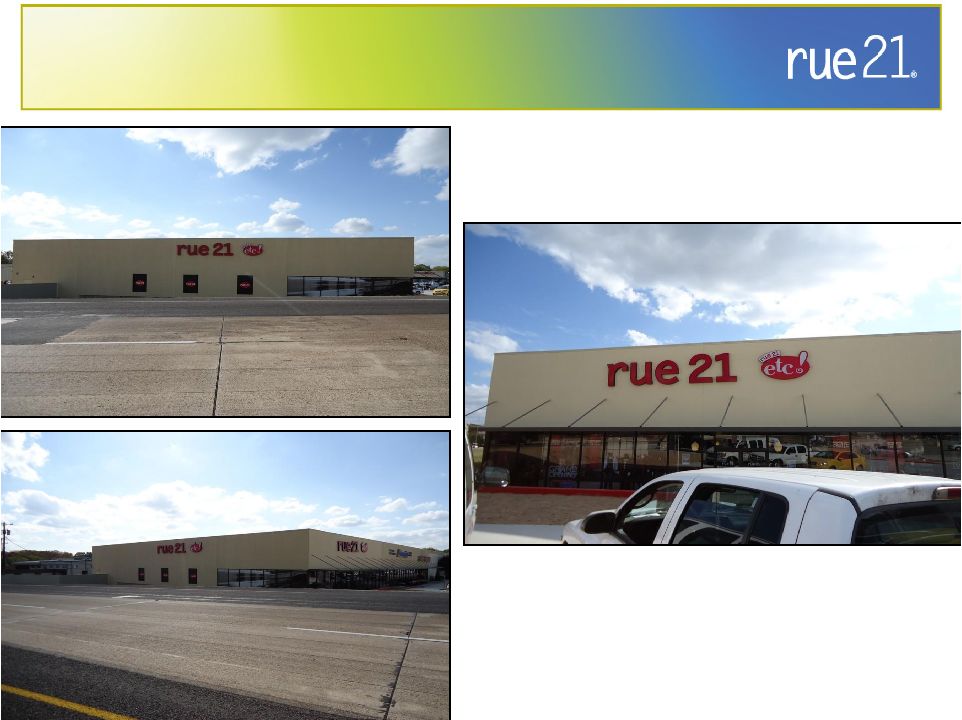 Paris,
TX |
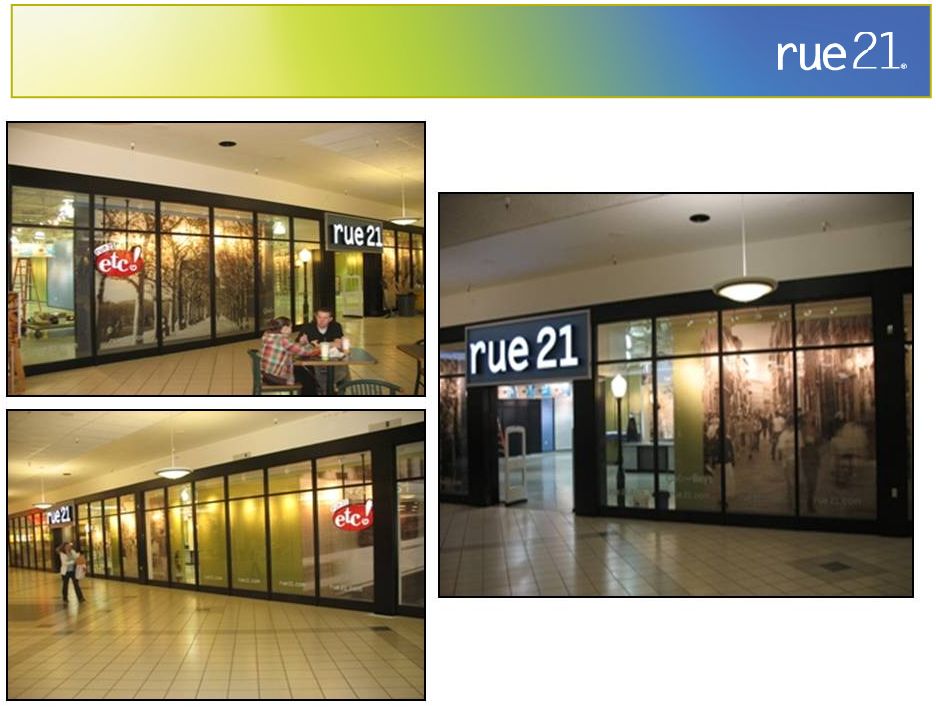 Moscow,
ID |
 Employee
Development & Operations Execution “rueniversity”
–
global training tool used for all field employees
•
Expansion
of
Operations
Executive
Team
-
Zone
Vice
President
positions
added
•
Operations Technology Committee –
Executive team focused on field systems
“MAD”–
Management Advancement Development
for up & coming Potential DM’s, Managers and Assistants
“S-O-S”
–
Store
Opening
Specialists
Power teams that assist Managers and DM’s opening new
stores that spread the Fun and Lively rue21 Culture
Throughout the Organization
•
Strengthening
of
HR
Team
–
VP
of
Talent
Management,
regional
recruiters,
HRIS
systems leads added |
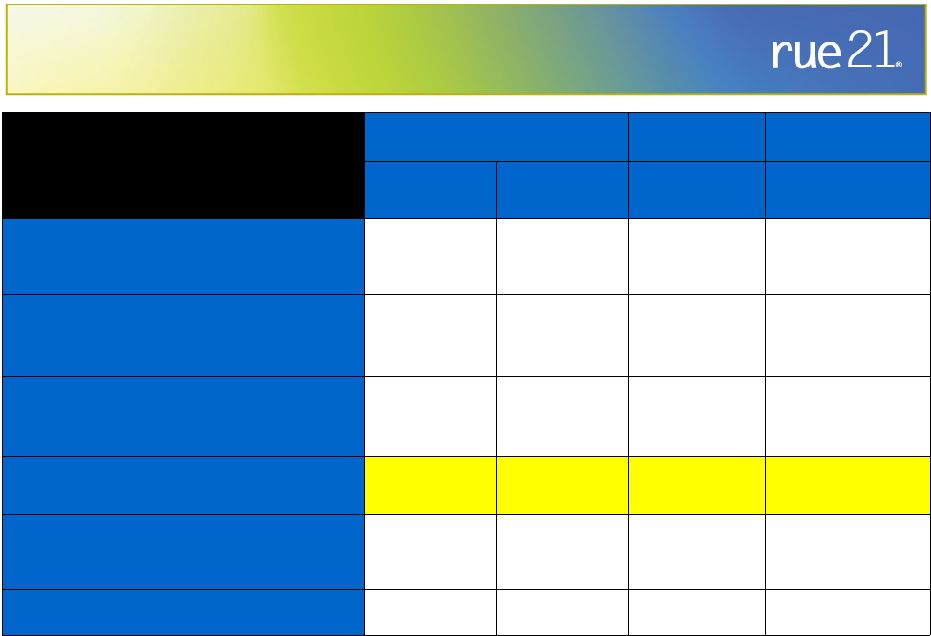 Margin
Expansion Opportunity 6.0 -
7.0%
5.1%
4.8%
4.2%
Net Income
10.5 -
11.0%
8.2%
7.8%
6.9%
Pre-Tax Income Margin
10.5%
8.2%
7.9%
7.0%
Operating Income Margin
3.0%
3.5%
3.4%
3.2%
Depreciation and
Amortization
25.0 -
25.5%
25.9%
25.7%
25.5%
Selling, General and
Administrative
38.5 -
39.0%
37.5%
37.0%
35.8%
Gross Margin
GOAL
Oct-11
Jan -11
Jan -10
Long Term
TTM
Years Ended |
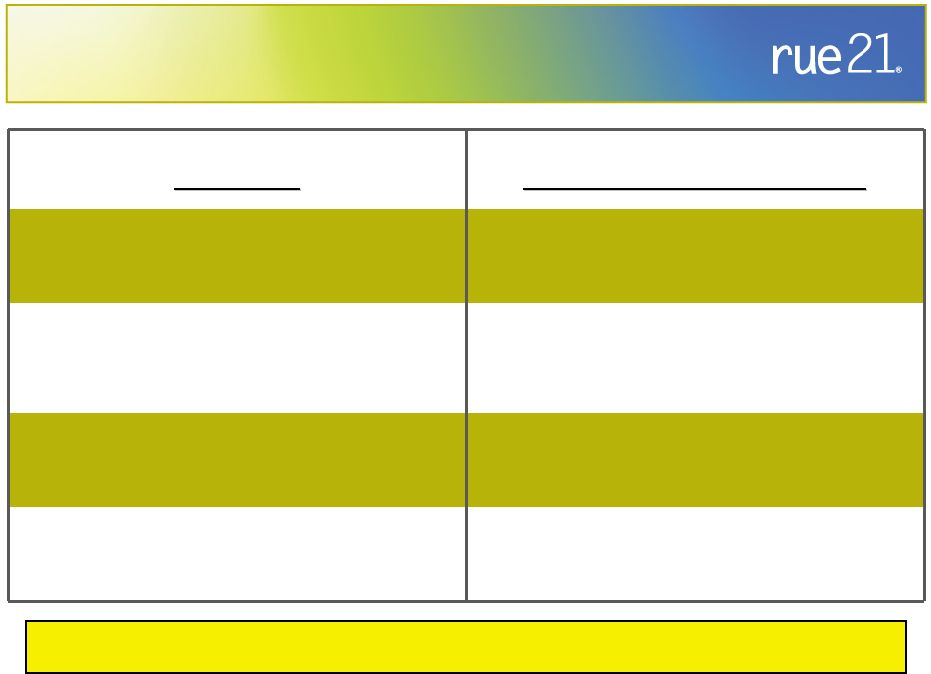
 Status
Investments Made to Support Our Growth
Headquarters
Commentary
Systems
Software –
latest releases, ERP, financial, real
estate, HRIS with state of the art hardware
Planning and Allocation Systems
Headquarters recently expanded to 84,000 sq
ft to support 25% future associate growth
Team
Focus on recruiting and talent management
Expanded field management organization &
focus
Distribution Center
Doubled DC square footage to support up to
1,600 stores with potential eCommerce
incubator |
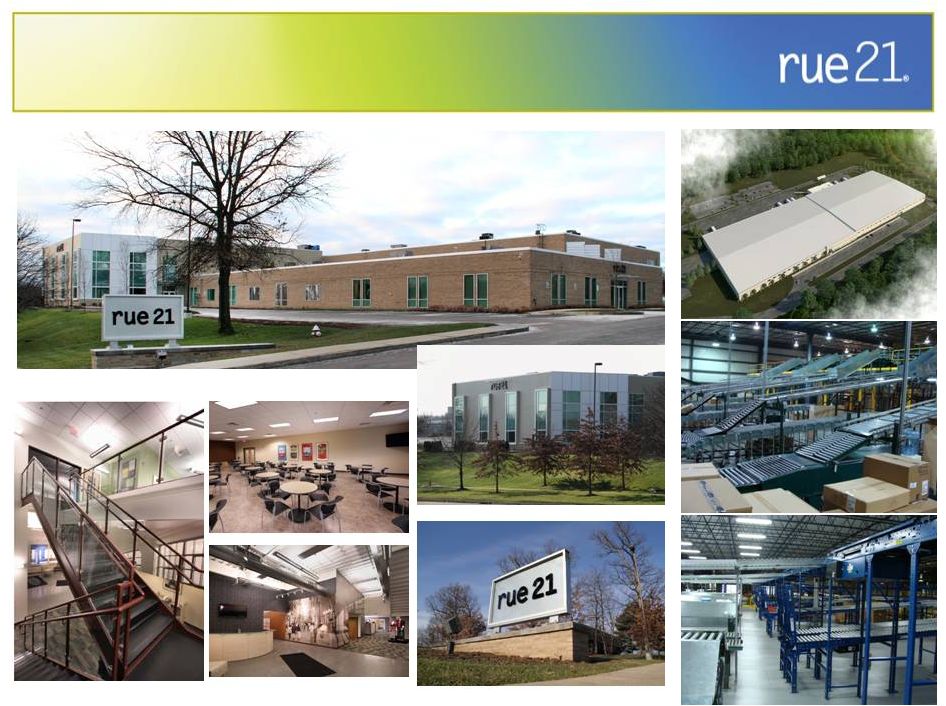 DC space
doubled and HQ space tripled |
 Note:
Dollars in thousands. Contribution
Contribution
Investment
Investment
~5,200
19%
$900 -
$1,100
$130
40
$170
Payback Period
Less Than 1 Year
Pre-tax ROIC
> 100%
Compelling and Continuing
New Store Economics
High-Return Stores That Payback Investment in Less Than a Year
High-Return Stores That Payback Investment in Less Than a Year
•
Average store size (sq ft) •
Annual sales (year
1) •
4-wall contribution (year 1) •
Net Build-out
•
Net Inventory
•
Total Investment
|
 rue21 Gross
Margin 32.0%
33.0%
34.0%
35.0%
36.0%
37.0%
38.0%
FY08
FY09
FY10
Q3 FY11
TTM
34.1%
35.8%
37.5%
37.0%
Consistent Long Term Gross Margin Growth |
 Real
Gross Margin Long Term Gains |
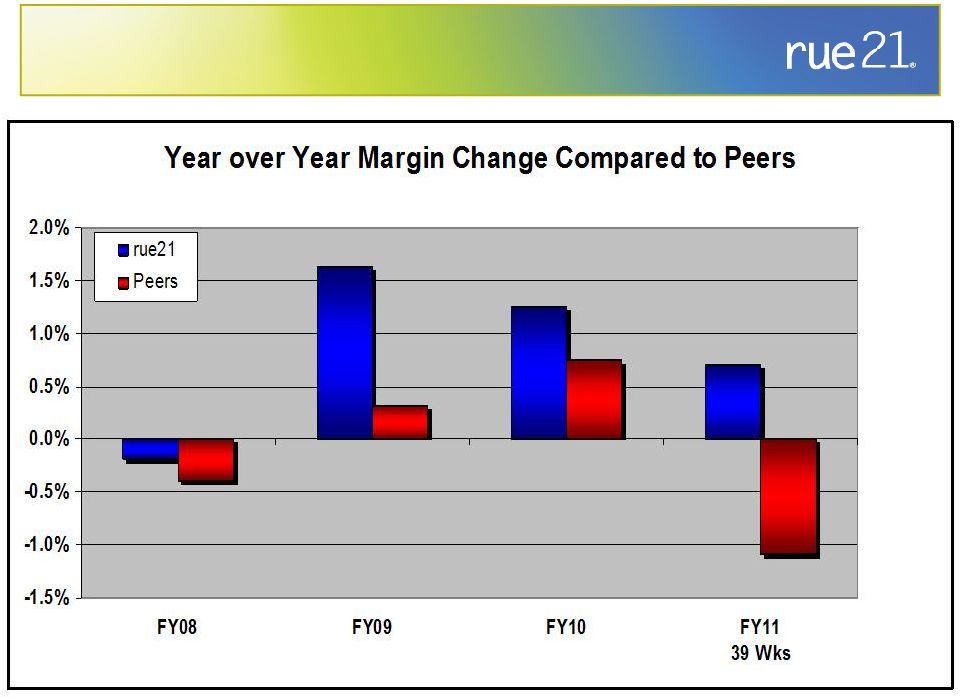
 Real and
Consistent Long Term Comp Sales Gains $100 Valued by Successive Comp Store %
Performances $103.70
$111.79
$114.14
$115.89
$99.47
$96.94
$99.78
$102.80
$100.00
$100.00
$85.00
$90.00
$95.00
$100.00
$105.00
$110.00
$115.00
$120.00
2007
2008
2009
2010
FY 11
39 wks
Peers
rue21
3 year average comp growth
for rue 21 4.5% vs. -0.1% peer group |
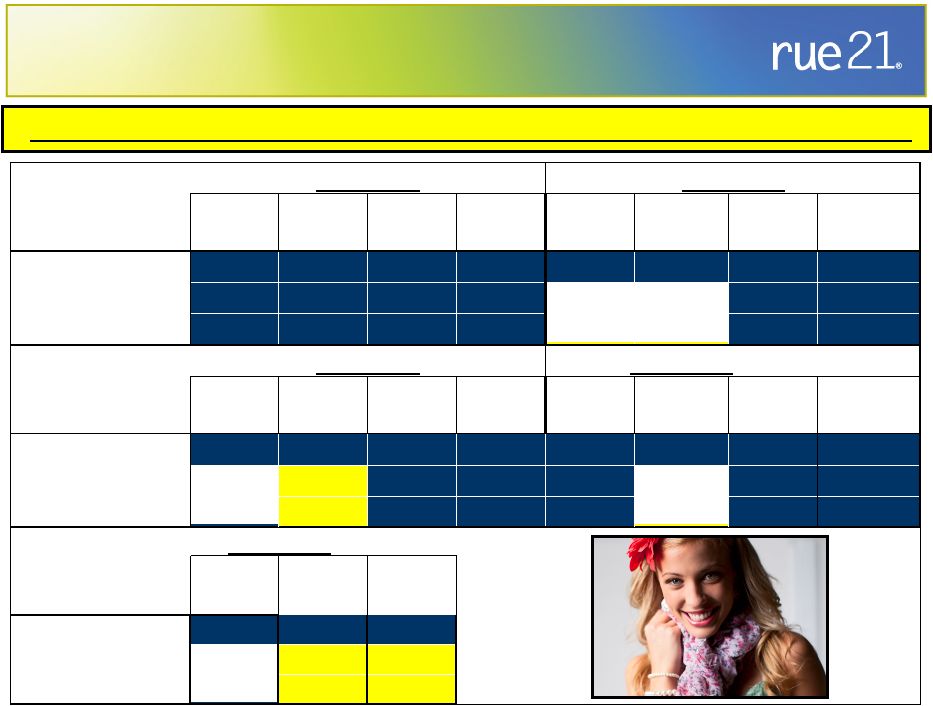     Expansion of
Net Income First
Second
Third
Fourth
First
Second
Third
Fourth
Quarter
Quarter
Quarter
Quarter
Quarter
Quarter
Quarter
Quarter
Net Sales Growth
40.1%
42.0%
27.9%
20.9%
20.4%
26.9%
33.6%
43.6%
Net Income Growth
249.7%
59.0%
50.9%
22.5%
56.3%
31.2%
55.8%
33.1%
Comp Store Sales
12.7%
8.9%
9.8%
1.8%
-5.2%
0.7%
6.6%
11.2%
First
Second
Third
Fourth
First
Second
Third
Fourth
Quarter
Quarter
Quarter
Quarter
Quarter
Quarter
Quarter
Quarter
Net Sales Growth
40.7%
27.6%
40.7%
30.5%
27.6%
14.3%
19.5%
22.3%
Net Income Growth
257.5%
23.5%
106.9%
67.9%
94.7%
20.0%
19.5%
41.0%
Comp Store Sales
8.3%
0.6%
13.5%
8.6%
7.7%
-1.6%
1.8%
1.5%
First
Second
Third
Quarter
Quarter
Quarter
Net Sales Growth
25.5%
21.0%
18.8%
Net Income Growth
65.2%
20.0%
22.4%
Comp Store Sales
5.2%
-0.3%
0.0%
Fiscal 2011
Fiscal 2007
Fiscal 2009
Fiscal 2010
Fiscal 2008
Ability
to
Expand
Net
Income
by
Double
Digits
in
Low
Comp
Growth
Quarters |
 METRIC
LONG-TERM TARGET
LONG-TERM TARGET
SQUARE FOOTAGE CAGR
MID TO HIGH TEENS
COMPARABLE STORE SALES
GROWTH
LOW SINGLE DIGITS
GROSS MARGIN
150 BPS IMPROVEMENT
NET INCOME CAGR
+ 20%
Long Term Financial Targets
Save
the
Date:
Analyst
/
Investor
Day
at
rue21
April
18
th
2012 |
 |