Attached files
| file | filename |
|---|---|
| 8-K - FORM 8-K - MENTOR GRAPHICS CORP | d280300d8k.htm |
 Gregory K.
Hinckley Needham Growth
Conference
President
January 2012
Exhibit 99.1 |
 www.mentor.com
©
2011 Mentor Graphics Corp. Company Confidential
Forward-Looking Statements
This
presentation
may
contain
“forward-looking”
statements
based
on
current
expectations
within
the
meaning of the Securities Exchange Act of 1934. Such forward-looking statements involve
known and unknown risks, uncertainties and other factors that may cause the actual
results, performance or achievements
of
the
Company
or
industry
results
to
be
materially
different
from
any
results,
performance or achievements expressed or implied by such forward-looking statements. Such
factors include, among others, the following: (i) weakness or recession in the US, EU,
Japan or other economies; (ii) the Company’s ability to successfully offer products
and services that compete in the highly competitive EDA industry; (iii) product bundling
or discounting of products and services by competitors, which could force the Company to
lower its prices or offer other more favorable terms to customers; (iv) possible delayed
or canceled customer orders, a loss of key personnel or other consequences resulting
from the business disruption and uncertainty of prolonged proxy fights, offers to
purchase the Company’s securities or other actions of activist shareholders; (v) effects
of the increasing volatility of foreign currency fluctuations on the Company’s
business and operating results; (vi) changes in accounting or reporting rules or
interpretations; (vii) the impact of tax audits by the IRS or other taxing authorities,
or changes in the tax laws, regulations or enforcement practices where the Company
does
business;
(viii)
effects
of
unanticipated
shifts
in
product
mix
on
gross
margin;
and
(ix)
effects
of
customer seasonal purchasing patterns and the timing of significant orders, which may
negatively or positively impact the Company’s quarterly results of operations, all
as may be discussed in more detail under
the
heading
“Risk
Factors”
in
the
Company’s
most
recent
Form
10-K
or
Form
10-Q.
Given
these
uncertainties,
prospective
investors
are
cautioned
not
to
place
undue
reliance
on
such
forward-looking
statements. In addition, statements regarding guidance do not reflect potential impacts of
mergers or acquisitions that have not been announced or closed as of the time the
statements are made. The Company disclaims any obligation to update any such factors or
to publicly announce the results of any revisions to any of the forward-looking
statements to reflect future events or developments. 3
GKH,
Needham
Growth
Conference
-
January
2012 |
 www.mentor.com
©
2011 Mentor Graphics Corp. Company Confidential
Agenda
EDA and Mentor Overview
Let’s Talk SG&A
Financial Results, Q4 and FY12 Guidance
Questions
4
GKH,
Needham
Growth
Conference
-
January
2012 |
 www.mentor.com
©
2011 Mentor Graphics Corp. Company Confidential
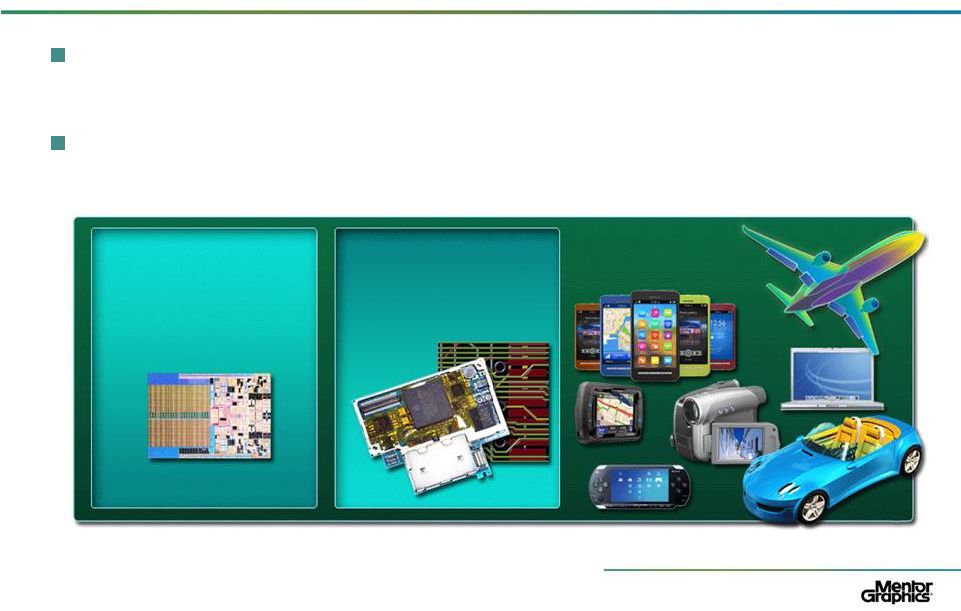
What Is Electronic Design Automation?
Critical design software used to create the world’s
electronic systems
Comprehensive EDA product portfolios address all levels –
from component to systems
Integrated
Circuit (IC)
Printed Circuit
Board (PCB)
Systems
5
GKH, Needham Growth Conference
-
January 2012 |
 www.mentor.com
©
2011 Mentor Graphics Corp. Company Confidential
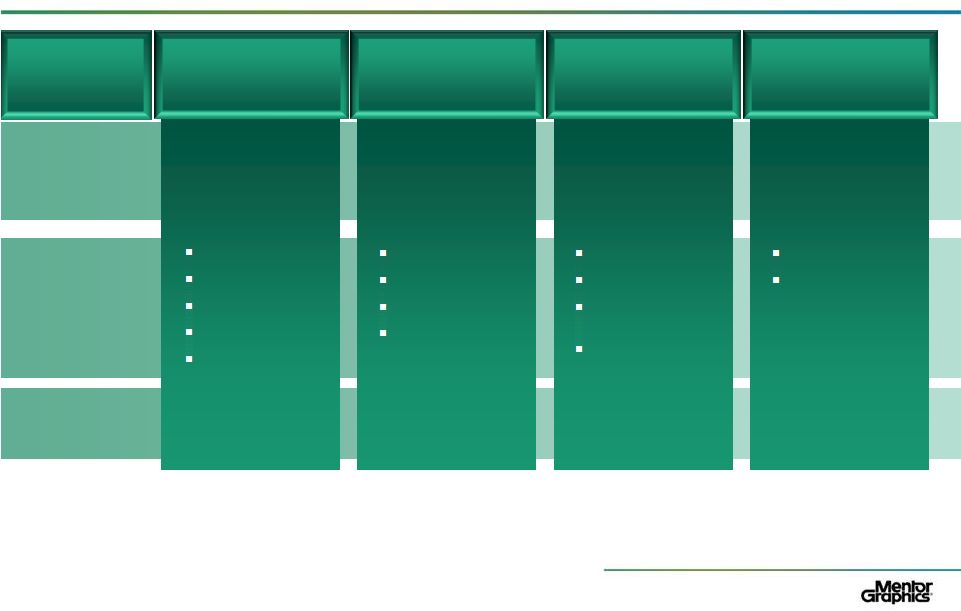
What We Sell
Integrated
System Design
PCB
Scalable
Verification
New & Emerging
Markets
IC Design-
to-Silicon
Tools for printed
circuit board (PCB)
and design and field
programmable gate
array (FPGA) design
Used to examine
and verify
functionality before
committing to silicon
Tools to create
integrated circuits
(ICs) for 90nm and
smaller
Products targeting
new and emerging
markets
Description
Expedition
Mechanical Analysis
PADS
Valor
Precision Synthesis
ModelSim
Questa
Veloce (Emulation)
ADVance MS
Calibre Platform
IC Custom Design
Olympus-SoC
Place & Route
Design-for-Test
Transportation
Embedded
Software
Key Product Areas
25%
25%
35%
10%
*Percent of YTD FY12
Revenue
*
Services & Other account for 5% of FY YTD bookings
6
GKH,
Needham
Growth
Conference
-
January
2012
Mentor
Reporting
Categories |
 www.mentor.com
©
2011 Mentor Graphics Corp. Company Confidential
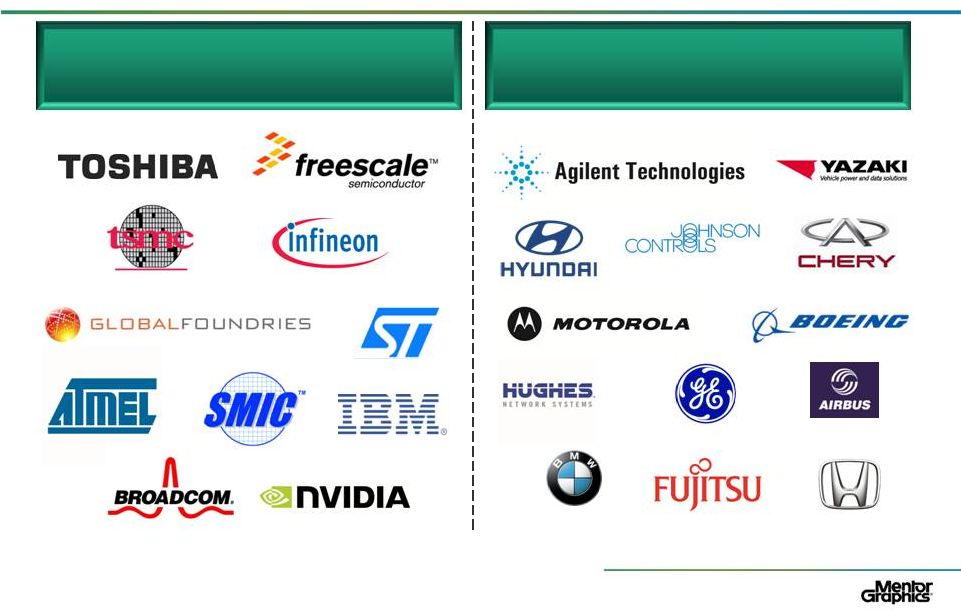
Who We Sell to
GKH,
Needham
Growth
Conference
-
January
2012
7
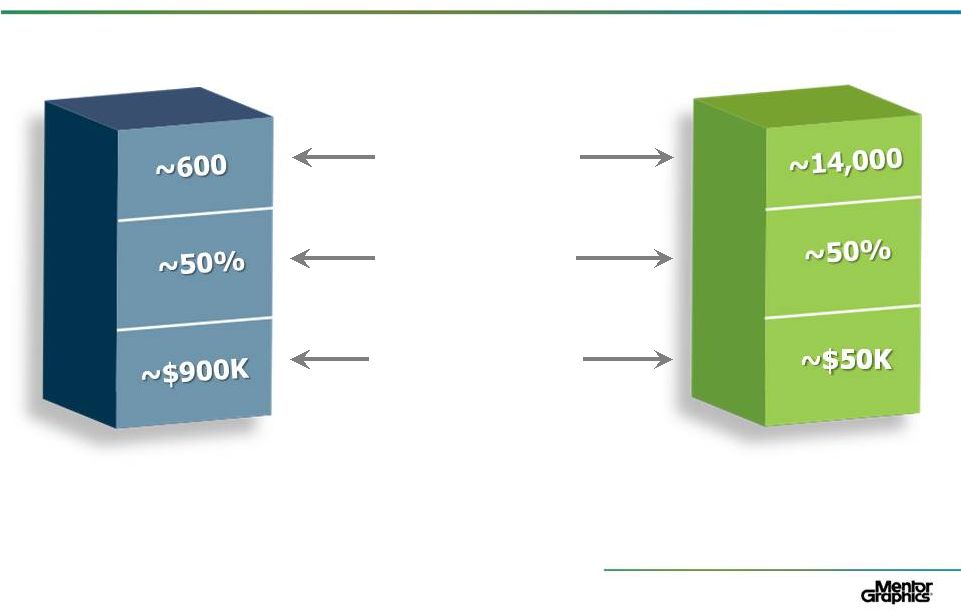
IC Companies ~50%
System Companies ~50% |
 www.mentor.com
©
2011 Mentor Graphics Corp. Company Confidential
The EDA Industry and Mentor’s Strategy
Mentor’s view of the EDA industry:
Segment leader gains share while others atrophy
Profitability within product segment driven by category size (linear) and
share (exponentially)
Traditional EDA growth modest, new challenges drive new spend by
customers
Mentor’s strategy:
Building #1 product positions
—
Mentor’s investments in recent years have yielded #1 product positions that
Mentor expects to maintain for years
Focus on internal development
Bolt-on acquisitions to build on #1 positions
Actively seeking TAM-expanding green field opportunities
8
GKH,
Needham
Growth
Conference
-
January
2012 |
 www.mentor.com
©
2011 Mentor Graphics Corp. Company Confidential
Agenda
EDA and Mentor Overview
Let’s Talk SG&A
Financial Results, Q4 and FY12 Guidance
Questions
9
GKH,
Needham
Growth
Conference
-
January
2012 |
 www.mentor.com
©
2011 Mentor Graphics Corp. Company Confidential
SG&A Topics
Scope and purpose of analysis
Examination of Mentor’s SG&A expense vs. peers
Review of Mentor’s business
Technical software selling activities
Findings and implications
10
GKH,
Needham
Growth
Conference
-
January
2012 |
 www.mentor.com
©
2011 Mentor Graphics Corp. Company Confidential
Scope and Purpose of SG&A Analysis
Examine Mentor’s SG&A expenses vs. a 105-company
universe of publicly traded software companies
Compare and contrast our business and expenses with
IT-centric and technical software companies
—
IT-centric
software
–
database-oriented
software
–
largely
bought by IT organizations
—
Technical software –
tools focused on the design and analysis of
physical and
electronic
systems
–
largely
bought
by
end-users
Review Mentor’s product offering, served markets and
distribution
Conclusions
11
GKH,
Needham
Growth
Conference
-
January
2012 |
 www.mentor.com
©
2011 Mentor Graphics Corp. Company Confidential
Software Universe
Companies
(1 -
20)
Companies
(21 -
40)
Companies
(41 –
60)
Companies
(61 –
80)
Companies
(81 –
100)
Companies
(101 –
105)
20-20 Technologies
Cadence
Epiq Systems
Misys plc
Red Hat
Unit 4
Absolute Software
Cegedim S.A.
ESI Group
NedSense Enterprises
Salesforce.com
Verint Systems
Accelrys
Cerner Corp.
Exact Holding NV
Nemetschek AG
SAP
Vmware
ACI Worldwide
Check Point Software
Fair Isaac Corp.
NetSuite
Simulations Plus
Vocus
Adacel Technologies
Cimatron
F-Secure
NICE Systems
Softech
Zuken
Adobe
Citrix Systems
GSE Systems
Nuance Communications
Software AG
Akamai
ClickSoftware
Informatica
Omnicell
Solera Holdings
Allscripts Healthcare
CommVault
IntraLinks Holdings
OmniComm Systems
Sopheon
Altium
Computer Modelling Group
Intuit
Open Text Corporation
Springsoft
ANSYS
Compuware Corp.
Jack Henry & Associates
OPNET
SuccessFactors
Aspen Technology
Concur
JDA Software Group
Oracle
SXC Health Solutions
ASTEA
Convergys
Kewill
Parametric Technology
Symantec
Autodesk
Cranes Software
Kofax
PDF Solutions
Synopsys, Inc.
Autonomy Corp.
Dassault Systemes
Lectra SA
Pegasystems
Taleo
Aveva
DataWatch
Magma
Pervasive Software
Temenos
Bio-Key
Delcam
Mentor Graphics
Progress Software
The Sage Group
Bitstream
Deltek
Micro Focus Intl.
PROS Holdings
Tibco Software
BMC Software
DemandTec
Micros Systems
QAD Inc
Trend Micro
Bottomline Technologies
Descartes
Microsoft
Qlik Technologies
Tyler Technologies
CA Technologies
DST Systems
MicroStrategy
Quest Software
Ultimate Software
•
Publically Traded, Independent Companies
•
Limited Hardware & Services Business
•
No Systems Integrators or Resellers
12
GKH,
Needham
Growth
Conference
-
January
2012 |
 www.mentor.com
©
2011 Mentor Graphics Corp. Company Confidential
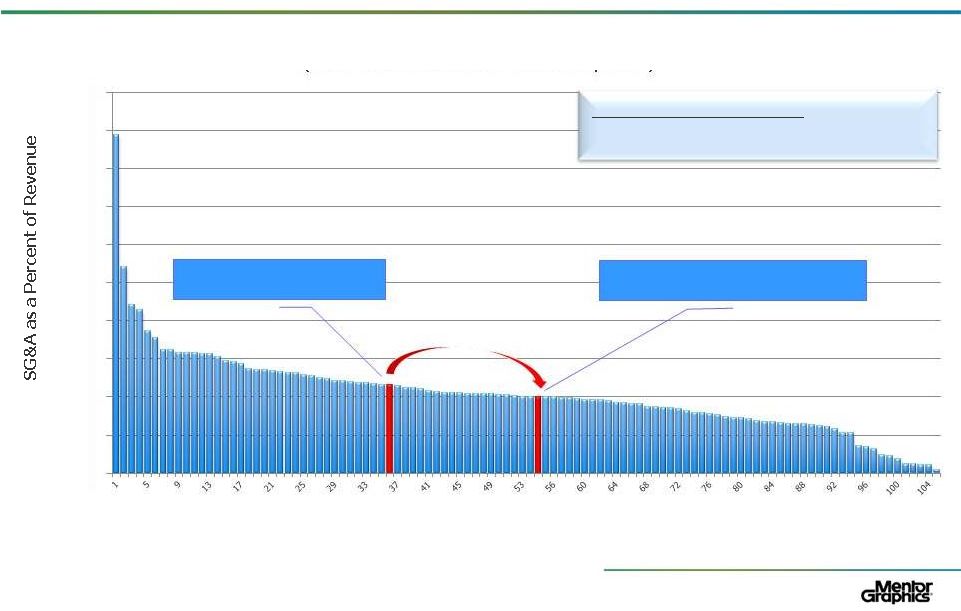
Software Universe SG&A Comparison
Source: Cap IQ and Mentor Graphics Analysis
SG&A from Software Universe
Average ………………….
41.5%
Median …………………..
40.2%
13
Mentor Graphics
FY2012 Plan –
40%
0%
20%
60%
80%
100%
120%
140%
160%
180%
200%
40%
Approximate SG&A as a Percent of Revenue CY 2010
(Total Software Universe 105 Companies)
Software Universe –
105 Companies
Mentor Graphics
FY2011 –
46%
-
GKH, Needham Growth Conference
-
January 2012 |
 www.mentor.com
©
2011 Mentor Graphics Corp. Company Confidential
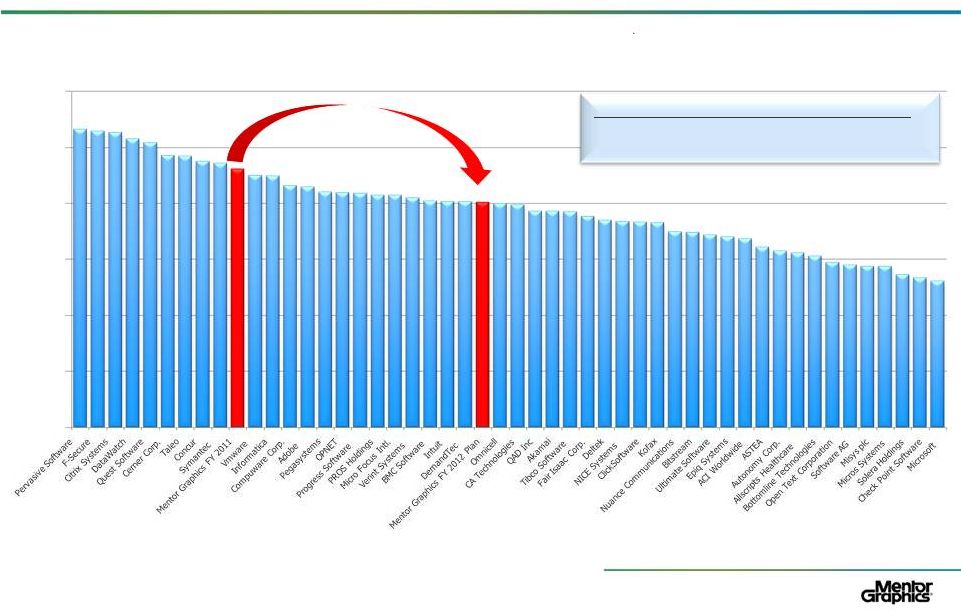
Source: Cap IQ and Mentor Graphics Analysis
Note: Trimmed top & bottom 12 for charting purposes
IT Software Universe CY 2010
14
GKH, Needham Growth Conference
-
January 2012
0%
10%
20%
30%
40%
50%
Approximate SG&A as a Percent of Revenue
(IT Company Universe)
60%
SG&A from Middle 49 IT Companies & MENT
Average ………………….
39%
Median …………………..
39% |
 www.mentor.com
©
2011 Mentor Graphics Corp. Company Confidential
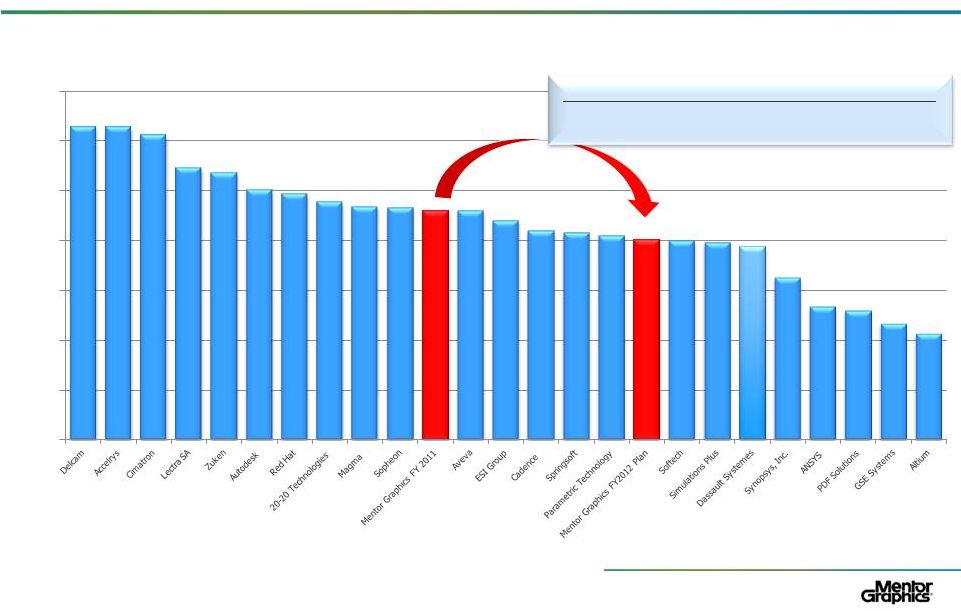
Technical Software Universe CY 2010
Source: Cap IQ and Mentor Graphics Analysis
Note: Trimmed top & bottom 4 for charting purposes
15
GKH,
Needham
Growth
Conference
-
January
2012
SG&A from Middle 24 Technical Software Companies
Average ………………….
43%
Median …………………..
45%
0%
10%
20%
30%
40%
50%
60%
70%
Approximate SG&A as a Percent of Revenue
(Technical Software Company Universe) |
 www.mentor.com
©
2011 Mentor Graphics Corp. Company Confidential
Technical Software -
Selling Models Structured
to Address Depth and Breadth of Customer Base
Distribution focused
—
Tiered distribution of resellers and VARs
—
Direct accounts established after grown from distribution
Direct large customer-focused
—
Highly concentrated customer base
—
No indirect distribution
GKH,
Needham
Growth
Conference
-
January
2012
16 |
 www.mentor.com
©
2011 Mentor Graphics Corp. Company Confidential
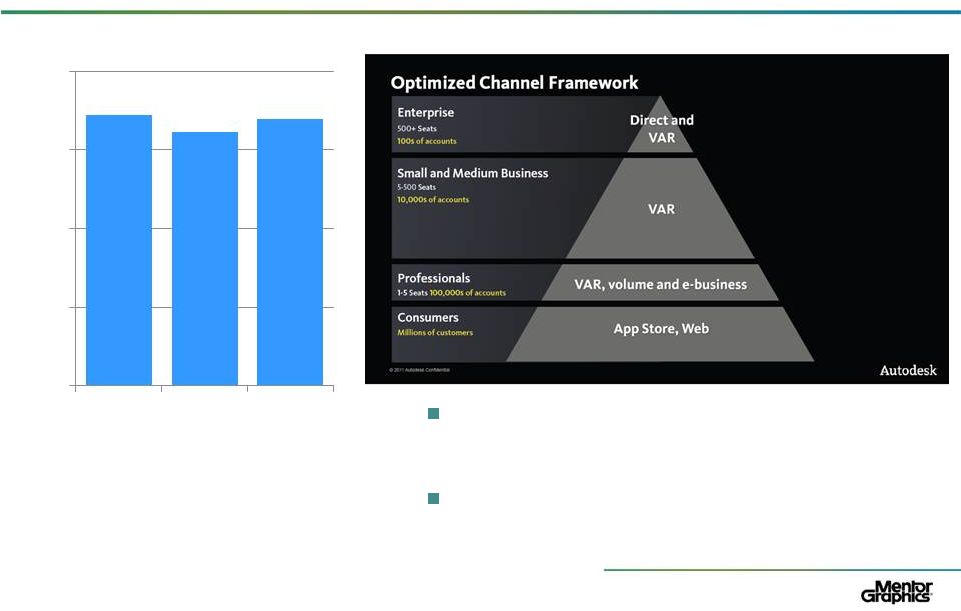
Autodesk SG&A ~50% of Revenue
Distribution Focused
Note: No single customer accounted for more
than 10% of the Company’s revenue in 2010,
2009 or 2008.
Broad global business network
—
2,000 Channel Partners
—
1,200 Authorized Training Centers
Direct sales ~15%,
—
Large, Enterprise Customers
Source: Financial Reports, Investor Presentation
17
GKH,
Needham
Growth
Conference
-
January
2012
86%
83%
85%
0%
25%
50%
75%
100%
2008
2009
2010
Indirect Channel Distribution
as a Percent of Total Revenue |
 www.mentor.com
©
2011 Mentor Graphics Corp. Company Confidential
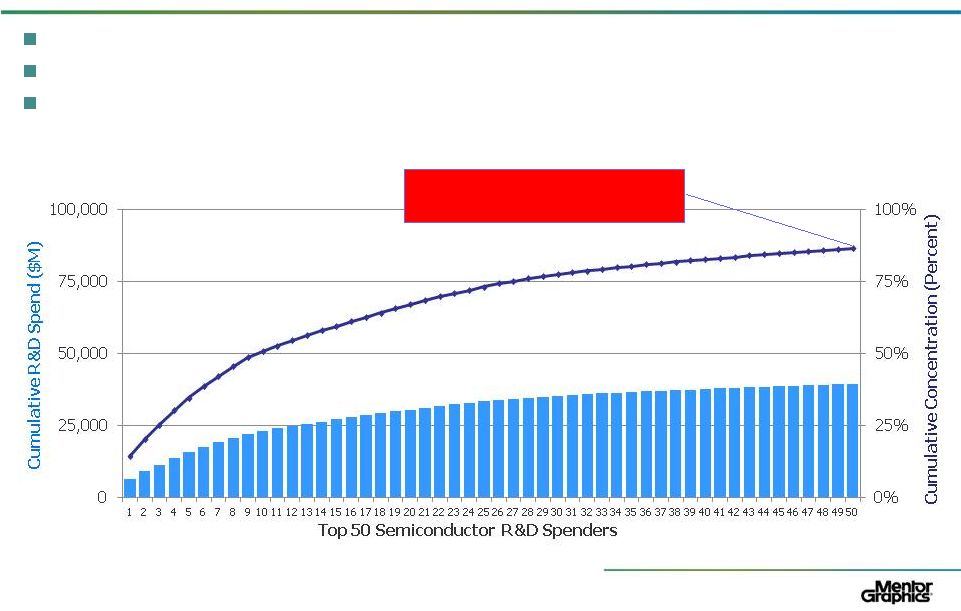
Synopsys SG&A ~32% of Revenue
Direct Large Customer Focus
Synopsys revenue is concentrated in semiconductor companies
Semiconductor R&D spend is highly concentrated
Semiconductor Total R&D Spend ~$45,700M
50 Companies are 86%
of Total R&D Spend
Source: IC Insights, Worldwide 2010 Top Semiconductor R&D Spenders
18
GKH, Needham Growth Conference -
January 2012 |
 www.mentor.com
©
2011 Mentor Graphics Corp. Company Confidential
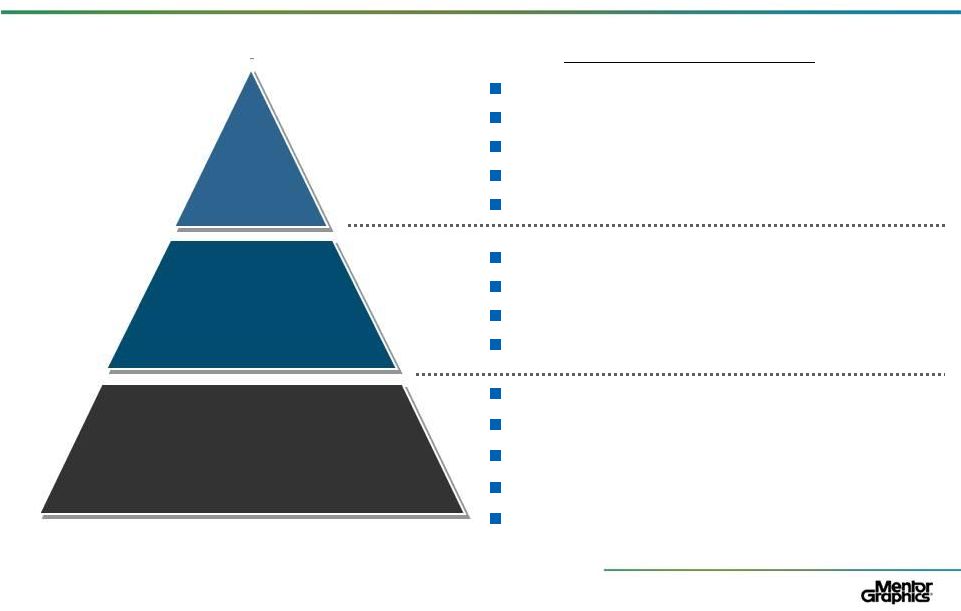
Complex global accounts with the largest EDA TAMs
Dispersion of users across multiple countries
Active long-term account plans
Complex Field & Factory initiatives
WW technical and account coverage coordination
Global /
Strategic
~ 50 Accounts
Key / National
Accounts
~300 Accounts
Complex national accounts with moderate EDA TAMs
Concentration of users is within a national boundary
Active long-term account plans
May include vertical teams
Geographically assigned territories
Small to medium sized TAM accounts
Moderate range of account complexity
Reseller involvement
Includes product-focused sales teams, such as MAC,
Valor, Embedded Systems, etc
Geographic / Territory
> 10,000 Accounts
Mentor SG&A ~40% of FY12 Revenue
Mixed Large Direct Accounts and Transactional Business
Current Segmentation
Tiered Selling Structure
19
GKH,
Needham
Growth
Conference
-
January
2012 |
 www.mentor.com
©
2011 Mentor Graphics Corp. Company Confidential
Technical Software Companies SG&A Costs
Name
Revenue
$M
CY2010
SG&A %
Autodesk
$1,952
50%
LogicVision (2008)
$12
71%
Magma
$135
47%
Synopsys
$1,415
32%
PDF Solutions
$62
26%
GSE Systems
$47
23%
Zuken
$218
54%
Valor (2008)
$40
51%
Synplicity (2007)
$71
51%
Cadence
$936
42%
SpringSoft
$75
41%
Parametric
$1,018
41%
Mentor Graphics
FY2012 Plan
$1,005
40%
Dassault Systemes
$2,097
39%
20
Distribution focused
50% SG&A of Revenue
Mixed direct and distribution
+/-
45% SG&A of Revenue
Direct customers
+/-
30% SG&A of Revenue
GKH, Needham Growth Conference
-
January 2012 |
 www.mentor.com
©
2011 Mentor Graphics Corp. Company Confidential
Mentor Business and Customers
IC business ~600 customers
—
Market segments
–
Semiconductor companies: IDMs, foundries, fabless, start-ups and
semiconductor IP (SIP)
—
Products (1,764 parts across 18 prod families)
–
IC design, functional verification and manufacturing
Systems business ~14,000 customers
—
Market segments
–
Transportation
–
Mil/Aero
–
Industrial, test & measurement and medical
–
Computer & peripherals
–
Consumer electronics
–
Communications: wired & wireless
—
Products (4,750 parts across 24 prod families)
–
GUI, embedded software, PCB design-creation-manufacturing, packaging,
thermal, harness design and manufacturing, mechatronics, FPGA design
21
GKH, Needham Growth Conference
-
January 2012
Based upon review of customers between 1996 and 2011 |
 www.mentor.com
©
2011 Mentor Graphics Corp. Company Confidential
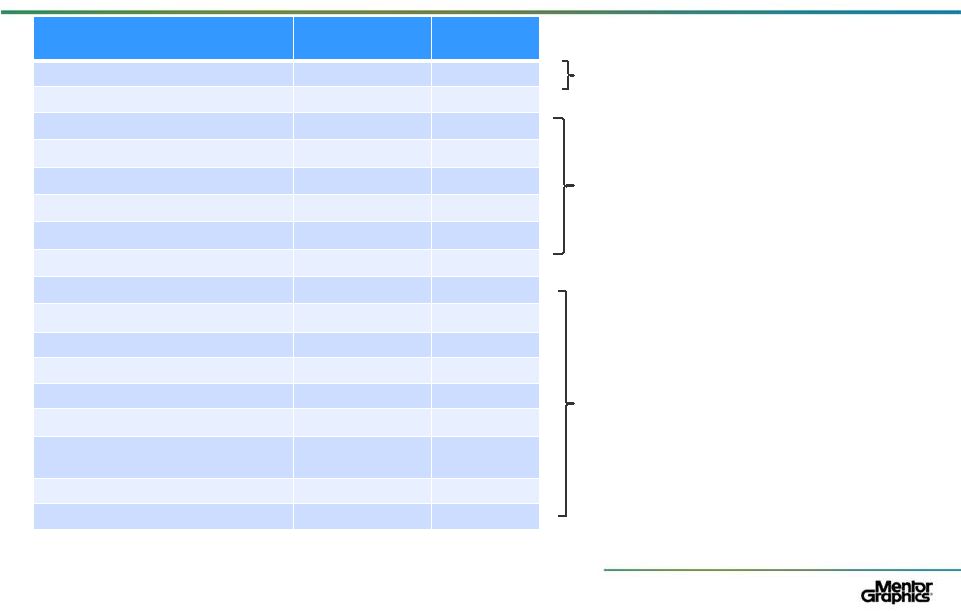
Customer & Product Segmentation Facts
Number of
Customers
Percent of
Bookings
Average
Transaction Size
IC Companies
Systems Companies
22
GKH, Needham Growth Conference
-
January 2012 |
 www.mentor.com
©
2011 Mentor Graphics Corp. Company Confidential
Estimated SG&A as a Percent of Revenue
Mentor Graphics FY12 Plan Based upon Activity-based Analysis
IC
Systems
Total
Selling
13%
33%
21%
Marketing
10%
10%
10%
Admin
9%
8%
9%
Total
32%
51%
40%
23
GKH, Needham Growth Conference
-
January 2012 |
 www.mentor.com
©
2011 Mentor Graphics Corp. Company Confidential
Mentor SG&A Findings
IC business FY12 plan SG&A costs (32%) similar to other
direct large customer focused companies
Systems business FY12 plan SG&A costs (51%) similar to
other distribution focused companies
Systems business and customers are unique within EDA
—
Diversifies customers and served markets
—
Sizeable customer set for IC products
—
Ready-made channel for non-traditional EDA products: wire
harness, mechanical and thermal analysis and embedded SW
Mentor’s FY12 Plan SG&A costs (40%) compare favorably
with other mixed direct and distribution selling companies
GKH,
Needham
Growth
Conference
-
January
2012
24 |
 FINANCIAL
HIGHLIGHTS AND OUTLOOK |
 ©
2011 Mentor Graphics Corp.
www.mentor.com
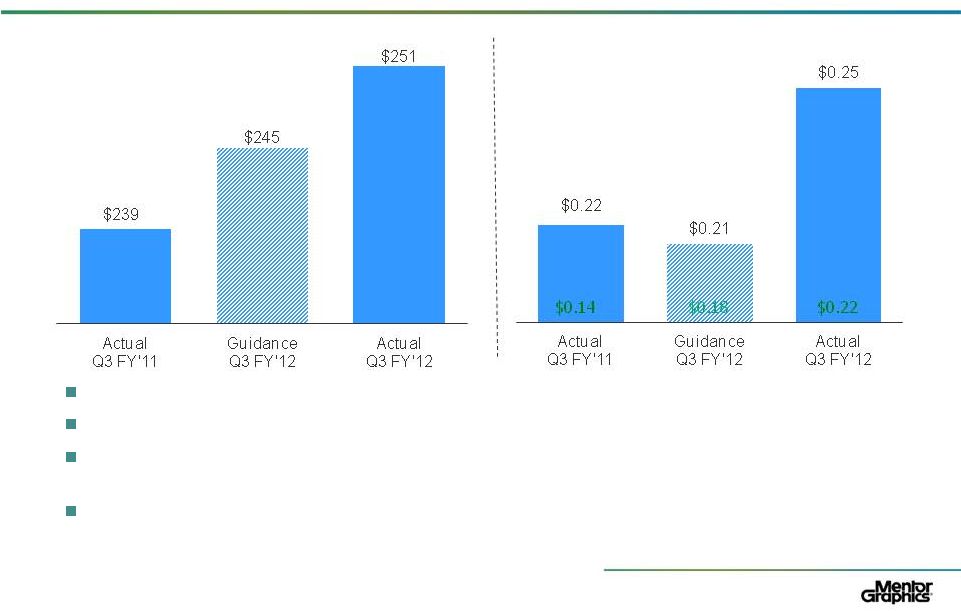
Q3 FY 2012 Results
Revenue, bookings and book to bill achieved all-time Q3 records
Growth of largest contract renewals was a strong 40%
Strength in design to silicon and Pac Rim driven by resolution enhancement and
28/20 nm build out
Q3 FY 2012 –
marked the eleventh consecutive quarter of exceeding non-GAAP
EPS guidance
26
26
*For
a
reconciliation
of
non-GAAP
to
GAAP
financial
measures,
see
the
appendix
to
this
presentation
Revenue ($mm)
Record
Q3
Non-GAAP
EPS
*
26
GKH,
Needham
Growth
Conference
-
January
2012
Green = GAAP EPS |
 ©
2011 Mentor Graphics Corp.
www.mentor.com
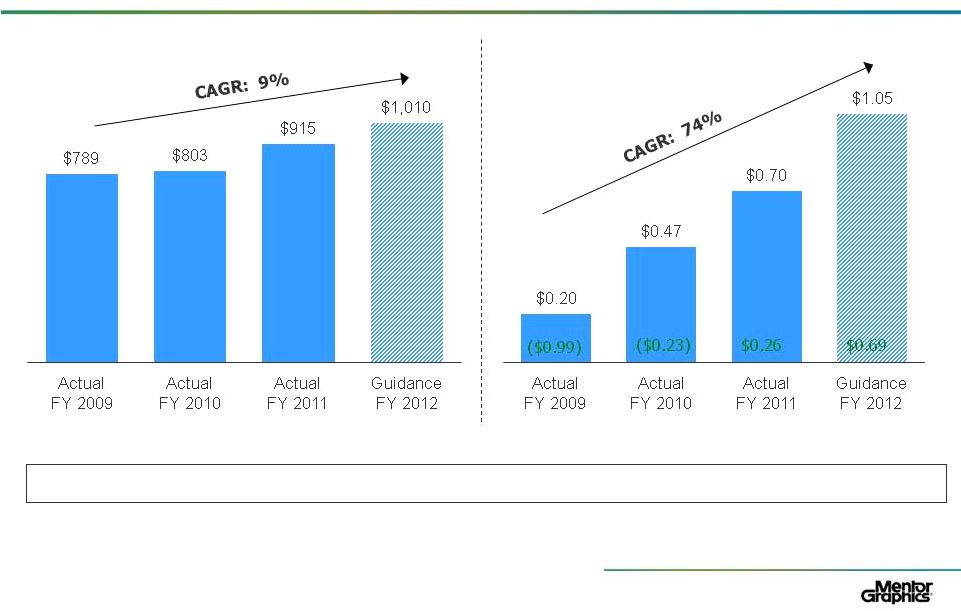
Fiscal 2012 Business Results and Outlook
First half business with strength in Integrated System
Design, Scalable Verification and New and Emerging
followed by strong Design to Silicon business in Q3
Q4 Fiscal 2012 expected revenue of approximately
$316 million and Non-GAAP EPS
*
of $0.50
—
GAAP EPS of approximately $0.46
Raising FY12 revenue guidance to $1.010 billion, an
increase of 10% year-over-year, and increasing Non-
GAAP EPS
*
to $1.05, up 50% from prior year
—
GAAP EPS of $0.69 vs $0.26
*For a reconciliation of non-GAAP to GAAP financial measures, see the appendix to this
presentation 27
GKH, Needham Growth Conference
-
January 2012 |
 ©
2011 Mentor Graphics Corp.
www.mentor.com
FY 2012 Guidance on a Foundation of
Strong Results
*For a reconciliation of non-GAAP to GAAP financial measures, see the appendix to this
presentation FY12 Non-GAAP EPS projected to grow 50% on a 10% growth in revenue
Revenue ($mm)
Non-GAAP EPS
*
28
GKH, Needham Growth Conference
-
January 2012
Green = GAAP EPS |
 ©
2011 Mentor Graphics Corp.
www.mentor.com
Long-Term Outlook and Capital Policy
Mentor’s leading industry products, presence in emerging markets and
leverageable operating model, create a platform anticipated to generate
significant returns for shareholders
EPS growth driven by top line momentum and operating margin expansion;
should be further enhanced by the use of our strong free cash flow to
repurchase shares
—
Mentor has historically operated on a leveraged net debt basis to reduce our
overall cost of capital and we presently anticipate using our strong cash flow to
return approximately $150 million of capital to shareholders through stock
repurchases or dividends
–
Mentor
has
repurchased
$90
million
of
stock
YTD
FY
2012
–
approximately
6% of our market capitalization
29
29
* For a reconciliation of non-GAAP to GAAP financial measures, see the appendix to this
presentation Long-Term
FY12
Model
Revenue Growth
10% Y-o-Y
8-10% CAGR
Growth in-line with industry analyst expectations
16%
20%+
Mild gross margin expansion due to both scale efficiencies and
structural operating changes
R&D constant at ~30% of revenues
SG&A declining as % of revenue due to scale efficiencies
Assumptions
Operating Margin
(non-GAAP)*
29
GKH, Needham Growth Conference
-
January 2012 |
 ©
2011 Mentor Graphics Corp.
www.mentor.com
Investment Highlights
Mentor’s pioneering EDA heritage, well diversified global customer
base and pioneering in new markets offers long-term growth
opportunities
Growth anticipated to continue to exceed underlying growth of
traditional EDA micro-electronic markets
Committed to enhancing shareholder value with a 20%+ non-GAAP
operating margin target and returning capital to our shareholders
through share repurchases
Integrated
Circuit (IC)
Printed Circuit
Board (PCB)
Systems
30
Mentor Graphics Investor Presentation, November 2011 |
 APPENDIX
|
 ©
2011 Mentor Graphics Corp.
www.mentor.com
GAAP
vs
Non-GAAP
*
The Non-GAAP Metric:
Adopted by all public companies in the EDA industry
Used by all equity analysts that track the EDA industry
GAAP items excluded from non-GAAP results
—
Equity plan-related compensation
—
Special charges
—
Amortization of purchased technology
—
Amortization of other identified intangible assets
—
Amortization of debt discount and retirement costs
—
Other extraordinary items
33
*For a reconciliation of non-GAAP to GAAP financial measures, see the slides immediately
following this slide 33
Mentor Graphics Investor Presentation, November 2011 |
 ©
2011 Mentor Graphics Corp.
www.mentor.com
Non-GAAP Financial Measures
The Company’s
management evaluates and makes operating decisions using various
performance measures. In addition
to our GAAP results, we also consider adjusted gross margin, operating margin, net income
(loss), and earnings (loss) per share which we refer to as non-GAAP gross margin,
operating margin, net income (loss), and earnings (loss) per share, respectively.
These non-GAAP measures are derived from the revenues of our product, maintenance, and services
business operations and the costs directly related to the generation of those revenues, such as
cost of revenue, research and development, sales and marketing, and general and
administrative expenses, that management considers in evaluating our ongoing core
operating performance. These non-GAAP measures exclude amortization of intangible
assets,
special
charges,
equity
plan-related
compensation
expenses,
interest
expense
attributable
to
net
retirement
premiums or discounts on the early retirement of debt and associated debt issuance costs,
interest expense associated with the amortization of debt discount and premium on
convertible debt, and the equity in income (loss) of unconsolidated entities (except
Frontline PCB Solutions Limited Partnership (Frontline)), which management does not
consider reflective of our core operating business.
Management excludes from our non-GAAP measures certain recurring items to facilitate its
review of the comparability of our core operating performance on a
period-to-period basis because such items are not related to our ongoing core
operating performance as viewed by management. Management considers our core operating
performance to be that which can be affected by our managers in any particular period
through their management of the resources that affect our underlying revenue and profit
generating operations during that period. Management uses this view of our operating
performance for purposes of comparison with our business plan and individual operating budgets
and allocation of resources. Additionally, when evaluating potential acquisitions,
management excludes the items described above from its consideration of target
performance and valuation. More specifically, management adjusts for the excluded items for the
following reasons:
34
34
Mentor Graphics Investor Presentation, November 2011
Identified intangible assets consist primarily of purchased technology, backlog, trade names,
customer relationships, and employment agreements. Amortization charges for our
intangible assets can vary in frequency and amount due to the timing and magnitude of
acquisition transactions. We consider our operating results without these charges
when evaluating our core performance due to the variability. Generally, the most significant
impact to inter-period comparability of our net income (loss) is in the first twelve
months following an acquisition. |
 ©
2011 Mentor Graphics Corp.
www.mentor.com
Non-GAAP Financial Measures (cont.)
Special charges primarily consist of restructuring costs incurred for employee terminations,
including severance and benefits, driven by modifications of business strategy or
business emphasis. Special charges may also include expenses incurred related to
potential acquisitions, excess facility costs, and asset-related charges. Special charges
are incurred based on the particular facts and circumstances of acquisition and restructuring
decisions and can vary in size and frequency. These charges are excluded as they are not
ordinarily included in our annual operating plan and related budget due to the
unpredictability of economic trends and the rapidly changing technology and competitive
environment in our industry. We therefore exclude them when evaluating our managers'
performance internally. Equity plan-related compensation expenses represent the fair
value of all share-based payments to employees, including grants of employee stock
options and restricted stock units. We do not consider equity plan-related
compensation expense in evaluating our manager’s performance internally or our core
operations in any given period. Interest expense attributable to net retirement
premiums or discounts on the early retirement of debt, the write-off of associated
debt issuance costs and the amortization of the debt discount and premium on convertible debt are
excluded. Management does not consider these charges as a part
of our core operating performance. The early
retirement of debt and the associated debt issuance costs are not included in our annual
operating plan and related budget due to unpredictability of market conditions which
could facilitate an early retirement of debt. We do not consider the amortization
of the debt discount and premium on convertible debt to be a direct cost of operations.
In connection with the Company’s acquisition of Valor on March 18, 2010, we also acquired
Valor’s 50% interest in Frontline, a joint venture. We report our equity in
the earnings or losses of Frontline within operating income. We actively
participate in regular and periodic activities such as budgeting, business planning, marketing and direction of
research and development projects. Accordingly, we do not exclude our share of
Frontline’s earnings or losses from our non-GAAP results as management
considers the joint venture to be core to our operating performance. Equity in
earnings or losses of unconsolidated entities, with the exception of our investment in Frontline, represents
our equity in the net income (loss) of a common stock investment
accounted for under the equity method. The
carrying amount of our investment is adjusted for our share of earnings or losses of the
investee. The amounts are excluded from our non-GAAP results as we do
not control the results of operations for this investment and we do not participate in
regular and periodic operating activities; therefore, management does not consider these businesses a
part of our core operating performance.
Mentor Graphics Investor Presentation, November 2011
35 |
 ©
2011 Mentor Graphics Corp.
www.mentor.com
Non-GAAP Financial Measures (cont.)
36
36
36
Mentor Graphics Investor Presentation, November 2011
Income tax expense (benefit) is adjusted by the amount of additional tax expense or benefit that
we would accrue if we used non-GAAP results instead of GAAP results in the
calculation of our tax liability, taking into consideration our long-term tax
structure. We use a normalized effective tax rate of 17%, which reflects the weighted average tax rate
applicable under the various jurisdictions in which we operate. This non-GAAP tax rate
eliminates the effects of non- recurring and period specific items which are often
attributable to acquisition decisions and can vary in size and
frequency and considers our U.S. loss carryforwards that have not been previously
benefited. This rate is subject to change over time for various reasons, including
changes in the geographic business mix and changes in statutory tax rates. Our GAAP tax
rate for the full fiscal year 2012 GAAP is projected to be 2%. The GAAP tax rate considers
certain mandatory and other non-scalable tax costs which may adversely or beneficially
affect our tax rate depending upon our level of profitability in various jurisdictions.
In certain instances our GAAP results of operations may not be profitable when our
corresponding non-GAAP results are profitable or vice versa. The number of
shares on which our non-GAAP earnings per share is calculated may therefore differ
from the GAAP presentation due to the anti-dilutive effect of stock options and restricted stock units in a loss
situation.
Non-GAAP gross margin, operating margin, and net income (loss) are
supplemental measures of our performance that are not required by, or presented in
accordance with, GAAP. Moreover, they should not be considered as an alternative to any
performance measure derived in accordance with GAAP, or as an alternative to cash flow from operating activities as
a measure of our liquidity. We present non-GAAP gross margin, operating margin, and net
income (loss) because we consider them to be important supplemental measures of our
operating performance and profitability trends, and because we believe they give
investors useful information on period-to-period performance as evaluated by management. Non-
GAAP net income (loss) also facilitates comparison with other companies in our industry, which
use similar financial measures to supplement their GAAP results. Non-GAAP net income
(loss) has limitations as an analytical tool, and therefore should not be considered in
isolation or as a substitute for analysis of our results as reported under GAAP. In
the future we expect to continue to incur expenses similar to the non-GAAP adjustments
described above and exclusion of these items in our non-GAAP presentation should not
be construed as an inference that these costs are unusual, infrequent or
non-recurring. Some of the limitations in relying on non-GAAP net income (loss) are: |
 ©
2011 Mentor Graphics Corp.
www.mentor.com
Non-GAAP Financial Measures (cont.)
Amortization of intangibles represents the loss in value as the technology in our industry
evolves, is advanced, or is replaced over time. The expense associated with this loss in
value is not included in the non-GAAP net income (loss) presentation and therefore
does not reflect the full economic effect of the ongoing cost of maintaining our current
technological position in our competitive industry, which is addressed through our research and
development program.
We regularly engage in acquisition and assimilation activities as part of our ongoing business
and regularly evaluate our businesses to determine whether any operations should be
eliminated or curtailed. We therefore will continue to experience special charges
on a regular basis. These costs also directly impact our available funds. Our
stock option and stock purchase plans are important components of our incentive compensation arrangements
and will be reflected as expenses in our GAAP results. Our stock
option and stock purchase plans are important
components of our incentive compensation arrangements and will be reflected as expenses in our
GAAP results. Our income tax expense (benefit) will be ultimately based on our
GAAP taxable income and actual tax rates in effect,
which often differ significantly from the 17% rate assumed in our non-GAAP
presentation. In addition, if we have a GAAP loss and non-GAAP net income, our
non-GAAP results will not reflect any projected GAAP tax benefits. Similarly,
in the event we were to have GAAP net income and a non-GAAP loss, our GAAP tax expense would be
replaced by a credit in our non-GAAP presentation.
Other companies, including other companies in our industry, calculate non-GAAP net income
(loss) differently than we do, limiting its usefulness as a comparative measure.
37
Mentor Graphics Investor Presentation, November 2011 |
 ©
2011 Mentor Graphics Corp.
www.mentor.com
Non-GAAP Financial Measures (cont.)
38
Mentor Graphics Investor Presentation, November 2011
2011
2010
GAAP net income (loss)
24,071
$
15,257
$
Non-GAAP adjustments:
Equity plan-related compensation: (1)
Cost of revenues
249
221
Research and development
2,005
1,798
Marketing and selling
1,365
1,299
General and administration
1,495
1,589
Acquisition -
related items:
Amortization of purchased assets
Cost of revenues (2)
1,761
3,299
Frontline purchased technology and intangible assets (3)
1,242
1,242
Amortization of intangible assets (4)
1,296
1,445
Special charges (5)
1,164
1,578
Other income (expense), net (6)
(1,484)
-
Interest expense (7)
1,250
753
Non-GAAP income tax effects (8)
(7,050)
(4,133)
Total of non-GAAP adjustments
3,293
9,091
Non-GAAP net income
27,364
$
24,348
$
GAAP weighted average shares (diluted)
111,563
112,139
Non-GAAP adjustment
-
-
Non-GAAP weighted average shares (diluted)
111,563
112,139
GAAP net income per share (diluted)
0.22
$
0.14
$
Non-GAAP adjustments detailed
above 0.03
0.08
Non-GAAP net income per share (diluted)
0.25
$
0.22
$
MENTOR GRAPHICS CORPORATION
UNAUDITED RECONCILIATION OF NON-GAAP ADJUSTMENTS
(In thousands, except earnings per share data)
Three Months Ended October 31, |
 ©
2011 Mentor Graphics Corp.
www.mentor.com
Non-GAAP Financial Measures (cont.)
39
Mentor Graphics Investor Presentation, November 2011
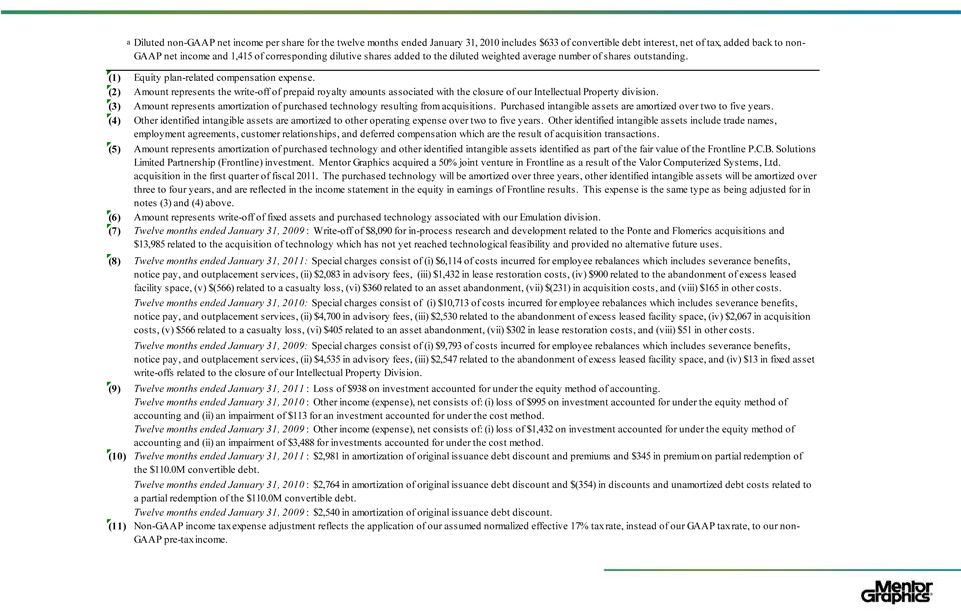
(1)
(2)
(3)
(4)
(5)
(6)
(7)
(8)
Non-GAAP income tax expense adjustment reflects the application of
our assumed normalized effective 17% tax rate, instead of our GAAP tax rate, to our non-
GAAP pre-tax income.
Equity plan-related compensation expense.
Amount represents amortization of purchased technology resulting from
acquisitions. Purchased intangible assets are amortized over two to five years.
Three months ended October 31, 2011:
Gain of $1,519 resulting from a change from an equity method
investment to a controlling interest and loss of $(35) on
investments accounted for under the equity method of accounting.
Three months ended October 31, 2011:
$1,250 in amortization of original issuance debt discount.
Three months ended October 31, 2010:
$753 in amortization of original issuance debt discount and bond
premiums, net. Amount represents amortization of purchased
technology and other identified intangible assets identified as part of the fair value of the Frontline P.C.B. Solutions
Limited Partnership (Frontline) investment. Mentor Graphics
acquired a 50% joint venture in Frontline as a result of the Valor Computerized Systems, Ltd.
acquisition in the first quarter of fiscal 2011. The purchased
technology will be amortized over three years, other identified intangible assets will be amortized over
three to four years, and are reflected in the income statement in the
equity in earnings of Frontline results. This expense is the same type as being adjusted for in
notes (2) above and (4) below.
Other identified intangible assets are amortized to other operating
expense over two to five years. Other identified intangible assets include trade names,
customer relationships, and backlog which are the result of acquisition
transactions. Three months ended October 31, 2011:
Special charges consist of (i) $1,227 of costs incurred for employee
rebalances which includes severance benefits, notice pay, and
outplacement services, (ii) $(19) in acquisition costs, (iii) $(173) related to the abandonment of excess lease space, and (iv) $129 in consulting fees
associated with our proxy contest.
Three months ended October 31, 2010:
Special charges consist of (i) $1,191 of costs incurred for employee
rebalances which includes severance benefits, notice pay, and
outplacement services, (ii) $432 in lease restoration costs, (iii) $302 related to the abandonment of excess lease space, (iv) $(513) in acquisition costs,
(v) $83 in advisory fees, and (vi) $83 in other adjustments.
|
 ©
2011 Mentor Graphics Corp.
www.mentor.com
Non-GAAP Financial Measures (cont.)
40
Mentor Graphics Investor Presentation, November 2011
Estimated
Estimated
Estimated
Q3 FY12
Q4 FY12
FY12
Diluted GAAP net income per share
$0.18
$0.46
$0.69
Non-GAAP Adjustments:
Amortization of purchased intangible assets (1)
0.02
0.02
0.09
Amortization of other identified
intangible assets (2) 0.02
0.02
0.09
Equity plan-related compensation
(3) 0.06
0.05
0.19
Special charges (4)
-
-
0.07
Other expense, net and interest expense
(5) -
-
0.13
Non-GAAP income tax effects
(6) (0.07)
(0.05)
(0.21)
Non-GAAP net income per share
$0.21
$0.50
$1.05
(1)
(2)
(3)
(4)
(5)
(6)
Excludes amortization of other identified intangible assets including
trade names, customer relationships, and backlog resulting from acquisition
transactions. Other identified intangible assets are amortized
over two to five years. This line item also excludes amortization of purchased intangible
assets identified as part of the fair value of the Frontline P.C.B.
Solutions Limited Partnership investment. The purchased technology will be amortized
over three years and other identified intangible assets will be
amortized over three to four years. Excludes equity
plan-related compensation expense. Excludes special charges
consisting primarily of consulting fees associated with our proxy contest, costs incurred for employee rebalances (which
includes severance benefits, notice pay and outplacement services),
facility closures, and acquisition costs. Adjustment for fiscal
2012, reflects the amortization of original issuance debt discount and premium for our 6.25% Convertible Subordinated Debentures
due 2026, the amortization of original issuance debt discount for our
4.00% Convertible Subordinated Debentures due 2031, and charges associated
with the retirement of our 6.25% Convertible Subordinated Debentures
and Term Loan. Non-GAAP income tax expense adjustment
reflects the application of our assumed normalized effective 17% tax rate, instead of our GAAP tax rate, to
our non-GAAP pre-tax income.
Excludes amortization of purchased intangible assets resulting from
acquisition transactions. Purchased intangible assets are amortized over two to five
years.
The following table reconciles management's estimates of the specific
items excluded from GAAP in the calculation of estimated non-GAAP
net income per share for Q3 FY12, Q4 FY12, and fiscal 2012.
MENTOR GRAPHICS CORPORATION
UNAUDITED RECONCILIATION OF GAAP TO NON-GAAP
EARNINGS PER SHARE |
 ©
2011 Mentor Graphics Corp.
www.mentor.com
Mentor Graphics Investor Presentation, November 2011
41
Non-GAAP Financial Measures (cont.)
Estimated
FY 2012
GAAP operating income
108.1
$
Reconciling items to non-GAAP operating
income: Equity plan-related compensation
21.4
Amortization of purchased technology
9.7
Amortization of Frontline purchased technology and other
4.9
identified intangible assets
Amortization of other identified intangible assets
5.8
Special Charges
7.4
Non-GAAP operating income
157.3
$
Estimated
FY 2012
GAAP operating income as a percent of total revenues
11%
Non-GAAP adjustments detailed above
5%
Non-GAAP operating income as a percent of total revenues
16%
Twelve Months Ended January 31,
MENTOR
GRAPHICS
CORPORATION
(In millions, except percentages)
Twelve Months Ended January 31,
UNAUDITED RECONCILIATION OF GAAP FINANCIAL MEASURES TO NON-GAAP
FINANCIAL MEASURES |
 ©
2011 Mentor Graphics Corp.
www.mentor.com
Non-GAAP Financial Measures (cont.)
Actual
Actual
Actual
FY11
FY10
FY09
GAAP net income (loss)
28,584
$
(21,889)
$
(91,252)
$
Non-GAAP adjustments:
Equity plan-related compensation: (1)
Cost of revenues
888
1,618
1,544
Research and development
7,785
10,931
12,005
Marketing and selling
6,112
8,406
8,627
General and administration
5,726
5,204
6,047
System and software cost of
revenues (2) -
-
103
Acquisition -
related items: Amortization of purchased assets
Cost of revenues (3)
13,771
12,012
12,403
Amortization of intangible assets (4)
7,347
11,184
11,113
Frontline purchased technology and intangible
assets (5) 4,347
-
-
Impairment of long-lived assets (6)
-
-
4,553
In-process research and
development (7) -
-
22,075
Special charges (8)
10,257
21,334
16,888
Other income (expense), net (9)
938
1,108
4,920
Interest expense (10)
3,326
2,410
2,540
Non-GAAP income tax effects
(11) (12,298)
(7,028)
7,039
Total of non-GAAP
adjustments 48,199
67,179
109,857
Non-GAAP net income
76,783
$
45,290
$
18,605
$
GAAP weighted average shares (diluted)
109,861
96,474
91,829
Non-GAAP adjustment
-
1,901
714
Non-GAAP weighted
average shares (diluted) 109,861
98,375
92,543
GAAP net income (loss) per share
(diluted) 0.26
$
(0.23)
$
(0.99)
$
Non-GAAP adjustments detailed above
0.44
0.70
1.19
Non-GAAP net income per
share (diluted) 0.70
$
0.47
$
0.20
$
MENTOR GRAPHICS CORPORATION
RECONCILIATION OF NON-GAAP ADJUSTMENTS
(In thousands, except earnings per share data)
42
Mentor Graphics Investor Presentation, November 2011
a
a |
 ©
2011 Mentor Graphics Corp.
www.mentor.com
Non-GAAP Financial Measures (cont.)
43
Mentor Graphics Investor Presentation, November 2011 |
 www.mentor.com
©
2011 Mentor Graphics Corp. Company Confidential |