Attached files
| file | filename |
|---|---|
| EX-23 - CONSENT OF KPMG, LLP INDEPENDENT REGISTERED PUBLIC ACCOUNTING FIRM - MENTOR GRAPHICS CORP | ment-20170131xexhibit23.htm |
| EX-32 - SECTION 906 CEO & CFO CERTIFICATION - MENTOR GRAPHICS CORP | ment-20170131xexhibit32.htm |
| EX-31.2 - SECTION 302 CFO CERTIFICATION - MENTOR GRAPHICS CORP | ment-20170131xexhibit312.htm |
| EX-31.1 - SECTION 302 CEO CERTIFICATION - MENTOR GRAPHICS CORP | ment-20170131xexhibit311.htm |
| EX-21 - LIST OF SUBSIDIARIES OF THE COMPANY - MENTOR GRAPHICS CORP | ment-20170131xexhibit21.htm |
| EX-3.B - BYLAWS OF THE COMPANY - MENTOR GRAPHICS CORP | ment-20170131xexhibit3b.htm |
UNITED STATES
SECURITIES AND EXCHANGE COMMISSION
Washington, D.C. 20549
_________________________________________
FORM 10-K
_________________________________________
x | ANNUAL REPORT PURSUANT TO SECTION 13 OR 15(d) OF THE SECURITIES EXCHANGE ACT OF 1934 |
For the fiscal year ended January 31, 2017
Commission file number 1 – 34795
________________________________________

MENTOR GRAPHICS CORPORATION
(Exact name of registrant as specified in its charter)
_________________________________________
Oregon | 93-0786033 | |
(State or other jurisdiction of incorporation or organization) | (IRS Employer Identification No.) | |
8005 SW Boeckman Road Wilsonville, Oregon | 97070-7777 | |
(Address of principal executive offices) | (Zip Code) | |
Registrant's telephone number, including area code (503) 685-7000
Securities registered pursuant to Section 12(b) of the Act:
Title of each class | Name of each exchange on which registered | |
Common Stock, without par value | NASDAQ Global Select Market | |
Securities registered pursuant to Section 12(g) of the Act:
None
_________________________________________
Indicate by check mark if the registrant is a well-known seasoned issuer, as defined in Rule 405 of the Securities Act. Yes x No ¨
Indicate by check mark if the registrant is not required to file reports pursuant to Section 13 or Section 15(d) of the Act. Yes ¨ No x
Indicate by check mark whether the registrant (1) has filed all reports required to be filed by Section 13 or 15(d) of the Securities Exchange Act of 1934 during the preceding 12 months (or for such shorter period that the registrant was required to file such reports), and (2) has been subject to such filing requirements for the past 90 days. Yes x No ¨
Indicate by check mark whether the registrant has submitted electronically and posted on its corporate Web site, if any, every Interactive Data File required to be submitted and posted pursuant to Rule 405 of Regulation S-T during the preceding 12 months (or for such shorter period that the registrant was required to submit and post such files). Yes x No ¨
Indicate by check mark if disclosure of delinquent filers pursuant to Item 405 of Regulation S-K is not contained herein, and will not be contained, to the best of registrant’s knowledge, in definitive proxy or information statements incorporated by reference in Part III of this Form 10-K or in any amendment to this Form 10-K. x
Indicate by check mark whether the registrant is a large accelerated filer, an accelerated filer, a non-accelerated filer, or a smaller reporting company. See the definitions of “large accelerated filer,” “accelerated filer” and “smaller reporting company” in Rule 12b-2 of the Exchange Act. (Check one):
Large Accelerated Filer | x | Accelerated Filer | ¨ |
Non-accelerated filer | o (Do not check if a smaller reporting company) | Smaller reporting company | ¨ |
Indicate by check mark whether the Registrant is a shell company (as defined in Rule 12b-2 of the Exchange Act). Yes ¨ No x
The aggregate market value of the voting stock held by non-affiliates of the registrant was approximately $2,309,898,916 on July 31, 2016 based upon the last price of the Common Stock on that date reported in the NASDAQ Global Select Market. On March 15, 2017, there were 110,487,092 shares of the registrant’s Common Stock outstanding.
_________________________________________
Mentor Graphics Corporation
Annual Report on Form 10-K
Year to date January 31, 2017
Table of Contents
Page | ||
Item 1. | ||
Item 1A. | ||
Item 1B. | ||
Item 2. | ||
Item 3. | ||
Item 4. | ||
Item 5. | ||
Item 6. | ||
Item 7. | ||
Item 7A. | ||
Item 8. | ||
Item 9. | ||
Item 9A. | ||
Item 9B. | ||
Item 10. | ||
Item 11. | ||
Item 12. | ||
Item 13. | ||
Item 14. | ||
Item 15. | ||
2
Part I
Item 1. Business.
This Form 10-K contains forward-looking statements that involve risks and uncertainties. Actual results may differ materially from the forward-looking statements. Factors that could cause or contribute to such differences include, but are not limited to, those set forth under Part I, Item 1A. “Risk Factors.”
GENERAL
Mentor Graphics Corporation (the Company) is a technology leader in electronic design automation (EDA). We provide software and hardware design solutions, as well as complementary consulting and customer support services, which enable our customers to develop better electronic products faster and more cost effectively. We market our products and services worldwide, primarily to large companies in the communications, computer, consumer electronics, semiconductor, networking, multimedia, military and aerospace, and transportation industries.
The electronic components and systems that our customers create and test with our products include integrated circuits (ICs), printed circuit boards (PCBs), field programmable gate arrays (FPGAs), embedded systems and software, and wire harness systems. Our products are used in the design and development of a diverse set of electronic products, including transportation electronics, internet of things (IoT) platforms and systems, computers, medical devices, industrial electronics, manufacturing systems, and wireless communications infrastructure. As silicon manufacturing process geometries shrink, our customers are creating electronic systems on a single IC. These devices are called a system-on-chip (SoC). This trend has become relevant to the everyday consumer as consumer electronics have become smaller, more portable and more sophisticated.
We were incorporated in Oregon in 1981, and our common stock is traded on the NASDAQ Global Select Market under the symbol “MENT.” Our corporate headquarters are located at 8005 S.W. Boeckman Road, Wilsonville, Oregon 97070-7777. The telephone number at that address is (503) 685-7000. Our website address is www.mentor.com. We have approximately 85 offices worldwide. Electronic copies of our reports filed with the Securities and Exchange Commission (SEC) are available through our website as soon as reasonably practicable after the reports are filed with the SEC. Our Director Code of Ethics, Standards of Business Conduct, Guidelines for Corporate Disclosure, Corporate Governance Guidelines, and our Audit, Compensation, and Nominating and Corporate Governance Committee Charters are also available on our website.
PRODUCTS
Our products are capable of handling the most complex designs at the IC, package, PCB and system levels. These products are essential tools that allow engineers to meet the ever increasing pressure of increased design complexity, shrinking time to market schedules and demand for top quality, fault-free products. Providing engineers with the tools and services to meet their design objectives in a productive, efficient and exacting manner is core to our business. Here is a typical hardware design process:
• | Electrical engineers begin the design process by describing and specifying the architectural, behavioral, functional, and structural characteristics of an IC, FPGA, PCB, or electronic system and its components. |
• | Engineers then create the component designs according to stated specifications. |
• | Engineers verify the design to reveal defects and then modify the component’s design until it is correct and meets the previously stated specifications. |
• | Engineers assemble components and test the components and the entire system. |
• | The system then goes to production. During the manufacturing process, engineers work to identify defective parts and improve yields. “Yields” refers to the percentage of functional ICs on a silicon wafer or functional PCBs compared to the total of those manufactured. |
We segregate revenues into five categories of similar products and services including: Scalable Verification, IC Design to Silicon, Integrated System Design, New and Emerging Products, and Services and Other. Each category, except Services and Other, includes both product and support revenues. Additional information is provided in Part II, Item 7. “Management's Discussion and Analysis of Financial Condition and Results of Operations.”
We have a worldwide support organization to meet our customers’ needs for technical support, training, and optimization services. Most of our customers enter into support contracts that deliver regular software updates with the latest improvements, technical assistance from experienced experts, access to a self-service support site, and participation in our interactive communities.
3
Scalable Verification
Scalable VerificationTM tools allow engineers to verify that their complex IC and FPGA designs function as intended by simulating and debugging the design. Functional errors are a leading cause of design revisions that slow down an electronic system’s time-to-market and reduce its profitability.
The Questa® platform includes support for hardware description language simulation, including System Verilog simulation, and methodologies using assertions, verification intellectual property (IP), test benches and formal verification methods. The Questa platform is used for verification of systems and ICs including application-specific integrated circuits (ASICs), SoCs, and FPGAs.
Together with digital simulation products, we offer analog/mixed-signal simulation tools. Analog/mixed signal ICs are found in virtually all electronic products today, from smart phones to smart TVs, from hybrid electric cars to fitness bands. Our analog/mixed-signal simulation tools enable our customers to simulate and verify both the functionality and performance of complex circuits before mass production. Our Analog FastSPICE™ platform includes nanometer (nm, by definition one-billionth of a meter) circuit simulation, an analog characterization environment and device noise analysis. Other analog/mixed signal simulation products we offer include the Eldo® and ADVance MS for classic analog/mixed-signal design.
We provide hardware emulation systems, such as our Veloce® product family, which allow users to create high-performance functional and logical equivalent models of actual electronic circuits to verify the function and timing of those circuits. Hardware emulation systems typically run complex electronic circuits 100 times to 1,000 times faster than software simulation tools. Emulation is also used when software operating systems are embedded within circuits and there is a need for hardware/software verification and debugging. Our Veloce product allows customers to verify complex designs containing up to two billion logic gates.
IC Design to Silicon
Shrinking geometries in ICs in the nanometer era and increasing design sizes have enabled ever increasing functionality on a single IC. Today’s most advanced ICs are being produced in a 10 nm process with ongoing test chips produced at 7 nm and below. Nanometer process geometries cause design challenges in the creation of ICs which are not present at larger geometries. As a result, nanometer process technologies, used to deliver the majority of today’s ICs, are the product of careful design and precision manufacturing. The increasing complexity and smaller size geometries within ICs have changed how technologists responsible for the physical layout of an IC design deliver their design to the IC manufacturer or foundry. In older technologies, this handoff was a relatively simple layout database check when the design went to manufacturing. Now it is a multi-step process where the layout database is checked and modified so the design can be manufactured with cost-effective yields of ICs.
To address these challenges, we offer the Calibre® tool family, which is the standard for most of the world’s largest integrated device manufacturers and foundries:
• | The Calibre physical verification tool suite, Calibre® DRC and Calibre® LVS-H™, helps ensure that a particular IC layout accurately corresponds to the original schematic or circuit diagram of the design and conforms to stringent manufacturing rules at wafer fabricators where ICs are manufactured. |
• | The Calibre® xRC™ and xACT™ products, transistor-level extraction and device modeling tools, compute the values of detailed circuit parameters including interconnect resistances, capacitances, and inductances to enable customers to more accurately simulate the performance of a design before it is manufactured. |
• | The Calibre Resolution Enhancement Technology (RET) tools allow wafer foundries to manipulate the light used to create ICs to make structures on the IC that are finer than would be possible with conventional exposures. The Calibre family of optical proximity correction (OPC), RET, and mask data preparation tools enable higher yields in semiconductor manufacturing. The Calibre® OPCverify™ tool is used to check and report the effectiveness of mask pattern corrections against wafer manufacturing specifications. The Calibre® RET tools continue to be extended to provide computational patterning capabilities for process technology nodes from 130 nm to 7 nm. |
• | In the Design For Manufacturing (DFM) area, the Calibre® LFD™ product can help customers produce higher yields at nanometer process geometries where variations in manufacturing can cause yield reductions. The Calibre® CMPAnalyzer tool allows customers to model the expected planarity (i.e., thickness variation) of ICs and identify where modifications to the layout will improve a chip’s flatness. This helps prevent manufacturing defects and reduces variations in performance from one chip to the next. The Calibre® MPCpro™ product is a solution for systematic errors introduced by e-beam lithography and mask etching processes built on Calibre® OPCpro™ technology for optical process correction. Our Calibre® nmMPC™ product provides optimizations specifically developed for e-beam |
4
mask writers. New correction and modeling capabilities improve mask linearity and uniformity for advanced nodes, especially for smaller feature sizes.
• | The Calibre® PERC™ tool checks the electrical design of an IC. It is used in verifying the completeness of electrostatic discharge protection circuitry which affects both manufacturing yield and the long-term reliability of an IC. |
Our Tessent® suite of integrated silicon test products are used to test a design's logic and memories after manufacturing to ensure that a manufactured IC is functioning correctly. Our suite of tools includes scan insertion, boundary scan, automatic test pattern generation, logic and memory built-in self-test, and our patented Tessent® TestKompress® product for EDT™ (embedded deterministic test). A suite of test analysis products is also available that leverages test data and layout-aware diagnosis capabilities for silicon debug and yield analysis.
Our Tanner EDA tool suite facilitates the design, layout and verification of analog/mixed signal ICs, MEMS (micro-electro-mechanical systems) and IoT devices. Our suite of analog tools includes schematic design, simulation, physical layout, schematic driven layout, physical verification, and post-layout simulation. Our mixed signal suite additionally offers the ability to design and implement digital logic. The Tanner EDA MEMS suite provides the unique capabilities required to design and verify integrated electronic and mechanical devices.
Integrated System Design
As ICs grow in complexity and function and PCB fabrication technology advances to include embedded components and high-density interconnect layers within the PCB, the design of PCBs is becoming increasingly complex. This complexity can be a source of design bottlenecks and slower time to market.
Our PCB-FPGA Systems Design software products support the PCB design process from schematic entry, where the electronic circuit is defined by engineers, through physical layout of the PCB, and provide digital output data for manufacturing, assembly, and test. Most types of designs, including analog, radio frequency, and high-speed digital and mixed signal, are supported by our PCB design tools. We have specific integrated software tool flows for process management, component library creation, signal and power integrity analysis, simulation, and verification of the PCB design:
• | The Xpedition® Series product line is our principal PCB design family of products and is used by enterprise customers for PCB design flows from system design definition to manufacturing execution. |
• | Our HyperLynx® product line offers a complete suite of analysis and verification software that meets the needs of PCB engineers at every point in the PCB design flow including tools for power integrity, thermal analysis, electromagnetic design/verification, analog simulation, and package modeling. |
• | We also offer the “ready to use” PADS® product line which provides a lower cost Windows-based PCB design and layout solution for individual design engineers and small teams. |
• | The XtremePCB™ tool offers a method for simultaneous design where multiple designers can edit the same design at the same time and view each other’s edits in real-time. |
Our Valor Division offers a line of products for DFM and manufacturing execution systems (MES). Valor’s solutions target three key segments in the PCB manufacturing market: design of the physical layout of the PCB, fabrication of the bare PCB, and assembly of PCB components.
Our Mechanical Analysis Division provides simulation software and consultancy services to reduce costs, eliminate design mistakes, and accelerate and optimize designs involving heat transfer and fluid flow before physical prototypes are built. Our FloEFD™ product is a three-dimensional computational fluid dynamics and heat transfer analysis tool that is embedded into mechanical computer-aided design systems to help design engineers conduct computational fluid dynamics analysis throughout the product’s life cycle. Our FloTHERM® three-dimensional computational fluid dynamics software predicts airflow and heat transfer in and around electronic equipment, including effects of conduction, convection, and radiation to enable engineers to create virtual models of electronic equipment, perform thermal analysis, and test design modifications before physical prototypes are built. This product line also includes the FloMasterTM one-dimensional computational fluid dynamics analysis software, which is used by thermo-fluid system engineers to model and analyze the fluid mechanics and pipe flow in complex systems. Finally, we offer the MicReD® T3Ster® advanced transient temperature measurement system, which enables thermal testing and characterization of electronics components, PCBs, and sub-systems, and the MicReD® Power Tester™ 1500A, which tests the reliability of electronic power components increasingly used in industries such as automotive and transportation, including hybrid and electrical vehicles and trains, and renewable energy applications such as wind turbines.
5
New and Emerging Products
We provide specialized software tools for the design, analysis, and documentation of the complex electrical systems found in automotive, aerospace, and other transportation platforms. Electronic features constitute an increasingly high proportion of the value of automobiles and airplanes. These tools also support the design, costing, and manufacturing process modeling of wire harnesses.
Our Embedded Systems Division provides runtime software, customizable reference hardware, design tools, and professional engineering services that enable our customers to build secure embedded systems utilizing heterogeneous multi-core and multi-operating system platforms. Our embedded software solutions are used in automotive, industrial, mobile, medical, aerospace, IoT and consumer electronics markets. Our automotive solutions are used in advanced driver assistance systems, autonomous drive, telematics, automotive networking, and driver information, where we supply commercial Linux platforms for in-vehicle-infotainment.
Services and Other
Mentor Consulting, our professional services division, is comprised of a worldwide team of consulting professionals. We provide services such as business process design, methodology development, enterprise integration, and large scale deployment. These services accelerate the deployment and adoption of Mentor Graphics’ technologies to help our customers improve their cost, quality, and time to market. The services provided to customers are concentrated around our Calibre, Questa, Veloce, Tessent, Xpedition, and system design products.
PLATFORMS
Our software products are available on UNIX, Windows, and LINUX platforms in a broad range of price and performance levels. Customers purchase platforms from leading workstation and personal computer suppliers.
MARKETING AND CUSTOMERS
Our sales and marketing emphasizes large corporate account penetration in the communications, computer, consumer electronics, semiconductor, networking, multimedia, military and aerospace, and transportation industries. We license our products worldwide through our direct sales force, distributors, and sales representatives. Revenues outside of North America accounted for 62% of total revenues for fiscal year 2017, 57% for fiscal year 2016, and 55% for fiscal year 2015. We enter into foreign currency exchange contracts in an effort to mitigate the impact of foreign currency fluctuations. See “ Revenues by Geography” in Part II, Item 7. “Management’s Discussion and Analysis of Financial Condition and Results of Operations” and the footnotes to our financial statements included in Part II, Item 8. “Financial Statements and Supplementary Data” for more information.
We are not dependent on any single customer and no single customer accounted for more than 10% of our consolidated net revenues during any of the last three fiscal years. We have traditionally experienced some seasonal fluctuations of orders, with orders typically stronger in the fourth quarter of each year. Due to the complexity of our products, the selling cycle can be six months or longer. During the selling cycle our account managers, application engineers, and technical specialists make technical presentations and product demonstrations to customers. At some point during the selling cycle, our products may also be loaned to customers for on-site evaluation. We primarily ship our software products to customers electronically, and all software products are generally shipped within 180 days after receipt of an order and a substantial portion of quarterly shipments tend to be made in the last month of each quarter. We license our products and some third-party products pursuant to end-user license agreements.
BACKLOG
Our backlog of firm orders was approximately $89 million as of January 31, 2017 compared to $109 million as of January 31, 2016. This backlog includes software products and emulation hardware systems requested for delivery within six months, and professional services and training requested for delivery within one year. We do not track backlog for support services. The January 31, 2017 backlog of orders is expected to be delivered before the end of our fiscal year ending January 31, 2018.
MANUFACTURING OPERATIONS
Our software manufacturing operations primarily consist of reproduction of our technical software, printing of documentation, and assembly. Mentor Graphics (Ireland) Limited, our wholly owned subsidiary, either manufactures or contracts with third-parties to manufacture our products and distributes these tangible products worldwide through our established sales channels. Our line of emulation products, which has a large hardware component, is manufactured principally in the United States (U.S.)
6
on an outsourced basis. See the discussion in Note 17. “Segment Reporting” in Part II, Item 8. “Financial Statements and Supplementary Data” for further detail of the location of property, plant, and equipment.
PRODUCT DEVELOPMENT
Our research and development is focused on continued improvement of our existing products and the development of new products. During the fiscal year ended January 31, 2017 we expensed $412 million related to product research and development compared to $381 million for fiscal years 2016 and 2015. We also seek to expand existing product offerings and pursue new lines of business through acquisitions. During the fiscal years ended January 31, 2017, 2016 and 2015, we amortized purchased technology of $7 million. Our future success depends on our ability to develop or acquire competitive new products that satisfy customer requirements.
COMPETITION
The markets for our products are characterized by price competition, rapid technological advances in application software, and new market entrants. The EDA industry tends to be labor intensive rather than capital intensive. This means that the number of actual and potential competitors is significant. While our two principal competitors are large companies with extensive capital and marketing resources, we also compete with small companies with little capital but innovative ideas. Our principal competitors are Cadence Design Systems, Inc. (Cadence) and Synopsys, Inc. (Synopsys).
We believe the main competitive factors affecting our business are breadth and quality of application software and hardware, product integration, ability to respond to technological change, quality of a company’s sales force, price, size of the installed base, level of customer support, and professional services. We can give no assurance, however, that we will have financial resources, marketing, distribution and service capabilities, depth of key personnel, or technological knowledge to compete successfully in our markets.
EMPLOYEES
We employed approximately 5,968 people full time as of January 31, 2017. Our future success will depend in part on our ability to attract and retain employees. None of our U.S. employees are covered by collective bargaining agreements. Employees in some jurisdictions outside the U.S. are represented by local or national union organizations. We continue to have satisfactory employee relations.
PATENTS AND LICENSES
We regard our products as proprietary and protect our rights in our products and technology in a variety of ways. We currently hold approximately 1,200 patents on inventions embodied in our products or that are otherwise relevant to EDA technology. In addition, we have approximately 250 patent applications pending in the U.S. and elsewhere. While we believe the patent applications relate to patentable technology, we cannot predict whether any patent will issue on a pending application, nor can we assure that any patent can be successfully defended.
We also rely on contractual and technical safeguards to protect our proprietary rights in our products. We typically include restrictions on disclosure, use, and transferability in our license agreements with customers and other parties. In addition, we use our trademark, copyright, and trade secret rights to protect our interests in our products and technology.
Some of our products include software or other IP licensed from other parties. We also license software from other parties for internal use. We may have to seek new licenses or renew these licenses in the future.
7
Item 1A. | Risk Factors. |
The forward-looking statements contained in this report that are not statements of historical fact including without limitation statements containing the words “believes,” “expects,” “projections,” and words of similar meaning, constitute forward-looking statements that involve a number of risks and uncertainties that are difficult to predict. Moreover, from time to time, we may issue other forward-looking statements. Forward-looking statements regarding financial performance in future periods, do not reflect potential impacts of mergers or acquisitions or other significant transactions or events that have not been announced as of the time the statements are made. Actual outcomes and results may differ materially from what is expressed or forecast in forward-looking statements. We disclaim any obligation to update forward-looking statements to reflect future events or revised expectations. Our business faces many risks, and set forth below are some of the factors that could cause actual results to differ materially from the results expressed or implied by our forward-looking statements. Forward-looking statements should be considered in light of these factors.
The announcement and pendency of our agreement to be acquired by United States-based entities affiliated with Siemens AG could adversely affect our business.
On November 14, 2016, we announced that we had entered into a definitive agreement for the Company to be acquired by United States (U.S.)-based entities affiliated with Siemens AG (“Siemens”). Uncertainty about the effect of the proposed transaction on our customers, employees and other parties may adversely affect our business. Customers may refrain from doing business with us or delay placing orders because of uncertainty, which could adversely affect our business, results of operations and financial condition. Our employees may experience uncertainty about their roles or seniority following the transaction. There can be no assurance that our employees, including key personnel, can be retained to the same extent that we have previously been able to attract and retain employees. Any loss or distraction of such employees could adversely affect our business and operations. In addition, we have diverted, and will continue to divert, significant management resources toward the completion of the transaction, which could adversely affect our business and operations. Parties with which we do business may experience uncertainty associated with the transaction and related transactions, including with respect to current or future business relationships with us.
The failure to complete the sale to entities affiliated with Siemens could adversely affect our business.
Completion of the Company's sale to Siemens is subject to conditions, which may or may not be within our control, that may prevent, delay, or otherwise adversely affect its completion. The consummation of the transaction is conditioned on (1) receipt of certain regulatory approvals, including certain foreign antitrust laws, as well as the Committee on Foreign Investment in the U.S.; (2) the accuracy of the representations and warranties and our compliance with the covenants contained in the definitive agreement; and (3) other customary conditions. If any of these conditions are not satisfied or waived, it is possible that the transaction will not be consummated in the expected time frame or that the definitive agreement may be terminated. If the proposed sale or a similar transaction is not completed, the share price of our common stock will drop to the extent that the current market price of our common stock reflects an assumption that a transaction will be completed. In addition, under circumstances defined in the definitive agreement, we may be required to pay a termination fee of $134.45 million to Siemens. Further, a failed transaction may result in negative publicity and a negative impression of us in the investment community. Finally, any disruption to our business resulting from the announcement and pendency of the transaction and from intensifying competition from our competitors, including any adverse changes in our relationships with our customers, employees and other parties, could continue or accelerate in the event of a failed transaction. There can be no assurance that our business, these relationships or our financial condition will not be adversely affected, as compared to the condition prior to the announcement of the transaction, if the transaction is not consummated.
While the acquisition by Siemens is pending, we are subject to business uncertainties and contractual restrictions that could harm our operations and the future of our business or result in a loss of employees.
The definitive agreement for our acquisition includes restrictions on the conduct of our business prior to the completion of the transaction, generally requiring us to conduct our businesses in the ordinary course, consistent with past practice, and subjecting us to a variety of specified limitations unless we obtain Siemens’s prior written consent. We may find that these and other contractual arrangements in the definitive agreement may delay, prevent or limit us from responding effectively to competitive pressures, industry developments and future business opportunities that may arise during such period, even if our management and board of directors think that they may be advisable. In connection with the pending transaction, it is possible that some customers and other persons with whom we have a business relationship may delay or defer certain business decisions or might decide to seek to terminate, change or renegotiate their relationship with us as a result of the transaction. In addition, whether or not the transaction is completed, while it is pending we will continue to incur costs, fees, expenses and charges related to the proposed transaction, which may materially and adversely affect our business results and financial condition.
8
Weakness in the United States and international economies may harm our business.
Our revenue levels are generally dependent on the level of technology capital spending, which includes worldwide expenditures for electronic design automation (EDA) software, hardware, and consulting services. Periods of economic uncertainty arising out of concerns such as weakness in the European Union relating to debt issues or political instability, slowing growth in China, and the continuing weakness of the Japanese economy may adversely affect our customers. In addition, a significant consolidation has been occurring in the semiconductor industry worldwide. As a result, customers may postpone decisions to license or purchase our products, reduce their spending, or be less able or willing to fulfill payment obligations, any of which could adversely affect our business. In addition, significant customer payment defaults or bankruptcies could materially harm our business.
We are subject to the cyclical nature of the integrated circuit and electronics systems industries.
Purchases of our products and services are highly dependent upon new design projects initiated by customers in the integrated circuit (IC) and electronics systems industries. These industries are highly cyclical and are subject to constant and rapid technological change, rapid product obsolescence, price erosion, evolving standards, short product life cycles, and wide fluctuations in product supply and demand. The increasing complexity of ICs and resulting increase in costs to design and manufacture ICs have in recent years led to fewer design starts, which could reduce demand for our products. In addition, the IC and electronics systems industries regularly experience significant downturns, often connected with, or in anticipation of, maturing product cycles within such companies or a decline in general economic conditions. These downturns could cause diminished demand for our products and services.
Our business could be negatively impacted as a result of merger and acquisition activity by our customers.
Like many industries, the semiconductor and electronics industries are subject to mergers, acquisitions and divestitures, and our customers or parts of their business may acquire or be acquired by other customers. Merger and acquisition activity in the semiconductor industry was unusually strong during 2015 and remained strong through the first half of 2016. This activity appears to be the result of semiconductor companies, experiencing slower sales in their existing market segments, desiring to broaden the scope of their businesses and to spread the rising costs of product development and use of advanced technologies across a larger organization. Increasing consolidation could result in fewer customers in these industries or the loss of some customers to competitors, or reduced customer spending on software and services due to redundancies or stronger customer negotiating power, which could have an adverse effect on our business and future revenues.
Our forecasts of our revenues and earnings outlook may be inaccurate.
Our revenues, particularly new hardware and software license revenues, are difficult to forecast. We use a “pipeline” system, a common industry practice, to forecast revenues and trends in our business. Sales personnel monitor the status of potential business and estimate when a customer will make a purchase decision, the dollar amount of the sale, and the products or services to be sold. These estimates are aggregated periodically to generate a sales pipeline. Our pipeline estimates may prove to be unreliable either in a particular quarter or over a longer period of time, in part because the “conversion rate” of the pipeline into contracts can be very difficult to estimate and requires management judgment. A variation in the conversion rate could cause us to plan or budget incorrectly and materially adversely impact our business or our planned results of operations. In particular, a slowdown in customer spending or weak economic conditions generally can reduce the conversion rate in a particular quarter as purchasing decisions are delayed, reduced in amount, or canceled. The conversion rate can also be affected by the tendency of some of our customers to postpone negotiating the terms of a transaction until the end of a fiscal quarter anticipating they will obtain more favorable terms. This may result in failure to agree to terms within the fiscal quarter and cause expected revenue to slip into a subsequent quarter.
Our business could be impacted by fluctuations in quarterly results of operations due to customer seasonal purchasing patterns, the timing of significant orders, and the mix of licenses, products, and services purchased by our customers.
We have experienced, and may continue to experience, varied quarterly operating results. Various factors affect our quarterly operating results and some of these are not within our control, including customer demand and the timing of significant orders. We typically experience seasonality in demand for our products due to the purchasing cycles of our customers, with revenues in the fourth quarter generally being the highest. If planned contract renewals are delayed or the average size of renewed contracts is smaller than we anticipate, we could fail to meet our own and investors’ expectations, which could have a material adverse impact on our business.
9
Our revenues are also affected by the mix of transaction types in which we recognize revenues in different ways as required by accounting rules: as payments become due and payable, on a cash basis, ratably over the license term, or at the beginning of the license term. A shift in the license mix toward increased ratable, due and payable, and/or cash-based revenue recognition could result in increased deferral of revenues to future periods and would decrease current revenues, which could result in not meeting our near-term revenue expectations.
The gross margin on our software is greater than that for our hardware systems, software support, and professional services. Therefore, our gross margin may vary as a result of the mix of products and services sold. We also have a significant amount of fixed or relatively fixed costs, such as employee costs and purchased technology amortization, and costs which are committed in advance and can only be adjusted periodically. As a result, a small failure to reach planned revenues would likely have a relatively large negative effect on resulting earnings. If anticipated revenues do not materialize as expected, our gross margin and operating results could be materially adversely impacted.
We face intense price competition in the EDA industry.
Price competition in the EDA industry is intense, which can lead to, among other things, price reductions, longer selling cycles, lower product margins, loss of market share, and additional working capital requirements. If our competitors offer significant discounts on certain products, we may need to lower our prices or offer other favorable terms to compete successfully. Any such changes would likely reduce margins and could materially adversely impact our operating results. Any broad-based changes to our prices and pricing policies could cause new license and service revenues to decline or be delayed as the sales force implements and our customers adjust to the new pricing policies. Some of our competitors may bundle certain software or hardware products with other more desirable products at low prices or no marginal cost for promotional purposes as a long-term pricing strategy, or engage in predatory pricing. These practices could significantly reduce demand for our products or limit our pricing.
We currently compete primarily with two large companies: Synopsys, Inc. (Synopsys) and Cadence Design Systems, Inc. (Cadence). We also compete with smaller companies with focused product portfolios and manufacturers of electronic devices and semiconductor equipment that have acquired or internally developed their own EDA products.
Emulation technology is complex and difficult to develop; inaccurate forecasts of customer demand for existing and new emulation products may adversely affect our results.
Designing, developing, and introducing new emulation products is a complicated process. The development process for our emulation products requires a high level of innovation. After the development phase, we must be able to forecast customer demand and manufacture next generation products with features, capacity and performance desired by customers in sufficient volumes to meet this demand in a cost effective manner. Our manufacturing model, in which our emulation products generally are not built until after customer orders have been forecast, may from time to time experience delays in delivering products to customers in a timely manner. These delays could cause our customers to purchase emulation products from our competitors. Customers may also delay purchases of existing products in anticipation of our next generation product releases or those of our competitors. We may be unable to minimize this impact by anticipating and managing the addition of, and transition to, new generations of emulation hardware. Conversely, if we manufacture emulation products in anticipation of future sales which do not timely occur, we may hold excess inventory with associated risks of product obsolescence.
We may experience difficulty in manufacturing our emulation hardware.
We currently use one manufacturer to assemble our hardware emulation products and purchase some components from a single supplier. We may be exposed to delays in production and delivery of our emulation products due to delays in receiving components or manufacturing constraints; components rejected that do not meet our standards; components with latent defects; low yields of ICs, subassemblies, or printed circuit boards (PCBs); or other delays in the manufacturing process. For single source parts we purchase for our emulation products, there can be no assurance that if a supplier cannot deliver, a second source can be found on a timely basis. Our reliance on sole suppliers may also result in reduced control over product pricing and quality. Natural disasters such as weather or earthquakes may adversely affect the supply of components, sub-assemblies or shipment of final products.
Foreign currency fluctuations may have an adverse impact on our operating results.
We typically generate more than half of our revenues from customers outside the U.S. and we generate approximately 40% of our expenses outside the U.S. While most of our international sales are denominated in U.S. dollars, our international operating expenses are typically denominated in foreign currencies. Significant changes in currency exchange rates, particularly in the Japanese yen and the euro, could have an adverse impact on our operating results.
10
Our international operations involve risks that could increase our expenses, adversely affect our operating results, and require increased time and attention of our management.
Our international operations subject us to risks in addition to those we face in our domestic operations, including longer receivable collection periods; issues relating to complying with complex customs regulations and paying customs duties and value added taxes; changes in a specific country’s or region’s economic or political conditions; trade protection measures; trade sanctions, such as those imposed on Russia by the U.S. and the European Union; local labor laws; import or export licensing requirements; anti-corruption, anti-bribery, and other similar laws; loss or modification of exemptions for taxes and tariffs; limitations on repatriation of earnings; and difficulties with licensing and protecting our intellectual property (IP) rights. If we violate laws related to our business, we could be subject to penalties, fines, or other sanctions and could be prohibited or restricted from doing business in one or more countries.
Integrated circuit, printed circuit board and systems technology evolves rapidly.
The complexity of ICs, PCBs, and electrical systems continues to rapidly increase. In response to this increasing complexity, new design tools and methodologies must be invented or acquired quickly to remain competitive. If we fail to quickly respond to new technological developments, our products could become obsolete or uncompetitive, which could materially adversely impact our business.
We may have to replace emulation components under warranty or under support contracts.
Our emulation hardware products are complex and despite pre-shipment testing, some defects may only appear after the products are put into use under operating conditions, including longer-term, continuous use at high capacities. As a result, customers may experience failures requiring us to replace components under warranty or as part of our customer support obligations, thus increasing our costs and reducing availability of components for other sales.
Errors or defects in our products and services could expose us to liability.
Our customers use our products and services in designing and developing products that involve a high degree of technological complexity and have unique specifications. Due to the complexity of the systems and products with which we work, some of our products can be adequately tested only when put to full use in the marketplace. As a result, our customers or their end users may discover errors or defects in our software, or the products or systems designed with or manufactured using our software may not operate as expected. Errors or defects could result in:
• | Loss of current customers and market share, and loss of or delay in revenue; |
• | Failure to attract new customers or achieve market acceptance; |
• | Diversion of development resources to resolve problems resulting from errors or defects; |
• | Disputes with customers relating to such errors or defects, which could result in litigation or other concessions; and |
• | Increased support or service costs. |
In addition, we include limited amounts of third-party technology in our products and we rely on those third parties to provide support services to us. Failure of those third parties to provide necessary support services could materially adversely impact our business.
Long sales cycles and delay in customer completion of projects make the timing of our revenues difficult to predict.
Our products have long sales cycles. A lengthy customer evaluation and approval process is generally required due to the complexity and expense associated with our products and services. Consequently, we may incur substantial expenses and devote significant management effort and expense to develop potential relationships that do not result in agreements or revenues and may prevent us from pursuing other opportunities. Purchases of our products and services are sometimes discretionary and may be delayed if customers postpone approval or commencement of projects due to budgetary constraints, internal acceptance review procedures, timing of budget cycles, or timing of competitive evaluation processes. Long sales cycles for our hardware products may subject us to risks over which we have limited control, including insufficient, excess, or obsolete inventory, variations in inventory valuation, and fluctuations in quarterly operating results.
Any loss of our leadership position in certain categories of the EDA market could harm our business.
The industry in which we compete is characterized by very strong leadership positions in specific categories of the EDA market. For example, one company may have a large percentage of sales in the physical verification category of the market while another may have a similarly strong position in mixed-signal simulation. These strong leadership positions can be maintained for significant periods of time as the software is difficult to master and customers are disinclined to make changes
11
once their employees, as well as others in the industry, have developed familiarity with a particular software product. For these reasons, much of our profitability arises from niche areas in which we are the leader. Conversely, it is difficult for us to achieve significant profits in niche areas where other companies are the leaders. If for any reason we lose our leadership position in an important niche, our business could be materially adversely impacted.
Conflict minerals regulations may adversely impact our ability to conduct our business.
The Securities and Exchange Commission (SEC) has adopted disclosure rules for companies that use conflict minerals (commonly referred to as tantalum, tin, tungsten, and gold) in their products, with substantial supply chain verification requirements if the materials come from, or could have come from, the Democratic Republic of the Congo or adjoining countries. These requirements could affect the sourcing, availability, and pricing of materials used in our hardware products as well as the companies we use to manufacture our products and their components. As a result, there may only be a limited pool of suppliers who provide conflict-free metals, and we cannot provide assurance that we will be able to obtain products in sufficient quantities or at competitive prices. The costs of complying with these rules could adversely affect our current or future business.
Pre-announcing products may adversely impact current sales.
We or our competitors sometimes pre-announce or provide “road maps” of the expected availability of new hardware or software products or product features. Such pre-announcements, whether offered by the pre-announcing company or its competitors, can result in customers canceling or deferring orders for currently offered products anticipating that currently offered products may be uncompetitive or lacking in features or performance. In the case of hardware products, slowing sales may cause inventories to increase or become obsolete, resulting in the need to discount or reduce production of current products.
We derive a substantial portion of our revenues from relatively few product groups.
We derive a substantial portion of our revenues from sales of relatively few product groups and related support services. As a result, any factor adversely affecting sales of these products, including product release cycles, market acceptance, product competition, performance and reliability, reputation, price competition, and economic and market conditions, could harm our operating results.
Accounting rules governing revenue recognition are complex and periodically change.
The accounting rules governing revenue recognition are complex and are revised periodically. In May 2014, the Financial Accounting Standards Board (FASB) issued Accounting Standards Update (ASU) No. 2014-09, Revenue from Contracts with Customers (Topic 606), which supersedes nearly all existing revenue recognition guidance under U.S. generally accepted accounting principles (GAAP). This rule is based on the principle that the amount of revenue recognized should reflect the consideration an entity expects to receive for goods and services provided to customers. The rule defines a five step process for revenue recognition, making it possible for more judgment and estimation within the revenue recognition process than is required under existing U.S. GAAP. Currently, we will be required to implement this guidance in the first quarter of fiscal year 2019. The standard permits the use of either a retrospective or cumulative effect transition method. We have not yet selected a transition method, nor have we determined the effect of the standard on our ongoing financial reporting. Implementation of this new standard could have a significant effect on our reported financial results.
We may have additional tax liabilities.
Significant judgments and estimates are required in determining the provision for income taxes including the determination of research and development incentives and other credits and other tax liabilities worldwide. Our tax expense may be impacted if our intercompany transactions, which are required to be computed on an arm’s-length basis, are successfully challenged by tax authorities. The application of transfer pricing involves subjectivity, with a variety of application between countries. Transfer pricing disputes are especially common in certain countries, and on specific types of transactions such as business and IP transfers and management fees, and are increasingly resulting in litigation. Additionally, our tax expense could be impacted by the applicability of withholding taxes on software licenses, services, and related intercompany transactions in certain jurisdictions. Furthermore, our tax expense could be impacted if a tax authority successfully asserted that we, or one of our subsidiaries, has a taxable presence in a country where that member of our group is not currently filing. Increasingly, tax authorities are asserting that foreign companies have unreported taxable presences, and various authorities are either evaluating or adjusting their laws and practices to lower the threshold for a taxable presence in conjunction with the Organisation for Economic Co-operation and Development’s (OECD) Base Erosion and Profit Shifting (BEPS) Project.
In determining the adequacy of income taxes, we assess the likelihood of adverse outcomes that could result if our tax positions were challenged by the Internal Revenue Service (IRS) and other local or foreign tax authorities. The tax authorities in many of
12
the countries where we do business regularly examine our income and other tax returns, and the ultimate outcome of these tax audits or other examinations cannot be predicted with certainty.
U.S. income taxes and foreign withholding taxes have not been provided for on undistributed earnings of certain of our non-U.S. subsidiaries to the extent that such earnings are considered to be indefinitely reinvested in the operations of those subsidiaries. A change in our decision concerning the amount of historical foreign earnings not considered indefinitely reinvested could increase our effective tax rate.
Forecasting our income tax rate is complex and subject to uncertainty.
The computation of income tax expense (benefit) is complex as it is based on the laws of numerous taxing jurisdictions and requires significant judgment on the application of complicated rules governing accounting for tax provisions under U.S. GAAP. Income tax expense (benefit) for interim quarters is based on a forecast of our global tax rate, including a separate determination for entities, if any, with losses for which no tax benefit is obtained. This forecast contains numerous assumptions and includes forward looking financial projections, such as the expectations of profit and loss by jurisdiction. Various items cannot be accurately forecast and future events may be treated as discrete to the period in which they occur. Our income tax rate can be materially impacted, for example, by the geographical mix of our profits and losses; changes in our business, such as internal restructuring and acquisitions; changes in tax laws and accounting guidance, and other regulatory, legislative or judicial developments; tax audit determinations; changes in our tax positions; changes in our intent and capacity to permanently reinvest foreign earnings; changes in the timing of repatriations of non-permanently reinvested foreign earnings; changes to our transfer pricing practices; tax deductions attributed to equity compensation; and changes in our valuation allowance for deferred tax assets. For these reasons, our overall global tax rate may be materially different from our forecast.
Certain tax policy efforts, including the OECD’s BEPS Project, the European Commission’s state aid investigations, and other initiatives could have a material effect on the taxation of international businesses, particularly companies with global IP and supply chain structures, and companies which publish software. Furthermore, many of the countries where we are subject to taxes, including the U.S., are independently evaluating their tax policies and we may see significant changes in legislation and regulations concerning taxation. Certain countries have already enacted legislation which could affect international businesses, and other countries have become more aggressive in their approach to audits and enforcement of their applicable tax laws. Such changes, to the extent they are brought into tax legislation, regulations, policies, or practices, could increase our effective tax rates in various countries where we have operations and our overall tax rate could be materially affected, impacting our operating results, cash flows and financial condition.
There are limitations on the effectiveness of controls.
We do not expect that disclosure controls or internal control over financial reporting will prevent all errors and all fraud or that our policies and procedures can prevent all violations of the law by our employees, contractors, or agents. A control system, no matter how well designed and operated, can provide only reasonable, not absolute, assurance that the control system’s objectives will be met. Further, the design of a control system must reflect the fact that there are resource constraints and the benefits of controls must be considered relative to their costs. Because of the inherent limitations in all control systems, no evaluation of controls can provide absolute assurance that our control system will detect all errors and instances of fraud, if any, or prevent our employees, contractors, or agents from breaching or circumventing our policies or violating laws and regulations. Failure of our control systems to prevent error and fraud or violations of the law could materially adversely impact us.
We are subject to changing corporate governance regulations that impact compliance costs and risks of noncompliance.
Rules and regulations set out by various governmental and self-regulatory organizations in the U.S. such as the SEC, NASDAQ, the Financial Industry Regulatory Authority, and the FASB, as well as in other worldwide locations where we operate, are continually evolving in scope and complexity which makes compliance increasingly difficult and uncertain. The increase in costs to develop awareness and comply with such evolving rules and regulations as well as any risk of noncompliance could adversely impact us.
We may not realize revenues as a result of our investments in research and development.
We incur substantial expense to develop new products. Research and development activities are often performed over long periods of time. These efforts may not result in successful product offerings because of changes in market conditions, competitive product offerings, advancements in technology or our failure to successfully develop products based on that research and development activity. As a result, we could realize little or no revenues related to our investment in research and development.
13
We may acquire other companies and may not successfully integrate them.
We have acquired numerous businesses and are frequently in discussions with potential acquisition candidates, and we may acquire other businesses in the future. While we generally analyze potential transactions before committing to them, we cannot provide assurance that any completed transaction will result in long-term benefits to us or our shareholders or that we will be able to manage the acquired businesses effectively. In addition, growth through acquisition involves a number of risks. If any of the following events occurs after we acquire another business, it could materially adversely impact us:
• | Difficulties in combining previously separate businesses into a single unit; |
• | The substantial diversion of management’s attention from ongoing business when integrating the acquired business; |
• | The failure to realize anticipated benefits, such as cost savings and increases in revenues; |
• | The failure to retain key personnel of the acquired business; |
• | Difficulties related to assimilating the products and services of an acquired business in, for example, distribution, engineering, and customer support areas; |
• | Unanticipated costs; |
• | Unanticipated liabilities or litigation in connection with or as a result of an acquisition, including claims from terminated employees, customers, or third parties; |
• | Adverse impacts on existing relationships with suppliers and customers; and |
• | Failure to understand and compete effectively in markets in which we have limited experience. |
Acquired businesses may not perform as projected, which could result in impairment of acquisition-related intangible assets. Additional challenges include integration of sales channels, training and education of the sales force for new product offerings, integration of product development efforts, integration of systems of internal controls, and integration of information systems. Accordingly, in any acquisition there will be uncertainty as to the achievement and timing of projected synergies, cost savings, and sales levels for acquired products. All of these factors could impair our ability to forecast, meet revenues and earnings targets, and effectively manage our business for long-term growth.
Our competitors may acquire technology or other companies that impact our business.
Our competitors may acquire technology or companies offering competing or complementary product offerings which could adversely impact our ability to compete. A competitor may be able to deliver better or broader product offerings, offer better pricing, or otherwise make it more desirable for our customers to buy more of the tools in their design flow after the acquisition. In addition, our competitors may purchase companies or technology that we had an interest in acquiring, which could limit our expansion into certain market segments. Similarly, our competitors may purchase companies or technology on which we have a dependency resulting from our having bundled the acquired software with our products for licensing to customers or our use of the acquired software in our research and development environment.
Customer payment defaults could adversely affect our timing of revenue recognition.
We use fixed-term license agreements as standard business practices with customers we believe are creditworthy. These multi-year, multi-element term license agreements have payments spread over the license term and are typically about three years in length for semiconductor companies and about four years in length for IC foundries and military and aerospace companies. The complexity of these agreements tends to increase the risk of non-collectibility from customers that can arise for a variety of reasons including ability to pay, product dissatisfaction, and disputes. If we are unable to collect under these agreements, our results of operations could be materially adversely impacted. We have a history of successfully collecting under the original payment terms of fixed-term license agreements without making concessions on payments, products, or services. If we no longer had a history of collecting without providing concessions on the terms of the agreements, U.S. GAAP would require revenue to be recognized as the payments become due and payable over the license term. This change could have a material adverse impact on our near-term results.
We may not adequately protect our proprietary rights or we may fail to obtain software or other intellectual property licenses.
Our success depends, in large part, upon our proprietary technology. We generally rely on patents, copyrights, trademarks, trade secret laws, licenses, and restrictive agreements to establish and protect our proprietary rights in technology and products. Despite precautions we take to protect our IP, we cannot provide assurance that third parties will not challenge, invalidate, or circumvent these protections. The companies in the EDA industry, as well as entities and persons outside the industry, continue to obtain patents at a rapid rate. We cannot predict if any of these patents will cover any of our products. In addition, many of
14
these entities have substantially larger patent portfolios than we have. As a result, we may on occasion be forced to engage in costly patent litigation to protect our rights or defend our customers’ rights. We may also need to settle these claims on terms that are unfavorable; such settlements could result in the payment of significant damages or royalties, or force us to stop selling or redesign one or more products. We cannot provide assurance that the rights granted under our patents will provide us with a competitive advantage, that patents will be issued on any of our pending applications, or that future patents will be sufficiently broad to protect our technology. In addition, recent U.S. court decisions have weakened the enforceability of patents for software-related inventions, which make up a large portion of our patent portfolio. Furthermore, the laws of foreign countries may not protect our proprietary rights in those countries to the same extent as U.S. law protects these rights in the U.S. In addition, despite the actions we take to limit piracy, other parties regularly illegally copy and use our products, which results in lost revenue.
Some of our products include software or other IP licensed from third parties, and we may have to seek new licenses or renew existing licenses for software and other IP in the future. Failure to obtain software or other IP licenses or rights from third parties on favorable terms could materially adversely impact us.
Alice court ruling could have a negative effect on the validity of some of our U.S. patents.
On June 19, 2014, the U.S. Supreme Court issued a significant decision in Alice Corp. Pty. Ltd. v. CLS Bank Int'l, in which the Court tightened the standard for patentability of software inventions. The Court stated that if a person has an idea so abstract that it cannot be patented, simply tying it to a “generic computer cannot transform a patent-ineligible abstract idea into a patent-eligible invention.” Many commentators believe the Alice decision is another in a line of cases intended to limit the use of poor quality software patents. In any event, the Alice decision will provide accused infringers of software patents new arguments to challenge the validity of such patents. At this time, the effects of the Alice decision are still being assessed by patent holders, attorneys, the U.S. Patent and Trademark Office and courts. The Alice decision and related U.S. Supreme Court decisions could potentially have a negative effect on the validity of some of our U.S. patents.
Intellectual property infringement actions may harm our business.
Patent holders are making increasing efforts to monetize their patent portfolios. IP infringement claims against us directly, or where we contractually must defend our customers, could result in costly litigation and consume significant time of employees and management. In addition, IP litigation could harm our business, due to damage awards, payment of legal fees, an obligation to refund license fees to a customer or forgo receipt of future customer payments, the need to license technology on what might be unfavorable business terms, injunctions that could stop or delay future shipments, or the need to redesign our technology. For example, we are currently engaged in patent infringement litigation involving Emulation and Verification Engineering S.A., EVE-USA, Inc., and Synopsys. Further information regarding these lawsuits is contained in Part I, Item 3. “Legal Proceedings”.
Our use of open source software could negatively impact our ability to sell our products and may subject us to unanticipated obligations.
The products, services or technologies we acquire, license, provide or develop may incorporate or use open source software. We monitor and restrict our use of open source software in an effort to avoid unintended consequences, such as reciprocal license grants, patent retaliation clauses, and the requirement to license our products at no cost. Nevertheless, we may be subject to unanticipated obligations regarding our products which incorporate open source software.
Our failure to attract and retain key employees may harm us.
We depend on the efforts and abilities of our senior management, our research and development staff, and a number of other key management, sales, support, technical, and services personnel. Competition for experienced, high-quality personnel is intense, and we cannot provide assurance that we can continue to recruit and retain such personnel. Our failure to hire and retain such personnel could impair our ability to develop new products and manage our business effectively.
We have global sales and research and development offices in parts of the world that are not as politically stable as the United States.
We have global sales and research and development offices, some of which are in parts of the world that are not as politically stable as the U.S. In particular, approximately 15% of our workforce, and a larger percentage of our engineers, are located in our offices in Armenia, Egypt, Israel, Morocco, Pakistan, and Russia which are subject to disruption or closure from time to time. As a result, we may face a greater risk of business interruption as a result of potential unrest, terrorist acts, or military conflicts than businesses located domestically. This could have a material adverse effect on product delivery and our research and development operations.
15
Our business is subject to the risk of natural disasters.
We have sales and research and development offices worldwide which may be adversely affected by weather, earthquakes, or other natural disasters. If a natural disaster occurs at or near any of our offices, our operations may be interrupted, which could adversely impact our business and results of operations. In addition, if a natural disaster impacts a significant number of our customers, our business and results of operations could be adversely impacted.
If our information technology security measures are breached, our information systems may be perceived as being insecure, which could harm our business and reputation.
Our products and services involve the storage and transmission of proprietary information owned by us and our customers. We have sales and research and development offices throughout the world. Our operations are dependent upon the connectivity of our operations worldwide. Despite our security measures, our information technology and infrastructure may be vulnerable to breach by cyber-attacks, errors or malicious actions by employees or contractors, or other disruptions that could result in unauthorized disclosure of sensitive information and could significantly interfere with our business operations. Breaches of our security measures could expose us to a risk of loss or misuse of this information, adverse publicity, violations of privacy laws, and litigation. Because techniques used to obtain unauthorized access or to sabotage information systems change frequently and generally are not recognized until launched against a target, we may be unable to anticipate these techniques or to implement adequate preventive measures. In addition, with the use of “cloud” services in our business, despite our attempts to validate the security of such services, proprietary information may be misappropriated by third parties. If there is an actual or perceived breach of our security, or the security of one of our vendors, the market perception of the effectiveness of our security measures could be harmed and we could suffer damage to our reputation or our business, lose existing customers or increase the difficulty of gaining new customers.
Our revolving credit facility has financial and non-financial covenants, and default of any covenant could materially adversely impact us.
Our bank revolving credit facility imposes operating restrictions on us in the form of financial and non-financial covenants. Financial covenants include adjusted quick ratio, tangible net worth, leverage ratio, senior leverage ratio, and minimum cash and accounts receivable ratio. If we were to fail to comply with the financial covenants and did not obtain a waiver from our lenders, we would be in default under the revolving credit facility and our lenders could terminate the facility and demand immediate repayment of all outstanding loans under the revolving credit facility. The declaration of an event of default could have a material adverse effect on our financial condition. We could also find it difficult to obtain other bank lines or credit facilities on comparable terms.
We have a substantial level of indebtedness.
As of January 31, 2017, we had $289.9 million of outstanding indebtedness, which includes principal of $253.0 million of 4.00% Convertible Subordinated Debentures due 2031 (4.00% Debentures), $5.2 million in other notes payable, and $31.7 million in short-term borrowings. This level of indebtedness among other things could:
• | Make it difficult for us to satisfy payment obligations on our debt; |
• | Make it difficult for us to incur additional indebtedness or obtain any necessary financing in the future for working capital, capital expenditures, debt service, acquisitions, or general corporate purposes; |
• | Limit our flexibility in planning for or reacting to changes in our business; |
• | Reduce funds available for use in our operations; |
• | Make us more vulnerable in the event of a downturn in our business; and |
• | Place us at a possible competitive disadvantage relative to less leveraged competitors and competitors that have greater access to capital resources. |
We may also be unable to borrow funds as a result of an inability of financial institutions to lend due to restrictive lending policies and/or institutional liquidity concerns.
Our 4.00% Debentures are convertible under certain circumstances at a conversion price as of January 31, 2017 of $19.82 per share (as adjusted for the effect of cash dividends and other applicable items). These circumstances include the market price of our common stock exceeding 120% of the conversion price, or $23.78 per share as of January 31, 2017, for at least 20 of the last 30 trading days of the previous fiscal quarter. The 4.00% Debentures are currently convertible. If any of the holders elect to convert their debentures, we are required to pay cash for at least the principal amount of any converted debentures and cash or shares for the excess of the value of the converted shares over the principal amount. If holders of a significant amount of our
16
4.00% Debentures elect to convert, we could have difficulty paying the amount due upon conversion, which would have a material adverse impact on our liquidity and financial condition.
If we experience a decline in revenues, we could have difficulty paying amounts due on our indebtedness. Any default under our indebtedness could have a material adverse impact on our business, operating results, and financial condition.
Ability to pay dividends.
We currently declare and pay quarterly cash dividends on our common stock. Any future payment of cash dividends will depend upon our financial condition, earnings, available cash, cash flow, and other factors our board of directors deems relevant. Our revolving credit facility contains certain financial and other covenants, including a limit on the aggregate amount we can pay for dividends and repurchases of our stock over the term of the facility of $200 million plus 70% of our cumulative net income (loss) for periods ending after February 1, 2016. In addition, our board may decrease or discontinue payment of dividends at any time, and payment of dividends will cease upon our acquisition by Siemens.
17
Item 1B. | Unresolved Staff Comments. |
None.
Item 2. | Properties. |
We own seven buildings on 43 acres of land in Wilsonville, Oregon, occupying approximately 391,000 square feet in those buildings as our corporate headquarters. We also own an additional 65 acres of undeveloped land adjacent to our headquarters. Most administrative functions and a significant amount of our domestic research and development operations are located at the Wilsonville site. We own four buildings totaling approximately 277,000 square feet in Fremont, California which house research and development, sales, and administrative staff. We own two buildings totaling approximately 46,000 square feet in Shannon, Ireland which house information technology and administrative staff.
We lease additional space in Longmont, Colorado; Arcadia, California; Kirkland, Washington; Huntsville and Mobile, Alabama; Novi, Michigan; and Marlborough and Waltham, Massachusetts where some of our domestic research and development takes place; and in various locations throughout the United States and in other countries, primarily for sales and customer service operations. Additional research and development is done in locations outside the United States including locations in Armenia, Canada, Chile, Egypt, France, Germany, Hungary, India, Israel, Morocco, Pakistan, Poland, Romania, Russia, Taiwan, and the United Kingdom. We believe that we will be able to renew or replace our existing leases as they expire and that our current facilities will be adequate through at least the fiscal year ending January 31, 2018.
Item 3. | Legal Proceedings. |
From time to time we are involved in various disputes and litigation matters that arise in the ordinary course of business. These include disputes and lawsuits relating to intellectual property (IP) rights, contracts, distributorships, and employee relations matters. Periodically, we review the status of various disputes and litigation matters and assess our potential exposure. When we consider the potential loss from any dispute or legal matter probable and the amount or the range of loss can be estimated, we will accrue a liability for the estimated loss. Legal proceedings are subject to uncertainties, and the outcomes are difficult to predict. Because of such uncertainties, we base accruals on the best information available at the time. As additional information becomes available, we reassess the potential liability related to pending claims and litigation matters and may revise estimates. We believe that the outcome of current litigation, individually and in the aggregate, will not have a material effect on our results of operations.
In some instances, we are unable to reasonably estimate any potential loss or range of loss. The nature and progression of litigation can make it difficult to predict the impact a particular lawsuit will have. There are many reasons why we cannot make these assessments, including, among others, one or more of the following: a proceeding being in its early stages; damages sought that are unspecific, unsupportable, unexplained or uncertain; discovery not having been started or being incomplete; the complexity of the facts that are in dispute; the difficulty of assessing novel claims; the parties not having engaged in any meaningful settlement discussions; the possibility that other parties may share in any ultimate liability; and/or the often slow pace of litigation.
Synopsys, Inc., Emulation and Verification Engineering S.A. and EVE-USA, Inc.
In December 2012, Synopsys, Inc. (Synopsys) filed a lawsuit claiming patent infringement against us in the United States (U.S.) District Court for the Northern District of California, alleging that our Veloce® family of products infringed four Synopsys U.S. patents. In January 2015, the court issued a summary judgment order in our favor invalidating all asserted claims of three of the Synopsys patents. In June 2015, the U.S. Patent and Trademark Office ruled that claims of the remaining patent asserted against us by Synopsys are unpatentable. This case is no longer on the court’s docket for trial. Synopsys appealed the decisions by both the district court and the U.S. Patent and Trademark Office. The Court of Appeals for the Federal Circuit has unanimously confirmed the invalidity of all four Synopsys patents.
In June 2013, Synopsys also filed a claim against us in the U.S. District Court for the District of Oregon, similarly alleging that our Veloce family of products infringed two additional Synopsys U.S. patents.
We believe these lawsuits were filed in response to patent lawsuits we filed in 2010 and 2012 in the U.S. District Court for the District of Oregon against Emulation and Verification Engineering S.A. and EVE-USA, Inc. (together EVE), which Synopsys acquired in October 2012. We alleged in our lawsuits that EVE (and later Synopsys) infringed five Mentor Graphics' patents.
Both of Synopsys' patents and four of our patents were removed from the Oregon case on summary judgment, and we proceeded to trial on our one remaining patent - U.S, Patent No. 6,240,376 (the '376 Patent). On October 10, 2014, a jury found that EVE and Synopsys infringed the '376 Patent. As part of the verdict, the jury awarded us damages of approximately $36
18
million. As of January 31, 2017 nothing has been included in our financial results for this award. On March 12, 2015, the Oregon court granted our request for a permanent injunction against future sales of Synopsys emulators containing the infringing technology.
Synopsys filed an appeal, and sought to have the infringed claims invalidated by the U.S. Patent and Trademark Office.
On December 15, 2016, the U.S. Patent and Trademark Office dismissed Synopsys' challenge to the validity of claims 1 and 28 of the '376 Patent based on a prior proceeding. Synopsys' challenge to claims 24, 26, and 27 of the '376 Patent remains pending.
On March 16, 2017, the Federal Circuit issued its order on Synopsys' appeal, affirming the jury's finding of infringement and the $36 million damages award in our favor. The Court also found that the litigation could continue with three of our patents, and one Synopsys patent, that had been removed from the case on summary judgment. The Court further found that we could proceed with a claim of willful infringement, which can result in a trebled damages award. The Federal Circuit's decision enables us to proceed to trial on these claims in the U.S. District Court for the District of Oregon.
We do not have sufficient information upon which to determine that a loss in connection with these matters is probable, reasonably possible, or estimable, and thus no liability has been established nor has a range of loss been disclosed.
Securities Class Action and Shareholder Derivative Lawsuits
On March 18, 2016, a purported securities class action lawsuit, Haroutunian v. Mentor Graphics, was filed in the U.S. District Court for the District of Oregon against the Company and three executive officers alleging violations of federal securities laws. The lawsuit alleges that the Company and certain of our officers made material misstatements and omissions in press releases, Securities and Exchange Commission filings and analyst conference calls concerning the Company's business prospects and financial projections that artificially inflated the price of the Company’s stock. The lead plaintiff has been appointed and plaintiff's amended complaint was filed with the court on August 10, 2016. The Company and other defendants have moved to dismiss the amended complaint. A class of plaintiffs has not been certified by the court. The amended complaint does not request a specific amount of damages and we are unable to predict the outcome of this lawsuit.
On April 22, 2016, a related shareholder derivative lawsuit was filed in Multnomah County Circuit Court in Oregon, Aransu v. Rhines, against the Company's board of directors at the time, certain executive officers and the Company as a nominal defendant. The plaintiff filed an amended complaint on September 28, 2016. The amended complaint alleges that the directors and officers breached their fiduciary duties to the Company, were unjustly enriched, wasted corporate assets and committed insider selling. The shareholder derivative lawsuit generally alleges the same facts as the securities class action. The parties have agreed to stay proceedings in the Aransu lawsuit, pending the determination of certain issues or occurrence of certain events in the Haroutunian lawsuit. Because the complaint is derivative in nature, it does not seek monetary damages from the Company.
Item 4. | Mine Safety Disclosures. |
Not applicable.
19
Part II
Item 5. | Market for Registrant’s Common Equity, Related Stockholder Matters and Issuer Purchases of Equity Securities. |
Our common stock trades on the NASDAQ Global Select Market under the symbol “MENT.” The following table sets forth for the periods indicated the high and low sales prices for our common stock, as reported by the NASDAQ Global Select Market, and the dividends paid per share:
Quarter ended | April 30 | July 31 | October 31 | January 31 | |||||||||||
Fiscal Year 2017 | |||||||||||||||
High Price | $ | 20.93 | $ | 22.17 | $ | 29.23 | $ | 37.03 | |||||||
Low Price | $ | 16.18 | $ | 19.05 | $ | 20.83 | $ | 28.22 | |||||||
Dividends Paid | $ | 0.055 | $ | 0.055 | $ | 0.055 | $ | 0.055 | |||||||
Quarter ended | April 30 | July 31 | October 31 | January 31 | |||||||||||
Fiscal Year 2016 | |||||||||||||||
High Price | $ | 25.43 | $ | 27.38 | $ | 27.54 | $ | 28.09 | |||||||
Low Price | $ | 22.72 | $ | 23.42 | $ | 21.94 | $ | 16.10 | |||||||
Dividends Paid | $ | 0.055 | $ | 0.055 | $ | 0.055 | $ | 0.055 | |||||||
As of March 15, 2017, we had 304 stockholders of record.
Our revolving credit facility includes a limit on the amount we can pay for dividends and repurchases of our stock. For more information regarding our credit facility, see Note 6. “Short-Term Borrowings” in Part II, Item 8. “Financial Statements and Supplementary Data.”
20
The following graph compares the cumulative 5-year total stockholder return on our common stock relative to the cumulative total return of the S&P Application Software Index, the NASDAQ Market Index and the Philadelphia Semiconductor Index.
Note: The stock price shown on the above graph is not necessarily indicative of future performance.
Period Ending | |||||||||||||||||||||||
Company/Market/Peer Group | 1/31/2012 | 1/31/2013 | 1/31/2014 | 1/31/2015 | 1/31/2016 | 1/31/2017 | |||||||||||||||||
Mentor Graphics Corporation | $ | 100.00 | $ | 123.50 | $ | 151.46 | $ | 169.07 | $ | 129.07 | $ | 276.84 | |||||||||||
NASDAQ Market Index | $ | 100.00 | $ | 113.13 | $ | 149.71 | $ | 171.20 | $ | 172.41 | $ | 212.46 | |||||||||||
S&P Application Software Index | $ | 100.00 | $ | 112.67 | $ | 130.55 | $ | 144.84 | $ | 157.18 | $ | 200.24 | |||||||||||
Philadelphia Semiconductor Index | $ | 100.00 | $ | 102.67 | $ | 134.06 | $ | 169.39 | $ | 162.12 | $ | 254.39 | |||||||||||
The table below sets forth information regarding our repurchases of our common stock during the three months ended January 31, 2017:
Period | Total number of shares purchased | Average price paid per share | Total number of shares purchased as part of publicly announced programs | Maximum dollar value of shares that may yet be purchased under the programs | |||||||||
November 1 - November 30, 2016 | — | $ | — | — | $ | 90,000,045 | |||||||
December 1 - December 31, 2016 | — | — | — | $ | 90,000,045 | ||||||||
January 1 - January 31, 2017 | — | — | — | $ | 90,000,045 | ||||||||
Total | — | $ | — | — | |||||||||
On June 12, 2014, we announced a share repurchase program approved by our Board of Directors, authorizing the repurchase of up to $200 million of our common stock over a 3-year period. The repurchase that occurred in February 2016 was a single transaction excluded from our share repurchase program.
21
Item 6. | Selected Financial Data. |
In thousands, except percentages and per share data
Fiscal year ended January 31, | 2017 | 2016 | 2015 | 2014 | 2013 | ||||||||||||||
Statement of Income Data | |||||||||||||||||||
Total revenues | $ | 1,282,467 | $ | 1,180,988 | $ | 1,244,133 | $ | 1,156,373 | $ | 1,088,727 | |||||||||
Operating income | $ | 203,081 | $ | 136,745 | $ | 187,811 | $ | 183,040 | $ | 161,633 | |||||||||
Net income attributable to Mentor Graphics shareholders | $ | 154,866 | $ | 96,277 | $ | 147,139 | $ | 155,258 | $ | 138,736 | |||||||||
Gross profit percent | 85 | % | 84 | % | 84 | % | 84 | % | 83 | % | |||||||||
Operating income as a percent of revenues | 16 | % | 12 | % | 15 | % | 16 | % | 15 | % | |||||||||
Per Share Data | |||||||||||||||||||
Net income per share attributable to Mentor Graphics shareholders (1): | |||||||||||||||||||
Basic | $ | 1.42 | $ | 0.83 | $ | 1.28 | $ | 1.33 | $ | 1.20 | |||||||||
Diluted | $ | 1.37 | $ | 0.81 | $ | 1.26 | $ | 1.29 | $ | 1.17 | |||||||||
Weighted average number of shares outstanding: | |||||||||||||||||||
Basic | 108,795 | 116,701 | 114,635 | 113,671 | 110,998 | ||||||||||||||
Diluted | 114,322 | 119,263 | 117,078 | 116,702 | 114,017 | ||||||||||||||
Dividends paid | $ | 0.22 | $ | 0.22 | $ | 0.20 | $ | 0.18 | $ | — | |||||||||
As of January 31, | 2017 | 2016 | 2015 | 2014 | 2013 | ||||||||||||||
Balance Sheet Data | |||||||||||||||||||
Cash, cash equivalents, and short-term investments | $ | 441,087 | $ | 334,826 | $ | 230,281 | $ | 297,312 | $ | 223,783 | |||||||||
Working capital | $ | 261,096 | $ | 475,157 | $ | 423,764 | $ | 418,170 | $ | 292,175 | |||||||||
Property, plant, and equipment, net | $ | 210,680 | $ | 182,092 | $ | 170,737 | $ | 160,165 | $ | 162,402 | |||||||||
Total assets | $ | 2,261,185 | $ | 2,064,364 | $ | 2,046,008 | $ | 1,900,144 | $ | 1,740,368 | |||||||||
Short-term borrowings and current portion of notes payable | $ | 274,638 | $ | 33,449 | $ | 7,228 | $ | 9,590 | $ | 5,964 | |||||||||
Long-term portion of notes payable, deferred revenue, long-term, and other noncurrent liabilities | $ | 112,711 | $ | 320,625 | $ | 318,252 | $ | 288,384 | $ | 282,366 | |||||||||
Noncontrolling interest with redemption feature | $ | — | $ | — | $ | 13,372 | $ | 15,479 | $ | 12,698 | |||||||||
Stockholders’ equity | $ | 1,375,683 | $ | 1,320,429 | $ | 1,272,854 | $ | 1,185,294 | $ | 1,033,479 | |||||||||
(1) | We have increased the numerator of our earnings per share calculation by $258 for the fiscal year ended January 31, 2016 and $121 for the fiscal year ended January 31, 2015 for the adjustment to decrease the noncontrolling interest with redemption feature to its calculated redemption value, recorded directly to retained earnings. We have decreased the numerator of our earnings per share calculation by $4,486 for the fiscal year ended January 31, 2014 and $5,272 for the fiscal year ended January 31, 2013 for the adjustment to increase the noncontrolling interest with redemption feature to its calculated redemption value, recorded directly to retained earnings. |
22
Item 7. | Management’s Discussion and Analysis of Financial Condition and Results of Operations. |
Unless otherwise indicated, numerical references are in millions, except for percentages, per share data, and conversion rate data.
OVERVIEW
The following discussion should be read in conjunction with the consolidated financial statements and notes included elsewhere in this Form 10-K. Certain of the statements below contain forward-looking statements. These statements are predictions based upon our current expectations about future trends and events. Actual results could vary materially as a result of certain factors, including but not limited to, those expressed in these statements. In particular, we refer you to the risks discussed in Part I, Item 1A. “Risk Factors” and in our other Securities and Exchange Commission filings, which identify important risks and uncertainties that could cause our actual results to differ materially from those contained in the forward-looking statements.
We urge you to consider these factors carefully in evaluating the forward-looking statements contained in this Form 10-K. All subsequent written or spoken forward-looking statements attributable to our company or persons acting on our behalf are expressly qualified in their entirety by these cautionary statements. The forward-looking statements included in this Form 10-K are made only as of the date of this Form 10-K. We do not intend, and undertake no obligation, to update these forward-looking statements.
THE COMPANY
We are a supplier of electronic design automation (EDA) tools — advanced computer software and emulation hardware systems used to automate the design, analysis, and testing of complex electro-mechanical systems, electronic hardware, and embedded systems software in electronic systems and components. We market our products and services worldwide, primarily to large companies in the communications, computer, consumer electronics, semiconductor, networking, multimedia, military and aerospace, and transportation industries. Through the diversification of our customer base among these various customer markets, we attempt to reduce our exposure to fluctuations within each market. We sell and license our products through our direct sales force and a channel of distributors and sales representatives. In addition to our corporate offices in Wilsonville, Oregon, we have sales, support, research and development, and professional service offices worldwide.
We generally focus on products and design platforms where we have or believe we can attain leading market share. Part of this approach includes developing new applications and exploring new markets where EDA companies have not generally participated. We believe this strategy leads to a more diversified product and customer mix and can help reduce the volatility of our business and our risk as a creditor, while increasing our potential for growth.
We derive system and software revenues primarily from the sale of term software license contracts, which are typically three to four years in length. We generally recognize revenue for these arrangements upon product delivery at the beginning of the license term. Larger enterprise-wide customer contracts, which are approximately 50% or more of our system and software revenue, drive the majority of our period-to-period revenue variances. We identify term licenses where collectibility is not probable and recognize revenue on those licenses when cash is received. Ratable license revenues primarily include short-term term licenses as well as other term licenses where we provide the customer with rights to unspecified or unreleased future products. For these reasons, the timing of large contract renewals, customer circumstances, and license terms are the primary drivers of revenue changes from period to period, with revenue changes also being driven by new contracts and additional purchases under existing contracts, to a lesser extent.
The EDA industry is competitive and is characterized by very strong leadership positions in specific segments of the EDA market. These strong leadership positions can be maintained for significant periods of time as the software can be difficult to master and customers are disinclined to make changes once their employees, as well as others in the industry, have developed familiarity with a particular software product. For these reasons, much of our profitability arises from areas in which we are the leader. We expect to continue our strategy of developing high quality tools with number one market share potential, rather than being a broad-line supplier with undifferentiated product offerings. This strategy allows us to focus investment in areas where customer needs are greatest and where we have the opportunity to build significant market share.
Our products and services are dependent to a large degree on new design projects initiated by customers in the integrated circuit (IC) and electronics system industries. These industries can be cyclical and are subject to constant and rapid technological change, rapid product obsolescence, price erosion, evolving standards, short product life cycles, wide fluctuations in product supply and demand, and industry consolidation. Furthermore, extended economic downturns can result in reduced funding for
23
development due to downsizing and other business restructurings. These pressures are offset by the need for the development and introduction of next generation products once an economic recovery occurs.
KNOWN TRENDS AND UNCERTAINTIES IMPACTING FUTURE RESULTS OF OPERATIONS
Our revenue has historically fluctuated quarterly and has generally been the highest in the fourth quarter of our fiscal year due to our customers’ corporate calendar year-end spending trends and the timing of contract renewals.
Ten accounts make up approximately 45% of our receivables, including both short and long-term balances. We have not experienced and do not presently expect to experience collection issues with these customers.
Net of reserves, we have no receivables greater than 60 days past due (net of cash based revenue invoices), and continue to experience no difficulty in factoring our high quality receivables.
Bad debt expense recorded for the fiscal year ended January 31, 2017 was not material. However, we do have exposures within our receivables portfolio to customers with weak credit ratings. These receivable balances could have a material adverse effect on earnings in any given quarter, should significant additional allowances for doubtful accounts be necessary. However, as discussed in Note 5. “Term Receivables and Trade Accounts Receivable” in Part II, Item 8. “Financial Statements and Supplementary Data”, we regularly evaluate the collectibility of our trade accounts receivable and record specific and general reserves for bad debt as necessary.
Bookings during fiscal year 2017 increased approximately 15% compared to fiscal year 2016 primarily due to the timing of contract renewals and additional business with existing customers. Bookings are the value of executed orders during a period for which revenue has been or will be recognized within six months for software products and emulation hardware systems, and within twelve months for professional services and training. Ten customers accounted for approximately 35% of total bookings for fiscal year 2017 compared to 40% for fiscal year 2016. The number of new customers for fiscal year 2017 was flat compared to fiscal year 2016.
PRODUCT DEVELOPMENT
During the fiscal year ended January 31, 2017, we continued to execute our strategy of focusing on technical challenges encountered by customers, as well as building upon our well-established product families. We believe that customers, faced with leading-edge design challenges in creating new products, generally choose the best EDA products in each category to build their design environment. Through both internal development and strategic acquisitions, we have focused on areas where we believe we can build a leading market position or extend an existing leading market position.
We believe that the development and commercialization of EDA software tools is generally a three to five year process with limited customer adoption and sales in the first years of tool availability. Once tools are adopted, however, their life spans tend to be long. During the fiscal year ended January 31, 2017, we introduced both new products and upgrades to existing products.
CRITICAL ACCOUNTING POLICIES
We base our discussion and analysis of our financial condition and results of operations upon our consolidated financial statements which have been prepared in accordance with United States (U.S.) generally accepted accounting principles. The preparation of these financial statements requires us to make estimates and judgments that affect the reported amounts of assets, liabilities, and contingencies as of the date of the financial statements and the reported amounts of revenues and expenses during the reporting periods. We evaluate our estimates on an ongoing basis. We base our estimates on historical experience, current facts, and on various other assumptions that we believe to be reasonable under the circumstances, the results of which form the basis for making judgments about the carrying values of assets and liabilities and the recording of revenues, costs, and expenses that are not readily apparent from other sources. As future events and their effects cannot be determined with precision, actual results could differ from those estimates.
We believe that the accounting for revenue recognition, valuation of trade accounts receivable, income taxes, business combinations, goodwill, intangible assets, and long-lived assets, special charges, and stock-based compensation are the critical accounting estimates and judgments used in the preparation of our consolidated financial statements. For further discussion of our significant accounting policies, see the discussion in “Critical Accounting Estimates” in Note 2. “Summary of Significant Accounting Policies” in Part II, Item 8. “Financial Statements and Supplementary Data.”
24
RESULTS OF OPERATIONS
Revenues and Gross Profit
Fiscal year ended January 31, | 2017 | Change | 2016 | Change | 2015 | ||||||||||||
System and software revenues | $ | 794.5 | 13 | % | $ | 700.6 | (12 | )% | $ | 799.1 | |||||||
System and software gross profit | $ | 738.9 | 15 | % | $ | 645.0 | (11 | )% | $ | 722.2 | |||||||
Gross profit percent | 93 | % | 92 | % | 90 | % | |||||||||||
Service and support revenues | $ | 488.0 | 2 | % | $ | 480.4 | 8 | % | $ | 445.0 | |||||||
Service and support gross profit | $ | 349.3 | 1 | % | $ | 346.3 | 9 | % | $ | 317.6 | |||||||
Gross profit percent | 72 | % | 72 | % | 71 | % | |||||||||||
Total revenues | $ | 1,282.5 | 9 | % | $ | 1,181.0 | (5 | )% | $ | 1,244.1 | |||||||
Total gross profit | $ | 1,088.2 | 10 | % | $ | 991.3 | (5 | )% | $ | 1,039.8 | |||||||
Gross profit percent | 85 | % | 84 | % | 84 | % | |||||||||||
System and Software
Fiscal year ended January 31, | 2017 | Change | 2016 | Change | 2015 | ||||||||||||
Upfront license revenues | $ | 682.4 | 17 | % | $ | 582.0 | (17 | )% | $ | 704.8 | |||||||
Ratable license revenues | 112.1 | (5 | )% | 118.6 | 26 | % | 94.3 | ||||||||||
Total system and software revenues | $ | 794.5 | 13 | % | $ | 700.6 | (12 | )% | $ | 799.1 | |||||||
We derive system and software revenues from the sale of licenses of software products and emulation hardware systems, including finance fee revenues from our long-term installment receivables resulting from term product sales. Upfront license revenues consist of perpetual licenses and term licenses for which we recognize revenue upon product delivery at the start of a license term. We identify licenses where collectibility is not probable and recognize revenue on those licenses when cash is received. Ratable license revenues primarily consist of short-term term licenses and finance fees from the accretion of the discount on long-term installment receivables.
Ten customers accounted for approximately 35% of system and software revenues for fiscal year 2017, 45% of system and software revenues for fiscal year 2016 and 40% of system and software revenues for fiscal year 2015. No single customer accounted for 10% of total revenues for fiscal years 2017, 2016, and 2015.
System and software revenues increased $93.9 in fiscal year 2017 compared to fiscal year 2016 primarily due to an increase in software license revenues driven by the timing of contract renewals and additional business with existing customers.
System and software revenues decreased $98.5 in fiscal year 2016 compared to fiscal year 2015. The effect of acquisitions completed in fiscal years 2016 and 2015 on fiscal year 2016 system and software revenues was $7.3. The decrease in system and software revenues was driven by a decrease in software license revenues of approximately $45.0 primarily due to a decrease in the growth percentage of contract renewals during the period. The remaining decrease was primarily due to a decrease in sales of emulation hardware systems.
System and software gross profit percentage was higher for fiscal year 2017 compared to fiscal year 2016 and for fiscal year 2016 compared to fiscal year 2015 primarily due to a more favorable product mix.
Service and Support
We derive service and support revenues from software and hardware post-contract maintenance or support services and professional services, which includes consulting, training, and other services. Professional services are lower margin offerings which are staffed according to fluctuations in demand. Support services operate under a less variable cost structure.
Service and support revenues increased $7.6 in fiscal year 2017 compared to fiscal year 2016. The effect of acquisitions completed in fiscal years 2017 and 2016 on fiscal year 2017 service and support revenues resulted in a $10.1 decrease in service and support revenues from acquisitions compared to fiscal year 2016. This decrease was offset by a $10.7 increase in consulting and training revenues due to increased customer demand for services and a $6.5 increase in support revenues resulting from an increase in our installed base.
25
Service and support revenues increased $35.4 in fiscal year 2016 compared to fiscal year 2015. The effect of acquisitions completed in fiscal years 2016 and 2015 on fiscal year 2016 service and support revenues was $11.3. The remaining increase was primarily driven by increased support revenues resulting from an increase in our installed base.
Revenues Information
Revenues by Geography
Fiscal year ended January 31, | 2017 | Change | 2016 | Change | 2015 | ||||||||||||
North America | $ | 490.1 | (3 | )% | $ | 503.2 | (10 | )% | $ | 559.0 | |||||||
Europe | 287.4 | 13 | % | 254.8 | — | % | 255.9 | ||||||||||
Japan | 119.8 | 37 | % | 87.2 | (1 | )% | 87.7 | ||||||||||
Pacific Rim | 385.2 | 15 | % | 335.8 | (2 | )% | 341.5 | ||||||||||
Total revenues | $ | 1,282.5 | 9 | % | $ | 1,181.0 | (5 | )% | $ | 1,244.1 | |||||||
The increase in revenues in Europe, Japan and Pacific Rim for fiscal year 2017 compared to fiscal year 2016 is due to the timing of contract renewals. The decrease in revenues in North America for fiscal year 2016 compared to fiscal year 2015 is due to decreased sales of emulation hardware systems and a decrease in the growth percentage of contract renewals during the period.
We recognize additional revenues in periods when the U.S. dollar weakens in value against foreign currencies. Likewise, we recognize lower revenues in periods when the U.S. dollar strengthens in value against foreign currencies. For fiscal year 2017, approximately 30% of European and approximately 90% of Japanese revenues were subject to exchange rate fluctuations as they were booked in local currencies. For fiscal year 2016, approximately 30% of European and approximately 75% of Japanese revenues were subject to exchange rate fluctuations as they were booked in local currencies. For fiscal year 2015, approximately 25% of European and approximately 75% of Japanese revenues were subject to exchange rate fluctuations as they were booked in local currencies.
Foreign currency had an immaterial impact on revenues for fiscal year 2017 compared to fiscal year 2016. Foreign currency had an unfavorable impact of $21.1 for fiscal year 2016 compared to fiscal year 2015 primarily as a result of the strengthening of the U.S. dollar against euro and Japanese yen.
For additional description of how changes in foreign exchange rates affect our consolidated financial statements, see discussion in Part II, Item 7A. “Quantitative and Qualitative Disclosures About Market Risk–Foreign Currency Risk.”
Revenues by Category
We segregate revenues into five categories of similar products and services. Each category includes both product and related support revenues. Revenues for each category as a percent of total revenues are as follows (percentages rounded to the nearest 5%):
Fiscal year ended January 31, | 2017 | 2016 | 2015 | |||||
Revenues: | ||||||||
IC Design to Silicon | 40 | % | 40 | % | 40 | % | ||
Scalable Verification | 20 | % | 25 | % | 25 | % | ||
Integrated System Design | 20 | % | 20 | % | 20 | % | ||
New and Emerging Markets | 10 | % | 5 | % | 5 | % | ||
Services and Other | 10 | % | 10 | % | 10 | % | ||
Total revenues | 100 | % | 100 | % | 100 | % | ||
As described in Note 2. “Summary of Significant Accounting Policies,” term license arrangements may allow a customer to remix product usage from a fixed list of products at regular intervals during the license term. As a result, actual usage of our products by customers could differ, which could result in the percentages presented above being different.
26
Operating Expenses
Fiscal year ended January 31, | 2017 | Change | 2016 | Change | 2015 | ||||||||||||
Research and development | $ | 412.3 | 8 | % | $ | 381.4 | — | % | $ | 381.1 | |||||||
Marketing and selling | 369.1 | 5 | % | 351.3 | (4 | )% | 365.7 | ||||||||||
General and administration | 85.4 | 16 | % | 73.9 | (7 | )% | 79.2 | ||||||||||
Equity in earnings of Frontline | (3.4 | ) | (41 | )% | (5.8 | ) | 2 | % | (5.7 | ) | |||||||
Amortization of intangible assets | 6.0 | (31 | )% | 8.7 | 6 | % | 8.2 | ||||||||||
Special charges | 15.8 | (65 | )% | 45.1 | 92 | % | 23.5 | ||||||||||
Total operating expenses | $ | 885.2 | 4 | % | $ | 854.6 | — | % | $ | 852.0 | |||||||
Selected Operating Expenses as a Percentage of Total Revenues
Fiscal year ended January 31, | 2017 | 2016 | 2015 | |||||
Research and development | 32 | % | 32 | % | 31 | % | ||
Marketing and selling | 29 | % | 30 | % | 29 | % | ||
General and administration | 7 | % | 6 | % | 6 | % | ||
Total selected operating expenses | 68 | % | 68 | % | 66 | % | ||
We incur a substantial portion of our operating expenses outside the U.S. in various foreign currencies. We recognize additional operating expense in periods when the U.S. dollar weakens in value against foreign currencies and lower operating expenses in periods when the U.S. dollar strengthens in value against foreign currencies. For fiscal year 2017 compared to fiscal year 2016, we experienced favorable currency movements of $6.4 in total operating expenses, primarily due to movements in the Great British pound, Egyptian pound and Indian rupee. For fiscal year 2016 compared to fiscal year 2015, we experienced favorable currency movements of $36.5 in total operating expenses, primarily due to movements in the euro, Russian ruble, Japanese yen and Great British pound. The impact of these currency effects is reflected in the movements in operating expenses detailed below.
Research and Development
Research and development expenses increased by $30.9 for fiscal year 2017 compared to fiscal year 2016 and increased by $0.3 for fiscal year 2016 compared to fiscal year 2015. The components of these changes are summarized as follows:
Change | |||||||
Fiscal year ended January 31, | 2017 vs 2016 | 2016 vs 2015 | |||||
Salaries, incentive compensation, and benefits expenses | $ | 24.8 | $ | (9.2 | ) | ||
Supplies and equipment | 3.5 | 2.5 | |||||
Expenses associated with acquired businesses | 2.8 | 8.1 | |||||
Stock-based compensation | 2.0 | 2.2 | |||||
Outside services | (1.8 | ) | (1.3 | ) | |||
Other expenses | (0.4 | ) | (2.0 | ) | |||
Total change in research and development expenses | $ | 30.9 | $ | 0.3 | |||
27
Marketing and Selling
Marketing and selling expenses increased by $17.8 for fiscal year 2017 compared to fiscal year 2016 and decreased by $14.4 for fiscal year 2016 compared to fiscal year 2015. The components of these changes are summarized as follows:
Change | |||||||
Fiscal year ended January 31, | 2017 vs 2016 | 2016 vs 2015 | |||||
Salaries, incentive compensation, and benefits expenses | $ | 28.0 | $ | (23.8 | ) | ||
Stock compensation | 2.7 | 0.5 | |||||
Expenses associated with acquired businesses | 1.1 | 3.3 | |||||
Emulation demonstration inventory amortization | (7.3 | ) | 7.4 | ||||
Outside services | (1.4 | ) | 0.8 | ||||
Other expenses | (5.3 | ) | (2.6 | ) | |||
Total change in marketing and selling expenses | $ | 17.8 | $ | (14.4 | ) | ||
General and Administration
General and administration expenses increased by $11.5 for fiscal year 2017 compared to fiscal year 2016 and decreased by $5.3 for fiscal year 2016 compared to fiscal year 2015. The components of these changes are summarized as follows:
Change | |||||||
Fiscal year ended January 31, | 2017 vs 2016 | 2016 vs 2015 | |||||
Salaries, incentive compensation, and benefits expenses | $ | 11.5 | $ | (6.4 | ) | ||
Outside services | 1.8 | (1.5 | ) | ||||
Stock-based compensation | 1.2 | 1.7 | |||||
Other expenses | (3.0 | ) | 0.9 | ||||
Total change in general and administration expenses | $ | 11.5 | $ | (5.3 | ) | ||
Special Charges
Fiscal year ended January 31, | 2017 | Change | 2016 | Change | 2015 | ||||||||||||
Employee severance and related costs | $ | 6.8 | (50 | )% | $ | 13.5 | 286 | % | $ | 3.5 | |||||||
Merger costs | 5.5 | — | % | — | — | % | — | ||||||||||
Litigation costs | 1.5 | (63 | )% | 4.1 | (78 | )% | 18.4 | ||||||||||
Other costs, net | 2.0 | (13 | )% | 2.3 | 44 | % | 1.6 | ||||||||||
Voluntary early retirement program | — | (100 | )% | 25.2 | — | % | — | ||||||||||
Total special charges | $ | 15.8 | (65 | )% | $ | 45.1 | 92 | % | $ | 23.5 | |||||||
Special charges include expenses incurred related to employee severance, certain litigation costs, mergers and acquisitions, excess facility costs, and asset related charges.
Employee severance and related costs include severance benefits and notice pay. These rebalance charges generally represent the aggregate of numerous unrelated rebalance plans which impact several employee groups, none of which is individually material to our financial position or results of operations. We determine termination benefit amounts based on employee status, years of service, and local statutory requirements. We record the charge for estimated severance benefits in the quarter that the rebalance plan is approved.
Merger costs for fiscal year 2017 primarily consist of costs incurred related to advisory fees and legal costs associated with the potential merger with Siemens Industry, Inc. (Siemens) and Meadowlark Subsidiary Corporation, a wholly-owned subsidiary of Siemens.
Litigation costs consist of professional service fees for services rendered, related to patent litigation involving us, Emulation and Verification Engineering S.A. and EVE-USA, Inc. (together EVE), and Synopsys, Inc. regarding emulation technology.
We offered the voluntary early retirement program in North America during the three months ended April 30, 2015 in which 110 employees elected to participate. The costs presented here are for severance benefits.
28
Provision for Income Taxes
Fiscal year ended January 31, | 2017 | Change | 2016 | Change | 2015 | ||||||||||||
Income tax expense | $ | 30.0 | 21 | % | $ | 24.8 | 10 | % | $ | 22.6 | |||||||
Effective tax rate | 16 | % | 21 | % | 6 | % | |||||||||||
In fiscal year 2017, our income before taxes of $184.9 consisted of $216.8 of pre-tax income in foreign jurisdictions and a pre-tax loss of $31.9 in the U.S., reflecting substantial earnings by certain foreign operations, including our Irish subsidiaries, and a higher proportion of our operating expenses and financing costs occurring in the U.S.
Generally, the provision for income taxes is the result of the mix of profits and losses earned in various tax jurisdictions with a broad range of income tax rates, withholding taxes (primarily in certain foreign jurisdictions), changes in tax reserves, the provision for U.S. taxes on undistributed earnings of foreign subsidiaries not deemed to be permanently invested, and the application of valuation allowances on deferred tax assets.
Our effective tax rate was 16% for fiscal year 2017. Our tax expense differs from tax expense computed at the U.S. federal statutory rate primarily due to:
• | The benefit of lower tax rates on earnings of foreign subsidiaries; |
• | Recognition of net operating loss carryforwards, foreign tax credit carryforwards and research and experimentation credit carryforwards for which no tax benefit has been recognized in the U.S.; and |
• | The application of tax incentives for research and development. |
These differences are partially offset by:
• | Provision of U.S. income tax on non-permanently reinvested foreign subsidiary earnings to account for the impact of future repatriations; |
• | Increase in reserves for uncertain tax positions; and |
• | Withholding taxes. |
The effective tax rate for fiscal year 2017 was lower than our effective tax rate for fiscal year 2016 primarily due to the benefit of the reduction of U.S. valuation allowance on deferred tax assets recorded in the adoption of Accounting Standards Update (ASU) 2016-09, Compensation-Stock Compensation (Topic 718), Improvements to Employee Share-Based Payment Accounting, and an increase in the proportion of foreign earnings in fiscal year 2017 over fiscal year 2016 that are permanently reinvested outside of the U.S. In contrast, the provision for income taxes increased by $5.2 in fiscal year 2017 compared to fiscal year 2016 primarily due to the overall increase in foreign earnings and the provision of U.S. tax on the significant portion of those earnings that are not permanently reinvested outside of the U.S.
Net deferred tax liabilities increased by $2.2 from January 31, 2016 to January 31, 2017. Gross deferred tax assets increased by $17.0 from January 31, 2016 to January 31, 2017, principally due to the creation of additional research and experimentation credits in the U.S. and the availability of additional foreign tax credits. There was an $8.7 increase in deferred tax liabilities from January 31, 2016 to January 31, 2017 and a valuation allowance increase of $10.5 from January 31, 2016 to January 31, 2017. The changes in both the deferred tax liabilities and the valuation allowance principally related to the amount, and prospective tax thereon, of current year foreign subsidiary earnings treated as not permanently reinvested.
The liability for income taxes associated with net uncertain tax positions was $28.9 as of January 31, 2017 and $19.3 as of January 31, 2016. As of January 31, 2017, within the liability, $5.4 was classified as a short-term liability in income tax payable in our consolidated balance sheet as we generally anticipate the settlement of these liabilities will require payment of cash within the next twelve months. The remaining $23.5 of income tax associated with uncertain tax positions was classified as long-term, in income tax liability in our consolidated balance sheet. We expect uncertain tax positions of $28.9, if recognized, would favorably affect our effective tax rate.
RECENT ACCOUNTING PRONOUNCEMENTS
Information regarding applicable recent accounting pronouncements applicable is discussed in Note 3. “Recent Accounting Pronouncements ” in Part II, Item 8. “Financial Statements and Supplemental Data.”
29
LIQUIDITY AND CAPITAL RESOURCES
Our primary ongoing cash requirements are for product development, operating activities, capital expenditures, repurchases of common stock, dividends, debt service, and acquisition opportunities that may arise. Our primary sources of liquidity are cash generated from operations and borrowings on our revolving credit facility.
We currently have access to sufficient funds for domestic operations and do not anticipate the need to repatriate funds associated with our permanently reinvested foreign earnings for use in U.S. operations. As of January 31, 2017, we have cash totaling $313.9 held by our foreign subsidiaries. A significant portion of our cash held by our foreign subsidiaries is accessible without a significant cash tax cost as the repatriation of foreign earnings will be sheltered from U.S. federal tax by tax credits. To the extent our foreign earnings are not permanently reinvested, we have provided for the tax consequences that would ensue upon their repatriation. In the event funds which are treated as permanently reinvested are repatriated, we will be required to accrue and pay additional taxes to repatriate these funds.
On February 23, 2016 we paid an intercompany dividend from foreign subsidiaries of $150,000. As the earnings associated with these funds were not treated as permanently reinvested, any U.S. tax consequences had already been included in our tax provision in prior periods.
To date, we have experienced no loss or lack of access to our invested cash; however, we can provide no assurances that access to our cash will not be impacted by adverse conditions in the financial markets.
At any point in time, we have significant balances in operating accounts that are with individual third-party financial institutions, which may exceed the Federal Deposit Insurance Corporation insurance limits or other regulatory insurance program limits. We monitor daily the cash balances in our operating accounts and adjust them as appropriate; however, these cash balances could be impacted if the underlying financial institutions fail or are subject to other adverse conditions in the financial markets.
We anticipate that the following will be sufficient to meet our working capital needs on a short-term (twelve months or less) and a long-term (more than twelve months) basis:
• | Current cash balances; |
• | Anticipated cash flows from operating activities, including the effects of selling and financing customer term receivables; |
• | Amounts available under existing revolving credit facilities; and |
• | Other available financing sources, such as the issuance of debt or equity securities. |
We have experienced no difficulties to date in raising debt. However, capital markets can be volatile, and we cannot assure that we will be able to raise debt or equity capital on acceptable terms, if at all.
Cash Flow Information
Fiscal year ended January 31, | 2017 | 2016 | |||||
Cash provided by operating activities | $ | 321.8 | $ | 231.3 | |||
Cash used in investing activities | $ | (72.0 | ) | $ | (53.0 | ) | |
Cash used in financing activities | $ | (145.3 | ) | $ | (72.6 | ) | |
Operating Activities
Cash flows from operating activities consist of our net income adjusted for certain non-cash items and changes in operating assets and liabilities.
30
Trade Accounts and Term Receivables
Our cash flows from operating activities are significantly influenced by the payment terms on our license agreements and by our sales of qualifying accounts receivable. Our customers’ inability to fulfill payment obligations could adversely affect our cash flow. We monitor our accounts receivable portfolio for customers with low or declining credit ratings and increase our collection efforts when necessary. Trade accounts and term receivables consisted of the following:
As of January 31, | 2017 | 2016 | |||||
Trade accounts receivable, net | $ | 512.6 | $ | 493.2 | |||
Term receivables, short-term (included in trade accounts receivable on the balance sheet) | $ | 298.0 | $ | 317.2 | |||
Term receivables, long-term | $ | 303.7 | $ | 268.7 | |||
Average days sales outstanding, including the short-term portion of term receivables | 97 | 132 | |||||
Average days sales outstanding in trade accounts receivable, excluding the short-term portion of term receivables | 40 | 47 | |||||
The decrease in the average days sales outstanding, including and excluding the short-term portion of term receivables, as of January 31, 2017 was primarily due to an increase in revenues in the fourth quarter of fiscal year 2017 compared to the fourth quarter of fiscal year 2016.
Term receivables are attributable to multi-year term license sales agreements. We include amounts for term agreements that are due within one year in trade accounts receivable, net, on our balance sheet and balances that are due in more than one year in term receivables, long-term. We use term agreements as a standard business practice and have a history of successfully collecting under the original payment terms without making concessions on payments, products, or services. Total term receivables were $601.7 as of January 31, 2017 compared to $585.8 as of January 31, 2016.
We enter into agreements to sell qualifying accounts receivable from time to time to certain financing institutions on a non-recourse basis. We received net proceeds from the sale of receivables of $45.7 for fiscal year 2017 compared to $42.7 for fiscal year 2016. We continue to have no difficulty in factoring receivables and continue to evaluate the economics of the sale of accounts receivable. We have not set a target for the sale of accounts receivables for fiscal year 2018.
Accrued Payroll and Related Liabilities
As of January 31, | 2017 | 2016 | |||||
Accrued payroll and related liabilities | $ | 116.5 | $ | 73.4 | |||
The increase in accrued payroll and related liabilities as of January 31, 2017 compared to January 31, 2016 was primarily due to an increase in incentive compensation and commissions accrued for fiscal year 2017 compared to fiscal year 2016 related to increased operating income in fiscal year 2017.
Investing Activities
Cash used in investing activities for fiscal year 2017 primarily consisted of cash paid for capital expenditures and business acquisitions.
Expenditures for property, plant, and equipment were $60.3 for fiscal year 2017 compared to $43.3 for fiscal year 2016. The expenditures for property, plant, and equipment for fiscal year 2017 were primarily a result of spending on information technology and infrastructure improvements within facilities.
During fiscal year 2017, we had $11.8 of expenditures for acquisitions of businesses and equity interests, compared to $11.7 during fiscal year 2016. We plan to finance future business acquisitions through cash and possible common stock issuances. The cash expected to be utilized includes cash on hand, cash generated from operating activities, and borrowings on our revolving credit facility.
Financing Activities
For fiscal year 2017, cash used in financing activities consisted primarily of the repurchase of common stock, the payment of dividends, repayments on the revolving credit facility, and payments related to tax withholding on the vesting of share based awards partially offset by proceeds received from the employee stock purchase plans (ESPP) purchases and exercises of stock options.
31
During fiscal year 2017, we paid four quarterly dividends of $0.055 per share of outstanding common stock for a total of $23.8. On March 2, 2017 we announced a quarterly dividend of $0.055 per share of outstanding common stock, payable on March 30, 2017 to shareholders of record as of the close of business on March 14, 2017. Future declarations of quarterly dividends and the establishment of future record and payment dates are subject to the quarterly determination of our Board of Directors.
We currently have a share repurchase program, approved by our Board of Directors, authorizing the repurchase of up to $200 million of our common stock. We did not repurchase any shares of common stock under the repurchase program during fiscal year 2017. During fiscal year 2016, we repurchased 4.5 shares of common stock for $85.0. As of January 31, 2017, $90.0 remains available for repurchase under the program. During fiscal year 2017, we repurchased 8.1 shares of common stock for $146.1 in a single transaction that was not part of our repurchase program.
The terms of our revolving credit facility limit the combination of the amount of our common stock we can repurchase and the amount of dividends we can pay over the term of the facility to $200.0 plus 70% of our cumulative consolidated net income (loss) for periods after February 1, 2016. An additional $138.5 is available for common stock repurchases or dividend payments under this limit as of January 31, 2017.
During fiscal year 2017 we paid $5.0 on our revolving line of credit. During fiscal year 2016 we received proceeds of $25.0 from our revolving credit facility.
Other Factors Affecting Liquidity and Capital Resources
4.00% Convertible Subordinated Debentures due 2031
In April 2011, we issued $253.0 of 4.00% Convertible Subordinated Debentures due 2031 (4.00% Debentures). Interest on the 4.00% Debentures is payable semi-annually in April and October.
Each one thousand dollars in principal amount of the 4.00% Debentures is currently convertible, under certain circumstances, into 50.4551 shares of our common stock (equivalent to a conversion price of $19.82 per share). The events that permit conversion are described in Note 7. “Notes Payable” in Part II, Item 8. “Financial Statements and Supplementary Data.”
Upon conversion of any 4.00% Debentures, a holder will receive:
(i) | Cash for the lesser of the principal amount of the 4.00% Debentures that are converted or the value of the converted shares; and |
(ii) | Cash or shares of common stock, at our election, for the excess, if any, of the value of the converted shares over the principal amount. |
If any one of the conversion events occurs, the 4.00% Debentures become convertible and the net balance of the 4.00% Debentures is classified as a current liability in our consolidated balance sheet. The classification of the 4.00% Debentures as current or long-term in the consolidated balance sheet is evaluated at each balance sheet date and may change from quarter to quarter depending on whether any of the conversion conditions are met.
During the fiscal quarter ended January 31, 2017, the market price of our common stock exceeded 120% of the conversion price for at least 20 of the last 30 trading days of the period. Accordingly, the 4.00% Debentures are convertible at the option of the holders through April 30, 2017. Therefore, the carrying value of the 4.00% Debentures is classified as a current liability. Additionally, the excess of the principal amount over the carrying amount of the 4.00% Debentures is reclassified from permanent equity to temporary equity in our consolidated balance sheet as of January 31, 2017. If the market price of our common stock does not exceed 120% of the conversion price for at least 20 of the last 30 trading days for the fiscal quarter ended April 30, 2017, the 4.00% Debentures will be reclassified as a long-term liability and the temporary equity will be reclassified to permanent equity in our consolidated balance sheet.
If all of the holders of the 4.00% Debentures elect to convert their debentures, we would be required to make cash payments of at least $253.0 prior to the maturity of the 4.00% Debentures.
We believe that current cash balances, cash generated from our operating activities in future periods, access to our revolving credit facility, and additional financing arrangements will be sufficient to service any conversion of the 4.00% Debentures; however, future changes in our cash position; cash flows from operating, investing and financing activities; general business levels; and our access to additional financing, may impact our ability to settle the amount payable to the holders of any 4.00% Debentures that are converted.
32
Effective April 5, 2016, we may redeem some or all of the 4.00% Debentures for cash at the following redemption prices expressed as a percentage of principal, plus any accrued and unpaid interest:
Period | Redemption Price | |
Beginning on April 5, 2016 and ending on March 31, 2017 | 101.143 | % |
Beginning on April 1, 2017 and ending on March 31, 2018 | 100.571 | % |
On April 1, 2018 and thereafter | 100.000 | % |
The holders, at their option, may redeem the 4.00% Debentures for cash on April 1, 2018, April 1, 2021, and April 1, 2026, and in the event of a fundamental change in the Company. In each case, the repurchase price will be 100% of the principal amount of the 4.00% Debentures plus any accrued and unpaid interest.
For further information on the 4.00% Debentures, see Note 7. “Notes Payable” in Part II, Item 8. “Financial Statements and Supplementary Data.”
Revolving Credit Facility
We have a syndicated, senior, unsecured, revolving credit facility with a maximum borrowing capacity of $125.0, which expires on January 9, 2020. Our interest rate on the facility is variable. Because the interest rate is variable, our interest expense associated with borrowings under this revolving credit facility will vary with market interest rates. Additionally, commitment fees can vary as they are payable on the unused portion of the revolving credit facility at rates between 0.30% and 0.40%.
We had borrowings of $20.0 against the revolving credit facility as of January 31, 2017 compared to $25.0 of borrowings as of January 31, 2016.
This revolving credit facility contains certain financial and other covenants, including a limit on the aggregate amount we can pay for dividends and repurchases of our stock over the term of the facility.
We were in compliance with all financial covenants as of January 31, 2017. If we fail to comply with the financial covenants and do not obtain a waiver from our lenders, we would be in default under the revolving credit facility and our lenders could terminate the facility and demand immediate repayment of all outstanding loans under the revolving credit facility.
For further information on our revolving credit facility, see Note 6. “Short-Term Borrowings” in Part II, Item 8. “Financial Statements and Supplementary Data.”
OFF-BALANCE SHEET ARRANGEMENTS
We do not have off-balance sheet arrangements, financings, or other similar relationships with unconsolidated entities or other persons, also known as special purpose entities. In the ordinary course of business, we lease certain real properties, primarily field sales offices, research and development facilities, and equipment.
CONTRACTUAL OBLIGATIONS
We are contractually obligated to make the following payments as of January 31, 2017:
Payments due by period | |||||||||||||||||||
Total | Less than 1 year | 1-3 years | 3-5 years | More than 5 years | |||||||||||||||
Notes payable (1) | $ | 258.1 | $ | — | $ | 5.1 | $ | — | $ | 253.0 | |||||||||
Interest on debt | 143.3 | 10.1 | 20.2 | 20.2 | 92.8 | ||||||||||||||
Other liabilities (2) | 17.0 | 3.0 | 7.0 | 0.4 | 6.6 | ||||||||||||||
Other borrowings | 31.7 | 31.7 | — | — | — | ||||||||||||||
Operating leases | 98.7 | 22.1 | 38.2 | 24.5 | 13.9 | ||||||||||||||
Total contractual obligations | $ | 548.8 | $ | 66.9 | $ | 70.5 | $ | 45.1 | $ | 366.3 | |||||||||
(1) | The 4.00% Debentures are currently convertible at the option of the holders and the $253.0 principal balance would be due immediately if all of the 4.00% Debentures were converted. |
(2) | Our balance sheet as of January 31, 2017 includes additional long-term taxes payable of $26.7 related to uncertain income and other tax positions for which the timing of the ultimate resolution is uncertain. At this time, we are unable to make a |
33
reasonably reliable estimate of the timing of any cash settlement with the respective tax authorities and the total amount of taxes payable. The timing of such tax payments may depend on the resolution of current and future tax examinations which cannot be estimated. As a result, this amount is not included in the above table.
OUTLOOK
On November 12, 2016, we entered into a definitive agreement to be acquired by Siemens Industry, Inc. (Siemens) and Meadowlark Subsidiary Corporation, a wholly-owned subsidiary of Siemens. As a result of the acquisition announcement, we will not provide an outlook for future financial results and have withdrawn all previously issued financial guidance.
34
Item 7A. | Quantitative and Qualitative Disclosures About Market Risk. |
Unless otherwise indicated, all numerical references are in millions, except interest rates and contract rates.
INTEREST RATE RISK
We are exposed to interest rate risk primarily through our investment portfolio, short-term borrowings and notes payable.
We place our investments in instruments that meet high quality credit standards, as specified in our investment policy. The policy also limits the amount of credit exposure to any one issuer and type of instrument. We do not expect any material loss with respect to our investment portfolio.
The table below presents the carrying amount and related weighted-average fixed interest rates for our investment portfolio. The carrying amount approximates fair value as of January 31, 2017.
Principal (notional) amounts in United States dollars | Carrying Amount | Average Fixed Interest Rate | |||
Money market funds | $ | 286.0 | 0.58% | ||
Bank time deposits | 71.3 | 0.91% | |||
Total cash equivalents | $ | 357.3 | 0.64% | ||
We have convertible subordinated debentures with a principal balance of $253.0 outstanding with a fixed interest rate of 4.00% as of January 31, 2017 and January 31, 2016. Generally, interest rate changes for fixed rate debt affect the fair value of the debt but do not affect future earnings or cash flow.
We have a syndicated, senior, unsecured, revolving credit facility, which expires on January 9, 2020. Borrowings under the revolving credit facility are permitted to a maximum of $125.0. Our interest rate on the facility is variable, and our interest expense associated with borrowings under this revolving credit facility will vary with market interest rates. As of January 31, 2017 we had an outstanding balance of $20.0 against this revolving credit facility compared to $25.0 as of January 31, 2016. Generally, interest rate changes for variable interest rate debt do not affect fair value, but do affect future earnings and cash flow. For further information on our revolving credit facility, see Note 6. “Short-Term Borrowings” in Part II, Item 8. “Financial Statements and Supplementary Data.”
We had other short-term borrowings of $0.9 outstanding as of January 31, 2017 and January 31, 2016 with variable rates based on market indexes.
35
FOREIGN CURRENCY RISK
We transact business in various foreign currencies and have established a program to hedge certain foreign currency forecasted transactions and exposures from existing assets and liabilities. Our derivative instruments consist of short-term foreign currency exchange contracts with a duration period of a year or less. We enter into contracts with counterparties that are major financial institutions and, as such we do not expect material losses as a result of defaults by our counterparties. We do not hold or issue derivative financial instruments for speculative or trading purposes.
We enter into foreign currency forward contracts to protect against currency exchange risk associated with expected future cash flows. Our practice is to hedge a majority of our existing material foreign currency transaction exposures, which generally represent the excess of expected euro denominated expenses over expected euro denominated revenues, and the excess of Japanese yen denominated revenues over expected Japanese yen denominated expenses. We also enter into foreign currency forward contracts to protect against currency exchange risk associated with existing assets and liabilities.
The following table provides volume information about our foreign currency forward program. The information provided is in U.S. dollar equivalent amounts. The table presents the gross notional amounts, at contract exchange rates, and the weighted average contractual foreign currency exchange rates. These forward contracts mature within the next twelve months.
As of January 31, | 2017 | 2016 | |||||||||||
Gross Notional Amount | Weighted Average Contract Rate | Gross Notional Amount | Weighted Average Contract Rate | ||||||||||
Forward Contracts: | |||||||||||||
Euro | $ | 54.2 | 0.93 | $ | 41.5 | 0.92 | |||||||
Japanese yen | 53.3 | 113.38 | 28.6 | 118.09 | |||||||||
Indian rupee | 25.4 | 68.12 | 31.6 | 67.96 | |||||||||
Israeli shekel | 13.0 | 3.80 | 19.3 | 3.95 | |||||||||
British pound | 11.8 | 0.81 | 11.0 | 0.70 | |||||||||
Korean won | 5.8 | 1,166.81 | 10.0 | 1,214.17 | |||||||||
Other(1) | 29.6 | — | 31.3 | — | |||||||||
Total forward contracts | $ | 193.1 | $ | 173.3 | |||||||||
(1) | Other includes currencies which are the Canadian dollar, Chinese yuan, Armenian dram, Swiss franc, Polish zloty, Russian ruble, Norwegian krone, Taiwan dollar, Hungarian forint, Danish krone, Chilean peso, Swedish krona, Romanian new leu and Singapore dollar. |
36
Item 8. | Financial Statements and Supplementary Data. |
Mentor Graphics Corporation
Consolidated Statements of Income
Fiscal year ended January 31, | 2017 | 2016 | 2015 | ||||||||
In thousands, except per share data | |||||||||||
Revenues: | |||||||||||
System and software | $ | 794,450 | $ | 700,621 | $ | 799,151 | |||||
Service and support | 488,017 | 480,367 | 444,982 | ||||||||
Total revenues | 1,282,467 | 1,180,988 | 1,244,133 | ||||||||
Cost of revenues: | |||||||||||
System and software | 48,249 | 48,330 | 69,811 | ||||||||
Service and support | 138,651 | 134,025 | 127,403 | ||||||||
Amortization of purchased technology | 7,328 | 7,303 | 7,099 | ||||||||
Total cost of revenues | 194,228 | 189,658 | 204,313 | ||||||||
Gross profit | 1,088,239 | 991,330 | 1,039,820 | ||||||||
Operating expenses: | |||||||||||
Research and development | 412,309 | 381,440 | 381,125 | ||||||||
Marketing and selling | 369,125 | 351,344 | 365,688 | ||||||||
General and administration | 85,361 | 73,853 | 79,193 | ||||||||
Equity in earnings of Frontline | (3,434 | ) | (5,849 | ) | (5,653 | ) | |||||
Amortization of intangible assets | 6,028 | 8,716 | 8,166 | ||||||||
Special charges | 15,769 | 45,081 | 23,490 | ||||||||
Total operating expenses | 885,158 | 854,585 | 852,009 | ||||||||
Operating income: | 203,081 | 136,745 | 187,811 | ||||||||
Other income (expense), net | 2,249 | 1,612 | (777 | ) | |||||||
Interest expense | (20,474 | ) | (19,428 | ) | (19,276 | ) | |||||
Income before income tax | 184,856 | 118,929 | 167,758 | ||||||||
Income tax expense | 29,990 | 24,753 | 22,581 | ||||||||
Net income | 154,866 | 94,176 | 145,177 | ||||||||
Less: Loss attributable to noncontrolling interest | — | (2,101 | ) | (1,962 | ) | ||||||
Net income attributable to Mentor Graphics shareholders | $ | 154,866 | $ | 96,277 | $ | 147,139 | |||||
Net income per share: | |||||||||||
Basic | $ | 1.42 | $ | 0.83 | $ | 1.28 | |||||
Diluted | $ | 1.37 | $ | 0.81 | $ | 1.26 | |||||
Weighted average number of shares outstanding: | |||||||||||
Basic | 108,795 | 116,701 | 114,635 | ||||||||
Diluted | 114,322 | 119,263 | 117,078 | ||||||||
Cash dividends declared per common share | $ | 0.22 | $ | 0.22 | $ | 0.20 | |||||
See accompanying notes to consolidated financial statements.
37
Mentor Graphics Corporation
Consolidated Statements of Comprehensive Income
Fiscal year ended January 31, | 2017 | 2016 | 2015 | ||||||||
In thousands | |||||||||||
Net income | $ | 154,866 | $ | 94,176 | $ | 145,177 | |||||
Other comprehensive loss, net of tax: | |||||||||||
Change in accumulated translation adjustment | (4,448 | ) | (8,947 | ) | (30,360 | ) | |||||
Change in unrealized gain (loss) on derivative instruments | 16 | (78 | ) | — | |||||||
Change in pension liability | (33 | ) | (166 | ) | (285 | ) | |||||
Other comprehensive loss | (4,465 | ) | (9,191 | ) | (30,645 | ) | |||||
Comprehensive income | 150,401 | 84,985 | 114,532 | ||||||||
Less amounts attributable to the noncontrolling interest: | |||||||||||
Net loss | — | (2,101 | ) | (1,962 | ) | ||||||
Change in accumulated translation adjustment | — | 22 | 45 | ||||||||
Comprehensive loss attributable to the noncontrolling interest | — | (2,079 | ) | (1,917 | ) | ||||||
Comprehensive income attributable to Mentor Graphics shareholders | $ | 150,401 | $ | 87,064 | $ | 116,449 | |||||
See accompanying notes to consolidated financial statements.
38
Mentor Graphics Corporation
Consolidated Balance Sheets
As of January 31, | 2017 | 2016 | |||||
In thousands | |||||||
Assets | |||||||
Current assets: | |||||||
Cash and cash equivalents | $ | 441,087 | $ | 334,826 | |||
Trade accounts receivable, net of allowance for doubtful accounts of $4,089 as of January 31, 2017 and $3,826 as of January 31, 2016 | 512,644 | 493,209 | |||||
Other receivables | 18,803 | 23,120 | |||||
Inventory | 18,575 | 24,762 | |||||
Prepaid expenses and other | 32,742 | 22,550 | |||||
Total current assets | 1,023,851 | 898,467 | |||||
Property, plant, and equipment, net | 210,680 | 182,092 | |||||
Term receivables | 303,686 | 268,657 | |||||
Goodwill | 611,536 | 606,842 | |||||
Intangible assets, net | 31,813 | 37,446 | |||||
Other assets | 79,619 | 70,860 | |||||
Total assets | $ | 2,261,185 | $ | 2,064,364 | |||
Liabilities and Stockholders’ Equity | |||||||
Current liabilities: | |||||||
Short-term borrowings | $ | 31,717 | $ | 33,449 | |||
Current portion of notes payable (Note 7) | 242,921 | — | |||||
Accounts payable | 16,454 | 16,740 | |||||
Income taxes payable | 10,150 | 3,966 | |||||
Accrued payroll and related liabilities | 116,521 | 73,371 | |||||
Accrued and other liabilities | 50,695 | 37,059 | |||||
Deferred revenue | 294,297 | 258,725 | |||||
Total current liabilities | 762,755 | 423,310 | |||||
Notes payable (Note 7) | 5,188 | 240,076 | |||||
Deferred revenue | 40,196 | 18,303 | |||||
Income tax liability | 23,518 | 25,116 | |||||
Other long-term liabilities | 43,809 | 37,130 | |||||
Total liabilities | 875,466 | 743,935 | |||||
Commitments and contingencies (Note 9) | |||||||
Convertible notes (Note 7) | 10,036 | — | |||||
Stockholders’ equity: | |||||||
Common stock, no par value, 300,000 shares authorized as of January 31, 2017 and January 31, 2016; 110,383 shares issued and outstanding as of January 31, 2017 and 114,934 shares issued and outstanding as of January 31, 2016 | 737,164 | 818,683 | |||||
Retained earnings | 664,084 | 522,846 | |||||
Accumulated other comprehensive loss | (25,565 | ) | (21,100 | ) | |||
Total stockholders’ equity | 1,375,683 | 1,320,429 | |||||
Total liabilities and stockholders’ equity | $ | 2,261,185 | $ | 2,064,364 | |||
See accompanying notes to consolidated financial statements.
39
Mentor Graphics Corporation
Consolidated Statements of Cash Flows
Fiscal year ended January 31, | 2017 | 2016 | 2015 | ||||||||
In thousands | |||||||||||
Operating Cash Flows: | |||||||||||
Net income | $ | 154,866 | $ | 94,176 | $ | 145,177 | |||||
Adjustments to reconcile net income to net cash provided by operating activities: | |||||||||||
Depreciation of property, plant, and equipment | 39,867 | 36,449 | 34,336 | ||||||||
Amortization of intangible assets, debt costs and other | 21,980 | 24,973 | 23,710 | ||||||||
Stock-based compensation | 46,793 | 40,497 | 35,807 | ||||||||
Deferred income taxes | 12,332 | 5,055 | 9,265 | ||||||||
Changes in other long-term liabilities | 2,620 | (804 | ) | 876 | |||||||
Equity in income of unconsolidated entities, net of dividends received | 1,267 | (455 | ) | 507 | |||||||
Other | 98 | (696 | ) | 85 | |||||||
Changes in operating assets and liabilities, net of effect of acquired businesses: | |||||||||||
Trade accounts receivable, net | (22,694 | ) | 49,751 | (90,404 | ) | ||||||
Prepaid expenses and other | (8,028 | ) | (13,558 | ) | (16,348 | ) | |||||
Term receivables, long-term | (36,259 | ) | 31,672 | (34,808 | ) | ||||||
Accounts payable and accrued liabilities | 47,114 | (37,519 | ) | 4,832 | |||||||
Income taxes receivable and payable | 3,320 | 3,984 | 1,722 | ||||||||
Deferred revenue | 58,535 | (2,275 | ) | 26,082 | |||||||
Net cash provided by operating activities | 321,811 | 231,250 | 140,839 | ||||||||
Investing Cash Flows: | |||||||||||
Proceeds from the sales and maturities of short-term investments | — | — | 4,124 | ||||||||
Proceeds from sale of building | — | 2,068 | — | ||||||||
Purchases of property, plant, and equipment | (60,288 | ) | (43,336 | ) | (48,366 | ) | |||||
Acquisitions of businesses and equity interests, net | (11,759 | ) | (11,700 | ) | (84,596 | ) | |||||
Net cash used in investing activities | (72,047 | ) | (52,968 | ) | (128,838 | ) | |||||
Financing Cash Flows: | |||||||||||
Proceeds from issuance of common stock | 32,490 | 32,807 | 29,990 | ||||||||
Repurchase of common stock | (146,050 | ) | (85,000 | ) | (70,053 | ) | |||||
Payments related to tax withholding on vesting of share based awards | (4,716 | ) | (2,437 | ) | (2,351 | ) | |||||
Dividends paid | (23,808 | ) | (25,590 | ) | (22,911 | ) | |||||
Net increase (decrease) in short-term borrowing, excluding revolving credit facility | 3,236 | 1,190 | (2,660 | ) | |||||||
Proceeds from revolving credit facility | — | 25,000 | — | ||||||||
Repayments of revolving credit facility | (5,000 | ) | — | — | |||||||
Repayments of other borrowings | (1,475 | ) | (7,268 | ) | (3,659 | ) | |||||
Purchase of remaining noncontrolling interest in majority owned subsidiaries | — | (11,270 | ) | — | |||||||
Proceeds (payments) for the sale of subsidiary shares from (to) noncontrolling interest | — | 7 | (41 | ) | |||||||
Net cash used in financing activities | (145,323 | ) | (72,561 | ) | (71,685 | ) | |||||
Effect of exchange rate changes on cash and cash equivalents | 1,820 | (1,176 | ) | (3,357 | ) | ||||||
Net change in cash and cash equivalents | 106,261 | 104,545 | (63,041 | ) | |||||||
Cash and cash equivalents at the beginning of the period | 334,826 | 230,281 | 293,322 | ||||||||
Cash and cash equivalents at the end of the period | $ | 441,087 | $ | 334,826 | $ | 230,281 | |||||
See accompanying notes to consolidated financial statements.
40
Mentor Graphics Corporation
Consolidated Statements of Stockholders’ Equity
Common Stock | Retained Earnings | Accumulated Other Comprehensive Income (Loss) | Noncontrolling Interest | Total Stockholders’ Equity | Noncontrolling Interest with Redemption Feature | |||||||||||||||||||||
Shares | Amount | |||||||||||||||||||||||||
In thousands | ||||||||||||||||||||||||||
Balance as of January 31, 2014 | 115,722 | $ | 838,939 | $ | 327,552 | $ | 18,803 | $ | — | $ | 1,185,294 | $ | 15,479 | |||||||||||||
Net income (loss) | 147,139 | 29 | 147,168 | (1,991 | ) | |||||||||||||||||||||
Other comprehensive income (loss) | (30,690 | ) | (1 | ) | (30,691 | ) | 46 | |||||||||||||||||||
Recognition of noncontrolling interest | 200 | 200 | ||||||||||||||||||||||||
Adjustment of noncontrolling interest to redemption value | 121 | 121 | (121 | ) | ||||||||||||||||||||||
Dividends | (22,911 | ) | (22,911 | ) | ||||||||||||||||||||||
Stock issued under stock awards and stock purchase plans | 3,349 | 29,990 | 29,990 | 331 | ||||||||||||||||||||||
Stock repurchased | (3,174 | ) | (70,053 | ) | (70,053 | ) | (372 | ) | ||||||||||||||||||
Stock-based compensation expense | 35,807 | 35,807 | ||||||||||||||||||||||||
Share forfeitures for tax settlements | (107 | ) | (2,351 | ) | (2,351 | ) | ||||||||||||||||||||
Tax benefit associated with the exercise of stock options | 280 | 280 | ||||||||||||||||||||||||
Balance as of January 31, 2015 | 115,790 | $ | 832,612 | $ | 451,901 | $ | (11,887 | ) | $ | 228 | $ | 1,272,854 | $ | 13,372 | ||||||||||||
Net income (loss) | 96,277 | (42 | ) | 96,235 | (2,059 | ) | ||||||||||||||||||||
Other comprehensive income (loss) | (9,213 | ) | (4 | ) | (9,217 | ) | 26 | |||||||||||||||||||
Adjustment of noncontrolling interest to redemption value | 258 | 258 | (258 | ) | ||||||||||||||||||||||
Purchase of remaining noncontrolling interest in majority owned subsidiaries | (182 | ) | (182 | ) | (11,088 | ) | ||||||||||||||||||||
Convertible debt feature | (13 | ) | (13 | ) | ||||||||||||||||||||||
Dividends | (25,590 | ) | (25,590 | ) | ||||||||||||||||||||||
Stock issued under stock awards and stock purchase plans | 3,767 | 32,807 | 32,807 | 7 | ||||||||||||||||||||||
Stock repurchased | (4,526 | ) | (85,000 | ) | (85,000 | ) | ||||||||||||||||||||
Stock-based compensation expense | 40,497 | 40,497 | ||||||||||||||||||||||||
Share forfeitures for tax settlements | (97 | ) | (2,437 | ) | (2,437 | ) | ||||||||||||||||||||
Tax benefit associated with the exercise of stock options | 217 | 217 | ||||||||||||||||||||||||
Balance as of January 31, 2016 | 114,934 | $ | 818,683 | $ | 522,846 | $ | (21,100 | ) | $ | — | $ | 1,320,429 | $ | — | ||||||||||||
Adoption of ASU 2016-09 | 10,180 | 10,180 | ||||||||||||||||||||||||
Net income | 154,866 | 154,866 | ||||||||||||||||||||||||
Other comprehensive loss | (4,465 | ) | (4,465 | ) | ||||||||||||||||||||||
Convertible debt feature | (10,036 | ) | (10,036 | ) | ||||||||||||||||||||||
Dividends | (23,808 | ) | (23,808 | ) | ||||||||||||||||||||||
Stock issued under stock awards and stock purchase plans | 3,700 | 32,490 | 32,490 | |||||||||||||||||||||||
Stock repurchased | (8,060 | ) | (146,050 | ) | (146,050 | ) | ||||||||||||||||||||
Stock-based compensation expense | 46,793 | 46,793 | ||||||||||||||||||||||||
Share forfeitures for tax settlements | (191 | ) | (4,716 | ) | (4,716 | ) | ||||||||||||||||||||
Balance as of January 31, 2017 | 110,383 | $ | 737,164 | $ | 664,084 | $ | (25,565 | ) | $ | — | $ | 1,375,683 | $ | — | ||||||||||||
See accompanying notes to consolidated financial statements.
41
Mentor Graphics Corporation
Notes to Consolidated Financial Statements
All numerical dollar and share references are in thousands, except for per share data.
1. Nature of Operations
Description of Business
We are a supplier of electronic design automation systems — advanced computer software and emulation hardware systems used to automate the design, analysis, and testing of complex electro-mechanical systems, electronic hardware, and embedded systems software in electronic systems and components. We market our products and services worldwide, primarily to large companies in the communications, computer, consumer electronics, semiconductor, networking, multimedia, military and aerospace, and transportation industries. We sell and license our products through our direct sales force and a channel of distributors and sales representatives. We were incorporated in Oregon in 1981 and our common stock is traded on the NASDAQ Global Select Market under the symbol “MENT.” In addition to our corporate offices in Wilsonville, Oregon, we have sales, support, software development, and professional service offices worldwide.
Merger
On November 12, 2016, we entered into a definitive agreement to be acquired by Siemens Industry, Inc. (Siemens) and Meadowlark Subsidiary Corporation, a wholly-owned subsidiary of Siemens. The transaction is valued at $37.25 per share in cash, or approximately $4.5 billion, and has been approved by our Board of Directors. During a special meeting of the Mentor Graphics shareholders held on February 2, 2017, the transaction was approved by an affirmative vote of the holders of a majority of the outstanding shares of Mentor Graphics common stock. On December 22, 2016 Mentor Graphics received notice from the U.S. Federal Trade commission that it had granted early termination of the waiting period under the Hart-Scott-Rodino Antitrust Improvements Act of 1976. The closing of the transaction is also subject to various customary conditions, receipt of clearance from the Committee on Foreign Investment in the U.S. and other specified regulatory approvals, and the accuracy of representations and warranties contained in the agreement. We are also subject to compliance with covenants and agreements contained in the agreement, including a restriction on the amount we can borrow of no more than $10,000 in each fiscal quarter and a prohibition on the repurchase of common stock. The closing of the transaction is not subject to a financing condition and is expected to be completed by June 30, 2017.
2. Summary of Significant Accounting Policies
Principles of Consolidation
The consolidated financial statements include our financial statements and those of our wholly-owned and majority-owned subsidiaries. All intercompany accounts and transactions have been eliminated in consolidation.
We do not have off-balance sheet arrangements, financings, or other similar relationships with unconsolidated entities or other persons, also known as special purpose entities. In the ordinary course of business, we lease certain real properties, primarily field sales offices, research and development facilities, and equipment, as described in Note 9. “Commitments and Contingencies.”
Foreign Currency Translation
Local currencies are the functional currencies of our foreign subsidiaries except for certain subsidiaries in Ireland, Singapore, Egypt, and the Netherlands Antilles where the United States (U.S.) dollar is used as the functional currency. We translate assets and liabilities of foreign operations, excluding certain subsidiaries in Ireland, Singapore, Egypt, and the Netherlands Antilles to U.S. dollars at current rates of exchange and revenues and expenses using weighted average rates. We include foreign currency translation adjustments in stockholders’ equity as a component of accumulated other comprehensive loss. We maintain the accounting records for certain subsidiaries in Ireland, Singapore, Egypt, and the Netherlands Antilles in the U.S. dollar and accordingly no translation is necessary. We include foreign currency transaction gains and losses as a component of other income (expense), net.
Critical Accounting Estimates
U.S. generally accepted accounting principles require management to make estimates and assumptions that affect the reported amount of assets, liabilities, and contingencies at the date of the financial statements and the reported amounts of revenues and expenses during the reporting periods. We believe that accounting for revenue recognition, valuation of trade accounts receivable, income taxes, business combinations, goodwill, intangible assets and long-lived assets, special charges, and stock-based compensation are the critical accounting estimates and judgments used in the preparation of our consolidated financial
42
statements. These estimates and assumptions are based on our best judgment. We evaluate our estimates and assumptions on an ongoing basis using historical experience and other factors, including the current economic environment, which we believe to be reasonable under the circumstances. We adjust estimates and assumptions as facts and circumstances dictate. Actual results could differ from these estimates. Any changes in estimates will be reflected in the financial statements in future periods. A discussion of each critical accounting estimate is provided below.
Revenue Recognition
We report revenue in two categories based on how revenue is generated: (i) system and software and (ii) service and support.
System and software revenues – We derive system and software revenues from the sale of licenses of software products and emulation and other hardware systems. We primarily license our products using two different license types:
1.Term licenses – We use this license type primarily for software sales. This license type provides the customer with the right to use a fixed list of software products for a specified time period, typically three to four years, with payments spread over the license term, and does not provide the customer with the right to use the products after the end of the term. Term license arrangements may allow the customer to share products between multiple locations and remix product usage from the fixed list of products at regular intervals during the license term. We generally recognize product revenue from term license arrangements upon product delivery and start of the license term. In a term license agreement where we provide the customer with rights to unspecified or unreleased future products, we recognize revenue ratably over the license term.
2.Perpetual licenses – We use this license type for software and emulation hardware system sales. This license type provides the customer with the right to use the product in perpetuity and typically does not provide for extended payment terms. We generally recognize product revenue from perpetual license arrangements upon product delivery assuming all other criteria for revenue recognition have been met.
We include finance fee revenues from the accretion of the discount on long-term installment receivables resulting from product sales in system and software revenues. Finance fees were approximately 2.0% of total revenues for fiscal years 2017, 2016, and 2015.
Service and support revenues – We derive service and support revenues from software and hardware post-contract maintenance or support services and professional services, which includes consulting, training, and other services. We recognize support services revenue ratably over the service term. We record professional services revenue as services are provided to the customer.
We determine whether product revenue recognition is appropriate based upon the evaluation of whether the following four criteria have been met:
1.Persuasive evidence of an arrangement exists – Generally, we use either a customer signed contract or qualified customer purchase order as evidence of an arrangement for both term and perpetual licenses. For professional service engagements, we generally use a signed professional services agreement and a statement of work to evidence an arrangement. Sales through our distributors are evidenced by an agreement governing the relationship, together with binding purchase orders from the distributor on a transaction-by-transaction basis.
2.Delivery has occurred – We generally deliver software and the corresponding access keys to customers electronically. Electronic delivery occurs when we provide the customer access to the software. We may also deliver the software on a digital versatile disc (DVD). With respect to emulation hardware systems, we transfer title to the customer upon shipment. Our software license and emulation hardware system agreements generally do not contain conditions for acceptance.
3.Fee is fixed or determinable – We assess whether a fee is fixed or determinable at the outset of the arrangement, primarily based on the payment terms associated with the transaction. We have an established history of collecting on an original contract with installment terms without providing concessions on payments, products, or services. Additionally, for installment contracts, we determine that the fee is fixed or determinable if the arrangement has a payment schedule that is within the term of the license and the payments are collected in equal or nearly equal installments, when evaluated on a cumulative basis. If the fee is not deemed to be fixed or determinable, we recognize revenue as payments become due and payable.
4.Collectibility is probable – To recognize revenue, we must judge collectibility of the arrangement fees on a customer-by-customer basis pursuant to our credit review process. We typically sell to customers with whom there is a history of successful collection. We evaluate the financial position and a customer’s ability to pay whenever an existing customer purchases new products, renews an existing arrangement, or requests an increase in credit terms. For certain industries for which our products are not considered core to the industry or the industry is generally considered troubled, we impose higher credit standards. If we determine that collectibility is not probable based upon our credit review process or the customer’s payment history, we recognize revenue as payments are received.
43
Multiple element arrangements involving software licenses – For multiple element arrangements involving software and other software-related deliverables, vendor-specific objective evidence of fair value (VSOE) must exist to allocate the total fee among all delivered and non-essential undelivered elements of the arrangement. If undelivered elements of the arrangement are essential to the functionality of the product, we defer revenue until the essential elements are delivered. If VSOE does not exist for one or more non-essential undelivered elements, we defer revenue until such evidence exists for the undelivered elements, or until those elements are delivered, whichever is earlier. If VSOE of all non-essential undelivered elements exists but VSOE does not exist for one or more delivered elements, we recognize revenue using the residual method. Under the residual method, we defer revenue related to the undelivered elements based upon VSOE and we recognize the remaining portion of the arrangement fee as revenue for the delivered elements, assuming all other criteria for revenue recognition are met.
We base our VSOE for certain elements of an arrangement on pricing included in comparable transactions when the element is sold separately. We primarily base our VSOE for term and perpetual support services on customer renewal history where services are sold separately. We also base VSOE for professional services and installation services for emulation hardware systems on the price charged when the services are sold separately.
Multiple element arrangements involving hardware – For multiple element arrangements involving our emulation hardware systems, we allocate revenue to each element based on the relative selling price of each deliverable. In order to meet the separation criteria to allocate revenue to each element we must determine the standalone selling price of each element using a hierarchy of evidence.
The authoritative guidance requires that, in the absence of VSOE or third-party evidence, a company must develop an estimated selling price (ESP). ESP is defined as the price at which the vendor would transact if the deliverable was sold by the vendor regularly on a standalone basis. A company should consider market conditions as well as entity-specific factors when estimating a selling price. We base our ESP for certain elements in arrangements on either costs incurred to manufacture a product plus a reasonable profit margin or standalone sales to similar customers. In determining profit margins, we consider current market conditions, pricing strategies related to the class of customer, and the level of penetration we have at the customer. In other cases, we may have limited standalone sales to the same or similar customers and/or guaranteed pricing on future purchases of the same item.
Valuation of Trade Accounts Receivable
We maintain allowances for doubtful accounts on trade accounts receivable and term receivables, long-term for estimated losses resulting from the inability of our customers to make required payments. We regularly evaluate the collectibility of our trade accounts receivable based on a combination of factors. When we become aware of a specific customer's inability to meet its financial obligations, such as in the case of bankruptcy or deterioration in the customer's operating results, financial position, or credit rating, we record a specific reserve for bad debt to reduce the related receivable to the amount believed to be collectible. We also record unspecified reserves for bad debt for all other customers based on a variety of factors including length of time the receivables are past due, the financial health of customers, the current business environment, and historical experience. If these factors change or circumstances related to specific customers change, we adjust the estimates of the recoverability of receivables resulting in either additional selling expense or a reduction in selling expense in the period the determination is made.
Income Taxes
We use the asset and liability method of accounting for income taxes. Under this method, we recognize deferred income taxes for the future tax consequences attributable to temporary differences between the financial statement carrying amounts and tax balances of existing assets and liabilities. We calculate deferred tax assets and liabilities using enacted laws and tax rates that will be in effect when we expect the differences to reverse and be applied to taxable income in the years in which those temporary differences are expected to be recovered or settled. The effect on deferred taxes of a change in tax rates is recognized in income in the period that includes the enactment date. Deferred tax assets are recognized for deductible temporary differences, net operating loss carryforwards, and credit carryforwards if it is more likely than not that the tax benefits will be realized. Deferred tax assets are not recorded, however, to the extent they are attributed to uncertain tax positions.
For deferred tax assets that cannot be recognized under the more-likely-than-not-standard, we have established a valuation allowance. We have considered future taxable income and ongoing prudent and feasible tax planning strategies in assessing the need for valuation allowances. We have recorded a valuation allowance to reduce our deferred tax assets to the amount that is more likely than not to be realized. In the event we determine that we are able to realize our deferred tax assets in the future in excess of our net recorded amount, we would reverse the valuation allowance associated with the deferred tax assets in the period the determination was made, which may result in a tax benefit in the statement of income. Also, if we determine that we
44
are not able to realize all or part of our net deferred tax assets in the future, we would record a valuation allowance on the net deferred tax assets with a corresponding increase in expense in the period the determination was made.
We are subject to income taxes in the U.S. and in numerous foreign jurisdictions, and in the ordinary course of business there are many transactions and calculations where the ultimate tax determination is uncertain. While we believe the positions we have taken are appropriate, we have reserves for taxes to address potential exposures involving tax positions that are being challenged or that could be challenged by the tax authorities. We record a benefit on a tax position when we determine that it is more likely than not that the position is sustainable upon examination, including resolution of any related appeals or litigation processes, based on the technical merits of the position. For tax positions that are more likely than not to be sustained, we measure the tax position at the largest amount of benefit that has a greater than 50 percent likelihood of being realized when it is effectively settled. We review the tax reserves as circumstances warrant and adjust the reserves as events occur that affect our potential liability for additional taxes.
Business Combinations
When we acquire businesses, we allocate the purchase price, including the fair value of contingent consideration, to acquired tangible assets and liabilities and acquired identifiable intangible assets. Any residual purchase price is recorded as goodwill. The allocation of the purchase price requires us to make significant estimates in determining the fair value of contingent consideration as well as acquired assets and assumed liabilities, especially with respect to intangible assets and goodwill. These estimates are based on information obtained from management of the acquired companies, our assessment of this information, and historical experience. These estimates can include, but are not limited to, the cash flows that an acquired business is expected to generate in the future, the cash flows that specific assets acquired with that business are expected to generate in the future, the appropriate weighted-average cost of capital, and the cost savings expected to be derived from acquiring an asset. These estimates are inherently uncertain and unpredictable, and if different estimates were used, the purchase price for the acquisition could be allocated to the acquired assets and liabilities differently from the allocation that we have made to the acquired assets and liabilities. In addition, unanticipated events and circumstances may occur that may affect the accuracy or validity of such estimates, and if such events occur, we may be required to adjust the value allocated to acquired assets or assumed liabilities.
We also make significant judgments and estimates when we assign useful lives to the definite-lived intangible assets identified as part of our acquisitions. These estimates are inherently uncertain and if we used different estimates, the useful life over which we amortize intangible assets would be different. In addition, unanticipated events and circumstances may occur that may impact the useful life over which we amortize our intangible assets, which would impact our recognition of expense and our results of operations.
Goodwill, Intangible Assets and Long-Lived Assets
Goodwill represents the excess of the aggregate purchase price over the fair value of the net tangible assets and other intangible assets acquired in our business combinations. Goodwill is not amortized, but is tested for impairment annually and as necessary if changes in facts and circumstances indicate that the fair value of our reporting unit may be less than the carrying amount. We operate as a single reporting unit for purposes of goodwill evaluation. We completed our annual goodwill impairment test as of January 31, 2017, 2016, and 2015. For purposes of assessing the impairment of goodwill, we estimated the fair value of our reporting unit using its market capitalization as the best evidence of fair value and compared that fair value to the carrying value of our reporting unit. Our reporting unit passed this step of the goodwill analysis. There were no indicators of impairment to goodwill during fiscal years 2017, 2016, and 2015 and accordingly, no impairment charges were recognized during these fiscal periods.
Intangible assets, net primarily includes purchased technology, in-process research and development, backlog, tradenames, and customer relationships acquired in our business combinations. We review long-lived assets, including intangible assets with definite lives, for impairment whenever events or changes in circumstances indicate the carrying amount of these assets may not be recoverable. We assess the recoverability of our long-lived assets by determining whether the carrying values of the asset groups are greater than the forecasted undiscounted net cash flows of the related asset group. If we determine the assets are impaired, we write down the assets to their estimated fair value. We determine fair value based on forecasted discounted net cash flows or appraised values, depending upon the nature of the assets. Significant management judgment is required in the forecasts of future operating results that are used in the discounted cash flow method of valuation. The estimates we have used are consistent the plans and estimates that we use to manage our business. It is possible, however, that the plans may change and estimates used may prove to be inaccurate. If our actual results, or the plans and estimates used in future impairment analysis, are lower than the original estimates used to assess the recoverability of these assets, we could incur impairment charges. In the event we determine our long-lived assets are impaired, we would make an adjustment resulting in a charge for
45
the write-down in the period that the determination was made. There were no indicators of impairment to long-lived assets during fiscal years 2017, 2016, and 2015 and accordingly, no impairment charges were recognized during these fiscal periods.
We amortize purchased technology over three to five years to system and software cost of revenues and other intangible asset costs generally over two to six years to operating expenses. We amortize capitalized in-process research and development (resulting from acquisitions) upon completion of projects to cost of revenues over the estimated useful life of the technology. Alternatively, if we abandon a project, in-process research and development costs are expensed to operating expense when that determination is made.
Total purchased technology and other intangible asset amortization expense was as follows:
Fiscal year ended January 31, | 2017 | 2016 | 2015 | ||||||||
Purchased technology and other intangible asset amortization expense | $ | 13,356 | $ | 16,019 | $ | 15,265 | |||||
As of January 31, 2017, the carrying value of goodwill and intangible assets was as follows:
As of January 31, | 2017 | 2016 | |||||
Goodwill | $ | 611,536 | $ | 606,842 | |||
Purchased technology and in-process research and development, gross | $ | 162,213 | $ | 158,102 | |||
Less: accumulated amortization | (145,652 | ) | (138,375 | ) | |||
Purchased technology and in-process research and development, net | $ | 16,561 | $ | 19,727 | |||
Other intangible assets, gross | $ | 108,690 | $ | 105,162 | |||
Less: accumulated amortization | (93,438 | ) | (87,443 | ) | |||
Other intangible assets, net | $ | 15,252 | $ | 17,719 | |||
The following table summarizes goodwill activity:
Balance as of January 31, 2015 | $ | 599,929 | |
Acquisitions | 8,500 | ||
Foreign exchange | (1,587 | ) | |
Balance as of January 31, 2016 | $ | 606,842 | |
Acquisitions | 6,111 | ||
Foreign exchange | (1,417 | ) | |
Balance as of January 31, 2017 | $ | 611,536 | |
We estimate the aggregate amortization expense related to purchased technology and other intangible assets will be as follows:
Fiscal years ending January 31, | |||
2018 | $ | 12,845 | |
2019 | 11,192 | ||
2020 | 4,432 | ||
2021 | 1,842 | ||
2022 | 1,102 | ||
Thereafter | 400 | ||
Aggregate amortization expense | $ | 31,813 | |
Special Charges
We record restructuring charges in connection with our plans to better align our cost structure with projected operations in the future. We record restructuring charges in connection with employee rebalances based on estimates of the expected costs associated with severance benefits. If the actual cost incurred exceeds the estimated cost, additional expense is recognized. If the actual cost is less than the estimated cost, a benefit is recognized.
46
We also record within special charges, expenses incurred related to certain litigation costs that are unusual in nature due to the significance in variability of timing and amount. Special Charges may also include costs associated with mergers and acquisitions, excess facility costs and asset related charges. See additional discussion in Note 14. “Special Charges.”
Accounting for Stock-Based Compensation
We measure stock-based compensation cost at the grant date, based on the fair value of the award, and recognize the expense on a straight-line basis over the employee’s requisite service period. For options and stock awards that vest fully on any termination of service, there is no requisite service period and consequently we recognize the expense fully in the period in which the award is granted. We present the excess tax benefit or tax deficiency from the exercise of stock options or vesting of restricted stock units as an operating activity in the statement of cash flows when options are exercised or the restricted stock units vest.
We estimate the fair value of purchase rights under our employee stock purchase plans (ESPPs) using a Black-Scholes option-pricing model. The Black-Scholes option-pricing model incorporates several highly subjective assumptions including expected volatility, expected dividends, and interest rates. The input factors used in the Black-Scholes option-pricing model are based on subjective future expectations combined with management judgment. If we were to modify any awards, additional charges could occur. In reaching our determination of expected volatility for purchase rights under our ESPPs, we use the historical volatility of our shares of common stock.
See a further discussion of the fair value of purchase rights under our ESPPs in Note 11. “Employee Stock and Savings Plans.”
Property, Plant, and Equipment, Net
We state property, plant, and equipment at cost and capitalize expenditures for additions to property, plant, and equipment. We expense maintenance and repairs, which do not improve or extend the life of the respective asset, as incurred. We compute depreciation on a straight-line basis as follows:
Estimated Useful Lives (in years) | |||
Buildings | 40 | ||
Land improvements | 20 | ||
Computer equipment and furniture | 3 | - | 5 |
Leasehold improvements(1) | 3 | - | 10 |
(1) | Amortized over the shorter of the lease term or estimated life. |
A summary of property, plant, and equipment, net is as follows:
As of January 31, | 2017 | 2016 | |||||
Computer equipment and furniture | $ | 394,042 | $ | 351,982 | |||
Buildings and building equipment | 117,240 | 115,312 | |||||
Land and improvements | 24,610 | 21,489 | |||||
Leasehold improvements | 48,812 | 41,906 | |||||
Property, plant, and equipment, gross | 584,704 | 530,689 | |||||
Less: accumulated depreciation and amortization | (374,024 | ) | (348,597 | ) | |||
Property, plant, and equipment, net | $ | 210,680 | $ | 182,092 | |||
Net Income Per Share
We compute basic net income per share using the weighted average number of common shares outstanding during the period. We compute diluted net income per share using the weighted average number of common shares and potentially dilutive common shares outstanding during the period. Potentially dilutive common shares consist of restricted stock units, common shares issuable upon exercise of employee stock options, purchase rights from ESPPs, and common shares issuable upon conversion of the convertible subordinated debentures using the treasury stock method, if dilutive. Net income used to compute basic and diluted net income per share is increased or reduced for the adjustment of the noncontrolling interest with redemption feature to its calculated redemption value. See additional discussion in Note 12. “Net Income Per Share.”
47
Investments
We classify investments with original maturities of 90 days or less as cash equivalents. Additional information regarding cash equivalents is provided in Note 4. “Fair Value Measurement.”
Short-term investments include certificates of deposit with original maturities in excess of 90 days but less than one year at the time of purchase. We determine the appropriate classification of our investments at the time of purchase.
Long-term investments, included in other assets on the accompanying consolidated balance sheets, include investments in equity securities. For investments in equity securities, we use the equity method of accounting when our investment gives us the ability to exercise significant influence over the operating and financial policies of the investee. Under the equity method, we record our share of earnings or losses equal to our proportionate share of the earnings or losses of the investee as a component of other income (expense), net, with the exception of our investment in Frontline P.C.B. Solutions Limited Partnership (Frontline) as discussed below. Investments in equity securities of private companies without a readily determinable fair value, where we do not exercise significant influence over the investee, are recorded using the cost method of accounting, carrying the investment at historical cost. We periodically evaluate the fair value of all investments to determine if an other-than-temporary decline in value has occurred.
Investment in Frontline
We have a 50% interest in a joint venture Frontline, which is equally owned by us and Orbotech, Ltd. Frontline is a provider of engineering software solutions for the printed circuit board industry. We use the equity method of accounting for our Frontline investment, which results in reporting our investment as one line within other assets in the consolidated balance sheet and our share of earnings as one line in the consolidated statement of income. Frontline reports on a calendar year basis, therefore, we record our interest in the earnings of Frontline on a one-month lag.
Although we do not exert control, we actively participate in regular and periodic activities with respect to Frontline such as budgeting, business planning, marketing, and direction of research and development projects. Accordingly, we have included our interest in the earnings of Frontline as a component of operating income.
Derivative Financial Instruments
We are exposed to fluctuations in foreign currency exchange rates and have established a foreign currency hedging program to hedge certain foreign currency forecasted transactions and exposures from existing assets and liabilities. Our derivative instruments consist of foreign currency exchange contracts. By using derivative instruments, we subject ourselves to credit risk. If a counterparty fails to fulfill its performance obligations under a derivative contract, our credit risk will equal the fair value of the derivative instrument. Generally, when the fair value of our derivative contracts is a net asset, the counterparty owes us, thus creating a receivable risk. We minimize counterparty credit risk by entering into derivative transactions with major financial institutions and, as such, we do not expect material losses as a result of default by our counterparties. We execute foreign currency transactions in exchange-traded or over-the-counter markets for which quoted prices exist. We do not hold or issue derivative financial instruments for speculative or trading purposes.
To manage the foreign currency volatility, we aggregate exposures on a consolidated basis to take advantage of natural offsets. Our primary exposures are the Japanese yen, where we are in a long position, and the euro, where we are in a short position. Most of our large European revenue contracts are denominated and paid in U.S. dollars while our European expenses, including substantial research and development operations, are paid in local currency causing a short position in the euro. In addition, we experience greater inflows than outflows of Japanese yen as almost all Japanese-based customers contract and pay us in Japanese yen. While these exposures are aggregated on a consolidated basis to take advantage of natural offsets, substantial exposures remain.
To partially offset the net exposures in the euro and the Japanese yen, we enter into foreign currency exchange contracts for a time period of less than one year which are designated as cash flow hedges. Any gain or loss on Japanese yen contracts is classified as product revenue when the hedged transaction occurs while any gain or loss on euro contracts is classified as operating expense when the hedged transaction occurs.
We use an income approach to determine the fair value of our foreign currency contracts and record them at fair value utilizing observable market inputs at the measurement date. We report in the consolidated balance sheet the fair value of derivatives in other receivables, if the balance is an asset, or accrued liabilities, if the balance is a liability. The accounting for changes in the fair value of a derivative depends upon whether it has been designated in a hedging relationship and on the type of hedging relationship. To qualify for designation in a hedging relationship, specific criteria must be met and the appropriate
48
documentation maintained. Hedging relationships, if designated, are established pursuant to our risk management policy and are initially and regularly evaluated to determine whether they are expected to be, and have been, highly effective hedges. We formally document all relationships between foreign currency exchange contracts and hedged items as well as our risk management objectives and strategies for undertaking various hedge transactions.
All hedges designated as cash flow hedges are linked to forecasted transactions and we assess, both at inception of the hedge and on an ongoing basis, the effectiveness of the foreign currency exchange contracts in offsetting changes in the cash flows of the hedged items. We report the effective portions of the net gains or losses of these foreign currency exchange contracts as a component of accumulated other comprehensive income (loss) in stockholders’ equity. Accumulated other comprehensive income (loss) associated with hedges of forecasted transactions is reclassified to the consolidated statement of income in the same period the forecasted transaction occurs or the hedge is no longer effective. We expect substantially all of the hedge balance in accumulated other comprehensive loss to be reclassified to the consolidated statement of income within the next twelve months.
We enter into foreign currency exchange contracts to offset the earnings impact relating to the variability in exchange rates on certain short-term monetary assets and liabilities denominated in non-functional currencies. We do not designate these foreign currency contracts as hedges. The change in fair value of these derivative instruments is reported each period in other income (expense), net, in our consolidated statement of income.
Software Development Costs
We capitalize software development costs beginning when a product’s technological feasibility has been established by either completion of a detail program design or completion of a working model of the product and ending when a product is available for general release to customers. The period between the achievement of technological feasibility and the general release of our products has historically been of short duration. As a result, those capitalizable software development costs are insignificant and have been charged to research and development expense in all periods in the accompanying consolidated statements of income.
We did not capitalize any acquired developed technology during fiscal years 2017, 2016, and 2015.
Advertising Costs
We expense all advertising costs as incurred. Advertising expense is included in marketing and selling expense in the accompanying consolidated statement of income as follows:
Fiscal year ended January 31, | 2017 | 2016 | 2015 | ||||||||
Advertising expense | $ | 3,435 | $ | 3,683 | $ | 2,985 | |||||
Transfer of Financial Assets
We finance certain software license agreements with customers through the sale, assignment, and transfer of the future payments under those agreements to financing institutions on a non-recourse basis. We retain no interest in the transferred receivable. We record the transfers as sales of the related accounts receivable when we are considered to have surrendered control of the receivables. The gain or loss on the sale of receivables is included in general and administration in operating expenses in our consolidated statement of income. The gain or loss on the sale of receivables consists of two components: (i) the discount on sold receivables, which is the difference between the undiscounted balance of the receivables, and the net proceeds received from the financing institution and (ii) the unaccreted interest on the sold receivables. We impute interest on the receivables based on prevailing market rates and record this as a discount against the receivable. See additional details in Note 5. “Term Receivables and Trade Accounts Receivable.”
Noncontrolling Interest with Redemption Feature
In September 2015 we exercised our call option to purchase the remaining noncontrolling interest of Calypto Design Systems, Inc. for $11,088. This transaction was reflected in cash used for investing activities in our statement of cash flows. After this transaction, we acquired 100% of Calypto Design Systems, Inc. We had been party to an agreement that provided us a call option to acquire the noncontrolling interest, and provided the noncontrolling interest holders a put option to sell their interests to us, at prices based on formulas defined in the agreement.
Prior to our purchase, the noncontrolling interest was adjusted for the redemption feature based on the put option price formula and presented on the consolidated balance sheet under the caption “Noncontrolling interest with redemption feature.” Because the exercise of the put option was outside of our control, we presented this interest outside of stockholders’ equity.
49
The noncontrolling interest with redemption feature was recognized at the greater of:
i. The calculated redemption feature put value as of the balance sheet date; or
ii. The initial noncontrolling interest value adjusted for the noncontrolling interest holders' share of:
a. cumulative impact of net income (loss); and
b. other changes in accumulated other comprehensive income.
Increases (or decreases to the extent they offset previous increases) in the calculated redemption feature put value were recorded directly to retained earnings as if the balance sheet date were also the redemption date. Changes in the redemption feature put value also resulted in an adjustment to net income attributable to shareholders in the calculation of basic and diluted net income per share.
The results of the majority-owned subsidiary were presented in our consolidated results with an adjustment reflected on the face of our statement of income and the face of our statement of comprehensive income for the noncontrolling investors' interest in the results of the subsidiary.
3. Recent Accounting Pronouncements
Recently Adopted Pronouncements
In March 2016, the Financial Accounting Standards Board (FASB) issued Accounting Standards Update (ASU) 2016-09, Compensation-Stock Compensation (Topic 718), Improvements to Employee Share-Based Payment Accounting, as part of their simplification initiative to improve the accounting for share-based payments to employees. The new standard affects several aspects of the accounting for share-based payments. It requires excess tax benefits and tax deficiencies to be recognized as income tax expense or benefit in the income statement when awards vest or are exercised. Cash flows associated with excess tax benefits are no longer classified as cash flows from financing activities but will be classified as operating activities, consistent with other income tax cash flows. The standard also allows for additional employee tax withholding on the exercise or release of awards, without triggering liability classification of the award. Additionally, when we withhold shares for tax-withholding purposes and in-turn pay cash for taxes on behalf of an employee, the cash payment is classified as a financing activity in our statement of cash flows. Finally, the standard allows an accounting policy election for the treatment of forfeitures of stock based awards. Companies can elect to continue to estimate forfeitures expected to occur, or account for forfeitures as they occur. This standard is effective for us in the first quarter of fiscal year 2018, with early adoption permitted.
We early adopted the new standard effective February 1, 2016. The primary impact to our financial statements was the recognition of $48,605 in deferred tax assets associated with excess tax benefits offset by a valuation allowance of $38,425 and a cumulative-effect adjustment of $10,180 to retained earnings as of January 31, 2016. We elected to continue to estimate forfeitures expected to occur when estimating the amount of compensation expense recorded in each accounting period.
We retrospectively applied to all periods presented in our statements of cash flows, the presentation of excess tax benefits and cash paid for employee taxes where shares were withheld. As a result of this election excess tax benefits were reclassified from financing activities to operating activities and cash paid for shares withheld were reclassified from operating activities to financing activities. The net impact on previously reported results is as follows:
Fiscal year ended January 31, 2016 | As originally reported | As Adjusted | |||||
Net cash provided by operations | $ | 228,596 | $ | 231,250 | |||
Net cash used in financing activities | $ | (69,907 | ) | $ | (72,561 | ) | |
Fiscal year ended January 31, 2015 | As originally reported | As Adjusted | |||||
Net cash provided by operations | $ | 138,208 | $ | 140,839 | |||
Net cash used in financing activities | $ | (69,054 | ) | $ | (71,685 | ) | |
In September 2015, the FASB issued ASU 2015-16, Business Combinations (Topic 805), Simplifying the Accounting for Measurement-Period Adjustments. This standard eliminates the requirement for an acquirer to retrospectively account for adjustments made to provisional amounts recognized in a business combination. The standard requires that an acquirer recognize adjustments to provisional amounts identified during the measurement period in the reporting period in which the adjustments are identified. Changes in depreciation, amortization, and any other income effects resulting from adjustments to
50
provisional amounts, should be computed as of the acquisition date. The standard requires that an entity present separately, by line item, the amounts included in current-period earnings that would have been recorded in previous reporting periods, if the adjustments to provisional amounts had been recognized on the acquisition date. We adopted this standard beginning February 1, 2016. Adoption of this standard did not have a material impact on our consolidated financial statements and related disclosures.
In April 2015, the FASB issued ASU 2015-05, Intangibles-Goodwill and Other-Internal-Use Software (Subtopic 350-40), Customer's Accounting for Fees Paid in a Cloud Computing Arrangement. This standard provides guidance to customers about whether a cloud computing arrangement includes a software license. If the arrangement includes a software license, the customer accounts for fees related to the software license element consistent with accounting for the acquisition of other acquired software licenses. If the arrangement does not contain a software license, the customer accounts for the arrangement as a service contract. An arrangement would contain a software license element if both: (i) the customer has the contractual right to take possession of the software at any time during the hosting period without significant penalty; and (ii) it is feasible for the customer to either run the software on its own hardware or contract with another party unrelated to the vendor to host the software. We adopted this standard beginning February 1, 2016 on a prospective basis. Adoption of this standard did not have a material impact on our consolidated financial statements and related disclosures.
In September 2014, the FASB issued ASU 2014-15, Presentation of Financial Statements - Going Concern: Disclosure of Uncertainties about an Entity's Ability to Continue as a Going Concern. This ASU provides guidance on management's responsibility in evaluating whether there are conditions or events that raise substantial doubt about the entity's ability to continue as a going concern and to provide related disclosures if required. Evaluation is required every reporting period, including interim periods. We adopted this standard effective January 31, 2017. Adoption of this standard did not have a material impact on our consolidated financial statements and related disclosures.
Issued Pronouncements not yet Adopted
Revenue Recognition
In May 2016, the FASB issued ASU 2016-12, Revenue from Contracts with Customers (Topic 606), Narrow-Scope Improvements and Practical Expedients. This ASU amends narrow aspects of Topic 606 in ASU 2014-09, Revenue from Contracts with Customers, related to the assessment of collectibility, presentation of sales taxes, noncash consideration, and completed contracts and contract modifications at transition. Practical expedients are provided in the ASU to simplify the transition to the new standard.
In April 2016, the FASB issued ASU 2016-10, Revenue from Contracts with Customers (Topic 606), Identifying Performance Obligations and Licensing. This ASU clarifies guidance in ASU 2014-09, Revenue from Contracts with Customers related to identifying performance obligations and licensing implementation. This ASU is expected to: (i) reduce the cost and complexity of applying the guidance on identifying promised goods or services; (ii) improve guidance on criteria in assessing whether promises to transfer goods and services are separately identifiable; and (iii) improve the operability and understandability of the licensing implementation guidance.
In March 2016, the FASB issued ASU 2016-08, Revenue from Contracts with Customers (Topic 606), Principal versus Agent Considerations. This ASU amends the principal versus agent guidance in ASU 2014-09, Revenue from Contracts with Customers, and clarifies that the analysis must determine whether an entity controls the specified goods or services before they are transferred to the customer.
In May 2014, the FASB issued ASU 2014-09, Revenue from Contracts with Customers (Topic 606). This ASU is based on the principle that the amount of revenue recognized should reflect the consideration an entity expects to be entitled to in exchange for the transfer of goods and services to customers. This ASU requires disclosures enabling users of financial statements to understand the nature, amount, timing, and uncertainty of revenue and cash flows arising from contracts with customers. This ASU also requires qualitative and quantitative disclosure about customer contracts, significant judgments and changes in judgments, and assets recognized from the costs to obtain or fulfill a contract. The standard permits one of two methods for adoption: (i) retrospectively to each prior reporting period presented, with the ability to utilize certain practical expedients; or (ii) retrospectively with the cumulative effect of initially applying ASU 2014-09 recognized at the date of initial application, including additional disclosures. We have not yet selected a transition method.
We have not completed our evaluation of the effect that each of these ASUs will have on our consolidated financial statements and related disclosures. We will be required to implement this guidance in the first quarter of fiscal year 2019 with early adoption permitted beginning in the first quarter of fiscal year 2018. We will adopt the new accounting standard on February 1,
51
2018, which is the start of the first quarter of fiscal year 2019. We do not yet know, nor can we reasonably estimate the effect that the adoption of this standard will have on our consolidated financial statements.
Other
In October 2016, the FASB issued ASU 2016-16, Income Taxes (Topic 740), Intra-Entity Transfers of Assets Other Than Inventory. This ASU improves the accounting for the income tax consequences of intra-entity transfers of assets other than inventory by requiring an entity to recognize the income tax consequences when a transfer occurs, instead of when an asset is sold to an outside party. Examples of assets included in the scope of this ASU are intellectual property (IP) and property, plant, and equipment. The amendments in this ASU should be applied on a modified retrospective basis through a cumulative-effect adjustment directly to retained earnings as of the beginning of the period of adoption. We will be required to implement this guidance in the first quarter of fiscal year 2019. Early adoption is permitted as of the beginning of an annual reporting period for which interim or annual financial statements have not been issued. We are evaluating the effect that ASU 2016-16 will have on our consolidated financial statements and related disclosures. We do not yet know, nor can we reasonably estimate the effect that the adoption of this standard will have on our consolidated financial statements.
In August 2016, the FASB issued ASU 2016-15, Statement of Cash Flows (Topic 230), Clarification of Certain Cash Receipts and Cash Payments. This ASU adds and clarifies guidance on the presentation and classification of eight specific cash flow items related to cash receipts and cash payments in the Statement of Cash Flows, with the intent of reducing diversity in practice. The amendments in this ASU should be applied retrospectively for each period presented. For those issues where it is impractical to apply these amendments retrospectively, the amendments should be applied prospectively as of the earliest date practicable. We will be required to implement this guidance in the first quarter of fiscal year 2019. Early adoption is permitted. This ASU is not expected to have a material impact on our consolidated financial statements and related disclosures.
In June 2016, the FASB issued ASU 2016-13, Financial Instruments-Credit Losses (Topic 326), Measurement of Credit Losses on Financial Instruments. This ASU changes how companies measure and recognize credit losses for various financial assets. This ASU will require companies to use an expected credit loss model to recognize estimated credit losses expected to occur over the remaining life of the financial assets rather than the current incurred credit loss model methodology. This revised guidance is applicable to our trade and term receivables. We will be required to implement this guidance in the first quarter of fiscal year 2021. Early adoption is permitted beginning in the first quarter of fiscal year 2020. We are evaluating the effect that ASU 2016-13 will have on our consolidated financial statements and related disclosures. We do not yet know, nor can we reasonably estimate the effect that the adoption of this standard will have on our consolidated financial statements.
In February 2016, the FASB issued ASU 2016-02, Leases (Topic 842). This ASU requires a lessee to recognize in the statement of financial position a liability to make lease payments, and a right-of-use asset representing its right to use the underlying asset for the lease term. We will be required to implement this guidance in the first quarter of fiscal year 2020. Early adoption is permitted. We are evaluating the effect that ASU 2016-02 will have on our consolidated financial statements and related disclosures. We do not yet know, nor can we reasonably estimate the effect that the adoption of this standard will have on our consolidated financial statements.
4. Fair Value Measurement
The following table presents information about financial assets and liabilities measured at fair value on a recurring basis as of January 31, 2017:
Fair Value | Level 1 | Level 2 | Level 3 | ||||||||||||
Cash equivalents: | |||||||||||||||
Money market funds | $ | 286,000 | $ | 286,000 | $ | — | $ | — | |||||||
Bank time deposits | 71,339 | — | 71,339 | — | |||||||||||
Total cash equivalents | 357,339 | 286,000 | 71,339 | — | |||||||||||
Contingent consideration | (2,385 | ) | — | — | (2,385 | ) | |||||||||
Total | $ | 354,954 | $ | 286,000 | $ | 71,339 | $ | (2,385 | ) | ||||||
52
The following table presents information about financial assets and liabilities measured at fair value on a recurring basis as of January 31, 2016:
Fair Value | Level 1 | Level 2 | Level 3 | ||||||||||||
Cash equivalents: | |||||||||||||||
Money market funds | $ | 205,000 | $ | 205,000 | $ | — | $ | — | |||||||
Bank time deposits | 55,056 | — | 55,056 | — | |||||||||||
Total cash equivalents | 260,056 | 205,000 | 55,056 | — | |||||||||||
Contingent consideration | (3,749 | ) | — | — | (3,749 | ) | |||||||||
Total | $ | 256,307 | $ | 205,000 | $ | 55,056 | $ | (3,749 | ) | ||||||
The FASB's authoritative guidance for the hierarchy of valuation techniques is based on whether the inputs to those valuation techniques are observable or unobservable. Observable inputs reflect market data obtained from independent sources. Unobservable inputs reflect our market assumptions. The fair value hierarchy consists of the following three levels:
• | Level 1—Quoted prices for identical instruments in active markets; |
• | Level 2—Quoted prices for similar instruments in active markets, quoted prices for identical or similar instruments in markets that are not active, and model-derived valuations whose significant inputs are observable; and |
• | Level 3—One or more significant inputs to the valuation model are unobservable. |
We base the fair value of money market funds included in cash equivalents on directly observable prices in markets that are active (Level 1).
We base the fair value of bank time deposits included in cash equivalents on quoted market prices for similar instruments in markets that are not active (Level 2).
In connection with certain acquisitions, payment of a portion of the purchase price is contingent typically upon the acquired business’ achievement of certain revenue goals. The short-term portion of the total recorded contingent consideration is included in accrued and other liabilities and the long-term portion of the total recorded contingent consideration is included in other long-term liabilities on our consolidated balance sheet. The following table summarizes the total recorded contingent consideration:
As of January 31, | 2017 | 2016 | |||||
Contingent consideration, short-term | $ | 836 | $ | 1,460 | |||
Contingent consideration, long-term | 1,549 | 2,289 | |||||
Total contingent consideration | $ | 2,385 | $ | 3,749 | |||
We have estimated the fair value of our contingent consideration as the present value of the expected payments over the term of the arrangements. The fair value measurement of our contingent consideration as of January 31, 2017 encompasses the following significant unobservable inputs:
Unobservable Inputs | Range | |||
Total estimated contingent consideration | $836 | - | $2,935 | |
Discount rate | 9.5% | - | 15.0% | |
Timing of cash flows (in years) | 0 | - | 2 | |
Changes in the fair value of our contingent consideration are primarily driven by changes in the estimated amount and timing of payments, resulting from changes in the forecasted revenues of the acquired businesses. Significant changes in any of the inputs in isolation could result in a fluctuation in the fair value measurement of contingent consideration. Changes in fair value are recognized in special charges in our consolidated statement of income in the period in which the change is identified.
53
The following table summarizes contingent consideration activity:
Balance as of January 31, 2015 | $ | 4,563 | |
Payments | (1,525 | ) | |
Changes in fair value | 586 | ||
Interest accretion | 125 | ||
Balance as of January 31, 2016 | $ | 3,749 | |
Payments | (1,475 | ) | |
Interest accretion | 111 | ||
Balance as of January 31, 2017 | $ | 2,385 | |
The following table summarizes the fair value and carrying value of our 4.00% Convertible Subordinated Debentures (4.00% Debentures):
As of January 31, | 2017 | 2016 | |||||
Fair value of 4.00% Debentures | $ | 470,965 | $ | 255,487 | |||
Carrying value of 4.00% Debentures | $ | 242,921 | $ | 234,888 | |||
We based the fair value of our 4.00% Debentures on the quoted market price at the balance sheet date. Our notes are not actively traded and the quoted market price is derived from observable inputs including our stock price, stock volatility, and interest rate (Level 2). We believe the carrying value of other notes payable of $5,188 at January 31, 2017 and January 31, 2016 approximated fair value. Of the total carrying value of notes payable, $242,921 was classified as current on our consolidated balance sheet as of January 31, 2017 and none was classified as current on our consolidated balance sheet as of January 31, 2016. See additional discussion of notes payable in Note 7. “Notes Payable.”
The carrying amounts of cash equivalents, trade accounts receivable, net, term receivables, short-term borrowings, accounts payable, and accrued liabilities approximate fair value because of the short-term nature of these instruments or because amounts have been appropriately discounted.
During the quarter ended July 31, 2016, we acquired a non-marketable equity security which was accounted for using the cost method of accounting. Our cost method investments are reported at cost net of impairment losses. The carrying amount of the non-marketable equity security was $3,000 at January 31, 2017. Investments accounted for under the cost method of accounting are measured and recorded at fair value when identified events or changes in circumstances have a significant adverse effect on the fair value of the investments. When these events or changes in circumstances occur, these investments are classified within Level 3 as they are valued using significant unobservable inputs. We periodically review our cost method investments for these types of events or changes in circumstances.
5. Term Receivables and Trade Accounts Receivable
We have long-term installment receivables that are attributable to multi-year, multi-element term license sales agreements. Balances for term agreements that are due within one year of the balance sheet date are included in trade accounts receivable, net and balances that are due more than one year from the balance sheet date are included in term receivables, long-term. We discount the total product portion of the agreements to reflect the interest component of the transaction. We amortize the interest component of the transaction to system and software revenues over the period in which payments are made and balances are outstanding, using the effective interest method. We determine the discount rate at the outset of the arrangement based upon the current credit rating of the customer. We reset the discount rate periodically considering changes in prevailing interest rates but do not adjust previously discounted balances.
Trade accounts receivable and term receivable balances were as follows:
As of January 31, | 2017 | 2016 | |||||
Trade accounts receivable | $ | 214,651 | $ | 176,021 | |||
Term receivables, short-term | $ | 297,993 | $ | 317,188 | |||
Term receivables, long-term | $ | 303,686 | $ | 268,657 | |||
Trade accounts receivable include billed amounts whereas term receivables, short-term are comprised of unbilled amounts. Term receivables, short term represent the portion of long-term installment agreements that are due within one year of the balance sheet date. Billings for term agreements typically occur thirty days prior to the contractual due date, in accordance with
54
individual contract installment terms. Term receivables, long-term represent unbilled amounts which are scheduled to be billed beyond one year from the balance sheet date.
We perform a credit risk assessment of all customers using the Standard & Poor’s (S&P) credit rating as our primary credit-quality indicator. The S&P credit ratings are based on the most recent S&P score available at the time of assessment. For customers that do not have an S&P credit rating, we base our credit risk assessment on results provided in the customer's most recent financial statements at the time of assessment. We determine whether or not to extend credit to these customers based on the results of our internal credit assessment, thus mitigating our risk of loss.
The credit risk assessment for our long-term receivables was as follows:
As of January 31, | 2017 | 2016 | |||||
S&P credit rating: | |||||||
AAA+ through BBB- | $ | 143,315 | $ | 195,764 | |||
BB+ and lower | 54,639 | 22,520 | |||||
197,954 | 218,284 | ||||||
Internal credit assessment | 105,732 | 50,373 | |||||
Total long-term term receivables | $ | 303,686 | $ | 268,657 | |||
As discussed in Note 2. “Summary of Significant Accounting Policies”, we maintain allowances for doubtful accounts on trade accounts receivable and term receivables, long-term for estimated losses resulting from the inability of our customers to make required payments.
We reduced our allowance for doubtful accounts during the fiscal year ended January 31, 2015 by $(1,691), to reflect a change in estimate of our unspecified reserves resulting from sustained low write-off experience and strong collections. The adjustment was recorded in marketing and selling expense in our statement of income.
The following shows the change in allowance for doubtful accounts for the fiscal years ended January 31, 2017, 2016, and 2015:
Allowance for doubtful accounts | Beginning balance | Expense adjustment | Other deductions(1) | Ending balance | |||||||||||
Fiscal year ended January 31, 2017 | $ | 3,826 | $ | (58 | ) | $ | 321 | $ | 4,089 | ||||||
Fiscal year ended January 31, 2016 | $ | 4,217 | $ | (349 | ) | $ | (42 | ) | $ | 3,826 | |||||
Fiscal year ended January 31, 2015 | $ | 5,469 | $ | (988 | ) | $ | (264 | ) | $ | 4,217 | |||||
(1) | Specific account write-offs and foreign exchange. |
We enter into agreements to sell qualifying accounts receivable from time to time to certain financing institutions on a non-recourse basis. Amounts collected from customers on accounts receivable previously sold on a non-recourse basis to financial institutions are included in short-term borrowings on the balance sheet. These amounts are remitted to the financial institutions in the month following quarter-end.
We sold the following receivables to financing institutions on a non-recourse basis and recognized the following gain on the sale of those receivables:
Fiscal year ended January 31, | 2017 | 2016 | 2015 | ||||||||
Net proceeds | $ | 45,658 | $ | 42,661 | $ | 22,572 | |||||
Trade receivables, short-term | $ | 26,920 | $ | 16,344 | $ | 12,715 | |||||
Term receivables, long-term | 20,064 | 27,770 | 10,461 | ||||||||
Total receivables sold | $ | 46,984 | $ | 44,114 | $ | 23,176 | |||||
Discount on sold receivables | $ | (1,326 | ) | $ | (1,453 | ) | $ | (604 | ) | ||
Unaccreted interest on sold receivables | 1,897 | 2,723 | 922 | ||||||||
Gain on sale of receivables | $ | 571 | $ | 1,270 | $ | 318 | |||||
55
6. Short-Term Borrowings
Short-term borrowings consisted of the following:
As of January 31, | 2017 | 2016 | |||||
Senior revolving credit facility | $ | 20,000 | $ | 25,000 | |||
Collections of previously sold accounts receivable | 10,803 | 7,568 | |||||
Other borrowings | 914 | 881 | |||||
Short-term borrowings | $ | 31,717 | $ | 33,449 | |||
We have a syndicated, senior, unsecured, revolving credit facility, which expires on January 9, 2020.
The revolving credit facility has a maximum borrowing capacity of $125,000. As stated in the revolving credit facility, we have the option to pay interest based on:
(i) | London Interbank Offered Rate (LIBOR) with varying maturities commensurate with the borrowing period we select, plus a spread of between 2.00% and 2.50% based on a pricing grid tied to a financial covenant, or |
(ii) | A base rate plus a spread of between 1.00% and 1.50%, based on a pricing grid tied to a financial covenant. |
As a result of these interest rate options, our interest expense associated with borrowings under this revolving credit facility will vary with market interest rates.
Commitment fees are payable on the unused portion of the revolving credit facility at rates between 0.30% and 0.40% based on a pricing grid tied to a financial covenant.
The revolving credit facility contains certain financial and other covenants, including the following:
• | Our adjusted quick ratio (ratio of the sum of cash and cash equivalents, short-term investments, and net current receivables to total current liabilities) shall not be less than 1.00; |
• | Our tangible net worth (stockholders' equity less goodwill and other intangible assets) must exceed the calculated required tangible net worth as defined in the credit agreement; |
• | Our leverage ratio (ratio of total liabilities less subordinated debt to the sum of subordinated debt and tangible net worth) shall be less than 2.00; |
• | Our senior leverage ratio (ratio of total debt less subordinated debt to the sum of subordinated debt and tangible net worth) shall not be greater than 0.90; and |
• | Our minimum cash and accounts receivable ratio (ratio of the sum of cash and cash equivalents, short-term investments, and 42.0% of net current accounts receivable, to outstanding credit agreement borrowings) shall not be less than 1.25. |
The revolving credit facility limits the aggregate amount we can pay for dividends and repurchases of our stock over the term of the facility to $200,000 plus 70% of our cumulative net income (loss) for periods after February 1, 2016.
We were in compliance with all financial covenants as of January 31, 2017. If we fail to comply with the financial covenants and do not obtain a waiver from our lenders, we would be in default under the revolving credit facility and our lenders could terminate the facility and demand immediate repayment of all outstanding loans under the revolving credit facility.
7. Notes Payable
Notes payable consist of the following:
As of January 31, | 2017 | 2016 | |||||
4.00% Debentures | $ | 242,921 | $ | 234,888 | |||
Other | 5,188 | 5,188 | |||||
Notes payable | 248,109 | 240,076 | |||||
4.00% Debentures, current portion | (242,921 | ) | — | ||||
Notes payable, long-term | $ | 5,188 | $ | 240,076 | |||
56
Our 4.00% Debentures are due in 2031, but we may be required to repay them earlier under the conversion and redemption provisions described below.
Annual maturities of our notes payable are scheduled as follows:
Fiscal years ending January 31, | |||
2019 | $ | 2,000 | |
2020 | 3,188 | ||
Thereafter (1) | 252,957 | ||
Total | $ | 258,145 | |
(1) The 4.00% Debentures are currently convertible at the option of the holders and would be due in fiscal year 2018 if converted.
4.00% Debentures
In April 2011, we issued $253,000 of 4.00% Debentures in a private placement pursuant to the Securities and Exchange Commission Rule 144A under the Securities Act of 1933. Interest on the 4.00% Debentures is payable semi-annually in April and October. The 4.00% Debentures are unsecured obligations.
Each one thousand dollars in principal amount of the 4.00% Debentures is currently convertible, under certain circumstances, into 50.4551 shares of our common stock (equivalent to a conversion price of $19.82 per share). The initial conversion rate for the 4.00% Debentures was 48.6902 shares of our common stock for each one thousand dollars in principal amount (equivalent to a conversion price of $20.54 per share). The conversion rate is adjusted because we declare and pay quarterly cash dividends.
The 4.00% Debentures are convertible, under certain circumstances, into shares of our common stock at the conversion rate noted above. The circumstances for conversion include:
• | The market price of our common stock exceeding 120% of the conversion price, or $23.78 per share as of January 31, 2017, for at least 20 of the last 30 trading days in the previous fiscal quarter; |
• | A call for redemption of the 4.00% Debentures; |
• | Specified distributions to holders of our common stock; |
• | If a fundamental change, such as a change of control, occurs; |
• | During the two months prior to, but not on, the maturity date; or |
• | The market price of the 4.00% Debentures declining to less than 98% of the value of the common stock into which the 4.00% Debentures are convertible. |
Upon conversion of any 4.00% Debentures, a holder will receive:
(i) | Cash for the lesser of the principal amount of the 4.00% Debentures that are converted or the value of the converted shares; and |
(ii) | Cash or shares of common stock, at our election, for the excess, if any, of the value of the converted shares over the principal amount. |
As of January 31, 2017, the if-converted value of the 4.00% Debentures to the note holders exceeded the principal amount by $218,124.
During the fiscal quarter ended January 31, 2017, the market price of our common stock exceeded 120% of the conversion price for at least 20 of the last 30 trading days of the period. Accordingly, the 4.00% Debentures are convertible at the option of the holders through April 30, 2017. Therefore, the carrying value of the 4.00% Debentures is classified as a current liability. Additionally, the excess of the principal amount over the carrying amount of the 4.00% Debentures is reclassified from permanent equity to temporary equity in our consolidated balance sheet. The determination of whether or not the 4.00% Debentures are convertible is performed at each balance sheet date and may change from quarter to quarter. If this threshold is not met next quarter, the 4.00% Debentures will be reclassified as a long-term liability and the temporary equity will be reclassified to permanent equity in our consolidated balance sheet.
57
If a holder elects to convert their 4.00% Debentures through April 30, 2017, we would be required to pay cash for at least the principal amount of the converted 4.00% Debentures.
If the proposed acquisition of the Company by Siemens is completed at a price of $37.25 per share and the 4.00% Debentures are converted, an estimated cash payment of $477,000 to the debenture holders would be required, including the impact of the dividend declared on March 2, 2017.
Effective April 5, 2016, we may redeem some or all of the 4.00% Debentures for cash at the following redemption prices, expressed as a percentage of principal plus any accrued and unpaid interest:
Period | Redemption Price | |
Beginning on April 5, 2016 and ending on March 31, 2017 | 101.143 | % |
Beginning on April 1, 2017 and ending on March 31, 2018 | 100.571 | % |
On April 1, 2018 and thereafter | 100.000 | % |
The holders, at their option, may redeem the 4.00% Debentures for cash on April 1, 2018, April 1, 2021, and April 1, 2026, and in the event of a fundamental change in the Company. In each case, our repurchase price will be 100% of the principal amount of the 4.00% Debentures plus any accrued and unpaid interest.
The 4.00% Debentures contain a conversion feature allowing for settlement of the debt in cash upon conversion, therefore we separately account for the implied liability and equity components of the 4.00% Debentures. The principal amount, unamortized debt discount, unamortized debt issuance costs, net carrying amount of the liability component, and carrying amount of the equity component of the 4.00% Debentures are as follows:
As of January 31, | 2017 | 2016 | |||||
Principal amount | $ | 252,957 | $ | 252,957 | |||
Unamortized debt discount | (8,926 | ) | (16,007 | ) | |||
Unamortized debt issuance costs | (1,110 | ) | (2,062 | ) | |||
Net carrying amount of the liability component | $ | 242,921 | $ | 234,888 | |||
Equity component, net of debt issuance costs | $ | 42,518 | $ | 42,518 | |||
The unamortized debt discount and debt issuance costs amortize to interest expense using the effective interest method through March 2018. The effective interest rate on the 4.00% Debentures was 7.25% for fiscal years 2017, 2016, and 2015.
We recognized the following amounts in interest expense in the consolidated statement of income related to the 4.00% Debentures:
Fiscal year ended January 31, | 2017 | 2016 | 2015 | ||||||||
Interest expense at the contractual interest rate | $ | 10,118 | $ | 10,117 | $ | 10,120 | |||||
Amortization of debt discount | $ | 7,081 | $ | 6,593 | $ | 6,139 | |||||
Amortization of debt issuance costs | $ | 952 | $ | 952 | $ | 952 | |||||
Other Notes Payable
In February 2015, we issued a subordinated note payable as part of a business combination. The principal amount of $3,188 was outstanding as of January 31, 2017. The note bears interest at a rate of 4.0% and is due in full on February 25, 2019.
In September 2015, we issued a subordinated note payable as part of a business combination. The principal amount of $2,000 was outstanding as of January 31, 2017. The note bears interest at a rate of 4.0% and is due in full on September 8, 2018.
8. Income Taxes
Domestic and foreign pre-tax income was as follows:
Fiscal year ended January 31, | 2017 | 2016 | 2015 | ||||||||
Domestic | $ | (31,914 | ) | $ | (25,971 | ) | $ | (2,991 | ) | ||
Foreign | 216,770 | 144,900 | 170,749 | ||||||||
Total pre-tax income | $ | 184,856 | $ | 118,929 | $ | 167,758 | |||||
58
The provision for income taxes was as follows:
Fiscal year ended January 31, | 2017 | 2016 | 2015 | ||||||||
Current: | |||||||||||
Federal | $ | (427 | ) | $ | 734 | $ | (223 | ) | |||
State | 226 | 199 | 444 | ||||||||
Foreign | 19,720 | 17,994 | 13,677 | ||||||||
Total current | 19,519 | 18,927 | 13,898 | ||||||||
Deferred: | |||||||||||
Federal and state | 10,679 | 4,402 | 7,687 | ||||||||
Foreign | (208 | ) | 1,424 | 996 | |||||||
Total deferred | 10,471 | 5,826 | 8,683 | ||||||||
Total provision for income taxes | $ | 29,990 | $ | 24,753 | $ | 22,581 | |||||
Actual income tax expense is different from that which would have been computed by applying the statutory U.S. federal income tax rate to our income before income tax. A reconciliation of income tax expense as computed at the U.S. federal statutory income tax rate to the provision for income taxes is as follows:
Fiscal year ended January 31, | 2017 | 2016 | 2015 | ||||||||
Federal tax, at statutory rate | $ | 64,700 | $ | 41,626 | $ | 58,725 | |||||
State tax, net of federal benefit | 684 | (60 | ) | 900 | |||||||
Impact of international operations including withholding taxes and other reserves | (48,268 | ) | 7,143 | (27,042 | ) | ||||||
Repatriation of foreign subsidiary earnings | 55,812 | 354 | 21,969 | ||||||||
Foreign tax credits | (10,739 | ) | (2,382 | ) | (5,143 | ) | |||||
Tax credits (excluding foreign tax credits) | (12,180 | ) | (11,539 | ) | (8,089 | ) | |||||
Change in valuation allowance | (25,531 | ) | (21,055 | ) | (26,443 | ) | |||||
Amortization of deferred charge | 415 | (167 | ) | 1,168 | |||||||
Stock-based compensation expense | 489 | 3,402 | 2,929 | ||||||||
Non-deductible meals and entertainment | 1,247 | 1,177 | 1,238 | ||||||||
Other, net | 3,361 | 6,254 | 2,369 | ||||||||
Provision for income taxes | $ | 29,990 | $ | 24,753 | $ | 22,581 | |||||
59
The tax effects of temporary differences and carryforwards, which gave rise to significant portions of deferred tax assets and liabilities, were as follows:
As of January 31, | 2017 | 2016 | |||||
Deferred tax assets: | |||||||
Reserves and allowances | $ | 10,346 | $ | 12,954 | |||
Accrued expenses not currently deductible | 23,299 | 12,446 | |||||
Stock-based compensation expense | 8,403 | 8,259 | |||||
Net operating loss carryforwards | 14,743 | 24,138 | |||||
Tax credit carryforwards | 104,965 | 87,443 | |||||
Purchased technology and other intangible assets | 4,201 | 4,219 | |||||
Deferred revenue | 4,641 | 4,541 | |||||
Other, net | 8,845 | 8,394 | |||||
Total gross deferred tax assets | 179,443 | 162,394 | |||||
Less valuation allowance | (74,041 | ) | (63,554 | ) | |||
Deferred tax assets | 105,402 | 98,840 | |||||
Deferred tax liabilities: | |||||||
Intangible assets | (14,002 | ) | (13,163 | ) | |||
Undistributed foreign earnings | (97,696 | ) | (87,390 | ) | |||
Convertible debt | (3,523 | ) | (6,322 | ) | |||
Depreciation of property, plant, and equipment | (2,169 | ) | (1,715 | ) | |||
Deferred tax liabilities | (117,390 | ) | (108,590 | ) | |||
Net deferred tax liabilities | $ | (11,988 | ) | $ | (9,750 | ) | |
All deferred tax assets and liabilities are presented in our balance sheet in other assets and other long-term liabilities respectively.
The increase in the valuation allowance largely resulted from the early adoption of ASU 2016-09 offset by accrual of a U.S. deferred tax liability on fiscal year 2017 foreign earnings that are not permanently reinvested and may be repatriated in the future.
As of January 31, 2017, we had the following foreign and U.S. Federal and state carryforwards for income tax return purposes:
Credit or carryforward | As of January 31, 2017 | Expiration | |||
Federal credits and carryforwards: | |||||
Research and experimentation credit carryforward | $ | 99,194 | Fiscal years 2019 - 2037 | ||
Net operating loss carryforward | $ | 13,863 | Fiscal years 2020 - 2037 | ||
Foreign tax credits | $ | 12,297 | Fiscal years 2020 - 2027 | ||
Alternative minimum tax credits | $ | 2,682 | No expiration | ||
Childcare credits | $ | 1,939 | Fiscal years 2023 - 2037 | ||
State income tax credits and carryforwards: | |||||
Net operating loss carryforward | $ | 175,233 | Fiscal years 2018 - 2037 | ||
Research and experimentation | $ | 22,629 | Fiscal years 2018 - 2032 | ||
Miscellaneous | $ | 699 | Various | ||
Foreign net operating loss carryforwards | $ | 19,472 | Generally indefinite | ||
We determine deferred tax assets and liabilities based on differences between the financial reporting and tax basis of assets and liabilities. In addition, we record deferred tax assets for net operating loss carryforwards and tax credit carryforwards. We calculate the deferred tax assets and liabilities using the enacted tax rates and laws that will be in effect when we expect the differences to reverse. A valuation allowance is recorded when it is more likely than not that all or some portion of the deferred tax asset will not be realized. We have determined that it is uncertain whether our U.S. entity will generate sufficient taxable income to fully utilize tax credit carryforwards and certain net operating losses. Accordingly, we recorded a valuation allowance against those deferred tax assets for which realization does not meet the more likely than not standard. We have
60
established valuation allowances related to certain foreign deferred tax assets based on limitations on the utilization of such deferred tax assets in certain jurisdictions. We will continue to evaluate the realizability of the deferred tax assets on a periodic basis.
We have not provided for U.S. income taxes on the undistributed earnings of our foreign subsidiaries to the extent they are considered permanently re-invested outside the U.S. As of January 31, 2017, the cumulative amount of earnings upon which U.S. income taxes have not been provided is approximately $478,660. Determination of the amount of unrecognized deferred U.S. income tax liability on permanently re-invested earnings is not practicable. Where the earnings of our foreign subsidiaries are not treated as permanently reinvested, we have accrued for U.S. income taxes on those earnings in our tax provision.
We are subject to income taxes in the U.S. and in numerous foreign jurisdictions. In the ordinary course of business, there are many transactions and calculations where the ultimate tax determination is uncertain. The statute of limitations for adjustments to our historic tax obligations will vary from jurisdiction to jurisdiction. In some cases it may be extended or be unlimited. Furthermore, net operating loss and tax credit carryforwards may be subject to adjustment after the expiration of the statute of limitations of the year such net operating losses and tax credits originated. Our larger jurisdictions generally provide for a statute of limitation from three to five years. For U.S. federal income tax purposes, the tax years which remain open for examination are fiscal years 2014 and forward, although net operating loss and credit carryforwards from all years are subject to examination and adjustment for three years following the year in which utilized. We are currently under examination in various jurisdictions. The examinations are in different stages and timing of their resolution is difficult to predict. The statute of limitations remains open for years on and after fiscal year 2013 in Ireland, fiscal year 2014 in France, fiscal year 2012 in Japan, fiscal year 2009 in India and fiscal year 2012 in Israel.
We have reserves for taxes to address potential exposures involving tax positions that are being challenged or that could be challenged by the tax authorities even though we believe the positions we have taken are appropriate. We believe our tax reserves are adequate to cover potential liabilities. We review the tax reserves as circumstances warrant and adjust the reserves as events occur that affect our potential liability for additional taxes. It is often difficult to predict the final outcome or timing of resolution of any particular tax matter. Various events, some of which cannot be predicted, such as clarification of tax law by administrative or judicial means, may occur and would require us to increase or decrease our reserves and effective tax rate. It is reasonably possible that existing unrecognized tax benefits may decrease from $0 to $2,000 due to settlements or expiration of the statute of limitations within the next twelve months. To the extent that uncertain tax positions resolve in our favor, it could have a positive impact on our effective tax rate. A portion of our reserves, which could settle or expire within the next twelve months, may result in deferred tax assets subject to a valuation allowance for which no benefit would be recognized. Income tax-related interest and penalties were $950 for the fiscal year ended January 31, 2017, $1,717 for the fiscal year ended January 31, 2016 and $884 for the fiscal year ended January 31, 2015.
The below schedule shows the gross changes in unrecognized tax benefits associated with uncertain tax positions for the fiscal years ending January 31, 2017 and 2016:
Unrecognized tax benefits as of January 31, 2015 | $ | 39,771 | |
Gross increases—tax positions in prior period | 6,548 | ||
Gross decreases—tax positions in prior period | (1,702 | ) | |
Gross increases—tax positions in current period | 6,509 | ||
Settlements | — | ||
Lapse of statute of limitations | (1,125 | ) | |
Cumulative translation adjustment | (1,327 | ) | |
Unrecognized tax benefits as of January 31, 2016 | $ | 48,674 | |
Gross increases—tax positions in prior period | 3,211 | ||
Gross decreases—tax positions in prior period | (2,520 | ) | |
Gross increases—tax positions in current period | 7,513 | ||
Settlements | (378 | ) | |
Lapse of statute of limitations | (1,335 | ) | |
Cumulative translation adjustment | 1,964 | ||
Unrecognized tax benefits as of January 31, 2017 | $ | 57,129 | |
The ending balances of unrecognized tax benefits represent the gross amount of exposure in individual jurisdictions and do not reflect any additional benefits expected to be realized if such positions were not sustained, such as the federal deduction that
61
could be realized if an unrecognized state deduction was not sustained. The ending gross balances exclude accrued interest and penalties related to such positions of $10,160 as of January 31, 2017 and $9,817 as of January 31, 2016. We expect that $28,939 of our unrecognized tax benefits, if recognized, would favorably affect our effective tax rate.
9. Commitments and Contingencies
Leases
We lease a majority of our field sales offices and research and development facilities under non-cancelable operating leases. In addition, we lease certain equipment used in our research and development and marketing and selling activities.
Rent expense under operating leases was as follows:
Fiscal year ended January 31, | 2017 | 2016 | 2015 | ||||||||
Rent expense | $ | 27,727 | $ | 27,040 | $ | 28,114 | |||||
Future minimum lease payments under non-cancelable operating leases are approximately as follows:
Fiscal years ending January 31, | Lease Payments | ||
2018 | $ | 22,153 | |
2019 | 20,937 | ||
2020 | 17,307 | ||
2021 | 14,554 | ||
2022 | 9,932 | ||
Thereafter | 13,853 | ||
Total | $ | 98,736 | |
Indemnifications
Our license and services agreements generally include a limited indemnification provision for claims from third parties relating to our IP. The indemnification is generally limited to the amount paid by the customer, a multiple of the amount paid by the customer, or a set cap. As of January 31, 2017, we were not aware of any material liabilities arising from these indemnification obligations.
Legal Proceedings
From time to time we are involved in various disputes and litigation matters that arise in the ordinary course of business. These include disputes and lawsuits relating to IP rights, contracts, distributorships, and employee relations matters. Periodically, we review the status of various disputes and litigation matters and assess our potential exposure. When we consider the potential loss from any dispute or legal matter probable and the amount or the range of loss can be estimated, we will accrue a liability for the estimated loss. Legal proceedings are subject to uncertainties, and the outcomes are difficult to predict. Because of such uncertainties, we base accruals on the best information available at the time. As additional information becomes available, we reassess the potential liability related to pending claims and litigation matters and may revise estimates. We believe that the outcome of current litigation, individually and in the aggregate, will not have a material effect on our results of operations.
In some instances, we are unable to reasonably estimate any potential loss or range of loss. The nature and progression of litigation can make it difficult to predict the impact a particular lawsuit will have. There are many reasons why we cannot make these assessments, including, among others, one or more of the following: a proceeding being in its early stages; damages sought that are unspecific, unsupportable, unexplained or uncertain; discovery not having been started or being incomplete; the complexity of the facts that are in dispute; the difficulty of assessing novel claims; the parties not having engaged in any meaningful settlement discussions; the possibility that other parties may share in any ultimate liability; and/or the often slow pace of litigation.
In December 2012, Synopsys, Inc. (Synopsys) filed a lawsuit claiming patent infringement against us in the U.S. District Court for the Northern District of California, alleging that our Veloce® family of products infringed four Synopsys U.S. patents. In January 2015, the court issued a summary judgment order in our favor invalidating all asserted claims of three of the Synopsys patents. In June 2015, the U.S. Patent and Trademark Office ruled that claims of the remaining patent asserted against us by Synopsys are unpatentable. This case is no longer on the court’s docket for trial. Synopsys appealed the decisions by both the
62
district court and the U.S. Patent and Trademark Office. The Court of Appeals for the Federal Circuit has unanimously confirmed the invalidity of all four Synopsys patents.
In June 2013, Synopsys also filed a claim against us in the U.S District Court for the District of Oregon, similarly alleging that our Veloce family of products infringed two additional Synopsys U.S. patents.
We believe these lawsuits were filed in response to patent lawsuits we filed in 2010 and 2012 in the U.S. District Court for the District of Oregon against Emulation and Verification Engineering S.A. and EVE-USA, Inc. (together EVE), which Synopsys acquired in October 2012. We alleged in our lawsuits that EVE (and later Synopsys) infringed five Mentor Graphics' patents.
Both of Synopsys' patents and four of our patents were removed from the Oregon case on summary judgment, and we proceeded to trial on our one remaining patent - U.S. Patent No. 6,240,376 (the '376 Patent). On October 10, 2014, a jury found that EVE and Synopsys infringed the '376 Patent. As part of the verdict, the jury awarded us damages of approximately $36,000. As of January 31, 2017, nothing has been included in our financial results for this award. On March 12, 2015, the Oregon court granted our request for a permanent injunction against future sales of Synopsys emulators containing the infringing technology.
Synopsys filed an appeal, and sought to have the infringed claims invalidated by the U.S. Patent and Trademark Office.
On December 15, 2016, the U.S. Patent and Trademark Office dismissed Synopsys' challenge to the validity of claims 1 and 28 of the '376 Patent based on a prior proceeding. Synopsys' challenge to claims 24, 26, and 27 of the '376 Patent remains pending.
On March 16, 2017, the Federal Circuit issued its order on Synopsys' appeal, affirming the jury's finding of infringement and the $36,000 damages award in our favor. The Court also found that the litigation could continue with three of our patents, and one Synopsys patent, that had been removed from the case on summary judgment. The Court further found that we could proceed with a claim of willful infringement, which can result in a trebled damages award. The Federal Circuit's decision enables us to proceed to trial on these claims in the U.S. District Court for the District of Oregon.
We do not have sufficient information upon which to determine that a loss in connection with these matters is probable, reasonably possible, or estimable, and thus no liability has been established nor has a range of loss been disclosed.
10. Stockholders' Equity
Dividends
The following table summarizes dividends declared since the beginning of fiscal year 2016:
Declaration Date | Record Date | Payment Date | Per Share Amount | Total Amount | ||||||||
Fiscal Year 2018 | ||||||||||||
3/2/2017 | 3/14/2017 | 3/30/2017 | $ | 0.055 | ||||||||
Fiscal Year 2017 | ||||||||||||
11/22/2016 | 12/8/2016 | 1/3/2017 | $ | 0.055 | $ | 6,026 | ||||||
8/18/2016 | 9/19/2016 | 9/30/2016 | $ | 0.055 | $ | 6,016 | ||||||
5/19/2016 | 6/10/2016 | 6/30/2016 | $ | 0.055 | $ | 5,886 | ||||||
3/3/2016 | 3/10/2016 | 3/31/2016 | $ | 0.055 | $ | 5,880 | ||||||
Fiscal Year 2016 | ||||||||||||
11/19/2015 | 12/15/2015 | 1/4/2016 | $ | 0.055 | $ | 6,326 | ||||||
8/20/2015 | 9/10/2015 | 9/30/2015 | $ | 0.055 | $ | 6,491 | ||||||
5/22/2015 | 6/10/2015 | 6/30/2015 | $ | 0.055 | $ | 6,389 | ||||||
2/26/2015 | 3/10/2015 | 3/31/2015 | $ | 0.055 | $ | 6,383 | ||||||
Future declarations of quarterly dividends and the establishment of future record and payment dates are subject to the quarterly determination of our Board of Directors.
63
11. Employee Stock and Savings Plans
Stock Option Plans and Stock Plans
Our 2010 Omnibus Incentive Plan (Incentive Plan) is administered by the Compensation Committee of our Board of Directors and permits accelerated vesting of outstanding options, restricted stock units, restricted stock awards, and other equity incentives upon the occurrence of certain changes in control of our company. Stock options and time-based restricted stock units under the Incentive Plan are generally expected to vest over four years. Stock options have an expiration date of ten years from the date of grant and an exercise price no less than the fair market value of the shares on the date of grant. Performance-based restricted stock units vest after three years and include goals for operating income margin. The source of shares issued under the Incentive Plan is new shares. We estimate forfeitures based on our historical forfeiture rates. We have not issued any options since fiscal year 2013. Our current equity strategy is to grant restricted stock units rather than options to ensure that we deliver value to our employees when there is volatility in the market.
As of January 31, 2017, a total of 4,980 shares of common stock were available for future grant under the Incentive Plan.
The following table summarizes restricted stock unit activity (including the target number of shares awarded for performance-based restricted stock units):
Restricted Stock Units | Weighted Average Grant Date Fair Value | Weighted Average Remaining Contractual Term (Years) | Aggregate Intrinsic Value | |||||||||
Nonvested as of January 31, 2016 | 4,117 | $ | 22.35 | |||||||||
Granted | 2,008 | $ | 23.82 | |||||||||
Vested | (1,639 | ) | $ | 21.52 | ||||||||
Forfeited | (143 | ) | $ | 22.15 | ||||||||
Nonvested as of January 31, 2017 | 4,343 | $ | 23.34 | 1.63 | $ | 160,304 | ||||||
The following table summarizes the fair value of restricted stock units vested:
Fiscal year ended January 31, | 2017 | 2016 | 2015 | ||||||||
Total fair value of restricted stock units vested | $ | 35,264 | $ | 27,527 | $ | 22,874 | |||||
Stock options outstanding, the weighted average exercise price, and transactions involving stock options are summarized as follows:
Options Outstanding | Weighted Average Exercise Price | Weighted Average Remaining Contractual Terms (Years) | Aggregate Intrinsic Value | |||||||||
Balance as of January 31, 2016 | 2,471 | $ | 9.66 | |||||||||
Granted | — | $ | — | |||||||||
Exercised | (294 | ) | $ | 10.10 | ||||||||
Forfeited | — | $ | — | |||||||||
Expired | (16 | ) | $ | 12.69 | ||||||||
Balance as of January 31, 2017 | 2,161 | $ | 9.57 | 3.21 | $ | 59,069 | ||||||
Options exercisable as of January 31, 2017 | 2,161 | $ | 9.57 | 3.21 | $ | 59,069 | ||||||
The total intrinsic value of options exercised and cash received from options exercised was as follows:
Fiscal year ended January 31, | 2017 | 2016 | 2015 | ||||||||
Intrinsic value | $ | 4,408 | $ | 9,440 | $ | 4,601 | |||||
Cash received | $ | 2,964 | $ | 6,260 | $ | 4,636 | |||||
Employee Stock Purchase Plans
We have an ESPP for U.S. employees and an ESPP for certain foreign subsidiary employees. The ESPPs provide for six month offerings commencing on January 1 and July 1 of each year with purchases on June 30 and December 31 of each year. Each
64
eligible employee may purchase up to six thousand shares of stock on each purchase date at prices no less than 85% of the lesser of the fair market value of the shares on the offering date or on the purchase date. As of January 31, 2017, 5,848 shares remain available for future purchase under the ESPPs. The ESPPs were suspended subsequent to the purchase on December 31, 2016 as result of the merger agreement executed with Siemens.
The following table summarizes shares issued under the ESPPs and other associated information:
Fiscal year ended January 31, | 2017 | 2016 | 2015 | ||||||||
Shares issued under the ESPPs | 1,772 | 1,538 | 1,389 | ||||||||
Cash received for the purchase of shares under the ESPPs | $ | 29,546 | $ | 26,511 | $ | 25,642 | |||||
Weighted average purchase price per share | $ | 16.67 | $ | 17.24 | $ | 18.47 | |||||
Stock-Based Compensation Expense
The fair value of restricted stock units is the market value as of the grant date reduced by the value of expected dividends payable on our common stock prior to vesting.
The fair value of the purchase rights under our ESPPs is determined using a Black-Scholes option-pricing model. The Black-Scholes option-pricing model incorporates several highly subjective assumptions including expected volatility, expected dividends, and interest rates. The expected volatility for the purchase rights for our ESPPs is based on the historical volatility of our shares of common stock. The risk-free interest rate for periods within the contractual life of the purchase rights under our ESPPs is based on the U.S. Treasury yield curve in effect at the time of the grant. The expected term for the purchase rights for our ESPPs is the six month offering period.
The weighted average grant date fair values are summarized as follows:
Fiscal year ended January 31, | 2017 | 2016 | 2015 | ||||||||
Restricted stock units granted | $ | 23.82 | $ | 24.10 | $ | 21.52 | |||||
ESPP purchase rights | $ | 5.22 | $ | 5.08 | $ | 4.81 | |||||
The fair value calculations for ESPPs used the following assumptions:
Fiscal year ended January 31, | 2017 | 2016 | 2015 | |||||
Risk-free interest rate | 0.31% - 0.40% | 0.08% - 0.31% | 0.05% - 0.09% | |||||
Dividend yield (range) | 1.0% - 1.2% | 0.8% - 1.2% | 0.8% - 0.9% | |||||
Dividend yield (weighted average) | 1.1 | % | 0.9 | % | 0.8 | % | ||
Expected life (in years) | 0.5 | 0.5 | 0.5 | |||||
Volatility (range) | 36% - 48% | 23% - 36% | 22% - 23% | |||||
Volatility (weighted average) | 41 | % | 25 | % | 22 | % | ||
The following table summarizes stock-based compensation expense included in the results of operations and the tax benefit associated with the exercise of stock options:
Fiscal year ended January 31, | 2017 | 2016 | 2015 | ||||||||
Cost of revenues: | |||||||||||
Service and support | $ | 3,085 | $ | 2,607 | $ | 2,304 | |||||
Operating expense: | |||||||||||
Research and development | 18,205 | 16,207 | 14,027 | ||||||||
Marketing and selling | 12,274 | 9,623 | 9,103 | ||||||||
General and administration | 13,229 | 12,060 | 10,373 | ||||||||
Equity plan-related compensation expense | $ | 46,793 | $ | 40,497 | $ | 35,807 | |||||
Tax effect of the exercise of stock options | $ | 114 | $ | 217 | $ | 280 | |||||
As of January 31, 2017, we had $81,853 in unrecognized compensation cost related to nonvested restricted stock units which is expected to be recognized over a weighted average period of 1.4 years.
65
Employee Savings Plan
We have an employee savings plan (the Savings Plan) that qualifies as a deferred salary arrangement under Section 401(k) of the Internal Revenue Code. Under the Savings Plan, participating U.S. employees may defer a portion of their pretax earnings, up to the Internal Revenue Service annual contribution limit. We currently match 50% of eligible employee’s contributions, up to a maximum of 6% of the employee’s earnings. Employer matching contributions vest over five years, 20% for each year of service completed. Our matching contributions to the Savings Plan were as follows:
Fiscal year ended January 31, | 2017 | 2016 | 2015 | ||||||||
Employer matching contribution | $ | 9,212 | $ | 8,930 | $ | 8,190 | |||||
12. Net Income Per Share
We compute basic net income per share using the weighted average number of common shares outstanding during the period. We compute diluted net income per share using the weighted average number of common shares and potentially dilutive common shares outstanding during the period. Potentially dilutive common shares, using the treasury stock method, consist of common shares issuable upon vesting of restricted stock units, exercise of stock options and ESPP purchase rights, and conversion of the 4.00% Debentures.
The following provides the computation of basic and diluted net income per share:
Fiscal year ended January 31, | 2017 | 2016 | 2015 | ||||||||
Net income attributable to Mentor Graphics shareholders | $ | 154,866 | $ | 96,277 | $ | 147,139 | |||||
Adjustment to redemption value of noncontrolling interest with redemption feature | — | 258 | 121 | ||||||||
Adjusted net income attributable to Mentor Graphics shareholders, basic | 154,866 | 96,535 | 147,260 | ||||||||
Adjustment for convertible debt interest, net of tax to be forfeited upon conversion of 4.00% Debentures | 2,074 | — | — | ||||||||
Adjusted net income attributable to Mentor Graphics shareholders, diluted | $ | 156,940 | $ | 96,535 | $ | 147,260 | |||||
Weighted average common shares used to calculate basic net income per share | 108,795 | 116,701 | 114,635 | ||||||||
Potentially dilutive common shares | 5,527 | 2,562 | 2,443 | ||||||||
Weighted average common and potentially dilutive common shares used to calculate diluted net income per share | 114,322 | 119,263 | 117,078 | ||||||||
Net income per share attributable to Mentor Graphics shareholders: | |||||||||||
Basic net income per share | $ | 1.42 | $ | 0.83 | $ | 1.28 | |||||
Diluted net income per share | $ | 1.37 | $ | 0.81 | $ | 1.26 | |||||
The effect of the conversion of the 4.00% Debentures was dilutive for the twelve months ended January 31, 2017. We assume that the excess of the value of the converted shares over the principal amount of the 4.00% Debentures will be settled in common stock for the purposes of calculating the dilutive effect of net income per share. We have adjusted the numerator of our diluted earnings per share calculation for the forfeited interest, net of tax, resulting from the assumed conversion. We have adjusted the numerator of our basic and diluted net income per share calculation for the twelve months ended January 31, 2016 and January 31, 2015 for the adjustment of the noncontrolling interest with redemption feature to its calculated redemption value, recorded directly to retained earnings.
The effect of the conversion of the 4.00% Debentures was anti-dilutive for the twelve months ended January 31, 2016 and January 31, 2015 and therefore excluded from the computation of diluted net income per share. The conversion feature of the 4.00% Debentures, which allows for settlement in cash or a combination of cash and common stock, is further described in Note 7. “Notes Payable.”
66
The following details adjustments to net income excluded from the computation of diluted net income:
Fiscal year ended January 31, | 2017 | 2016 | 2015 | ||||||||
Adjustment for convertible debt interest, net of tax to be forfeited upon conversion of 4.00% Debentures | $ | — | $ | 2,074 | $ | 2,075 | |||||
The following details shares excluded from the computation of diluted net income:
Fiscal year ended January 31, | 2017 | 2016 | 2015 | |||||
Shares of common stock for restricted stock units | 12 | — | 18 | |||||
Shares of common stock for stock options | — | — | 14 | |||||
Shares of common stock for ESPP purchase rights | — | — | 887 | |||||
Shares of common stock for convertible debt | — | 2,046 | 612 | |||||
Total anti-dilutive shares excluded | 12 | 2,046 | 1,531 | |||||
These restricted stock units, stock options, ESPPs, and convertible debt were determined to be anti-dilutive as a result of applying the treasury stock method.
13. Accumulated Other Comprehensive Loss
The following table summarizes the components of accumulated other comprehensive loss, net of tax effects:
As of January 31, | 2017 | 2016 | |||||
Foreign currency translation adjustment | $ | (25,461 | ) | $ | (21,013 | ) | |
Unrealized loss on derivatives | (20 | ) | (36 | ) | |||
Pension liability | (84 | ) | (51 | ) | |||
Total accumulated other comprehensive loss | $ | (25,565 | ) | $ | (21,100 | ) | |
During the fiscal years of 2017, 2016, and 2015, there were no significant amounts reclassified to net income from accumulated other comprehensive loss related to foreign currency translation adjustments, cash flow hedges or pension plans.
14. Special Charges
The following is a summary of the components of the special charges:
Fiscal year ended January 31, | 2017 | 2016 | 2015 | ||||||||
Employee severance and related costs | $ | 6,791 | $ | 13,496 | $ | 3,535 | |||||
Merger costs | 5,553 | — | — | ||||||||
Litigation costs | 1,465 | 4,118 | 18,408 | ||||||||
Other costs, net | 1,960 | 2,235 | 1,547 | ||||||||
Voluntary early retirement program | — | 25,232 | — | ||||||||
Total special charges | $ | 15,769 | $ | 45,081 | $ | 23,490 | |||||
Special charges generally include expenses incurred related to employee severance, certain litigation costs, mergers and acquisitions, excess facility costs, and asset related charges.
Employee severance and related costs include severance benefits and notice pay. These rebalance charges generally represent the aggregate of numerous unrelated rebalance plans which impact several employee groups, none of which is individually material to our financial position or results of operations. We determine termination benefit amounts based on employee status, years of service, and local statutory requirements. We record the charge for estimated severance benefits in the quarter that the rebalance plan is approved.
Approximately 42% of the employee severance and related costs for fiscal year 2017 were paid during fiscal year 2017. We expect to pay the remainder during fiscal year 2018. Approximately 86% of the employee severance and related costs for fiscal year 2016 were paid during fiscal year 2016. Costs remaining as of January 31, 2016 were paid in fiscal year 2017. Approximately 90% of the employee severance and related costs for fiscal year 2015 were paid during fiscal year 2015. Costs
67
remaining as of January 31, 2015 were paid in fiscal year 2016. There have been no significant modifications to the amount of these charges.
Merger costs for fiscal year 2017 primarily consisted of costs incurred related to advisory fees and legal costs associated with the potential merger with Siemens and Meadowlark Subsidiary Corporation, a wholly-owned subsidiary of Siemens.
Litigation costs consist of professional service fees for services rendered, related to patent litigation involving us, EVE, and Synopsys regarding emulation technology.
We offered the voluntary early retirement program in North America during the three months ended April 30, 2015 in which 110 employees elected to participate. The costs presented here are for severance benefits. All of these costs were paid during the fiscal year ending January 31, 2016.
Accrued special charges are included in accrued and other liabilities and other long-term liabilities in the consolidated balance sheet. The following table shows changes in accrued special charges during the fiscal year ended January 31, 2017:
Accrued special charges as of | Charges during the fiscal year ended | Payments during the fiscal year ended | Accrued special charges as of | |||||||||||||
January 31, 2016 | January 31, 2017 | January 31, 2017 | January 31, 2017 | (1) | ||||||||||||
Employee severance and related costs | $ | 1,935 | $ | 6,791 | $ | (4,587 | ) | $ | 4,139 | |||||||
Merger costs | — | 5,553 | (4,168 | ) | 1,385 | |||||||||||
Litigation costs | 311 | 1,465 | (1,381 | ) | 395 | |||||||||||
Other costs, net | 760 | 1,960 | (2,232 | ) | 488 | |||||||||||
Accrued special charges | $ | 3,006 | $ | 15,769 | $ | (12,368 | ) | $ | 6,407 | |||||||
(1) | The balance of $6,407 represents short-term accrued special charges. |
The following table shows changes in accrued special charges during the fiscal year ended January 31, 2016:
Accrued special charges as of | Charges during the fiscal year ended | Payments during the fiscal year ended | Accrued special charges as of | |||||||||||||
January 31, 2015 | January 31, 2016 | January 31, 2016 | January 31, 2016 | (1) | ||||||||||||
Employee severance and related costs | $ | 370 | $ | 13,496 | $ | (11,931 | ) | $ | 1,935 | |||||||
Litigation costs | 3,406 | 4,118 | (7,213 | ) | 311 | |||||||||||
Other costs, net | 741 | 2,235 | (2,216 | ) | 760 | |||||||||||
Voluntary early retirement program | — | 25,232 | (25,232 | ) | — | |||||||||||
Accrued special charges | $ | 4,517 | $ | 45,081 | $ | (46,592 | ) | $ | 3,006 | |||||||
(1) | The balance of $3,006 represents short-term accrued special charges. |
The following table shows changes in accrued special charges during the fiscal year ended January 31, 2015:
Accrued special charges as of | Charges during the fiscal year ended | Payments during the fiscal year ended | Accrued special charges as of | |||||||||||||
January 31, 2014 | January 31, 2015 | January 31, 2015 | January 31, 2015 | (1) | ||||||||||||
Employee severance and related costs | $ | 1,004 | $ | 3,535 | $ | (4,169 | ) | $ | 370 | |||||||
Litigation costs | 4,855 | 18,408 | (19,857 | ) | 3,406 | |||||||||||
Other costs, net | 1,987 | 1,547 | (2,793 | ) | 741 | |||||||||||
Accrued special charges | $ | 7,846 | $ | 23,490 | $ | (26,819 | ) | $ | 4,517 | |||||||
(1) | Of the $4,517 total accrued special charges as of January 31, 2015, $252 represents the long-term portion, which primarily includes accrued lease termination fees and other facility costs, net of sublease income. The remaining balance of $4,265 represents the short-term portion of accrued special charges. |
68
15. Other Income (Expense), Net
Other income (expense), net was comprised of the following:
Fiscal year ended January 31, | 2017 | 2016 | 2015 | ||||||||
Interest income | $ | 2,777 | $ | 1,870 | $ | 1,723 | |||||
Foreign currency exchange gain (loss) | 729 | 199 | (1,152 | ) | |||||||
Other, net | (1,257 | ) | (457 | ) | (1,348 | ) | |||||
Other income (expense), net | $ | 2,249 | $ | 1,612 | $ | (777 | ) | ||||
16. Supplemental Cash Flow Information
The following provides information concerning supplemental disclosures of cash flow activities:
Fiscal year ended January 31, | 2017 | 2016 | 2015 | ||||||||
Cash paid for: | |||||||||||
Interest | $ | 13,458 | $ | 12,094 | $ | 11,937 | |||||
Income taxes | $ | 17,358 | $ | 15,103 | $ | 11,427 | |||||
17. Segment Reporting
Our Chief Operating Decision Maker (CODM), consisting of the Chief Executive Officer and the President, reviews our consolidated results within one operating segment. In making operating decisions, our CODM primarily considers consolidated financial information accompanied by disaggregated revenue information by geographic region.
We eliminate all intercompany revenues in computing revenues by geographic regions. Revenues related to operations in the geographic areas were:
Fiscal year ended January 31, | 2017 | 2016 | 2015 | ||||||||
Revenues: | |||||||||||
United States | $ | 477,520 | $ | 488,148 | $ | 542,229 | |||||
Europe | 287,371 | 254,827 | 255,943 | ||||||||
Japan | 119,756 | 87,119 | 87,725 | ||||||||
Pacific Rim | 385,189 | 335,833 | 341,474 | ||||||||
Other | 12,631 | 15,061 | 16,762 | ||||||||
Total revenues | $ | 1,282,467 | $ | 1,180,988 | $ | 1,244,133 | |||||
For the fiscal year ended January 31, 2017, revenues from China were $188,641, or 14.7% of total revenues. For the fiscal year ended January 31, 2015, revenues from Korea were $135,696, or 10.9% of total revenues. These revenues are included in the Pacific Rim region in the table above.
For the fiscal years ended January 31, 2017, 2016 and 2015, no single customer accounted for 10% of our total revenues.
Property, plant and equipment, net, related to operations in the geographic areas were:
As of January 31, | 2017 | 2016 | |||||
Property, plant, and equipment, net: | |||||||
United States | $ | 140,756 | $ | 133,432 | |||
Europe | 40,147 | 33,070 | |||||
Japan | 1,959 | 2,220 | |||||
Pacific Rim | 26,984 | 13,191 | |||||
Other | 834 | 179 | |||||
Total property, plant and equipment, net | $ | 210,680 | $ | 182,092 | |||
69
18. Quarterly Financial Information – Unaudited
A summary of quarterly financial information follows:
Quarter ended | April 30 | July 31 | October 31 | January 31 | |||||||||||
Fiscal Year 2017 | |||||||||||||||
Total revenues | $ | 227,639 | $ | 254,344 | $ | 322,516 | $ | 477,968 | |||||||
Gross profit | $ | 184,774 | $ | 204,714 | $ | 271,326 | $ | 427,425 | |||||||
Operating income (loss) | $ | (12,065 | ) | $ | 6,250 | $ | 56,314 | $ | 152,582 | ||||||
Net income (loss) attributable to Mentor Graphics shareholders | $ | (13,436 | ) | $ | 3,437 | $ | 41,762 | $ | 123,103 | ||||||
Net income (loss) per share, basic | $ | (0.12 | ) | $ | 0.03 | $ | 0.38 | $ | 1.12 | ||||||
Net income (loss) per share, diluted | $ | (0.12 | ) | $ | 0.03 | $ | 0.37 | $ | 1.05 | ||||||
Fiscal Year 2016 | |||||||||||||||
Total revenues | $ | 272,143 | $ | 281,062 | $ | 290,516 | $ | 337,267 | |||||||
Gross profit | $ | 223,092 | $ | 234,799 | $ | 243,627 | $ | 289,812 | |||||||
Operating income (loss) | $ | (7,663 | ) | $ | 39,266 | $ | 25,688 | $ | 79,454 | ||||||
Net income (loss) attributable to Mentor Graphics shareholders | $ | (9,885 | ) | $ | 31,212 | $ | 14,679 | $ | 60,271 | ||||||
Net income (loss) per share, basic (1) | $ | (0.08 | ) | $ | 0.27 | $ | 0.13 | $ | 0.52 | ||||||
Net income (loss) per share, diluted (1) | $ | (0.08 | ) | $ | 0.26 | $ | 0.12 | $ | 0.51 | ||||||
(1)We have adjusted the numerator of our basic and diluted earnings per share calculation for the adjustment of the noncontrolling interest with redemption feature to its calculated redemption value, recorded directly to retained earnings, as follows:
Quarter ended | April 30 | July 31 | October 31 | January 31 | |||||||||||
Fiscal Year 2016 | $ | 269 | $ | (144 | ) | $ | 133 | $ | — | ||||||
70
Report of Independent Registered Public Accounting Firm
The Board of Directors and Stockholders
Mentor Graphics Corporation:
We have audited the accompanying consolidated balance sheets of Mentor Graphics Corporation and subsidiaries as of January 31, 2017 and 2016, and the related consolidated statements of income, comprehensive income, stockholders’ equity, and cash flows for each of the years in the three-year period ended January 31, 2017. These consolidated financial statements are the responsibility of the Company’s management. Our responsibility is to express an opinion on these consolidated financial statements based on our audits.
We conducted our audits in accordance with the standards of the Public Company Accounting Oversight Board (United States). Those standards require that we plan and perform the audit to obtain reasonable assurance about whether the financial statements are free of material misstatement. An audit includes examining, on a test basis, evidence supporting the amounts and disclosures in the financial statements. An audit also includes assessing the accounting principles used and significant estimates made by management, as well as evaluating the overall financial statement presentation. We believe that our audits provide a reasonable basis for our opinion.
In our opinion, the consolidated financial statements referred to above present fairly, in all material respects, the financial position of Mentor Graphics Corporation and subsidiaries as of January 31, 2017 and 2016, and the results of their operations and their cash flows for each of the years in the three-year period ended January 31, 2017, in conformity with U.S. generally accepted accounting principles.
As discussed in Note 3 to the consolidated financial statements, the Company changed its method of accounting for share-based payments due to the adoption of FASB Accounting Standards Update (ASU) 2016-09, Compensation - Stock Compensation (Topic 718), Improvements to Employee Share-Based Payment Accounting.
We also have audited, in accordance with the standards of the Public Company Accounting Oversight Board (United States), Mentor Graphics Corporation’s internal control over financial reporting as of January 31, 2017, based on criteria established in Internal Control – Integrated Framework (2013) issued by the Committee of Sponsoring Organizations of the Treadway Commission (COSO), and our report dated March 17, 2017 expressed an unqualified opinion on the effectiveness of the Company’s internal control over financial reporting.
(signed) KPMG LLP
Portland, Oregon
March 17, 2017
71
Item 9. Changes in and Disagreements With Accountants on Accounting and Financial Disclosure.
None.
Item 9A. Controls and Procedures.
MANAGEMENT'S REPORT ON INTERNAL CONTROL OVER FINANCIAL REPORTING
Our management is responsible for establishing and maintaining adequate internal control over financial reporting as defined in Rules 13a-15(f) and 15d-15(f) under the Securities Exchange Act of 1934, as amended (the Exchange Act). Our internal control over financial reporting is designed to provide reasonable assurance regarding the reliability of financial reporting and the preparation of financial statements for external purposes in accordance with United States generally accepted accounting principles.
Because of its inherent limitations, internal control over financial reporting may not prevent or detect misstatements. Also, projections of any evaluation of effectiveness to future periods are subject to the risk that controls may become inadequate because of changes in conditions, or that the degree of compliance with the policies or procedures may deteriorate.
Management assessed the effectiveness of our internal control over financial reporting as of January 31, 2017, and has concluded that our internal control over financial reporting was effective. In making its assessment of internal control over financial reporting, management used the criteria established in Internal Control – Integrated Framework (2013) issued by the Committee of Sponsoring Organizations of the Treadway Commission.
Our independent registered public accounting firm, KPMG LLP, has audited our internal control over financial reporting as of January 31, 2017, as stated in their report included in this Annual Report on Form 10-K.
REPORT OF INDEPENDENT REGISTERED PUBLIC ACCOUNTING FIRM
The Board of Directors and Stockholders
Mentor Graphics Corporation:
We have audited Mentor Graphics Corporation’s internal control over financial reporting as of January 31, 2017, based on criteria established in Internal Control – Integrated Framework (2013) issued by the Committee of Sponsoring Organizations of the Treadway Commission (COSO). Mentor Graphics Corporation’s management is responsible for maintaining effective internal control over financial reporting and for its assessment of the effectiveness of internal control over financial reporting, included in the accompanying Management's Report on Internal Control Over Financial Reporting. Our responsibility is to express an opinion on the Company’s internal control over financial reporting based on our audit.
We conducted our audit in accordance with the standards of the Public Company Accounting Oversight Board (United States). Those standards require that we plan and perform the audit to obtain reasonable assurance about whether effective internal control over financial reporting was maintained in all material respects. Our audit included obtaining an understanding of internal control over financial reporting, assessing the risk that a material weakness exists, and testing and evaluating the design and operating effectiveness of internal control based on the assessed risk. Our audit also included performing such other procedures as we considered necessary in the circumstances. We believe that our audit provides a reasonable basis for our opinion.
A company’s internal control over financial reporting is a process designed to provide reasonable assurance regarding the reliability of financial reporting and the preparation of financial statements for external purposes in accordance with generally accepted accounting principles. A company’s internal control over financial reporting includes those policies and procedures that (1) pertain to the maintenance of records that, in reasonable detail, accurately and fairly reflect the transactions and dispositions of the assets of the company; (2) provide reasonable assurance that transactions are recorded as necessary to permit preparation of financial statements in accordance with generally accepted accounting principles, and that receipts and expenditures of the company are being made only in accordance with authorizations of management and directors of the company; and (3) provide reasonable assurance regarding prevention or timely detection of unauthorized acquisition, use, or disposition of the company’s assets that could have a material effect on the financial statements.
Because of its inherent limitations, internal control over financial reporting may not prevent or detect misstatements. Also, projections of any evaluation of effectiveness to future periods are subject to the risk that controls may become inadequate because of changes in conditions, or that the degree of compliance with the policies or procedures may deteriorate.
72
In our opinion, Mentor Graphics Corporation maintained, in all material respects, effective internal control over financial reporting as of January 31, 2017, based on criteria established in Internal Control – Integrated Framework (2013) issued by the Committee of Sponsoring Organizations of the Treadway Commission (COSO).
We also have audited, in accordance with the standards of the Public Company Accounting Oversight Board (United States), the consolidated balance sheets of Mentor Graphics Corporation and subsidiaries as of January 31, 2017 and 2016, and the related consolidated statements of income, comprehensive income, stockholders’ equity, and cash flows for each of the years in the three-year period ended January 31, 2017, and our report dated March 17, 2017 expressed an unqualified opinion on those consolidated financial statements.
(signed) KPMG LLP
Portland, Oregon
March 17, 2017
CHANGES IN INTERNAL CONTROL OVER FINANCIAL REPORTING
There has been no change in our internal control over financial reporting that occurred during the last fiscal quarter that has materially affected, or is reasonably likely to materially affect, our internal control over financial reporting.
EVALUATION OF DISCLOSURE CONTROLS AND PROCEDURES
We maintain disclosure controls and procedures, as defined by Exchange Act Rules 13a–15(e) and 15d-15(e), that are designed to ensure that information required to be disclosed in our Exchange Act reports is recorded, processed, summarized, and reported within the time periods specified in the Securities and Exchange Commission’s rules and forms, and that such information is accumulated and communicated to our management, including our Chief Executive Officer and Chief Financial Officer, as appropriate, to allow timely decisions regarding required disclosure. In designing and evaluating the disclosure controls and procedures, management recognized that any controls and procedures, no matter how well designed and operated, can provide only reasonable assurance of achieving the desired control objectives, and management necessarily was required to apply its judgment in evaluating the cost-benefit relationship of possible controls and procedures.
We carried out an evaluation, under the supervision and with the participation of our management, including our Chief Executive Officer and our Chief Financial Officer, of the effectiveness of the design and operation of our disclosure controls and procedures as of the end of the period covered by this report. Based on the foregoing, our Chief Executive Officer and Chief Financial Officer concluded that our disclosure controls and procedures were effective at the reasonable assurance level as of the end of the period covered by this report.
Item 9B. Other Information.
None.
73
Part III
Item 10. Directors, Executive Officers, and Corporate Governance.
DIRECTORS OF THE REGISTRANT
Name | Age | Director Since |
Keith L. Barnes | 65 | 2012 |
Sir Peter L. Bonfield | 72 | 2002 |
Paul A. Mascarenas, OBE | 55 | 2015 |
J. Daniel McCranie | 73 | 2012 |
Dr. Walden C. Rhines | 70 | 1993 |
Dr. Cheryl L. Shavers | 63 | 2016 |
Jeffrey M. Stafeil | 47 | 2014 |
Business Experience and Qualifications of Directors
Dr. Walden C. Rhines
Dr. Rhines has been Chairman of the Board and Chief Executive Officer of the Company since 2000, and was President and Chief Executive Officer of the Company from 1993 to 2000. He is currently a director of Qorvo, Inc. (a manufacturer of semiconductors) and GlobalLogic (a private company), served as a director of Cirrus Logic, Inc. (a manufacturer of semiconductors) from 1995 to 2009 and TriQuint Semiconductor (a manufacturer of semiconductors) from 1995 until its merger with RFMD to form Qorvo in 2015. Dr. Rhines is currently a board member of the Electronic Design Automation Consortium and has served five two-year terms as chair. He is also a board member of the Semiconductor Research Corporation. He has previously served as chair of the Semiconductor Technical Advisory Committee of the Department of Commerce, and as a member of the boards of directors of the Computer and Business Equipment Manufacturers’ Association (CBEMA), SEMI-Sematech/SISA (a semiconductor equipment suppliers board), University of Michigan National Advisory Council, Lewis and Clark College and SEMATECH. Prior to joining Mentor, Dr. Rhines was Executive Vice President, Semiconductor Group of Texas Instruments Incorporated from 1987 to 1993. During a 21-year career at Texas Instruments, he held numerous executive and management positions. He is co-inventor of a patented invention that is fundamental to solid state lighting and DVDs.
Dr. Rhines was chosen to serve as a director because he is our CEO, has extensive executive management experience, and has deep and broad knowledge of the semiconductor and electronics design industries.
Keith L. Barnes
Mr. Barnes has been self-employed as a private investor since June 2011. From 2006 through December 2010, Mr. Barnes served as member of the Board of Directors and President and Chief Executive Officer of Verigy Ltd. (a provider of advanced semiconductor test solutions). He continued to serve as Verigy’s Chairman of the Board until its acquisition in June 2011 by Advantest. From 2003 through 2006, Mr. Barnes was Chairman and Chief Executive Officer of Electroglas, Inc. (an integrated circuit probe manufacturer) located in San Jose, California. From August 2002 to October 2003, Mr. Barnes was Vice Chairman of the Board of Directors of Oregon Growth Account and a management consultant. He served as Chief Executive Officer of Integrated Measurement Systems, Inc. (IMS) (a manufacturer of engineering test stations and test software) from 1995 until 2001, and as Chairman of the Board of Directors of IMS from 1998 through 2001 when it was acquired by Credence Systems Corporation. Prior to becoming CEO of IMS, Mr. Barnes was a Division President at Valid Logic Systems and later Cadence Design Systems. Mr. Barnes currently serves on the Board of Directors of Viavi (a provider of network application solutions), Knowles Corporation (a supplier of advanced micro-acoustic, specialty components and human interface solutions) and Rogers Corporation (a provider of power electronics solutions and high-frequency printed circuit materials). Mr. Barnes previously served on the Board of Directors of JDS Uniphase (a provider of communications test and measurement solutions and optical products), Spansion, Inc. (a semiconductor manufacturer) and Intermec, Inc. (a provider of integrated system solutions).
Mr. Barnes was chosen to serve as a director because he has extensive CEO experience, and has deep and broad knowledge of the electronic design automation and semiconductor related industries.
Sir Peter Bonfield
Sir Peter Bonfield has been a self-employed international business advisor since 2002 and has been Chairman of NXP Semiconductor N.V. (a semiconductor company) since 2006. He served as Chairman of the Executive Committee and Chief
74
Executive Officer of British Telecommunications PLC (a provider of telecom services) from 1996 to 2002 and before that served as Chairman and Chief Executive Officer of ICL plc (a UK-based information technology company). He is currently a director of Taiwan Semiconductor Manufacturing Company Ltd. (a manufacturer of semiconductors) and Chairman of GlobalLogic (a private company). Sir Peter is Chair of Council and Senior Pro-Chancellor for Loughborough University in the United Kingdom and is a Board Director for the EastWest Institute (a non-governmental organization working to reduce international conflict) located in the United States. He is a member of the advisory boards of the Longreach Group and an advisor in London to AlixPartners (a global business advisory firm) and G3 Group (a web design and marketing company). He also serves as a board mentor to CMi (a mentoring organization for top executives). Until April 2015, Sir Peter served as a director of Telefonak-tiebolaget LM Ericsson (a telecommunications equipment manufacturer). He previously served as a senior independent director of AstraZeneca PLC (a pharmaceuticals company) and from 2005 to 2014 served as a director of Sony Corporation (a worldwide provider of electronic equipment, instruments, software and devices for consumer electrical and industrial markets). He has received numerous honors for his contributions to business, including a knighthood, and is a fellow of the Royal Academy of Engineering.
Sir Peter Bonfield was chosen to serve as a director because he has extensive international business and CEO experience.
Paul A. Mascarenas OBE
Mr. Mascarenas served as the Chief Technical Officer and Vice President of Research and Advanced Engineering at Ford Motor Co. from January 1, 2011 to September 30, 2014, where he oversaw Ford’s worldwide research organization as well as the development and implementation of the company’s technology strategy and plans. From 2007 to 2010, Mr. Mascarenas served as Ford’s Vice President of Engineering, and from 2005 to 2007, he served as Vice President of North American Vehicle Programs. During his tenure with Ford, which began in 1982, Mr. Mascarenas held various development and engineering positions in both the U.S. and Europe. Mr. Mascarenas holds a mechanical engineering degree from the University of London, King’s College in the United Kingdom as well as an honorary doctorate degree from Chongqing University in China. He currently serves as a director of ON Semiconductor Corporation (a supplier of semiconductors) and United States Steel Corporation (an integrated steel producer) and as the President of FISITA - The International Federation of Automotive Engineering Societies. In January 2015, he was appointed an OBE by Her Majesty, Queen Elizabeth II, for his services to the automotive industry.
Mr. Mascarenas was chosen to serve as a director because he has extensive management experience, strong automotive experience and deep knowledge of mechanical and electrical automotive technologies.
J. Daniel McCranie
Mr. McCranie is a self-employed private investor. From January 2014 to April 2015, Mr. McCranie was the Executive Vice President of Sales and Applications for Cypress Semiconductor Corporation (a supplier of semiconductors). Mr. McCranie has served as Chairman of the Board for ON Semiconductor Corporation (a supplier of semiconductors) since August 2002 and as a Director for ON Semiconductor Corporation since November 2001. Mr. McCranie served on the board of directors of Cypress Semiconductor Corporation from October 2006 to May 2014. From October 2008 to September 2010, Mr. McCranie served as Executive Chairman of Virage Logic (a provider of semiconductor intellectual property). Previously, Mr. McCranie served at Virage Logic as President and Chief Executive Officer from January 2007 to October 2008, Executive Chairman from March 2006 to January 2007, and Chairman of the Board of Directors from August 2003 to March 2006. From 1993 until 2001, Mr. McCranie was employed in various positions, including as Executive Vice President, Marketing and Sales, with Cypress Semiconductor Corporation. From 1986 to 1993, Mr. McCranie was President, Chief Executive Officer and Chairman of SEEQ Technology, Inc. (a manufacturer of semiconductor devices). Within the last five years, Mr. McCranie also served on the board of directors of Actel Corporation (a designer and provider of field programmable gate arrays and programmable system chips) and as Chairman of the Board for Freescale Semiconductor Holdings I, Ltd. (a semiconductor manufacturer).
Mr. McCranie was chosen to serve as a director because of his nearly 40 years of sales and marketing experience in the semiconductor and communications industries, including management experience as CEO of two publicly held semiconductor companies.
Dr. Cheryl L. Shavers
Dr. Shavers currently serves as Chief Executive Officer of Global Smarts, Inc., an advisory services and strategy firm, which she founded in 2001. Dr. Shavers is a director of Rockwell Collins, Inc. (a communications and avionics company), serving on the company’s Nominating and Governance Committee, and chairing its Technology/Cybersecurity Committee. She served on the board of ATMI, a semiconductor materials company acquired by Entegris and on the Advisory Board for E.W. Scripps Company. Formerly she was the Under Secretary of Commerce for Technology for the United States Department of Commerce
75
from November 1999 to February 2001 after having served as its Under Secretary Designate from April 1999 to November 1999. She served as Sector Manager, Microprocessor Products Group for Intel Corporation prior to April 1999. She served as Non-Executive Chairman of BitArts Ltd. from 2001 to December 2003. Additionally, she is a Distinguished Dean’s Professor at the Leavey School of Business at Santa Clara University. Dr. Shavers holds a B.S. degree in Chemistry, a Ph.D. in Solid State Chemistry and an Honorary Master’s degree in Engineering Management from California Polytechnic State University. She is also a practicing registered Patent Agent with the Patent & Trademark Office of the Department of Commerce.
Dr. Shavers was chosen to serve as a director because she is a highly regarded technical and business expert on issues of technology, business and policy.
Jeffrey M. Stafeil
Mr. Stafeil has been Executive Vice President and Chief Financial Officer of Adient, an automotive parts supplier since April 2016. From 2012 to March 2016, Mr. Stafeil was Executive Vice President and Chief Financial Officer of Visteon Corporation, a global supplier of automotive components. He joined Visteon Corporation from DURA Automotive Systems, an automotive supplier, where he had been Chief Executive Officer since October 2010, after serving as Executive Vice President and Chief Financial Officer since 2008. Since 2014, Mr. Stafeil has been a director and Audit Committee Chairman of Metaldyne Performance Group, Inc., a vehicle component manufacturer. From 2007-2008, Mr. Stafeil was Chief Financial Officer and a member of the board at the Klöckner Pentaplast Group, based in Germany. Before that, he was Executive Vice President and Chief Financial Officer at Metaldyne Corp., an automotive supplier. From 2009-2012, he served on the Board of Directors and was Audit Committee Chairman of J.L. French Automotive Castings Inc. From 2006-2009, he served on the Board of Directors and was co-chairman of the Audit Committee for Meridian Automotive Systems. He also has served in management positions at Booz Allen and Hamilton, Peterson Consulting and Ernst and Young.
Mr. Stafeil was chosen to serve as a director because he has strong financial credentials and broad automotive industry experience.
EXECUTIVE OFFICERS OF THE REGISTRANT
The following are the executive officers of Mentor Graphics Corporation:
Name | Position | Age | |
Walden C. Rhines | Chairman of the Board and Chief Executive Officer | 70 | |
Gregory K. Hinckley | President and Chief Financial Officer | 70 | |
Michael Ellow | Senior Vice President, World Trade | 53 | |
Brian Derrick | Vice President, Corporate Marketing | 53 | |
Richard P. Trebing | Vice President, Finance and Chief Accounting Officer | 61 | |
Dean Freed | Vice President, General Counsel, and Secretary | 58 | |
The executive officers are elected by our Board of Directors annually. Officers hold their positions until they resign, are terminated, or their successors are elected. There are no arrangements or understandings between the officers or any other person pursuant to which officers were elected. There are no family relationships among any of our executive officers or directors.
Dr. Rhines has served as our Chairman of the Board and Chief Executive Officer since 2000. Dr. Rhines served as our Director, President, and Chief Executive Officer from 1993 to 2000. Dr. Rhines is currently a director of Qorvo, Inc., a semiconductor manufacturer, and GlobalLogic Inc., a privately held software development services company.
Mr. Hinckley has been President and Chief Operating Officer of the Company since 2000, and was Executive Vice President, Chief Operating Officer and Chief Financial Officer of the Company from 1997 to 2000. He continued to function as the Company's Chief Financial Officer from 2000 to July 2007, and again became Chief Financial Officer in December 2008. He also served as a Director from 2000 to 2016. His primary responsibilities include the operations aspect of our corporate centers, sales, and research and development divisions. Mr. Hinckley is a director of SI-Bone, Inc., a privately held medical device company. Mr. Hinckley served as a director of Super Micro Computer, Inc., a server board, chassis, and server systems supplier from 2009 to 2015 and as a director of Intermec, Inc., a provider of integrated systems solutions from 2004 to 2013.
Mr. Ellow joined Mentor Graphics in March 2014 with our acquisition of Berkeley Design Automation, where he had been Vice President of Global Sales since September 2011. He was promoted to the position of Senior Vice President, World Trade,
76
in August 2014. From 1997 to 2010 he held various management positions at Cadence Design Systems overseeing sales in North America, Europe and India, including the position of Corporate Vice President, North American Sales.
Mr. Derrick has served as our Vice President, Corporate Marketing since 2002. From 2000 to 2001, he was Vice President and General Manager of our Physical Verification Division.
Mr. Trebing was promoted to the position of Vice President of Finance in September 2015 and has served as our Chief Accounting Officer since December 2011. He previously served as our Corporate Controller from 2011 to 2015 and Director of Finance for Operations from 1999 to 2011.
Mr. Freed has served as our Vice President, General Counsel, and Secretary since 1995.
SECTION 16(a) BENEFICIAL OWNERSHIP REPORTING COMPLIANCE
Section 16(a) of the Securities Exchange Act of 1934 requires the Company’s executive officers, directors and persons who own more than 10% of the Common Stock to file reports of ownership and changes in ownership with the Securities and Exchange Commission (the SEC). Executive officers, directors and beneficial owners of more than 10% of the Common Stock are required by SEC regulation to furnish the Company with copies of all Section 16(a) forms they file. Based solely on a review of the copies of such forms received by the Company and on written representations from certain reporting persons that they have complied with the relevant filing requirements, the Company believes that all Section 16(a) filing requirements applicable to its executive officers and directors were complied with in fiscal year 2017.
ETHICS POLICY
The Company has a code of conduct, which is referred to as our Standards of Business Conduct. All employees including executives and officers of the Company are to perform their work guided by the Company’s Standards of Business Conduct. The Standards of Business Conduct set forth worldwide standards of conduct for the Company’s business environment that include compliance with laws and contractual requirements, avoiding conflicts of interest, integrity in financial reporting, conducting business in an honest and ethical manner and otherwise acting with integrity and in the Company’s best interest. The Chair of the Audit Committee of the Board of Directors and the Company’s General Counsel are the Company’s Compliance Officers for the Standards of Business Conduct and employees are encouraged to ask questions or bring potential violations to the attention of either of the Compliance Officers. The Company has a “no retaliation” policy for employees who conscientiously and thoughtfully report possible illegal or unethical situations to the Compliance Officers.
The Company also has a Director Code of Ethics. This Code of Ethics is intended to promote honest and ethical conduct, full and accurate reporting and compliance with laws by the Company’s directors. Copies of the Company’s Standards of Business Conduct and Code of Ethics are posted on the Company’s website at www.mentor.com/company/investor_relations/charters_ethics. Disclosures regarding amendments to the Standards of Business Conduct and the Code of Ethics will also be provided on the Company’s website.
AUDIT COMMITTEE
The Audit Committee consists of Directors Stafeil, Shavers and Mascarenas. The Board of Directors has determined that Director Stafeil is an “audit committee financial expert” as defined in regulations adopted by the SEC.
Item 11. Executive Compensation.
COMPENSATION DISCUSSION AND ANALYSIS
The Compensation Committee
The Compensation Committee of the Board of Directors consists of at least three directors, each of whom is independent under applicable NASDAQ rules. Currently, the Compensation Committee is comprised of Directors Barnes, Bonfield and McCranie. Director McCranie currently serves as the chair of the Compensation Committee. The Compensation Committee operates pursuant to a written charter, which is available on our website at http://www.mentor.com/company/ investor_relations/charters_ethics.
Pursuant to its charter, the Compensation Committee assists the Board in the design, administration and oversight of employee compensation programs and benefit plans. The Compensation Committee has full authority to determine annual base and incentive compensation, equity incentives, benefit plans, perquisites and all other compensation for the executive officers. The Compensation Committee cannot delegate this authority. The Chief Executive Officer and the President and Chief Financial Officer provide recommendations to the Compensation Committee about compensation levels for the executive officers who
77
report to them. The Chief Executive Officer and the President and Chief Financial Officer do not make recommendations, and are not present during deliberations or voting, regarding their own compensation. The Compensation Committee also approves all equity grants to officers and any director-level exception equity grants, and reviews all equity grants to other employees.
During fiscal year 2017, the Compensation Committee continued to retain Exequity LLP as its independent advisor on compensation matters (the “Consultant”). The Consultant’s principal role is to provide independent advice to the Compensation Committee on all matters related to executive officer, director and employee compensation and benefit programs. The Consultant reports directly to the chair of the Compensation Committee who directs the Consultant’s work. During fiscal year 2017, the Consultant reviewed all materials provided by management to the Compensation Committee and participated in all of the meetings of the Compensation Committee, including executive sessions without management present, providing independent advice to the Committee on the matters under consideration. The Compensation Committee conducted a conflicts of interest assessment of the Consultant in December 2016 and no conflict of interest was identified.
Elements and Objectives of our Compensation Program
The elements of our compensation program for executive officers in fiscal year 2017 included:
• | Base salaries |
• | Annual performance-based compensation pursuant to a variable incentive pay (VIP) plan |
• | Equity incentive awards - time-based and performance-based restricted stock units |
• | 401(k) matching contributions |
• | Severance benefits, including change in control benefits |
The executive officers named in the compensation tables of this Item (the “Named Executive Officers”) are:
• | Dr. Walden C. Rhines, Chairman of the Board and Chief Executive Officer |
• | Gregory K. Hinckley, President and Chief Financial Officer |
• | Brian M. Derrick, Vice President, Corporate Marketing |
• | Michael F. Ellow, Senior Vice President, World Trade |
• | Dean M. Freed, Vice President, General Counsel and Secretary |
Executive Summary
The following is a brief overview of significant aspects of our executive compensation program in fiscal year 2017 that are discussed in more detail in the balance of this Compensation Discussion and Analysis:
• | Base salaries for Dr. Rhines and Mr. Hinckley were maintained at prior levels and for all other Named Executive Officers were increased by about 3% in the annual salary review effective August 1, 2016. |
• | Strong financial performance in fiscal year 2017, as measured by adjusted operating income that increased by 11% over the prior fiscal year, resulted in payouts of 127% of target incentive amounts to the Named Executive Officers under our annual variable incentive pay plan for the fiscal year. |
• | Equity incentives were granted in September 2016 with long-term incentive values that increased over the prior fiscal year for Mr. Ellow and that were maintained at prior levels for all other Named Executive Officers. Long-term incentive values were allocated 50/50 between performance-based restricted stock unit and time-based restricted stock unit awards. |
• | Our Officer Stock Ownership Policy aligns the interests of our executive officers with the interests of our shareholders by requiring officers to accumulate and maintain ownership of our common stock equal to a 3x or 1x multiple of their base salaries. |
• | Our policy for recovery of incentive compensation, or “clawback policy,” allows the Board of Directors to recover incentive compensation from an executive officer who is involved in wrongful conduct that results in a restatement of our financial statements. |
• | Our severance agreements with executive officers do not include a tax gross-up provision. |
• | We conducted a detailed compensation risk assessment and concluded that the risks arising from our compensation policies and practices are not reasonably likely to have a material adverse effect on us. |
78
Pay for Performance
The following graph illustrates how the average annual incentive cash payments to Named Executive Officers under our VIP plan have varied based on our performance as measured by adjusted operating income. See “Annual Variable Incentive Pay Plan Compensation” below for a description of adjusted operating income and additional details regarding our VIP plan.
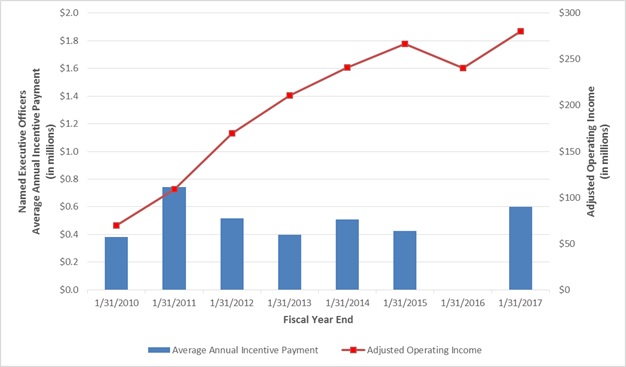
Philosophy
Our executive compensation philosophy is to promote the achievement of Company performance objectives, ensure that executives’ interests are aligned with shareholders’ interests in our success, provide compensation opportunities that will attract, retain, and motivate superior executive personnel, and compensate executives in line with the practices of comparable high technology industry companies. Also, our philosophy is that the compensation and equity incentives of each executive should be significantly influenced by the executive’s individual performance and experience. We seek to achieve these objectives by providing a total compensation approach that includes base salary, variable pay based on the annual performance of the Company, and equity incentive awards consisting of time-based and performance-based restricted stock units.
79
Use of Market Benchmark Data
We annually obtain market data on executive compensation from the Radford Executive Survey and the Compensation Committee generally uses this data to help establish base salaries, equity award levels, and VIP plan target incentive compensation levels. The peer group of companies for which this data has been obtained consists of selected publicly traded software and technology companies with annual revenues ranging from about one-half to about two times our annual revenues and with median annual revenues close to our annual revenues. The Compensation Committee reviewed the peer group in fiscal year 2017 with the advice of the Consultant. Two companies were eliminated from the peer group used in fiscal year 2016 due to the merger or acquisition of those companies. Accordingly, in fiscal year 2017, the peer group consisted of the following companies:
ANSYS, Inc. | Microchip Technology, Inc. |
Autodesk, Inc. | Microsemi Corporation |
AVX Corporation | National Instruments Corporation |
Cadence Design Systems, Inc. | Nuance Communications, Inc. |
Coherent, Inc. | PTC, Inc. |
Cypress Semiconductor Corporation | Synopsys, Inc. |
FEI Company | Teradyne, Inc. |
Finisar Corporation | Trimble Navigation Limited |
FLIR Systems, Inc. | Verint Systems, Inc. |
Linear Technology Corporation | |
The Chief Human Resources Officer and the Consultant analyze the peer group data and are responsible for developing recommendations regarding compensation adjustments, and communicating those recommendations to the Chief Executive Officer, the President and Chief Financial Officer and the Compensation Committee.
80
In fiscal year 2017, we also obtained market data from the Radford Executive Survey for a larger survey group consisting of public technology companies that were participants in the Radford Executive Survey and that had annual revenues ranging from $600 million to $2.4 billion and median annual revenues of about $1.2 billion. This additional data has been provided to give additional reference points for the Compensation Committee’s deliberations, particularly for positions without good matches in the peer group data. The 126 companies in the survey group considered in fiscal year 2017 are as follows:
ACI Worldwide, Inc. | FEI Company | Orbitz Worldwide, Inc. |
Acxiom Corporation | Finisar Corporation | OSI Systems, Inc. |
Adtran, Inc. | FLIR Systems, Inc. | Outerwall Inc. |
Akamai Technologies, Inc. | Fortinet, Inc. | Palo Alto Networks, Inc. |
Allscripts Healthcare Solutions, Inc. | Gartner, Inc. | Pandora Media, Inc. |
Altera Corporation | GoPro, Inc. | Plantronics, Inc. |
ANSYS, Inc. | Green Dot Corporation | Plexus Corp. |
Aruba Networks, Inc. | Hexcel Corporation | Polycom, Inc. |
athenahealth, Inc. | Huron Consulting Group, Inc. | PTC, Inc. |
Atmel Corporation | ICF International, Inc. | Qorvo, Inc. |
Blackhawk Network Holdings, Inc. | IHS, Inc. | Rackspace Hosting, Inc. |
Brocade Communications Systems, Inc. | II-VI Incorporated | Red Hat, Inc. |
Bruker Corporation | Imation (GlassBridge Enterprises, Inc.) | Scientific Games Corporation |
Cadence Design Systems, Inc. | Infinera Corporation | ServiceNow, Inc. |
CBOE Holdings, Inc. | Informatica Corporation | Shutterfly, Inc. |
CDK Global, Inc. | International Game Technology | Silicon Laboratories Inc. |
Choice Hotels International, Inc. | IPG Photonics Corporation | Skyworks Solutions, Inc. |
CIBER, Inc. | ISO (Verisk Analytics, Inc.) | Starz, LLC |
Ciena Corporation | Itron, Inc. | SunEdison Semiconductor Limited |
Cincinnati Bell, Inc. | Jack Henry & Associates, Inc. | Super Micro Computer, Inc. |
Cirrus Logic, Inc. | Knowles Corporation | Synaptics Incorporated |
Coherent, Inc. | Laird Technologies, Inc. | Synopsys, Inc. |
Corelogic, Inc. | Linear Technology Corporation | Take-Two Interactive Software, Inc. |
Cree, Inc. | LinkedIn Corporation | Teradyne, Inc. |
CSG International | Littelfuse, Inc. | TIBCO Software, Inc. |
Cubic Corporation | ManTech International Corporation | Tribune Media Company |
Curtiss-Wright Corporation | Maxim Integrated Products, Inc | Trimble Inc. |
Datalink Corporation | MedAssets, Inc | TripAdvisor LLC |
Dealertrack Technologies, Inc. | Microchip Technology Incorporated | Total Systems Services, Inc. |
DigitalGlobe, Inc. | Microsemi Corporation | TTM Technologies, Inc |
Diodes Incorporated | MKS Instruments, Inc | Twitter, Inc. |
Dolby Laboratories, Inc. | MoneyGram International, Inc. | Verifone Holdings, Inc. |
DreamWorks Animation, LLC | Monster Worldwide Inc. | Verint Systems Inc. |
Earthlink Holdings Corp. | Morningstar, Inc. | VeriSign, Inc. |
Eastman Kodak Company | Mueller Water Products, Inc. | ViaSat, Inc. |
Electronics for Imaging, Inc. | Multi-Fineline Electronix, Inc. | Viavi Solutions, Inc. |
Endurance International Group Holdings, Inc. | National Instruments Corporation | Vonage Holdings Corp. |
Entegris, Inc. | NetGear, Inc. | WEX Inc. |
Esterline Technologies Corporation | NeuStar, Inc. | Workday, Inc. |
F5 Networks, Inc. | Newport Corporation | Xilinx, Inc. |
Fair Isaac Corporation | Nuance Communications, Inc. | Zebra Technologies Corporation |
Fairchild Semiconductor International, Inc. | OmniVision Technologies, Inc. | Zynga Inc. |
Consideration of Say-on-Pay Vote Results
The non-binding advisory resolution regarding compensation of the Named Executive Officers submitted to shareholders at our 2016 Annual Meeting was approved by over 97% of the votes cast. The Compensation Committee considered this favorable vote of the shareholders as an endorsement of our compensation program, and therefore has neither made, nor intends to make, any changes to our compensation program in response to that vote.
Base Salaries
Base salaries paid to executives are intended to provide competitive fixed pay and allow us to attract and retain highly talented individuals. The Compensation Committee’s general guideline when determining base salaries for executive officers is to utilize the 50th percentile of the market data, considering the peer group data and the survey group data, as appropriate. In setting and periodically adjusting base salaries, the Compensation Committee also considers Company performance, individual performance, unique job components and individual experience and skill sets.
The Compensation Committee generally reviews all executive salaries on an annual basis, with salary adjustments becoming effective on August 1 of each year. In the fiscal year 2017 salary review, the Compensation Committee maintained the salaries of Dr. Rhines and Mr. Hinckley at their 2016 levels and approved salary increases of about 3.0% for the other three Named
81
Executive Officers, consistent with the average company-wide merit increase. The Compensation Committee decided to maintain the base salaries of Dr. Rhines and Mr. Hinckley at prior levels as their salaries were already above the 50th percentile of the market data and in light of the Company’s relatively weak performance in the prior fiscal year. The Compensation Committee continues to believe that the level of responsibilities fulfilled by Mr. Hinckley in his role as our President, Chief Operating Officer and Chief Financial Officer substantially exceed those of a typical President. Accordingly, the Compensation Committee has not relied on market data for him, but instead sets his salary in relation to Dr. Rhines’ salary, maintaining it at about 80% of Dr. Rhines’ salary since 2003.
Annual Variable Incentive Pay Plan Compensation
The Compensation Committee approves annual performance-based compensation through a VIP plan. The purposes of the annual performance-based compensation are to motivate executive officers to produce higher levels of Company performance, allow them to share in our success, and contribute to a competitive total compensation package. Target incentive pay, expressed as a percentage of base salary paid during the year, is established for each executive based on peer group market practices, internal relationship to other executives and individual impact. The Compensation Committee generally reviews these target percentages annually as part of the annual salary review process conducted in the first quarter of each fiscal year. In fiscal year 2017, the Compensation Committee reviewed incentive pay percentages and made no adjustments to target incentive pay for any of the Named Executive Officers.
The Named Executive Officers other than Mr. Ellow participate in a VIP plan, which in fiscal year 2017 was based 100% on the Company’s overall performance as measured by adjusted operating income. For fiscal year 2017 VIP plan purposes, operating income was adjusted to eliminate special charges, stock-based compensation expense, amortization of intangible assets, impairments, accounting changes, and impacts of unplanned acquisitions and dispositions during the year. The goals for adjusted operating income were $235.8 million for a 20% threshold payout, $243.1 million for a 50% payout and $267.4 million for a 100% target payout. The 100% target payout level represented an increase of 11% over fiscal year 2016 adjusted operating income and was 10% higher than the level corresponding to the non-GAAP earnings per share guidance we provided in February 2016. The payout formula provided that 5% of participants’ target incentive compensation would be paid for each $2.4 million of adjusted operating income over the target payout level of $267.4 million. The maximum payout was limited by the VIP plan limitation of $5 million per person. In fiscal year 2017, we achieved adjusted operating income of $280.4 million, which generated a 127% payout.
In fiscal year 2017, Mr. Ellow participated in a VIP plan for senior sales executives based 100% on the Company’s overall performance as measured by adjusted product bookings and adjusted operating income. Mr. Ellow was separated from the corporate-level VIP plan to provide him an incentive more focused on product revenues, which he can directly affect as the worldwide leader of our sales efforts. For VIP plan purposes, adjusted product bookings consist of the dollar amount of systems and software orders and professional services and training orders executed during the fiscal year for which revenues have been recognized or will be recognized within six months for software and emulation hardware and within twelve months for professional services and training, as adjusted to eliminate impacts of dispositions during the year. The overall target incentive compensation payout percentage up to the 100% target level was based 50% on the adjusted product bookings component and 50% on the adjusted operating income component, but any payout above target was based 100% on achievement of adjusted operating income. The goals for the adjusted product bookings component required adjusted product bookings equal to 100% of fiscal year 2017 plan product bookings for a 50% threshold payout and product bookings equal to 103.25% of fiscal year 2017 plan product bookings for a 100% target payout. Actual fiscal year 2017 product bookings were 111% of fiscal year 2017 plan product bookings, resulting in the maximum 100% payout under this component. The goals and payout formula for the adjusted operating income component of Mr. Ellow’s VIP plan were the same as those under the VIP plan for other officers described above. Accordingly, based on the 100% payout under the product bookings component and our achievement of adjusted operating income of $280.4 million, Mr. Ellow’s VIP generated an overall VIP payout level of 127%.
Equity Incentive Awards
Equity incentive awards are intended to align executive interests with shareholder interests to promote creation of shareholder value, create a strong incentive for sustained long-term value growth by providing a wealth accumulation opportunity, attract and retain highly talented executives, and contribute to a competitive total compensation package. Equity incentive awards are typically granted at the first meeting of the Compensation Committee following the hire of key new employees and annually to a broad group of existing key employees, including executive officers.
In fiscal year 2017, awards to the Named Executive Officers were split 50/50 in value between time-based restricted stock units and performance-based restricted stock units.
82
Restricted stock units generally are awards that provide for the issuance of shares as the award vests without payment of any purchase price by the award recipient. Time-based restricted stock units vest for 25% of the shares on each of the first four anniversaries following the grant date. Performance-based restricted stock units granted in fiscal year 2017 vest on the third anniversary of the grant date for 100% of the shares earned based on the Company’s performance for fiscal year 2018 or 2019 as measured by non-GAAP operating margin (“Margin”). Margin for this purpose is defined to be generally consistent with non-GAAP operating margin as reported in our quarterly earnings releases. The payout percentage will be the higher of the payout percentages determined based on fiscal year 2018 performance or fiscal year 2019 performance. For each fiscal year, the potential payout percentages range from a threshold payout of 40% for a Margin of 16% to a target payout of 100% for a Margin of 20% and a maximum payout of 130% for a Margin of 21.5% or higher.
The Named Executive Officers were granted similar performance-based restricted stock units in fiscal year 2016 with payouts based on the higher of Margin achieved in fiscal year 2017 or fiscal year 2018. In fiscal year 2017, the Company’s Margin was 21.75%, resulting in a 130% payout percentage for that year. Accordingly, when the fiscal year 2016 performance-based restricted stock units vest in September 2019, executive officers will receive a maximum 130% payout.
The Named Executive Officers also were granted similar performance-based restricted stock units in fiscal year 2015 with payouts based on the higher of Margin achieved in fiscal year 2016 or fiscal year 2017. In fiscal year 2016, the Company’s Margin was 20.2%, resulting in a 100% payout percentage for that year. As discussed above, fiscal year 2017 Margin was 21.75%. Accordingly, when the fiscal year 2015 performance-based restricted stock units vest in September 2018, executive officers will receive a maximum 130% payout.
For grants made in fiscal year 2017, the Compensation Committee modified the terms of the performance-based restricted stock units to provide for pro-rated vesting of awards if a recipient’s employment terminates before the vesting date due to death, disability, involuntary termination or retirement (age 65 with 10 years of service). Prior awards provided for full vesting if termination resulted from death, disability or involuntary termination. The change was made to improve the fairness of award payouts in these events.
The Compensation Committee continued its practice in fiscal year 2017 of determining the size of annual equity incentive awards based on “long-term incentive values” as commonly reported in compensation surveys. An executive’s long-term incentive value for any year is generally equal to the grant date market price of time-based and performance-based restricted stock units granted to the executive during the year. As with base salaries, our general guideline for long-term incentive values is to utilize the 50th percentile of the market data, considering the peer group data and survey group data, as appropriate, and adjusting for experience, performance and unique job components. For Dr. Rhines, Mr. Hinckley, Mr. Derrick and Mr. Freed, the Compensation Committee approved long-term incentive values for awards in fiscal year 2017 that were the same as the award values in fiscal year 2016, based on its view that the prior fiscal year award values were well positioned for their respective roles. Mr. Ellow received an 18% increase in long-term incentive value of awards in fiscal year 2017, leaving it below the 50th percentile of the peer group data for his position but bringing his target total direct compensation (total of salary, VIP plan target and long-term incentive value) to the average of the 50th percentiles of the peer group and survey group data for his position. To determine the number of time-based and performance-based restricted stock units to be granted, the approved long-term incentive values were then divided by $24.29 per share, which was the closing market price of our common stock on the grant date, with 50% of the resulting number of shares granted as time-based restricted stock units and the remaining 50% granted as performance-based restricted stock units.
In December 2016, the Compensation Committee approved the accelerated vesting and immediate payment of time-based restricted stock units granted to Mr. Ellow in fiscal years 2016 and 2017 for a total of 33,344 shares valued at $1,229,393. The purpose of this action was to generate additional compensation income for Mr. Ellow in 2016 as a strategy to avoid triggering adverse tax consequences for the Company and Mr. Ellow under Section 280G of the Internal Revenue Code as a result of compensation he will or may receive in connection with the closing of the acquisition of the Company by Siemens Industry, Inc. (Siemens) and Meadowlark Subsidiary Corporation, a wholly-owned subsidiary of Siemens.
Officer Stock Ownership Policy
We have an Officer Stock Ownership Policy to further align the interests of our executive officers with the interests of our shareholders. The policy requires each of our executive officers to accumulate and maintain ownership of our common stock by the later of January 31, 2017 or five years after becoming an executive officer with a value equal to the following multiples of base salary: CEO and President: 3x; other executive officers: 1x. For this purpose, ownership includes shares underlying restricted stock units and the in-the-money value of exercisable stock options. If an executive officer does not meet the share ownership requirement as of the required compliance date or any fiscal year end thereafter, the officer is prohibited from selling any shares of our common stock until compliance is achieved, other than shares sold to cover tax withholding or the exercise
83
price of stock options. As of January 31, 2017 and based on the closing market price for our common stock on that date, all of the executive officers either met, or were making satisfactory progress towards meeting, their share ownership requirements.
Clawback Policy
We have a policy for recovery of incentive compensation from executive officers in the event of misconduct (the “Clawback Policy”). The Clawback Policy was adopted to prevent executives involved in wrongful conduct from unjustly benefiting from that conduct, and to remove the financial incentives to engage in that conduct. The Clawback Policy generally provides that the Board of Directors may recover incentive compensation from an executive officer who is involved in wrongful conduct that results in a restatement of the Company’s financial statements for any fiscal quarter or year, provided the restatement occurs within three years after the end of the restated year. Incentive compensation for this purpose includes the full amount of any annual VIP plan incentive pay and any performance-based restricted stock unit payout calculated based on the financial statements that were subsequently restated, and excess proceeds from sales of any stock acquired under other equity incentive awards where such sales were made at inflated stock prices ensuing after the release of earnings that were subsequently restated.
401(k) Plan
Our Individual Deferred Tax and Savings Plan (the “401(k) Plan”) is a tax qualified retirement savings plan pursuant to which all of our U.S. employees may defer compensation under Section 401(k) of the Internal Revenue Code. We contribute an amount equal to 50% of the first 6% of salary contributed under the 401(k) Plan by an eligible employee, up to the maximum allowed under the Internal Revenue Code. We do not provide any supplemental retirement benefits to executive officers. Matching contributions in fiscal year 2017 for the Named Executive Officers are included under the heading “All Other Compensation” in the Summary Compensation Table below.
Severance Benefits, including Change in Control Benefits
We have provided change in control severance agreements to our executive officers since 1999. In March 2015, the Compensation Committee and the Board of Directors, with the advice of the Consultant, reviewed and approved updated severance agreements designed to be more consistent with current market practices. Under our executive severance agreements, we have agreed to provide certain benefits to the Named Executive Officers if their employment is terminated (other than for “cause” by the Company or voluntary resignations without “good reason”) within 18 months after a change in control of the Company, except that this agreement is extended to 24 months for Dr. Rhines and Mr. Hinckley. The agreements also provide certain benefits to the Named Executive Officers if their employment is terminated by the Company without cause or by the officer with good reason in circumstances not involving a change in control.
The change in control severance benefits are intended to diminish the distraction that executive officers would face by virtue of the personal uncertainties created by a pending or threatened change in control and to assure that we will continue to have each executive officer’s full dedication and services at all times. The severance benefits absent a change in control are intended to provide certainty regarding executives’ termination benefits when employment is terminated involuntarily and without cause, and to reduce disputes and litigation. Our severance benefits are designed to be competitive with similar benefits available at companies with which we compete for executive talent. These benefits, as one element of our total compensation program, help us attract, retain and motivate highly talented executive officers.
Change in control benefits generally consist of a lump sum cash payment; vesting acceleration and extension of stock options; restricted stock unit vesting acceleration; a cash amount that may be used for health insurance continuation; director and officer insurance continuation; relocation expenses; and outplacement services. The lump sum cash payment is equal to three times the sum of base salary plus target incentive compensation for Dr. Rhines and Mr. Hinckley and one and one-half times the sum of base salary plus target incentive compensation for all other Named Executive Officers.
Severance agreements absent a change in control generally consist of a lump sum cash payment equal to two times base salary for Dr. Rhines and Mr. Hinckley and one and one-half times base salary for all other Named Executive Officers; a pro-rated incentive compensation payout for the final year of employment; one-year of additional vesting of options and time-based restricted stock units; accelerated vesting of performance-based restricted stock units previously earned based on company performance; a cash amount that may be used for health insurance continuation; and director and officer insurance continuation. Additional details and specific terms of the severance agreements are set forth under “Potential Payments upon Termination or Change in Control - Change in Control Compensation” and “Potential Payments upon Termination or Change in Control - Compensation on Other Involuntary Terminations” below.
84
Tax Deductibility of Executive Compensation
Section 162(m) of the Internal Revenue Code limits to $1,000,000 per person the amount that we may deduct for compensation paid to any of our most highly compensated officers in any year, excluding any person who, like Mr. Hinckley, served as principal financial officer during the year. In fiscal year 2017, the total salary and compensation from time-based restricted stock unit vesting for Dr. Rhines and Mr. Ellow exceeded $1,000,000, with the effect that a portion of the compensation paid to them was not deductible. VIP plan incentive compensation for all executive officers in fiscal year 2017 was not subject to the $1,000,000 cap on deductibility as we took steps to qualify the VIP plan awards as “performance-based compensation” under IRS regulations. It is also possible for an executive officer’s nonqualified stock option exercises to cause the officer’s total compensation to exceed $1,000,000 during a year since the excess of the current market price over the option price (“Option Spread”) for nonqualified stock options is treated as compensation. We receive no tax deduction for the Option Spread compensation on exercise of Incentive Stock Options unless the optionee disposes of the acquired shares before satisfying certain holding periods. Under IRS regulations, Option Spread compensation from options that meet certain requirements will not be subject to the $1,000,000 cap on deductibility and it is our current policy generally to grant options that meet those requirements.
COMPENSATION COMMITTEE REPORT
The Compensation Committee has:
• | Reviewed and discussed the above section titled “Compensation Discussion and Analysis” with management; and |
• | Based on the review and discussion above, recommended to the Board of Directors that the “Compensation Discussion and Analysis” section be included in this Item. |
Compensation Committee
J. Daniel McCranie, Chair
Keith L. Barnes
Sir Peter L. Bonfield
COMPENSATION RISK ASSESSMENT
To determine the level of risk arising from our compensation policies and practices, we conducted a risk assessment and evaluation process during fiscal year 2017. The risk assessment examined the compensation programs applicable to all of our employees, not just our Named Executive Officers. The approach taken to conduct the risk assessment included an evaluation of governance processes, market competitiveness, and program design elements. We reviewed the process and results of the risk assessment with the Compensation Committee, and noted several risk-mitigating features and safeguards against imprudent or unnecessary risk-taking, including:
• | Balanced mix of fixed versus variable, and short-term versus long-term, compensation elements. |
• | Annual cash incentives under our VIP plan approved by the Compensation Committee focus employees on generation of operating income, a fundamental measure of value creation for shareholders. |
• | Large proportion of total compensation provided in the form of long-term equity incentive awards, which align employee and shareholder interests. Half of the long-term equity incentive awards are performance-based. |
• | Clawback policy to prevent executive officers from unjustly benefiting from wrongful conduct that results in a restatement of our financial statements. |
• | Advice of outside compensation consultant engaged directly by the Compensation Committee in determining compensation pay structures and amounts. |
Based upon the results of our risk assessment, we concluded that the Company’s compensation programs and practices effectively link compensation to behaviors aligned with long-term Company welfare and shareholder value, and that the risks arising from our compensation policies and practices are not reasonably likely to have a material adverse effect on the Company.
85
INFORMATION REGARDING EXECUTIVE OFFICER COMPENSATION
Summary Compensation Table
Name and Principal Position | Year | Salary ($) | Stock Awards ($)(1) | Non-Equity Incentive Plan Compensation ($)(2) | All Other Compensation ($)(3) | Total ($) | |||||
Dr. Walden C. Rhines | FY2017 | 772,000 | 3,804,222 | 1,127,506 | 18,231 | 5,721,959 | |||||
Chairman of the Board and | FY2016 | 761,000 | 3,806,888 | — | 8,005 | 4,575,893 | |||||
Chief Executive Officer | FY2015 | 750,000 | 3,414,069 | 879,750 | 21,025 | 5,064,844 | |||||
Gregory K. Hinckley | FY2017 | 628,000 | 3,023,891 | 837,438 | 18,494 | 4,507,823 | |||||
President | FY2016 | 619,000 | 3,025,974 | — | 7,980 | 3,652,954 | |||||
FY2015 | 610,000 | 2,731,255 | 653,310 | 19,060 | 4,013,625 | ||||||
Michael F. Ellow | FY2017 | 431,375 | 975,425 | 547,846 | 7,982 | 1,962,628 | |||||
Senior Vice President | FY2016 | 418,750 | 829,681 | — | 7,981 | 1,256,412 | |||||
World Trade | FY2015 | 365,993 | 682,837 | 210,375 | 25,480 | 1,284,685 | |||||
Brian M. Derrick | FY2017 | 360,500 | 633,998 | 251,809 | 7,978 | 1,254,285 | |||||
Vice President Corporate | FY2016 | 350,000 | 634,465 | — | 7,975 | 992,440 | |||||
Marketing | FY2015 | 345,000 | 536,481 | 193,545 | 7,800 | 1,082,826 | |||||
Dean M. Freed | FY2017 | 325,000 | 487,712 | 227,013 | 7,975 | 1,047,700 | |||||
Vice President and | FY2016 | 315,000 | 488,066 | — | 7,975 | 811,041 | |||||
General Counsel | FY2015 | 305,000 | 390,148 | 171,105 | 7,825 | 874,078 | |||||
(1) | Represents the grant date fair value of restricted stock unit awards granted in the applicable year computed in accordance with accounting guidance applicable to stock-based compensation. The grant date fair value is based on the closing market price of the Common Stock on the grant date reduced by the value of expected dividends on the Common Stock payable prior to vesting of the restricted stock units. In each year, 50% of the stock awards were performance-based restricted stock units and 50% were time-based restricted stock units. For performance-based restricted stock units, the grant date fair value is calculated using the target number of shares that, as of the grant date, was the estimated number of shares to be issued. |
(2) | Represents annual bonus earned for performance in the applicable year under our VIP plan. |
(3) | For fiscal year 2017, includes Company contributions to the Individual Deferred Tax and Savings Plan pursuant to which the Company’s U.S. employees may defer compensation under Section 401(k) of the Internal Revenue Code. The Company contributes an amount equal to 50% of the first 6% of salary contributed under the plan by an eligible employee, up to the maximum allowed under the Internal Revenue Code. For fiscal year 2017, also includes spousal travel costs for a sales event for Dr. Rhines and Mr. Hinckley, and tax preparation costs for Mr. Hinckley. |
86
Grants of Plan-Based Awards in Fiscal Year 2017
The following table contains information concerning the fiscal year 2017 incentive pay opportunities for the Named Executive Officers under our variable incentive pay plan and the time-based and performance-based restricted stock units granted to the Named Executive Officers in fiscal year 2017.
Estimated Possible Payouts Under Non-Equity Incentive Plan Awards(1) | Estimated Future Payouts Under Equity Incentive Plan Awards(2) | All Other Stock Awards: Number of Shares or Units (#)(3) | Grant Date Fair Value of Stock and Option Awards ($)(4) | |||||||||||||||
Name | Grant Date | Threshold ($) | Target ($) | Maximum ($) | Threshold (#) | Target (#) | Maximum (#) | |||||||||||
Dr. Walden C. Rhines | 177,560 | 887,800 | 5,000,000 | |||||||||||||||
9/7/2016 | 32,112 | 80,279 | 104,363 | 1,897,796 | ||||||||||||||
9/7/2016 | 80,279 | 1,906,426 | ||||||||||||||||
Gregory K. Hinckley | 131,880 | 659,400 | 5,000,000 | |||||||||||||||
9/7/2016 | 25,525 | 63,812 | 82,956 | 1,508,516 | ||||||||||||||
9/7/2016 | 63,812 | 1,515,375 | ||||||||||||||||
Michael F. Ellow | 150,981 | 431,375 | 5,000,000 | |||||||||||||||
9/7/2016 | 8,234 | 20,584 | 26,759 | 486,606 | ||||||||||||||
9/7/2016 | 20,584 | 488,819 | ||||||||||||||||
Brian M. Derrick | 39,655 | 198,275 | 5,000,000 | |||||||||||||||
9/7/2016 | 5,352 | 13,379 | 17,393 | 316,280 | ||||||||||||||
9/7/2016 | 13,379 | 317,718 | ||||||||||||||||
Dean M. Freed | 35,750 | 178,750 | 5,000,000 | |||||||||||||||
9/7/2016 | 4,117 | 10,292 | 13,380 | 243,303 | ||||||||||||||
9/7/2016 | 10,292 | 244,409 | ||||||||||||||||
(1) | Amounts reported in these columns represent potential bonuses payable for performance in fiscal year 2017 under our variable incentive pay plan, or VIP plan. The Compensation Committee annually approves target bonus levels as a percentage of base salary paid during the year. The percentages of base salary for the Named Executive Officers were as follows: Dr. Rhines-115%; Mr. Hinckley-105%; Mr. Ellow-100%; Mr. Derrick-55%; and Mr. Freed -55%. See “Compensation Discussion and Analysis-Annual Variable Incentive Pay Compensation.” |
(2) | Amounts reported in these columns represent performance-based restricted stock units awarded in fiscal year 2017 and are based on performance during fiscal years 2018 - 2019 and continued employment through the third anniversary of the grant date. See “Compensation Discussion and Analysis - Equity Incentive Awards.” |
(3) | Amounts reported in this column represent time-based restricted stock units awarded in fiscal year 2017. Time-based restricted stock units vest for 25% of the shares on each of the first four anniversaries of the grant date, and shares are issued upon vesting. Vesting may be accelerated in certain circumstances, as described below under “Potential Payments Upon Termination or Change in Control.” |
(4) | For restricted stock units granted on September 7, 2016, represents the grant date fair value of the awards based on the closing market price of the Common Stock of $24.29 per share on that date reduced by the value of expected dividends payable on the Common Stock prior to vesting of $0.5425 for time-based restricted stock units and $0.65 for performance-based restricted stock units. For performance-based restricted stock units, the grant data fair value is calculated using the target number of shares that, as of the grant date, was the estimated number of shares to be issued. |
87
Outstanding Equity Awards at January 31, 2017
The following table sets forth the information concerning outstanding options and restricted stock units held by the Named Executive Officers on January 31, 2017.
Option Awards | Stock Awards | |||||||||||||||||
Name | Number of Shares Underlying Unexercised Options Exercisable (#) | Number of Shares Underlying Unexercised Options Unexercisable (#) | Option Exercise Price ($) | Option Expiration Date | Number of Shares or Units That Have Not Vested (#)(1) | Market Value of Shares or Units That Have Not Vested ($) | Equity Incentive Plan Awards: Number of Unearned Units That Have Not Vested (#) | Equity Incentive Plan Awards: Market Value of Unearned Units That Have Not Vested ($) | ||||||||||
Dr. Walden C. Rhines | 208,795 | — | 17.02 | 9/12/2022 | 80,279 | (2) | 2,963,098 | 104,363 | (9) | 3,852,038 | ||||||||
208,412 | — | 10.63 | 9/14/2021 | 58,547 | (3) | 2,160,970 | ||||||||||||
33,543 | — | 10.35 | 9/15/2020 | 39,593 | (4) | 1,461,378 | ||||||||||||
188,777 | — | 8.91 | 12/22/2019 | 19,138 | (5) | 706,384 | ||||||||||||
380,656 | — | 5.17 | 12/11/2018 | 101,481 | (7) | 3,745,664 | ||||||||||||
6,265 | — | 15.96 | 10/9/2017 | 102,941 | (8) | 3,799,552 | ||||||||||||
Total | 1,026,448 | — | 401,979 | 14,837,046 | 104,363 | 3,852,038 | ||||||||||||
Gregory K. Hinckley | 167,036 | — | 17.02 | 9/12/2022 | 63,812 | (2) | 2,355,301 | 82,956 | (9) | 3,061,906 | ||||||||
20,590 | — | 10.63 | 9/14/2021 | 46,537 | (3) | 1,717,681 | ||||||||||||
152,527 | — | 8.91 | 12/22/2019 | 31,674 | (4) | 1,169,087 | ||||||||||||
308,156 | — | 5.17 | 12/11/2018 | 15,311 | (5) | 565,129 | ||||||||||||
80,664 | (7) | 2,977,308 | ||||||||||||||||
82,352 | (8) | 3,039,612 | ||||||||||||||||
Total | 648,309 | — | 320,350 | 11,824,118 | 82,956 | 3,061,906 | ||||||||||||
Michael F. Ellow | 7,353 | (4) | 271,399 | 26,759 | (9) | 987,675 | ||||||||||||
1,175 | (6) | 43,369 | ||||||||||||||||
22,117 | (7) | 816,338 | ||||||||||||||||
19,117 | (8) | 705,608 | ||||||||||||||||
Total | — | — | 49,762 | 1,836,714 | 26,759 | 987,675 | ||||||||||||
Brian M. Derrick | 34,799 | — | 17.02 | 9/12/2022 | 13,379 | (2) | 493,819 | 17,393 | (9) | 641,976 | ||||||||
32,419 | — | 10.63 | 9/14/2021 | 9,758 | (3) | 360,168 | ||||||||||||
22,361 | — | 10.35 | 9/15/2020 | 6,222 | (4) | 229,654 | ||||||||||||
9,448 | — | 8.91 | 12/22/2019 | 3,008 | (5) | 111,025 | ||||||||||||
12,348 | — | 5.17 | 12/11/2018 | 16,913 | (7) | 624,259 | ||||||||||||
7,633 | — | 15.96 | 10/9/2017 | 16,176 | (8) | 597,056 | ||||||||||||
Total | 119,008 | — | 65,456 | 2,415,981 | 17,393 | 641,976 | ||||||||||||
Dean M. Freed | 27,839 | — | 17.02 | 9/12/2022 | 10,292 | (2) | 379,878 | 13,380 | (9) | 493,856 | ||||||||
23,156 | — | 10.63 | 9/14/2021 | 7,506 | (3) | 277,046 | ||||||||||||
22,361 | — | 10.35 | 9/15/2020 | 4,525 | (4) | 167,018 | ||||||||||||
12,650 | — | 8.91 | 12/22/2019 | 2,187 | (5) | 80,722 | ||||||||||||
11,439 | — | 5.17 | 12/11/2018 | 13,010 | (7) | 480,199 | ||||||||||||
11,764 | (8) | 434,209 | ||||||||||||||||
Total | 97,445 | — | 49,284 | 1,819,072 | 13,380 | 493,856 | ||||||||||||
(1) | Time-based restricted stock units generally vest for 25% of the shares on each of the first four anniversaries of the grant date, becoming fully vested on the fourth anniversary of the grant date. |
(2) | 25% of the shares underlying these restricted stock units will be issued on September 7, 2017 and on each of the next three anniversaries of that date, with the last installment of shares being issued on September 7, 2020. |
(3) | One-third of the shares underlying these restricted stock units will be issued on September 9, 2017 and on each of the next two anniversaries of that date, with the last installment of shares being issued on September 9, 2019. |
(4) | One-half of the shares underlying these restricted stock units will be issued on September 10, 2017 and the remaining shares will be issued on September 10, 2018. |
(5) | All of the shares underlying these restricted stock units will be issued on September 11, 2017. |
(6) | One-half of the shares underlying these restricted stock units will be issued on June 11, 2017 and the remaining shares will be issued on June 11, 2018. |
88
(7) | Performance-based restricted stock units granted in fiscal year 2016 will be payable based on the higher of the payout percentage earned for performance in fiscal year 2017 or the payout percentage earned for performance in fiscal year 2018, with vesting of earned shares to occur on September 9, 2018. The payout percentage earned for performance in fiscal year 2017 under these awards was 130%; accordingly, amounts in the table represent 130% of the target number of shares under performance-based restricted stock units granted in fiscal year 2016. These amounts have been earned subject only to satisfaction of the vesting requirement. |
(8) | Performance-based restricted stock units granted in fiscal year 2015 are payable at 130% of the target number of shares, with vesting of earned shares to occur on September 10, 2017. The payout percentage is based on the higher of the payout percentage earned for performance in fiscal year 2016 or the payout percentage earned for performance in fiscal year 2017. |
(9) | Represents the maximum number of shares that may be earned under performance-based restricted stock units granted in fiscal year 2017 based on performance in fiscal years 2018 - 2019 with vesting of earned shares to occur on September 7, 2019. |
Option Exercises and Stock Vested in Fiscal Year 2017
The following table sets forth information with respect to options that were exercised by Named Executive Officers during fiscal year 2017 and restricted stock units held by Named Executive Officers that vested during fiscal year 2017.
Option Awards | Stock Awards | |||||||||
Name | Number of shares acquired on exercise (#) | Value realized on exercise ($) | Number of shares acquired on vesting (#) | Value realized on vesting ($) | ||||||
Dr. Walden C. Rhines | 7,047 | 51,161 | 172,344 | 4,063,322 | ||||||
Gregory K. Hinckley | 32,396 | 356,929 | 137,776 | 3,248,266 | ||||||
Michael F. Ellow | — | — | 41,860 | (1) | 1,431,168 | |||||
Brian M. Derrick | 8,700 | 88,653 | 27,477 | 647,904 | ||||||
Dean M. Freed | — | — | 20,387 | 480,774 | ||||||
(1) | Includes 33,344 shares issued to Mr. Ellow upon the accelerated vesting of time-based restricted stock units as approved by the Compensation Committee. See “Compensation Disclosure and Analysis - Equity Incentive Awards.” |
Potential Payments upon Termination or Change in Control
Change in Control Compensation
We have agreed to provide certain benefits to the Named Executive Officers if their employment is terminated (other than for “cause” by the Company or where the officer voluntarily resigns without “good reason”) within 18 months after a “change in control” of Mentor, except that this agreement is extended to 24 months for Dr. Rhines and Mr. Hinckley. See “Compensation Discussion and Analysis - Severance Benefits, including Change in Control Benefits.” In our severance agreements, “change in control” is generally defined to include:
• | the acquisition by any person of 40% or more of our outstanding Common Stock, |
• | the nomination (and subsequent election) in a two year period of a majority of our directors by persons other than the incumbent directors, and |
• | a sale of all or substantially all of our assets, or an acquisition of Mentor through a merger, consolidation or share exchange. |
In our agreements, “cause” generally includes willful and continued failure to substantially perform assigned duties or comply with specific directives of the Board of Directors, willful commission of an act of fraud or dishonesty resulting in material financial injury to us, and willful engagement in illegal conduct materially injurious to us. In our agreements, “good reason” generally includes a material diminution in position or duties, a salary reduction or material reduction in other benefits, a home office relocation of over 25 miles, and failure by us to pay any compensation or to comply with the other provisions of the severance agreements.
89
The following table shows the estimated change in control benefits that would have been payable to the Named Executive Officers if a change in control had occurred on January 31, 2017 and each officer’s employment was terminated on that date by us without cause or by the officer for good reason.
Employee | Cash Severance Benefit ($) (1) | Stock Option Acceleration & Extension ($)(2) | Time-Based Restricted Stock Unit Acceleration ($)(3) | Performance-Based Restricted Stock Unit Acceleration ($)(4) | Health Insurance Continuation ($)(5) | D&O Insurance ($)(6) | Relocation Expenses ($)(7) | Outplacement Services ($)(8) | Total ($)(9) | |||||||||
Walden C. Rhines | 4,979,400 | 117,481 | 7,291,829 | 10,508,314 | 100,000 | 48,680 | 350,000 | 19,000 | 23,414,704 | |||||||||
Gregory K. Hinckley | 3,862,200 | 93,985 | 5,807,198 | 8,372,221 | 100,000 | 48,680 | 350,000 | 19,000 | 18,653,284 | |||||||||
Michael F. Ellow | 1,313,250 | — | 314,768 | 2,281,702 | 75,000 | 48,680 | — | 19,000 | 4,052,400 | |||||||||
Brian M. Derrick | 850,950 | 15,914 | 1,194,666 | 1,715,134 | 75,000 | 48,680 | — | 19,000 | 3,919,344 | |||||||||
Dean M. Freed | 767,250 | 12,731 | 904,664 | 1,294,286 | 75,000 | 48,680 | — | 19,000 | 3,121,611 | |||||||||
(1) | Cash Severance Benefit. Each Named Executive Officer has entered into a severance agreement with us providing for, among other things, cash severance benefits payable by us if the officer’s employment is involuntarily terminated by us without cause or by the officer for good reason within 18 months after a change in control, except that this protection is 24 months for Dr. Rhines and Mr. Hinckley. The cash severance payment for Dr. Rhines and Mr. Hinckley is equal to three times the sum of base salary plus target incentive compensation as in effect at the time of the change in control. The cash severance payment for all other executive officers is equal to one and one-half times the sum of base salary plus target incentive compensation as in effect at the time of the change in control. These amounts are payable in a lump sum once the officer has signed a general release of claims and that release has become irrevocable. |
(2) | Stock Option Extension. If cash severance benefits are triggered, the severance agreements for all Named Executive Officers provide that the standard 30-day period for exercising vested options following termination of employment will be extended to 18 months following termination (24 months for Dr. Rhines and Mr. Hinckley), but not beyond each option’s original 10-year term. Information regarding outstanding options held by each Named Executive Officer is set forth in the Outstanding Equity Awards table above. The amounts in the table above represent the increase in value of outstanding options resulting from the extension of the post-termination exercise period from 30 days to either 18 months or 24 months, as applicable, with the option values for 30-day, 18-month and 24-month remaining terms calculated using the Black-Scholes option pricing model with assumptions consistent with those used for valuing our options under accounting guidance applicable to stock-based compensation. |
(3) | Time-based Restricted Stock Unit Acceleration. If cash severance benefits are triggered, the severance agreements for all Named Executive Officers provide that all of the officer’s unvested time-based restricted stock units will immediately vest. Information regarding unvested time-based restricted stock units held by each Named Executive Officer is set forth in the Outstanding Equity Awards table above. The amounts in the table above represent the value of the shares that would have been issued under these awards on a change in control based on a stock price of $36.91 per share, which was the closing price of our Common Stock on the last trading day of fiscal year 2017. |
(4) | Performance-Based Restricted Stock Unit Acceleration. If cash severance benefits are triggered, the award agreements governing all performance-based restricted stock units provide for the immediate vesting and payout of the greater of (a) 100% of the target number of shares under the performance-based restricted stock units, or (b) the number of shares earned based on Company performance for fiscal years of the performance period completed prior to the change in control. Information regarding performance-based restricted stock units held by each Named Executive Officer is set forth in the Outstanding Equity Awards table above. The amounts in the table above represent the value of the shares that would have been issued under these awards on a change in control (130% of target for awards granted in fiscal years 2015 and 2016 and 100% of target for awards granted in fiscal year 2017) based on a stock price of $36.91 per share which was the closing price of our Common Stock on the last trading day of fiscal year 2017. |
(5) | Health Insurance Continuation. If cash severance benefits are triggered, the severance agreements for all Named Executive Officers also provide for payment of a fixed amount that may be used on an after-tax basis to purchase continued health insurance benefits under our plans or for any other purpose. The fixed amount is $100,000 for Dr. Rhines and Mr. Hinckley and $75,000 for all other executive officers. |
(6) | Director and Officer Insurance Continuation. If cash severance benefits are triggered, the severance agreements for all Named Executive Officers also provide for continuation for six years of director and officer liability insurance against insurable events that occurred while the officer was a director or officer of the Company. The amounts in the table above represent the estimated cost per officer of a six-year tail policy with coverage similar to our current director and officer liability insurance policy. |
(7) | Relocation Expenses. If cash severance benefits are triggered, the severance agreements for Dr. Rhines and Mr. Hinckley also provide for reimbursement of relocation expenses incurred for relocations occurring within 24 months following termination, up to a maximum of $350,000. The amounts in the table above represent the maximum amount payable for relocation. |
(8) | Outplacement Services. If cash severance benefits are triggered, the severance agreements for all Named Executive Officers also require us to provide two years of outplacement services. The amounts in the table above represent the estimated cost of such services. |
(9) | Total - Conditional Cap on Change in Control Benefits. Under the severance agreements, if any payments to a Named Executive Officer in connection with a change in control would be subject to the 20% excise tax on “excess parachute payments” as defined in Section 280G of the Internal Revenue Code, then, if it would result in a greater net after-tax benefit for the officer to have the payments that would otherwise be made reduced by the amount necessary to prevent them from being “parachute payments,” the officer will be paid such reduced benefits. None of the amounts in the above table have been reduced in accordance with this provision. |
90
Compensation on Other Involuntary Terminations
We have agreed to provide certain benefits to the Named Executive Officers if their employment is terminated by the Company without cause or by the officer with good reason in circumstances not involving a change in control. The definitions of “cause” and “good reason” for this purpose are the same as described above under “Change in Control Compensation.”
The following table shows the estimated severance benefits that would have been payable to the Named Executive Officers if, absent any change in control, each officer’s employment had been terminated on January 31, 2017 by us without cause or by the officer for good reason.
Employee | Cash Severance Benefit ($)(1) | Stock Option Acceleration & Extension ($)(2) | Time-Based Restricted Stock Unit Acceleration ($)(3) | Performance-Based Restricted Stock Unit Acceleration ($)(4) | Health Insurance Continuation ($)(5) | D&O Insurance ($)(6) | Total ($) | |||||||
Walden C. Rhines | 1,544,000 | 117,481 | 2,898,136 | 7,940,301 | 100,000 | 48,680 | 12,648,598 | |||||||
Gregory K. Hinckley | 1,256,000 | 93,985 | 2,311,046 | 6,330,951 | 100,000 | 48,680 | 10,140,662 | |||||||
Michael F. Ellow | 656,625 | — | 157,347 | 1,623,265 | 75,000 | 48,680 | 2,560,917 | |||||||
Brian M. Derrick | 549,000 | 15,914 | 469,348 | 1,287,162 | 75,000 | 48,680 | 2,445,104 | |||||||
Dean M. Freed | 495,000 | 12,731 | 351,531 | 965,049 | 75,000 | 48,680 | 1,947,991 | |||||||
(1) | Cash Severance Benefit. The severance agreements provide for, among other things, cash severance benefits payable by us if, absent any change in control, the officer’s employment is involuntarily terminated by us without cause or by the officer for good reason. The cash severance payment for Dr. Rhines and Mr. Hinckley is equal to two times base salary as in effect at the time of the termination. The cash severance payment for all other executive officers is equal to one and one-half times base salary as in effect at the time of the termination. These amounts are payable in a lump sum once the officer has signed a general release of claims and that release has become irrevocable. The severance agreements require us to make an additional cash payment equal to a pro rata portion of the annual incentive compensation that the officer would have received if the officer had remained employed for the balance of the fiscal year in which the termination occurs (based on the portion of the year worked). The table above does not include a pro rata portion of the incentive compensation for fiscal year 2017 because incentive compensation payments for fiscal year 2017 are included in the Summary Compensation Table and no pro rata amounts would have been paid if officers had terminated employment on January 31, 2017. |
(2) | Stock Option Extension. If cash severance benefits are triggered, the severance agreements for all Named Executive Officers provide that the standard 30-day period for exercising vested options following termination of employment will be extended to 18 months following termination (24 months for Dr. Rhines and Mr. Hinckley), but not beyond each option’s original 10-year term. Information regarding outstanding options held by each Named Executive Officer is set forth in the Outstanding Equity Awards table above. The amounts in the table above represent the increase in value of outstanding options resulting from the extension of the post-termination exercise period from 30 days to either 18 months or 24 months, as applicable, with the option values for 30-day, 18-month and 24-month remaining terms calculated using the Black-Scholes option pricing model with assumptions consistent with those used for valuing our options under accounting guidance applicable to stock-based compensation. |
(3) | Time-Based Restricted Stock Unit Acceleration. If cash severance benefits are triggered, the severance agreements for all Named Executive Officers provide for immediate vesting of all of the officer’s unvested time-based restricted stock units that would have vested if employment had continued for an additional year. Information regarding unvested time-based restricted stock units held by each Named Executive Officer is set forth in the Outstanding Equity Awards table above. The amounts in the table above represent the value of the shares that would have been issued under these awards on an involuntary termination based on a stock price of $36.91 per share which was the closing price of our Common Stock on the last trading day of fiscal year 2017. |
(4) | Performance-Based Restricted Stock Unit Acceleration. If cash severance benefits are triggered, (a) the award agreements governing performance-based restricted stock units granted in fiscal years 2015 and 2016 provide for the immediate vesting and payout of the number of shares earned based on Company performance for fiscal years of the performance period completed prior to the officer’s termination, and (b) the award agreements governing performance-based restricted stock units granted in fiscal year 2017 provide for a pro-rated payout at the end of the three-year vesting period equal to the calculated number of shares payable based on Company performance multiplied by the fraction of the vesting period completed prior to the officer’s termination. Information regarding performance-based restricted stock units held by each Named Executive Officer is set forth in the Outstanding Equity Awards table above. The amounts in the table above represent the sum of (i) the value of the shares that would have been issued immediately on an involuntary termination under the awards granted in fiscal years 2015 and 2016 (130% of target), and (ii) the value of the pro-rated number of shares that would have been issued in September 2020 under the award granted in fiscal year 2017 assuming achievement of the target payout level, in each case based on a stock price of $36.91 per share which was the closing price of our Common Stock on the last trading day of fiscal year 2017. |
(5) | Health Insurance Continuation. If cash severance benefits are triggered, the severance agreements for all Named Executive Officers also provide for payment of a fixed amount that may be used on an after-tax basis to purchase continued health insurance benefits under our plans or for any other purpose. The fixed amount is $100,000 for Dr. Rhines and Mr. Hinckley and $75,000 for all other executive officers. |
(6) | Director and Officer Insurance Continuation. If cash severance benefits are triggered, the severance agreements for all Named Executive Officers also provide for continuation for six years of director and officer liability insurance against insurable events that occurred while the officer was a director or officer of the Company. The amounts in the table above represent the estimated cost per officer of a six-year tail policy with coverage similar to our current director and officer liability insurance policy. |
Other Benefits Triggered on Termination due to Death, Disability or Retirement
As of January 31, 2017, each Named Executive Officer held unvested time-based restricted stock units as set forth in the Outstanding Equity Awards table above. The award agreements governing all unvested time-based restricted stock units provide that upon death or disability the restricted stock unit award shall be vested for at least 50% of the shares covered by the original grant. The aggregate value as of January 31, 2017 of time-based restricted stock units that would have vested if death
91
or disability had occurred on that date, was $2,201,866 for Dr. Rhines, $1,750,198 for Mr. Hinckley, $0 for Mr. Ellow, $366,959 for Mr. Derrick and $282,288 for Mr. Freed, in each case based on a stock price of $36.91 per share which was the closing price of our Common Stock on the last trading day of fiscal year 2017.
As of January 31, 2017, each Named Executive Officer held performance-based restricted stock units as set forth in the Outstanding Equity Awards table above. The award agreements governing performance-based restricted stock units granted in fiscal years 2015 and 2016 provide upon death or disability for the immediate vesting and payout of the number of shares earned based on Company performance for fiscal years of the performance period completed prior to the officer’s death or disability. The award agreements governing performance-based restricted stock units granted in fiscal year 2017 provide upon death, disability or retirement for a pro-rated payout at the end of the three-year vesting period equal to the calculated number of shares payable based on Company performance multiplied by the fraction of the vesting period completed prior to the officer’s death, disability or retirement. Retirement includes any termination of the officer’s employment after he has reached age 65 and has been employed by the Company for at least 10 years. As of January 31, 2017, Dr. Rhines and Mr. Hinckley were each 70 years old with over 10 years of employment and therefore were eligible for retirement. The aggregate value as of January 31, 2017 of (i) shares that would have been issued immediately under the awards granted in fiscal years 2015 and 2016 (130% of target) if death or disability had occurred on that date, and (ii) the pro-rated number of shares that would have been issued in September 2020 under the award granted in fiscal year 2017 assuming achievement of the target payout level as a result of death or disability on January 31, 2017, was $7,940,301 for Dr. Rhines, $6,330,951 for Mr. Hinckley, $1,623,265 for Mr. Ellow, $1,287,162 for Mr. Derrick and $965,049 for Mr. Freed, in each case based on a stock price of $36.91 per share which was the closing price of our Common Stock on the last trading day of fiscal year 2017. The aggregate value as of January 31, 2017 of the pro-rated number of shares that would have been issued in September 2020 under the award granted in fiscal year 2017 assuming achievement of the target payout level as a result of retirement on January 31, 2017, was $395,085 for Dr. Rhines and $314,030 for Mr. Hinckley, in each case based on a stock price of $36.91 per share which was the closing price of our Common Stock on the last trading day of fiscal year 2017.
The stock option agreements governing options granted in fiscal years 2008 to 2010 provide that the options shall become fully exercisable upon the Named Executive Officer’s retirement and that the standard 30-day period for exercising vested options following termination of employment will be extended to two years after retirement (as defined above), but not beyond each option’s original 10-year term. The options granted to Dr. Rhines and Mr. Hinckley in fiscal years 2008 to 2010 are referred to herein as the “Retirement Eligible Options” and all of those options were exercisable as of January 31, 2017. If Dr. Rhines or Mr. Hinckley had terminated employment (i.e., retired) on January 31, 2017, the increase in value of outstanding Retirement Eligible Options resulting from the extension of the post-termination exercise period from 30 days to two years, with the option values for 30-day and two-year remaining terms calculated using the Black-Scholes option pricing model with assumptions consistent with those used for valuing our options under accounting guidance applicable to stock-based compensation, would be $0 for Dr. Rhines, and $0 for Mr. Hinckley.
As of January 31, 2017, each Named Executive Officer held outstanding options as set forth in the Outstanding Equity Awards table above. The stock option agreements governing all options provide that upon either death or disability the option shall remain exercisable for one year. If death or disability of a Named Executive Officer had occurred on January 31, 2017, the increase in value of outstanding options resulting from the extension of the post-termination exercise period from 30 days to either two years for Retirement Eligible Options or one year for other options, with the option values for 30-day, one-year and two-year remaining terms calculated using the Black-Scholes option pricing model with assumptions consistent with those used for valuing our options under accounting guidance applicable to stock-based compensation, for each of the following Named Executive Officers was $0 for Dr. Rhines, $0 for Mr. Hinckley, $0 for Mr. Ellow, $0 for Mr. Derrick, and $0 for Mr. Freed.
92
INFORMATION REGARDING THE BOARD OF DIRECTORS
Director Compensation in Fiscal Year 2017
Name | Fees Earned or Paid in Cash ($) | Stock Awards ($)(1) | Total ($) | |||
Keith L. Barnes | 80,000 | 173,219 | 253,219 | |||
Sir Peter L. Bonfield | 115,000 | 173,219 | 288,219 | |||
Paul A. Mascarenas, OBE | 70,000 | 173,219 | 243,219 | |||
J. Daniel McCranie | 90,000 | 173,219 | 263,219 | |||
Patrick B. McManus(2) | 26,250 | — | 26,250 | |||
Cheryl L. Shavers | 43,750 | 173,219 | 216,969 | |||
Jeffrey M. Stafeil | 85,000 | 173,219 | 258,219 | |||
(1) | Represents the grant date fair value of restricted stock units granted in fiscal year 2017 computed in accordance with accounting guidance applicable to stock-based compensation. The grant date fair value is based on the closing market price of the Common Stock on the grant date reduced by the value of expected dividends on the Common Stock payable prior to vesting of the restricted stock units. On June 15, 2016, the date of our 2016 Annual Meeting of Shareholders, all directors elected at the meeting were granted restricted stock units for 8,083 shares. On January 31, 2017, directors held unvested restricted stock units for the following total numbers of shares of our Common Stock: Director Barnes, 8,083; Director Bonfield, 8,083; Director Mascarenas, 8,083; Director McCranie, 8,083; Director Shavers, 8,083; and Director Stafeil, 8,083. |
(2) | Mr. McManus was not nominated for re-election as a director at the 2016 Annual Meeting. |
In fiscal year 2017, cash fees were paid to our non-employee directors (“Outside Directors”) at the following annual rates:
Annual Fee Rate for FY 2017 ($) | ||
Board Member Retainer | 60,000 | |
Committee Member Retainer (per Committee) | 10,000 | |
Lead Director Retainer | 25,000 | |
Audit Committee Chair Retainer | 15,000 | |
Other Committees Chair Retainer | 10,000 | |
Outside Directors do not receive additional fees for meeting attendance. We reimburse directors for all reasonable travel and other expenses incurred in attending Board meetings and Board committee meetings.
The compensation of Outside Directors also includes restricted stock unit awards granted under our 2010 Omnibus Incentive Plan (“Omnibus Plan”) at the time of each Annual Meeting. For the awards granted at the time of the 2016 Annual Meeting, the approved long-term incentive value of the award to each Outside Director was $175,000. The number of shares under the restricted stock unit awards was determined by dividing the long-term incentive value by the closing price of our Common Stock on the grant date. Accordingly, on June 15, 2016, the date of our 2016 Annual Meeting, each Outside Director elected at that meeting was granted restricted stock units for 8,083 shares. The shares underlying restricted stock unit awards become issuable on the first anniversary of the grant date. If a director ceases to be a director for any reason or if there is a change in control of the Company, all shares underlying restricted stock unit awards will immediately be issued.
Outside Director Share Ownership Guidelines
To better align the interests of Board members with the interests of shareholders, the Board has adopted share ownership guidelines. Under these guidelines, Outside Directors are expected to achieve ownership of Mentor Graphics Corporation Common Stock with a value equal to three times the amount of the annual cash retainer (currently $60,000 resulting in an expected share ownership level of $180,000). Each Outside Director is expected to achieve this level of ownership within five years of initial election as a director. For this purpose, ownership includes shares underlying restricted stock units. As of January 31, 2017, all of the Outside Directors had met the share ownership guidelines or were making appropriate progress towards meeting the guidelines.
93
Item 12. Security Ownership of Certain Beneficial Owners and Management and Related Stockholder Matters.
INFORMATION REGARDING BENEFICIAL OWNERSHIP OF PRINCIPAL SHAREHOLDERS AND MANAGEMENT
The following table shows beneficial ownership of the Company’s Common Stock as of January 31, 2017 (except as otherwise noted) by the only shareholders known by the Company to beneficially own 5% or more of the Common Stock, by the directors, by the executive officers named in the Summary Compensation Table, and by all directors and executive officers as of January 31, 2017 as a group:
Name and Address of Beneficial Owner | Amount and Nature of Beneficial Ownership ($)(1)(2) | Percent (%) | ||
BlackRock, Inc. | 10,827,173 | 9.81 | ||
40 East 52nd Street | ||||
New York, NY 10022 | ||||
The Vanguard Group. | 8,554,729 | 7.75 | ||
100 Vanguard Blvd. | ||||
Malvern, PA 19355 | ||||
Name of Director or Executive Officer | Amount and Nature of Beneficial Ownership ($)(1) | Percent (%) | |||
Keith L. Barnes | 16,643 | (3) | * | ||
Sir Peter L. Bonfield | 76,401 | (3) | * | ||
Paul A. Mascarenas OBE | 15,764 | (3) | * | ||
J. Daniel McCranie | 48,753 | (3) | * | ||
Dr. Cheryl L. Shavers | 8,083 | (3) | * | ||
Jeffrey M. Stafeil | 19,762 | (3) | * | ||
Dr. Walden C. Rhines | 1,288,682 | (4) | 1.2 | ||
Gregory K. Hinckley | 1,215,713 | (5) | 1.1 | ||
Brian M. Derrick | 241,709 | (6) | * | ||
Michael F. Ellow | 29,170 | * | |||
Dean M. Freed | 172,585 | (7) | * | ||
All directors and executive officers as a group (12 persons) | 3,173,052 | (8) | 2.8 | ||
* | Less than 1% |
(1) | Except as otherwise noted, the entities listed in the table have sole voting and dispositive power with respect to the Common Stock owned by them. |
(2) | Except as otherwise noted, shares beneficially owned as of December 31, 2016 as provided in Schedules 13G filed by the shareholders. |
(3) | Includes 8,083 shares subject to restricted stock units under which shares are issuable immediately upon termination of service as a director. |
(4) | Includes 1,026,448 shares subject to options exercisable within 60 days of January 31, 2017. |
(5) | Includes 648,309 shares subject to options exercisable within 60 days of January 31, 2017. |
(6) | Includes 119,008 shares subject to options exercisable within 60 days of January 31, 2017. |
(7) | Includes 97,445 shares subject to options exercisable within 60 days of January 31, 2017. |
(8) | Includes 1,908,609 shares subject to options exercisable within 60 days of January 31, 2017 and 48,498 shares subject to restricted stock units under which shares are issuable immediately upon termination of service as a director. |
94
Equity Compensation Plan Information
The following table provides information as of January 31, 2017 regarding equity compensation plans approved by the shareholders and equity compensation plans that were not approved by the shareholders.
Plan Category | (a) Number of securities to be issued upon exercise of outstanding options, warrants and rights (#) | (b) Weighted average exercise price of outstanding options, warrants and rights ($)(1) | (c) Number of securities remaining available for future issuance (excluding securities reflected in column (a)) (#) | ||||
Equity compensation plans approved by security holders (2) | 6,521,058 | $ | 9.89 | 10,828,575 | |||
Equity compensation plans not approved by security holders (3)(4) | 124,902 | $ | 5.34 | — | |||
Total | 6,645,960 | $ | 9.62 | 10,828,575 | |||
(1) | Represents the weighted average exercise price of the outstanding options included in column (a); outstanding restricted stock units are not included in the calculation. |
(2) | Includes 1,989,384 options, 3,714,587 time-based restricted stock units and a maximum of 817,087 shares issuable under performance-based restricted stock units outstanding under the Company's 2010 Omnibus Incentive Plan, 1982 Stock Option Plan and 1987 Non-Employee Directors' Stock Plan, as well as 4,980,399 shares available for future issuance under the Company's 2010 Omnibus Incentive Plan and 5,848,176 shares currently available for future issuance under the Company's 1989 Employee Stock Purchase Plan and Foreign Subsidiary Employee Stock Purchase Plan. |
(3) | All outstanding options shown here are under the Company’s 1986 Stock Plan which was terminated with respect to future grants in July 2010. The 1986 Stock Plan provided for the issuance of Common Stock to officers, employees and consultants of the Company either by sale, as bonuses or pursuant to nonqualified stock options at prices and on terms determined by the Compensation Committee. The Company generally granted options under the 1986 Stock Plan only to persons who were not executive officers of the Company and only at exercise prices not less than the current market price at the time of grant. |
(4) | In connection with the acquisitions of Valor Computerized Systems Ltd. in 2010 and LogicVision, Inc. in 2009 the Company assumed employee stock options. Of those assumed options, options for a total of 46,636 shares with an average exercise price of $7.35 per share remained outstanding at January 31, 2017. Assumed options are not included in the above table. |
Item 13. Certain Relationships and Related Transactions, and Director Independence.
The Board of Directors has determined that all directors other than Dr. Rhines are “independent directors” as defined in NASDAQ rules. With respect to Director Stafeil, the Board considered that he was an executive officer of one of our customers during part of the last fiscal year, and concluded that his position did not affect independence.
Company policy requires the Audit Committee to review any transaction or proposed transaction with a related person and to determine whether to ratify or approve the transaction, with ratification or approval to occur only if the committee determines that the transaction is fair to the Company or that approval or ratification of the transaction is in the interest of the Company.
95
Item 14. Principal Accounting Fees and Services.
INDEPENDENT AUDITORS
The aggregate fees billed and expected to be billed by KPMG LLP and/or accrued by the Company for the audit and other professional services rendered in fiscal year 2017 and fiscal year 2016 were as follows:
FY2017 | FY2016 | |||||
Audit Fees(1) | $ | 2,509,427 | $ | 2,465,844 | ||
Audit-Related Fees(2) | $ | 15,372 | $ | 17,309 | ||
Tax Fees(3) | $ | 516,309 | $ | 549,431 | ||
All Other Fees | $ | — | $ | — | ||
(1) | Audit Fees represent fees for services performed in connection with the audit of the Company’s financial statements. Services include review of related 10-Qs and 10-Ks, the audit of internal control over financial reporting for purposes of issuing an opinion, attendance at Audit Committee meetings at which matters related to the reviews or audit were discussed, consultation on matters that arose during or as a result of a review or audit, preparation of “management letters,” the audit of the income tax provision, and the audit of purchase accounting for mergers and acquisitions. Audit Fees also include fees for statutory audit services and consents on SEC filings. |
(2) | Audit-Related Fees are primarily for a subscription to KPMG’s accounting research tool and fees for assurance related services that are reasonably related to the performance of the audit including the Company's planned adoption of the new revenue recognition standard. |
(3) | Tax Fees represent fees for the preparation and review of income tax returns, assistance with audits in various tax jurisdictions and tax consulting services provided on compliance and planning matters. |
The Audit Committee has established a policy to pre-approve all audit and permissible non-audit services provided by the independent auditors. These services may include audit services, audit-related services, tax services and other services. Pre-approval is generally provided for up to one year and any pre-approval is detailed as to the particular service or category of services, the nature of the fee arrangement, and is generally subject to a specific budget. Management periodically reports to the Audit Committee regarding the extent of services provided by the independent auditors in accordance with this pre-approval, and the fees for the services performed to date. The Audit Committee may also pre-approve particular services on a case-by-case basis. The Audit Committee has delegated to the Chair of the Audit Committee the authority to pre-approve all services performed by the Company’s independent auditors, provided that the Chair and management report any decision to pre-approve such services to the full Audit Committee at its next regular meeting.
96
Part IV
Item 15. Exhibits, Financial Statement Schedules.
(a) (1) Financial Statements:
The following consolidated financial statements are included in Part II, Item 8. “Financial Statements and Supplementary Data”:
Page | |
(a) (2) Financial Statement Schedule:
All financial statement schedules have been omitted since they are not required, not applicable, or the information is included in the Consolidated Financial Statements or Notes.
(a) (3) Exhibits
2. | A. | Agreement and Plan of Merger dated as of November 12, 2016 among Siemens Industry, Inc., Meadowlark Subsidiary Corporation and Mentor Graphics Corporation. Incorporated by reference to Exhibit 2.1 to the Company's Current Report on Form 8-K filed on November 14, 2016. |
3. | A. | 1987 Restated Articles of Incorporation, as amended. Incorporated by reference to Exhibit 3.A to the Company's Quarterly Report on Form 10-Q for the quarter ended July 31, 2014. |
B. | Bylaws of the Company. | |
4. | A. | Credit Agreement dated as of April 26, 2011 between the Company, Bank of America, N.A. as agent and the other lenders. Incorporated by reference to Exhibit 10.1 to the Company's Current Report on Form 8-K filed on April 27, 2011. |
B. | First Amendment to Credit Agreement dated as of May 24, 2013 between the Company, Bank of America, N.A. as agent and other lenders. Incorporated by reference to Exhibit 4.1 to the Company's Quarterly Report on Form 10-Q for the quarter ended April 30, 2013. | |
C. | Second Amendment to Credit Agreement dated as of September 30, 2013 between the Company, Bank of America, N.A. as agent and the other lenders. Incorporated by reference to Exhibit 4.1 to the Company's Quarterly Report on Form 10-Q for the quarter ended October 31, 2013. | |
D. | Third Amendment to the Credit Agreement dated as of January 9, 2015 between the Company, Bank of America, N.A. as agent and the other lenders. Incorporated by reference to Exhibit 4.D to the Company's Annual Report on Form 10-K for the fiscal year ended January 31, 2015. | |
E. | Fourth Amendment to the Credit Agreement dated as of February 24, 2016 between the Company, Bank of America, N.A. as agent and the other lenders. Incorporated by reference to Exhibit 4.E to the Company's Annual Report on Form 10-K for the fiscal year ended January 31, 2016. | |
F. | Indenture dated April 4, 2011 between the Company and Wilmington Trust Company, as Trustee, related to 4.00% Convertible Subordinated Debentures due 2031. Incorporated by reference to Exhibit 4.1 to the Company's Current Report on Form 8-K filed on April 4, 2011. | |
10. | *A. | 2010 Omnibus Incentive Plan, as amended. Incorporated by reference to Exhibit 10.A to the Company's Quarterly Report on Form 10-Q for the quarter ended July 31, 2016. |
*B. | Form of Restricted Stock Unit Award Agreement for grants of restricted stock units to non-employee directors under our 2010 Omnibus Incentive Plan. Incorporated by reference to Exhibit 10.B to the Company's Quarterly Report on Form 10-Q for the quarter ended July 31, 2014. | |
97
*C. | Form of Stock Option Agreement for grants of stock options to non-employee directors under our 2010 Omnibus Incentive Plan. Incorporated by reference to Exhibit 10.C to the Company's Quarterly Report on Form 10-Q for the quarter ended July 31, 2010. | |
*D. | Form of Stock Option Agreement Terms and Conditions containing standard terms of stock options granted to our executive officers under our 2010 Omnibus Incentive Plan. Incorporated by reference to Exhibit 10.E to the Company's Annual Report on Form 10-K for the fiscal year ended January 31, 2011. | |
*E. | Form of Stock Option Agreement Terms and Conditions containing standard terms of stock options granted in fiscal years 2009 and 2010 to executive officers under the Company's stock option plans. Incorporated by reference to Exhibit 10.1 to the Company's Quarterly Report on Form 10-Q for the quarter ended April 30, 2009. | |
*F. | Form of Stock Option Agreement Terms and Conditions containing standard terms of stock options granted on October 9, 2007 to executive officers under our stock option plans. Incorporated by reference to Exhibit 10.A to the Company's Quarterly Report on Form 10-Q for the quarter ended October 31, 2007. | |
*G. | Form of Amendment to Nonqualified Stock Options containing additional standard terms of nonqualified stock options granted to executives under the Company's stock option plans. Incorporated by reference to Exhibit 10.B to the Company's Current Report on Form 8-K filed on November 2, 2004. | |
*H. | Form of Performance-Based Restricted Stock Unit Award Agreement Terms and Conditions containing standard terms of performance-based restricted stock units granted to executive officers in fiscal year 2015 under our 2010 Omnibus Incentive Plan. Incorporated by reference to Exhibit 10.A to the Company's Quarterly Report on Form 10-Q for the quarter ended October 31, 2014. | |
*I. | Form of Performance-Based Restricted Stock Unit Award Agreement Terms and Conditions containing standard terms of performance-based restricted stock units granted to executive officers in fiscal year 2016 under our 2010 Omnibus Incentive Plan. Incorporated by reference to Exhibit 10.B to the Company's Quarterly Report on Form 10-Q for the quarter ended October 31, 2015. | |
*J. | Form of Performance-Based Restricted Stock Unit Award Agreement Terms and Conditions containing standard terms of performance-based restricted stock units granted to executive officers in fiscal year 2017 under our 2010 Omnibus Incentive Plan. Incorporated by reference to Exhibit 10.A to the Company's Quarterly Report on Form 10-Q for the quarter ended October 31, 2016. | |
*K. | Form of Restricted Stock Unit Award Agreement Terms and Conditions containing standard terms of time-based restricted stock units granted in fiscal years 2014 and 2015 to executive officers under our 2010 Omnibus Incentive Plan. Incorporated by reference to Exhibit 10.I to the Company's Annual Report on Form 10-K for the fiscal year ended January 31, 2014. | |
*L. | Form of Restricted Stock Unit Award Agreement Terms and Conditions containing standard terms of time-based restricted stock units granted in fiscal years 2016 and 2017 to executive officers under our 2010 Omnibus Incentive Plan. Incorporated by reference to Exhibit 10.A to the Company's Quarterly Report on Form 10-Q for the quarter ended October 31, 2015. | |
*M. | Executive Variable Incentive Plan. Incorporated by reference to Exhibit 10.A to the Company's Current Report on Form 8-K filed on June 5, 2012. | |
*N. | Form of Indemnity Agreement entered into between the Company and each of its executive officers and current and future directors. Incorporated by reference to Exhibit 10.I to the Company's Quarterly Report on Form 10-Q for the quarter ended July 31, 2008. | |
*O. | Form of Severance Agreement entered into between the Company and each executive officer of the Company. Incorporated by reference to Exhibit 10.A to the Company's Quarterly Report on Form 10-Q for the quarter ended April 30, 2015. | |
*P. | Officer Stock Ownership Policy. Incorporated by reference to Exhibit 10.N to the Company's Annual Report on Form 10-K for the fiscal year ended January 31, 2011. | |
*Q. | Form of Agreement to Policy for Recovery of Incentive Compensation. Incorporated by reference to Exhibit 10.O to the Company's Annual Report on Form 10-K for the fiscal year ended January 31, 2011. | |
R. | Stock Purchase Agreement dated February 18, 2016 between the Company and affiliates of Carl C. Icahn (the “Icahn Group”). Incorporated by reference to Exhibit 10.1 to the Company's Current Report on Form 8-K filed on February 19, 2016. | |
S. | Support Letter between Siemens Aktiengesellschaft and Mentor Graphics Corporation, dated November 12, 2016. Incorporated by reference to Exhibit 10.1 to the Company's Current Report on Form 8-K filed on November 14, 2016. | |
98
T. | Support Agreement among Elliott Associates, L.P., Elliott International, L.P., Elliott International Capital Advisors Inc., Siemens Industry, Inc. and Mentor Graphics Corporation, dated November 12, 2016. Incorporated by reference to Exhibit 10.2 to the Company's Current Report on Form 8-K filed on November 14, 2016. | |
21. | List of Subsidiaries of the Company. | |
23. | Consent of KPMG, LLP Independent Registered Public Accounting Firm. | |
31.1 | Certification of Chief Executive Officer of Registrant Pursuant to SEC Rule 13a-14(a)/15d-14(a), as Adopted Pursuant to Section 302 of the Sarbanes-Oxley Act of 2002. | |
31.2 | Certification of Chief Financial Officer of Registrant Pursuant to SEC Rule 13a-14(a)/15d-14(a), as Adopted Pursuant to Section 302 of the Sarbanes-Oxley Act of 2002. | |
32. | Certification of Chief Executive Officer and Chief Financial Officer of Registrant Pursuant to 18 U.S.C. Section 1350, as Adopted Pursuant to Section 906 of the Sarbanes-Oxley Act of 2002. | |
101.INS | XBRL Instance Document | |
101.SCH | XBRL Taxonomy Extension Schema Document | |
101.CAL | XBRL Taxonomy Extension Calculation Linkbase Document | |
101.DEF | XBRL Taxonomy Extension Definition Linkbase Document | |
101.LAB | XBRL Taxonomy Extension Label Linkbase Document | |
101.PRE | XBRL Taxonomy Extension Presentation Linkbase Document | |
* | Management contract or compensatory plan or arrangement. |
99
SIGNATURES
Pursuant to the requirements of Section 13 or 15(d) of the Securities Exchange Act of 1934, the registrant has duly caused this report to be signed on its behalf by the undersigned, thereunto duly authorized.
MENTOR GRAPHICS CORPORATION | ||||
Dated: | March 17, 2017 | By | /S/ WALDEN C. RHINES | |
Walden C. Rhines | ||||
Chief Executive Officer | ||||
Pursuant to the requirements of the Securities Exchange Act of 1934, this report has been signed by the following persons on behalf of the registrant in the capacities and on the dates indicated.
(1) | Principal Executive Officer: | |||
/S/ WALDEN C. RHINES | Chief Executive Officer | March 17, 2017 | ||
Walden C. Rhines | ||||
(2) | Principal Financial Officer: | |||
/S/ GREGORY K. HINCKLEY | President, Chief Financial Officer | March 17, 2017 | ||
Gregory K. Hinckley | ||||
(3) | Principal Accounting Officer: | |||
/S/ RICHARD P. TREBING | Vice President Finance, Chief Accounting Officer | March 17, 2017 | ||
Richard P. Trebing | ||||
(4) | Directors: | |||
/S/ WALDEN C. RHINES | Chairman of the Board | March 17, 2017 | ||
Walden C. Rhines | ||||
Director | ||||
Keith L. Barnes | ||||
/S/ SIR PETER L. BONFIELD | Director | March 13, 2017 | ||
Sir Peter L. Bonfield | ||||
/S/ PAUL A. MASCARENAS | Director | March 14, 2017 | ||
Paul A. Mascarenas | ||||
/S/ J. DANIEL MCCRANIE | Director | March 17, 2017 | ||
J. Daniel McCranie | ||||
/S/ CHERYL L. SHAVERS | Director | March 13, 2017 | ||
Cheryl L. Shavers | ||||
/S/ JEFFREY M. STAFEIL | Director | March 11, 2017 | ||
Jeffrey M. Stafeil | ||||
100