Attached files
| file | filename |
|---|---|
| 8-K - CURRENT REPORT OF MATERIAL EVENTS OR CORPORATE CHANGES - TENET HEALTHCARE CORP | a12-2317_18k.htm |
| EX-99.1 - EX-99.1 - TENET HEALTHCARE CORP | a12-2317_1ex99d1.htm |
Exhibit 99.2
|
|
Tenet Healthcare Corporation 30th Annual J.P. Morgan Healthcare Conference January 9, 2012 |
|
|
Forward-looking statements Certain statements contained in this presentation constitute “forward-looking statements” within the meaning of Section 27A of the Securities Act of 1933 and Section 21E of the Securities Exchange Act of 1934. Such forward-looking statements are based on management's current expectations and involve known and unknown risks, uncertainties and other factors that may cause the Company’s actual results to be materially different from those expressed or implied by such forward-looking statements. Such factors include, among others, the following: the passage of heath care reform legislation and the enactment of additional federal and state health care reform; other changes in federal, state and local laws and regulations affecting the health care industry; general economic and business conditions, both nationally and regionally; demographic changes; changes in, or the failure to comply with, laws and governmental regulations; the ability to enter into managed care provider arrangements on acceptable terms; changes in Medicare and Medicaid payments or reimbursement; liability and other claims asserted against the Company; competition, including the Company’s ability to attract patients to its hospitals; technological and pharmaceutical improvements that increase the cost of providing, or reduce the demand for, health care; changes in business strategy or development plans; the ability to attract and retain qualified personnel, including physicians, nurses and other health care professionals, and the impact on the Company’s labor expenses resulting from a shortage of nurses or other health care professionals; the significant indebtedness of the Company; the Company's ability to integrate new businesses with its existing operations; the availability and terms of capital to fund the expansion of the Company's business, including the acquisition of additional facilities; the creditworthiness of counterparties to the Company’s business transactions; adverse fluctuations in interest rates and other risks related to interest rate swaps or any other hedging activities the Company undertakes; the ability to continue to expand and realize earnings contributions from the revenue cycle management, health care information management, capitation management, and patient communications services businesses under our Conifer Health Solutions (“Conifer”) subsidiary by marketing these services to third party hospitals and other health care-related entities; and its ability to identify and execute on measures designed to save or control costs or streamline operations. Such factors also include the positive and negative effects of health reform legislation on reimbursement and utilization and the future designs of provider networks and insurance plans, including pricing, provider participation, coverage and co-pays and deductibles, all of which contain significant uncertainty, and for which multiple models exist which may differ materially from the company's expectations. Certain additional risks and uncertainties are discussed in the Company’s filings with the Securities and Exchange Commission, including the Company’s annual report on Form 10-K and quarterly reports on Form 10-Q. The Company specifically disclaims any obligation to update any forward-looking statement, whether as a result of changes in underlying factors, new information, future events or otherwise. This presentation includes certain financial measures, such as adjusted EBITDA, that are not calculated in accordance with generally accepted accounting principles (GAAP). Management recommends that you focus on the GAAP numbers as the best indicator of financial performance. These alternative measures are provided only as a supplement to aid in analysis of the Company. Reconciliation between non-GAAP measures and related GAAP measures can be found at the end of this presentation. Non-GAAP Information 2 |
|
|
99 free-standing outpatient centers 65 imaging centers 25 ambulatory surgery centers 8 urgent care centers 1 free-standing ERs 12 states More than 4 million visits (LTM) 15 centers acquired in 2011 24 centers acquired in 2010 3 Business model 50 hospitals 11 states More than 500,000 admissions (LTM) Concentrated position in 14 of 18 markets #1 or 2 in 6 of 18 markets Tenet Healthcare Providing Value through Sustainable Growth Conifer Health Solutions Acute Care Hospitals Revenue Cycle Services Patient Communications Capitation Management More than 300 total healthcare entities Outpatient Centers |
|
|
High growth markets 50 acute care hospitals 99 OP centers (free-standing) Acute Care Hospitals Diagnostic Imaging Centers (DICs) Ambulatory Surgery Centers (ASCs) DIC in development Diversified asset portfolio in attractive markets 4 |

|
|
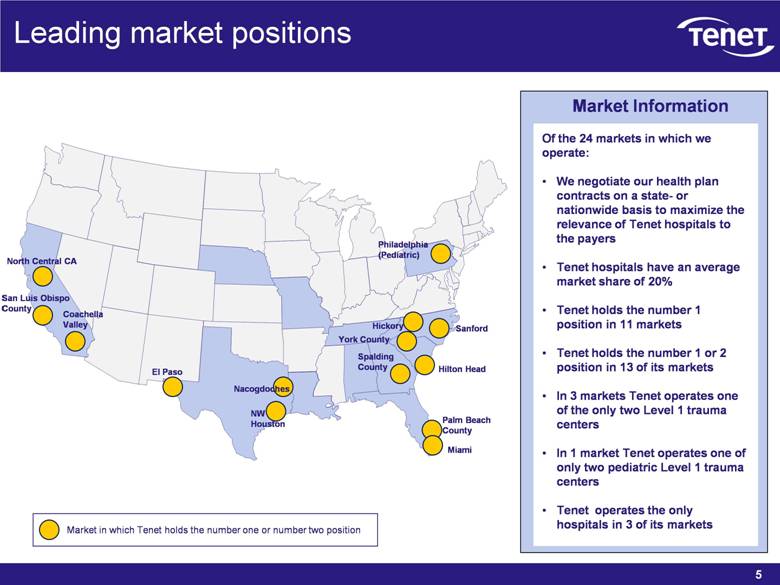
5 Market Information Of the 24 markets in which we operate: We negotiate our health plan contracts on a state- or nationwide basis to maximize the relevance of Tenet hospitals to the payers Tenet hospitals have an average market share of 20% Tenet holds the number 1 position in 11 markets Tenet holds the number 1 or 2 position in 13 of its markets In 3 markets Tenet operates one of the only two Level 1 trauma centers In 1 market Tenet operates one of only two pediatric Level 1 trauma centers Tenet operates the only hospitals in 3 of its markets Leading market positions El Paso North Central CA San Luis Obispo County Coachella Valley Nacogdoches NW Houston Palm Beach County Miami Sanford Hickory York County Hilton Head Spalding County Market in which Tenet holds the number one or number two position Philadelphia (Pediatric) |
|
|
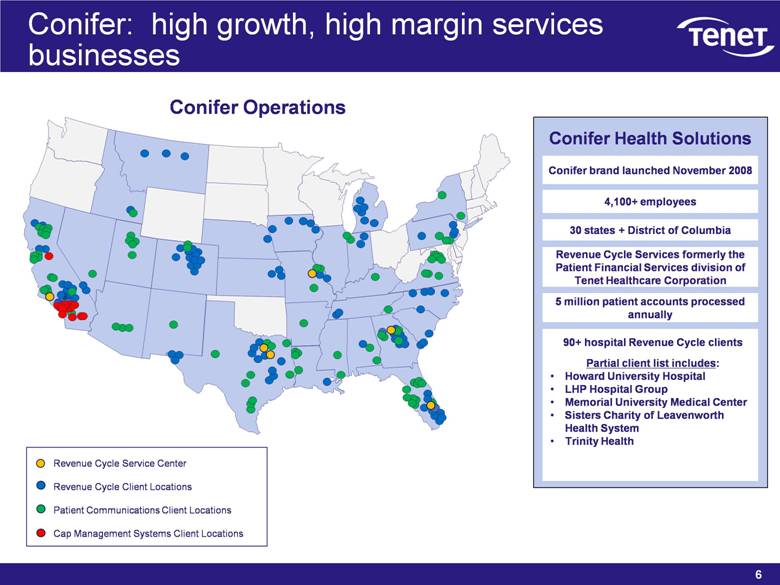
6 Conifer: high growth, high margin services businesses 5 million patient accounts processed annually 30 states + District of Columbia Conifer brand launched November 2008 Revenue Cycle Services formerly the Patient Financial Services division of Tenet Healthcare Corporation Revenue Cycle Service Center Revenue Cycle Client Locations Patient Communications Client Locations Cap Management Systems Client Locations 4,100+ employees Conifer Operations Conifer Health Solutions 90+ hospital Revenue Cycle clients Partial client list includes: Howard University Hospital LHP Hospital Group Memorial University Medical Center Sisters Charity of Leavenworth Health System Trinity Health |
|
|
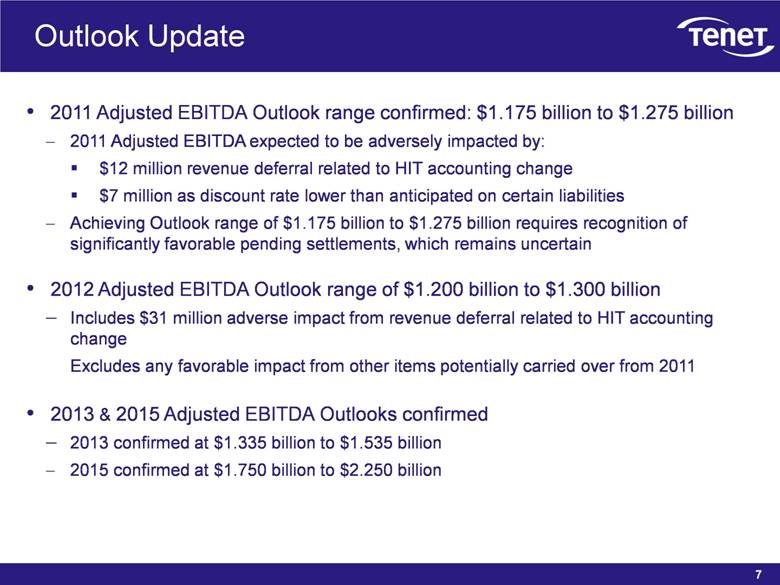
7 Outlook Update 2011 Adjusted EBITDA Outlook range confirmed: $1.175 billion to $1.275 billion 2011 Adjusted EBITDA expected to be adversely impacted by: $12 million revenue deferral related to HIT accounting change $7 million as discount rate lower than anticipated on certain liabilities Achieving Outlook range of $1.175 billion to $1.275 billion requires recognition of significantly favorable pending settlements, which remains uncertain 2012 Adjusted EBITDA Outlook range of $1.200 billion to $1.300 billion Includes $31 million adverse impact from revenue deferral related to HIT accounting change Excludes any favorable impact from other items potentially carried over from 2011 2013 & 2015 Adjusted EBITDA Outlooks confirmed 2013 confirmed at $1.335 billion to $1.535 billion 2015 confirmed at $1.750 billion to $2.250 billion |
|
|
Conservative assumptions drive growth through 2015 8 Key assumptions: Volumes: Admissions growth: Maintain assumption of core average annual growth below 1% 2015 admissions modestly higher than last year’s Outlook as starting from a higher 2011 base Outpatient acquisitions only assumed through 2013, representing a sub-set of the current pipeline Pricing pressure higher today than assumed a year ago Commercial pricing growth assumed to slow to 5% CAGR beginning in 2013 But now, more conservative assumption of only 4-5% increases by 2015 Revenues: 4-6% aggregate CAGR Costs: MPI assumes $50 million annual declines in operating expense (2013-2015)despite much stronger MPI progress in 2011 ($70 million) and $80 million expected in 2012 Operating leverage improves cost metrics Bad debt assumes collection rates only recover to pre-recession levels More conservative than could be justified given Conifer’s increasingly effective collection techniques |

|
|
9 Headwinds and tailwinds in outlook compared to one year ago Tailwinds No Change Headwinds Aggregate volume growth & strengthening commercial volumes Medicare Performance Initiative (MPI) cost savings New and/or expanded Provider fee programs in Pennsylvania and California Medicare reimbursement rates Commercial pricing Conifer Acuity Bad debt expense Medicaid reimbursement Payer mix Healthcare Information Technology accounting for incentives |
|
|
2006 Annual Growth – Same Hospital Volumes: admissions and outpatient visits Improving growth trend through mid-2009 Growth resumes Recession effects 10 O/P Visits Paying(1) 2007 2008 2010 2009 2011 (1) Paying admissions/visits are defined as total admissions/visits less charity and uninsured admissions/visits. -10.0% -8.0% -6.0% -4.0% -2.0% 0.0% 2.0% 4.0% 6.0% 8.0% Q1 Q2 Q3 Q4 Q1 Q2 Q3 Q4 Q1 Q2 Q3 Q4 Q1 Q2 Q3 Q4 Q1 Q2 Q3 Q4 Q1 Q2 Q3 |
|
|
Adjusted EBITDA shows attractive organic growth trend $ Millions Adjusted EBITDA Margin Adjusted EBITDA(1) Adjusted EBITDA Margin 11 (1) Data reflects the results of our existing 50 hospitals. $1,175 / 12.1% 16% CAGR (to low end of 2011 Outlook Range) $1,275 / 12.9% Outlook Range $422 $543 $631 $658 $739 $982 $1,050 5.5% 7.2% 8.2% 8.1% 8.6% 10.9% 11.4% 3% 5% 7% 9% 11% 13% $100 $400 $700 $1,000 $1,300 2004 2005 2006 2007 2008 2009 2010 2011 |
|
|
12 Tenet’s consistent EBITDA improvement relative to peers has narrowed the margin gap Tenet is on track to exceed current industry average margins (1) Peer Average EBITDA margin of Community Health Systems, Hospital Corporation of America, Health Management Associates, LifePoint, Universal Health Services and Vanguard Health Systems. Last 12 months as of 9/30/11. Peer Avg: (220bps) Tenet: 640bps 2004–LTM 2011 Change 2.2% 14.1% 11.9% 10.8% Peer Average Margin(1) 16.3% 5.5% THC EBITDA Margin |

|
|
Tenet’s growth record has outperformed its peers Peer Average Admissions Growth 79% 47% 58% 68% 58% 63% EBITDA Growth 58% 68% 63% 58% 47% 58% Percentage of quarters(1) since Q1’07 in which Tenet’s same-hospital growth met or exceeded its peers: 13 (1) Based on 19 quarters from Q1’07 to Q3’11. |
|
|
Tenet’s leverage among the lowest in our sector HCA HMA Vanguard (2) THC LPNT UHS(3) 2008 September 30, 2011 THC CYH Leverage Ratio(1) 14 (1) Total debt less Cash and Cash Equivalents / LTM EBITDA; (2) Vanguard adjusted for recent major acquisition; (3) UHS adjusted for the Psychiatric Solutions acquisition. 5.8 x 4.7 x 4.5 x 4.2 x 3.7 x 3.5 x 3.1 x 2.6 x 1 2 3 4 5 6 2008 2009 2009 2009 2009 2009 2009 2009 |
|
|
Near-term debt maturities extended and reduced (millions) December 2008 Existing 12/31/08 debt which remains outstanding Debt issued since 01/01/2009 (millions) 6.5 % 7.375% 9.875% 6.875% 9.25% 10.0%(2) 6.25%(2) 8.875%(2) 8.0% 9.0%(2) Weighted Average Maturity of 7.5 years December 2011(1) 15 (1) 2011 transactions include the November issuance of $900M – 6.25% Sr. Secured Debt maturing 05/01/2018, the November repurchase of $713M 9% Sr. Secured Debt maturing 05/01/2015 and the December principal repayment of $65M – 6.375% Sr. Unsecured Debt; (2) Secured Debt. 6.375% 6.5 % 7.375% 9.875% 6.875% 9.25% |

|
|
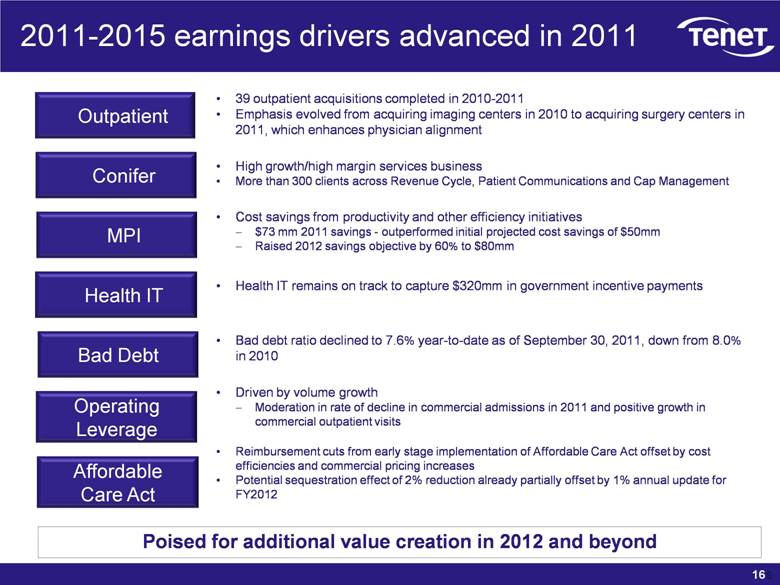
39 outpatient acquisitions completed in 2010-2011 Emphasis evolved from acquiring imaging centers in 2010 to acquiring surgery centers in 2011, which enhances physician alignment High growth/high margin services business More than 300 clients across Revenue Cycle, Patient Communications and Cap Management Cost savings from productivity and other efficiency initiatives $73 mm 2011 savings - outperformed initial projected cost savings of $50mm Raised 2012 savings objective by 60% to $80mm Health IT remains on track to capture $320mm in government incentive payments Bad debt ratio declined to 7.6% year-to-date as of September 30, 2011, down from 8.0% in 2010 Driven by volume growth Moderation in rate of decline in commercial admissions in 2011 and positive growth in commercial outpatient visits Reimbursement cuts from early stage implementation of Affordable Care Act offset by cost efficiencies and commercial pricing increases Potential sequestration effect of 2% reduction already partially offset by 1% annual update for FY2012 16 Poised for additional value creation in 2012 and beyond Outpatient Conifer MPI Health IT Bad Debt Operating Leverage Affordable Care Act 2011-2015 earnings drivers advanced in 2011 |
|
|
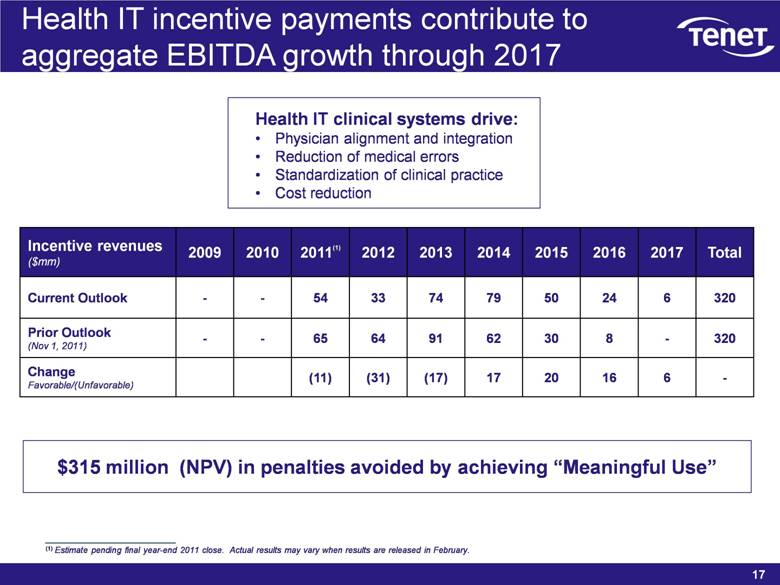
17 Health IT incentive payments contribute to aggregate EBITDA growth through 2017 Incentive revenues ($mm) 2009 2010 2011(1) 2012 2013 2014 2015 2016 2017 Total Current Outlook - - 54 33 74 79 50 24 6 320 Prior Outlook (Nov 1, 2011) - - 65 64 91 62 30 8 - 320 Change Favorable/(Unfavorable) (11) (31) (17) 17 20 16 6 - Health IT clinical systems drive: Physician alignment and integration Reduction of medical errors Standardization of clinical practice Cost reduction (1) Estimate pending final year-end 2011 close. Actual results may vary when results are released in February. $315 million (NPV) in penalties avoided by achieving “Meaningful Use” |
|
|
$2.2 billion NOL enhances cash flow Proven strategies for further growth Transparent disclosure Diversified earnings streams 18 Compelling investment value Upside potential from economic cycle Investment Value Gap between Tenet’s current multiple and industry’s is worth $2.00/share Track record of superior growth Upside from Affordable Care Act Strong cash flow growth expectation |
|
|
Reconciliation of EBITDA Adjusted EBITDA, a non-GAAP term, is defined by the Company as net income (loss) attributable to Tenet Healthcare Corporation common shareholders before (1) cumulative effect of changes in accounting principle, net of tax, (2) net income attributable to noncontrolling interests, (3) preferred stock dividends, (4) income (loss) from discontinued operations, net of tax, (5) income tax (expense) benefit, (6) investment earnings (loss), (7) gain (loss) from early extinguishment of debt, (8) net gain (loss) on sales of investments, (9) interest expense, (10) litigation and investigation (costs) benefit, net of insurance recoveries, (11) hurricane insurance recoveries, net of costs, (12) impairment of long-lived assets and goodwill and restructuring charges, net of insurance recoveries, and (13) depreciation and amortization. The Company’s Adjusted EBITDA may not be comparable to EBITDA reported by other companies. The Company provides this information as a supplement to GAAP information to assist itself and investors in understanding the impact of various items on its financial statements, some of which are recurring or involve cash payments. The Company uses this information in its analysis of the performance of its business excluding items that it does not consider as relevant in the performance of its hospitals in continuing operations. Adjusted EBITDA is not a measure of liquidity, but is a measure of operating performance that management uses in its business as an alternative to net income (loss) attributable to Tenet Healthcare Corporation common shareholders. Because Adjusted EBITDA excludes many items that are included in our financial statements, it does not provide a complete measure of our operating performance. Accordingly, investors are encouraged to use GAAP measures when evaluating the Company’s financial performance. The reconciliation of net income (loss) attributable to Tenet Healthcare Corporation common shareholders, the most comparable GAAP term, to Adjusted EBITDA, is set forth below. Dollars in Millions Low High Low High Low High Low High 2004 2005 2006 2007 2008 2009 2010 2011 2012 2013 2015 Net Income (Loss) Attributable to Common Shareholders $ (2,806) $ (724) $ (803) $ (89) $ 25 $ 181 $ 1,119 $ 64 $ 153 $ 201 $ 272 $ 306 $ 451 $ 578 $ 911 Less: Net income (loss) from noncontrolling interests 3 (2) (7) (5) (7) (10) (9) (15) (10) (15) (10) (15) (10) (15) (10) Preferred stock dividends 0 0 0 0 0 (6) (24) (24) (24) (18) (18) 0 0 0 0 Income (loss) from cumulative effect of accounting change 0 (16) 2 0 0 0 0 0 0 0 0 0 0 0 0 Income (loss) from discontinued operations, net of tax (1,037) (425) 32 (49) (47) (31) 17 (15) (10) (10) (5) (5) 0 (5) 0 Income (loss) from continuing operations (1,772) (281) (830) (35) 79 228 1,135 118 197 244 305 326 461 598 921 Income tax benefit (expense) (300) 82 258 61 25 23 977 (62) (113) (156) (195) (209) (294) (382) (589) Income (loss) from continuing operations, before income taxes (1,472) (363) (1,088) (96) 54 205 158 180 310 400 500 535 755 980 1,510 Net gain on sales of investments 7 4 5 0 139 15 0 0 0 0 0 0 0 0 0 Investment earnings 20 59 62 47 22 0 5 5 5 0 0 0 0 0 0 Interest expense (333) (403) (408) (419) (418) (445) (424) (385) (365) (390) (370) (390) (340) (360) (280) Net gain (loss) from extinguishment of long-term debt (13) (15) 0 0 0 97 (57) (120) (115) 0 0 0 0 0 0 Operating income (loss) (1,153) (8) (747) 276 311 538 634 680 785 790 870 925 1,095 1,340 1,790 Litigation and investigation costs (74) (212) (766) (13) (41) (31) (12) (60) (55) 0 0 0 0 0 0 Hurricane insurance recoveries, net of costs 0 (7) 14 3 0 0 0 0 0 0 0 0 0 0 0 Impairment of long-lived assets and goodwill, and restructuring charges (1,208) (29) (312) (36) (16) (27) (10) (25) (20) 0 0 0 0 0 0 Depreciation and amortization (293) (303) (314) (336) (371) (386) (394) (410) (415) (410) (430) (410) (440) (410) (460) Adjusted EBITDA $ 422 $ 543 $ 631 $ 658 $ 739 $ 982 $ 1,050 $ 1,175 $ 1,275 $ 1,200 $ 1,300 $ 1,335 $ 1,535 $ 1,750 $ 2,250 EPS - Continuing Ops - reported ($3.81) ($0.60) ($1.76) ($0.08) $0.15 $0.43 $2.01 $0.16 $0.34 $0.47 $0.60 $0.63 $0.92 $1.16 $1.81 EPS - Continuing Ops - normalized* $0.17 $0.30 $0.39 $0.39 $0.44 $0.15 $0.21 $0.41 $0.55 $0.47 $0.60 $0.63 $0.92 $1.16 $1.81 Weighted average shares outstanding (in millions) 467 470 472 475 479 492 502 485 485 489 489 491 491 503 503 Weighted average shares outstanding with preferred conversion (in millions) 507 561 544 544 489 489 491 491 503 503 *Excludes impairment and restructuring charges, litigation and investigation costs, net gain (losses) from early extinguishment of debt, and net gain (losses) |