Attached files
| file | filename |
|---|---|
| 8-K - 8-K - BRUKER CORP | a12-2314_18k.htm |
Exhibit 99.1
|
|
Bruker Corporation (NASDAQ: BRKR) 30th Annual J.P. Morgan Healthcare Conference January 9, 2012 Stacey Desrochers: Treasurer & Director of Investor Relations Collin D‘Silva: President, Bruker Chemical & Applied Markets (CAM) Division Mark Munch, Ph.D.: President, Bruker Nano Surfaces (BNS) Division |
|
|
2 © Copyright 2012 Bruker Corporation. 2 Bruker Corporation Safe Harbor Statement Any statements contained in this presentation that do not describe historical facts may constitute forward-looking statements as that term is defined in the Private Securities Litigation Reform Act of 1995. Any forward-looking statements contained herein are based on current expectations, but are subject to risks and uncertainties that could cause actual results to differ materially from those projected, including, but not limited to, risks and uncertainties relating to adverse changes in conditions in the global economy and volatility in the capital markets, the integration of businesses we have acquired or may acquire in the future, changing technologies, product development and market acceptance of our products, the cost and pricing of our products, manufacturing, competition, dependence on collaborative partners and key suppliers, capital spending and government funding policies, changes in governmental regulations, realization of anticipated benefits from economic stimulus programs, intellectual property rights, litigation, and exposure to foreign currency fluctuations and other risk factors discussed from time to time in our filings with the Securities and Exchange Commission. These and other factors are identified and described in more detail in our filings with the SEC, including, without limitation, our annual report on Form 10-K for the year ended December 31, 2010, our most recent quarterly reports on Form 10-Q and our current reports on Form 8-K. We expressly disclaim any intent or obligation to update these forward-looking statements other than as required by law. Bruker expects to release its Q4-2011 and FY2011 financial results at the end of February 2012, and expects to provide 2012 financial goals at that time. Nothing contained in this presentation should be construed as Bruker’s finalized FY2012 financial guidance, or as Bruker’s specific FY2012 financial goals. INNOVATION WITH INTEGRITY |
|
|
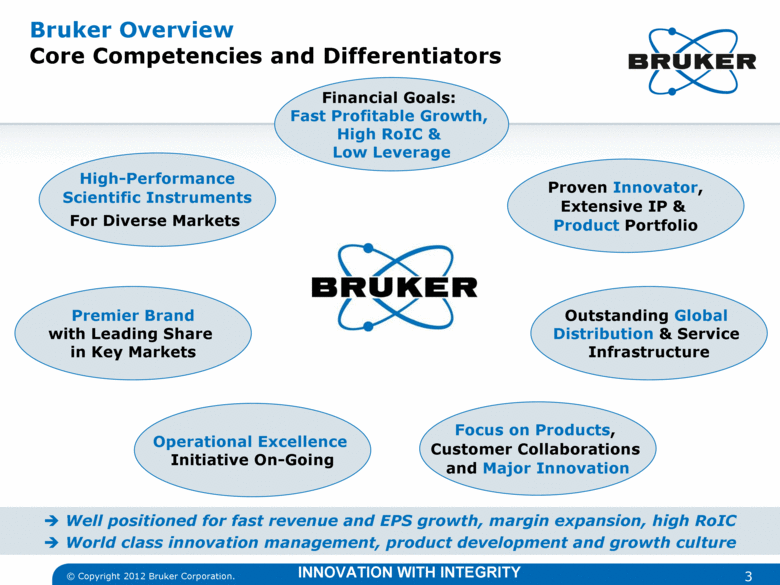
3 © Copyright 2012 Bruker Corporation. Financial Goals: Fast Profitable Growth, High RoIC & Low Leverage High-Performance Scientific Instruments For Diverse Markets Premier Brand with Leading Share in Key Markets Operational Excellence Initiative On-Going Focus on Products, Customer Collaborations and Major Innovation Proven Innovator, Extensive IP & Product Portfolio Outstanding Global Distribution & Service Infrastructure Well positioned for fast revenue and EPS growth, margin expansion, high RoIC World class innovation management, product development and growth culture Bruker Overview Core Competencies and Differentiators INNOVATION WITH INTEGRITY |
|
|
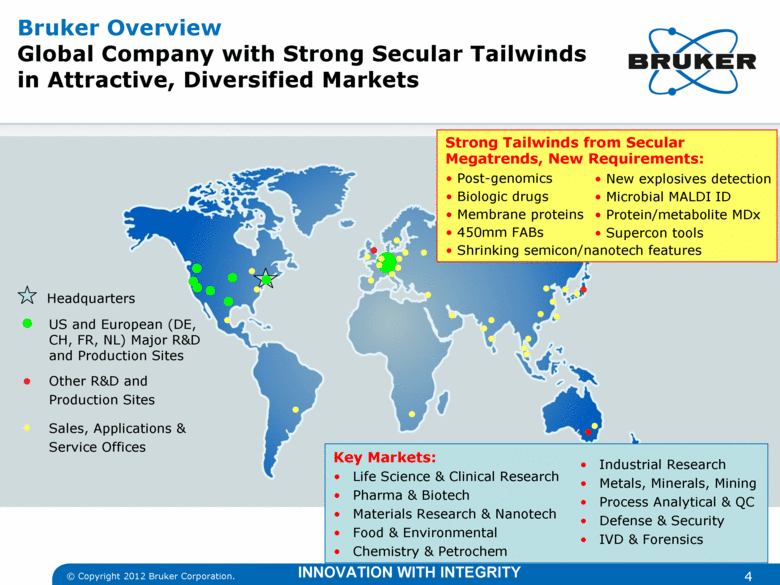
4 © Copyright 2012 Bruker Corporation. Bruker Overview Global Company with Strong Secular Tailwinds in Attractive, Diversified Markets Other R&D and Production Sites Sales, Applications & Service Offices US and European (DE, CH, FR, NL) Major R&D and Production Sites Headquarters Key Markets: Life Science & Clinical Research Pharma & Biotech Materials Research & Nanotech Food & Environmental Chemistry & Petrochem Industrial Research Metals, Minerals, Mining Process Analytical & QC Defense & Security IVD & Forensics INNOVATION WITH INTEGRITY Strong Tailwinds from Secular Megatrends, New Requirements: Post-genomics Biologic drugs Membrane proteins 450mm FABs Shrinking semicon/nanotech features New explosives detection Microbial MALDI ID Protein/metabolite MDx Supercon tools |
|
|
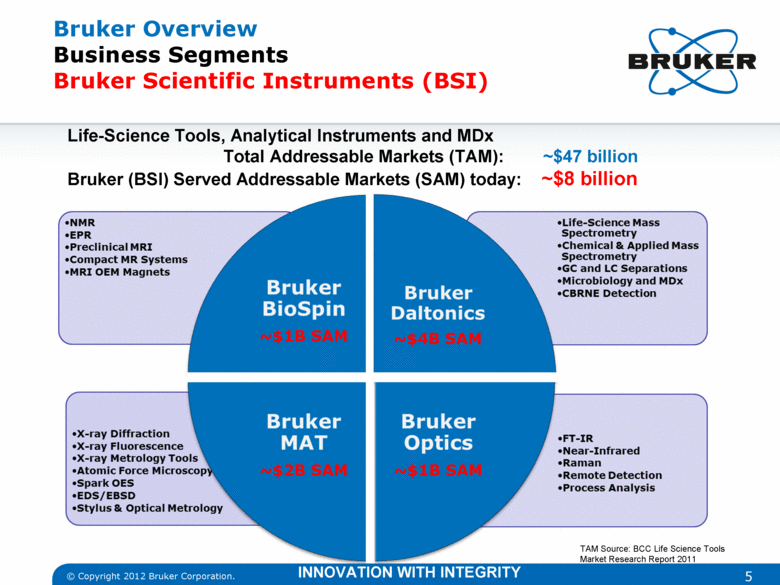
Bruker Overview Business Segments Bruker Scientific Instruments (BSI) © Copyright 2012 Bruker Corporation. 5 TAM Source: BCC Life Science Tools Market Research Report 2011 Life-Science Tools, Analytical Instruments and MDx Total Addressable Markets (TAM): ~$47 billion Bruker (BSI) Served Addressable Markets (SAM) today: ~$8 billion INNOVATION WITH INTEGRITY |
|
|
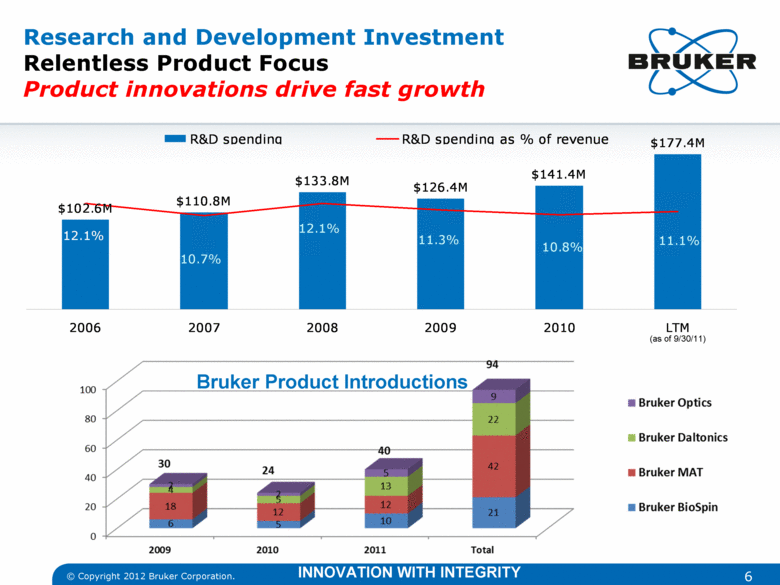
6 © Copyright 2012 Bruker Corporation. Research and Development Investment Relentless Product Focus Product innovations drive fast growth INNOVATION WITH INTEGRITY Bruker Product Introductions (as of 9/30/11) $177.4M $141.4M $126.4M $133.8M $110.8M $102.6M 12.1% 10.7% 12.1% 11.3% 10.8% 11.1% 2006 2007 2008 2009 2010 LTM R&D spending R&D spending as % of revenue |
|
|
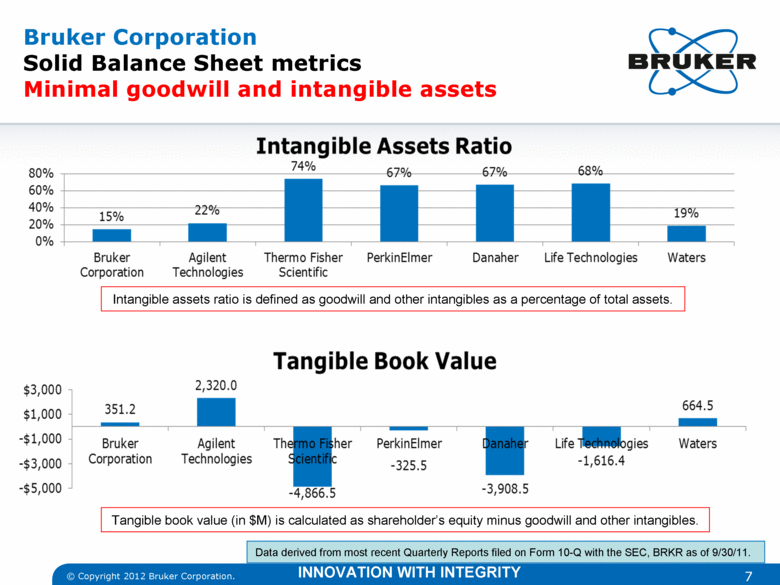
7 © Copyright 2012 Bruker Corporation. Bruker Corporation Solid Balance Sheet metrics Minimal goodwill and intangible assets INNOVATION WITH INTEGRITY Intangible assets ratio is defined as goodwill and other intangibles as a percentage of total assets. Tangible book value (in $M) is calculated as shareholder’s equity minus goodwill and other intangibles. Data derived from most recent Quarterly Reports filed on Form 10-Q with the SEC, BRKR as of 9/30/11. |
|
|
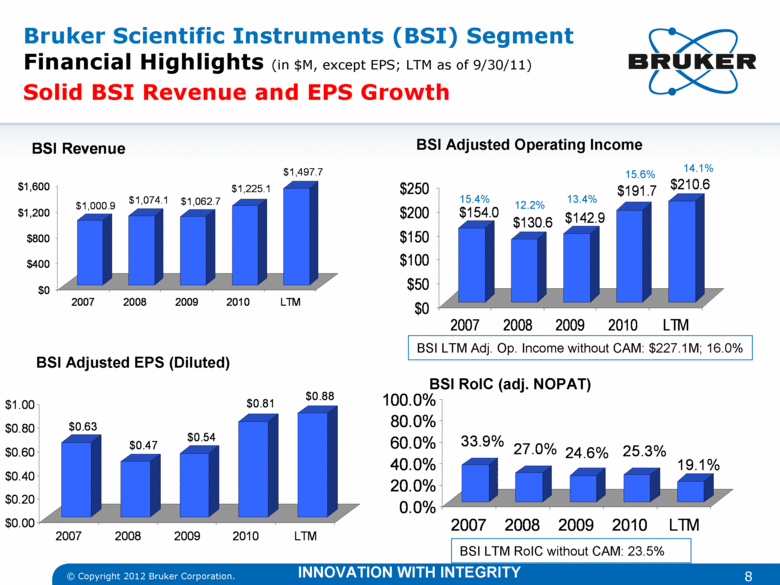
Bruker Scientific Instruments (BSI) Segment Financial Highlights (in $M, except EPS; LTM as of 9/30/11) Solid BSI Revenue and EPS Growth © Copyright 2012 Bruker Corporation. INNOVATION WITH INTEGRITY BSI Adjusted EPS (Diluted) BSI Adjusted Operating Income BSI RoIC (adj. NOPAT) 15.4% 12.2% 13.4% 15.6% 14.1% BSI LTM Adj. Op. Income without CAM: $227.1M; 16.0% BSI LTM RoIC without CAM: 23.5% 8 $1,000.9 $1,074.1 $1,062.7 $1,225.1 $1,497.7 $0 $400 $800 $1,200 $1,600 2007 2008 2009 2010 LTM BSI Revenue 33.9% 27.0% 24.6% 25.3% 19.1% 0.0% 20.0% 40.0% 60.0% 80.0% 100.0% 2007 2008 2009 2010 LTM $154.0 $130.6 $142.9 $191.7 $210.6 $0 $50 $100 $150 $200 $250 2007 2008 2009 2010 LTM |
|
|
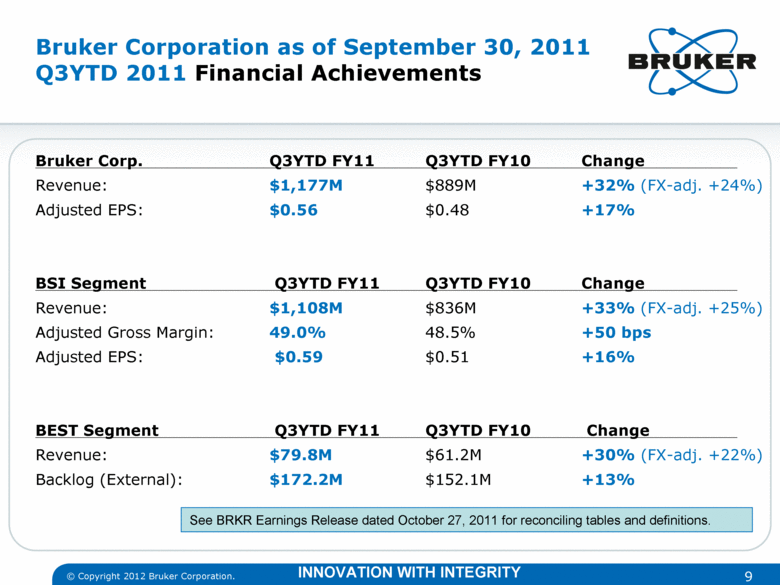
9 © Copyright 2012 Bruker Corporation. Bruker Corporation as of September 30, 2011 Q3YTD 2011 Financial Achievements Bruker Corp. Q3YTD FY11 Q3YTD FY10 Change Revenue: $1,177M $889M +32% (FX-adj. +24%) Adjusted EPS: $0.56 $0.48 +17% BSI Segment Q3YTD FY11 Q3YTD FY10 Change Revenue: $1,108M $836M +33% (FX-adj. +25%) Adjusted Gross Margin: 49.0% 48.5% +50 bps Adjusted EPS: $0.59 $0.51 +16% BEST Segment Q3YTD FY11 Q3YTD FY10 Change Revenue: $79.8M $61.2M +30% (FX-adj. +22%) Backlog (External): $172.2M $152.1M +13% INNOVATION WITH INTEGRITY See BRKR Earnings Release dated October 27, 2011 for reconciling tables and definitions. |
|
|
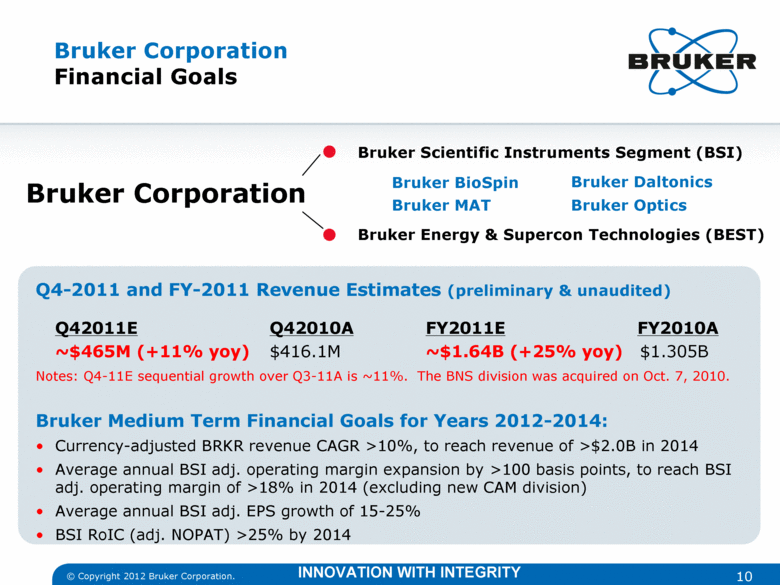
10 © Copyright 2012 Bruker Corporation. Bruker Corporation Bruker BioSpin Bruker MAT Bruker Scientific Instruments Segment (BSI) Bruker Energy & Supercon Technologies (BEST) Bruker Daltonics Bruker Optics Q4-2011 and FY-2011 Revenue Estimates (preliminary & unaudited) Q42011E Q42010A FY2011E FY2010A ~$465M (+11% yoy) $416.1M ~$1.64B (+25% yoy) $1.305B Notes: Q4-11E sequential growth over Q3-11A is ~11%. The BNS division was acquired on Oct. 7, 2010. Bruker Medium Term Financial Goals for Years 2012-2014: Currency-adjusted BRKR revenue CAGR >10%, to reach revenue of >$2.0B in 2014 Average annual BSI adj. operating margin expansion by >100 basis points, to reach BSI adj. operating margin of >18% in 2014 (excluding new CAM division) Average annual BSI adj. EPS growth of 15-25% BSI RoIC (adj. NOPAT) >25% by 2014 Bruker Corporation Financial Goals INNOVATION WITH INTEGRITY |
|
|
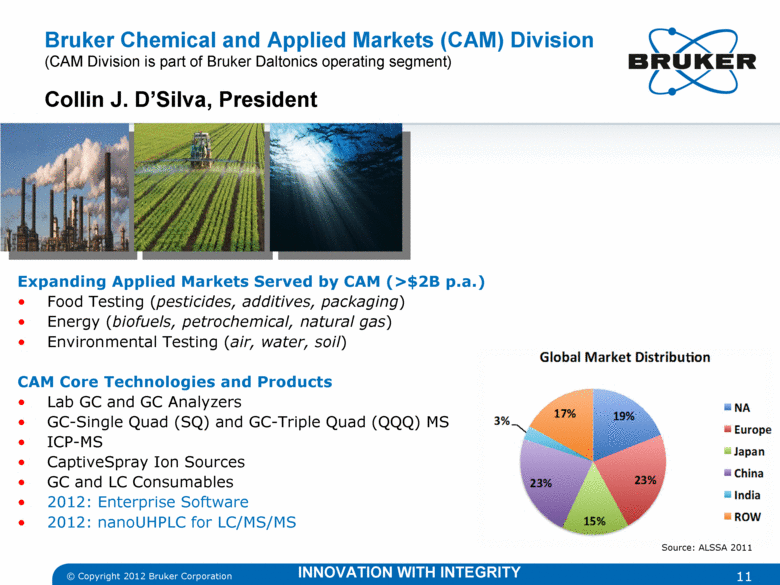
© Copyright 2012 Bruker Corporation 11 Expanding Applied Markets Served by CAM (>$2B p.a.) Food Testing (pesticides, additives, packaging) Energy (biofuels, petrochemical, natural gas) Environmental Testing (air, water, soil) CAM Core Technologies and Products Lab GC and GC Analyzers GC-Single Quad (SQ) and GC-Triple Quad (QQQ) MS ICP-MS CaptiveSpray Ion Sources GC and LC Consumables 2012: Enterprise Software 2012: nanoUHPLC for LC/MS/MS Bruker Chemical and Applied Markets (CAM) Division (CAM Division is part of Bruker Daltonics operating segment) Collin J. D’Silva, President Source: ALSSA 2011 INNOVATION WITH INTEGRITY |
|
|
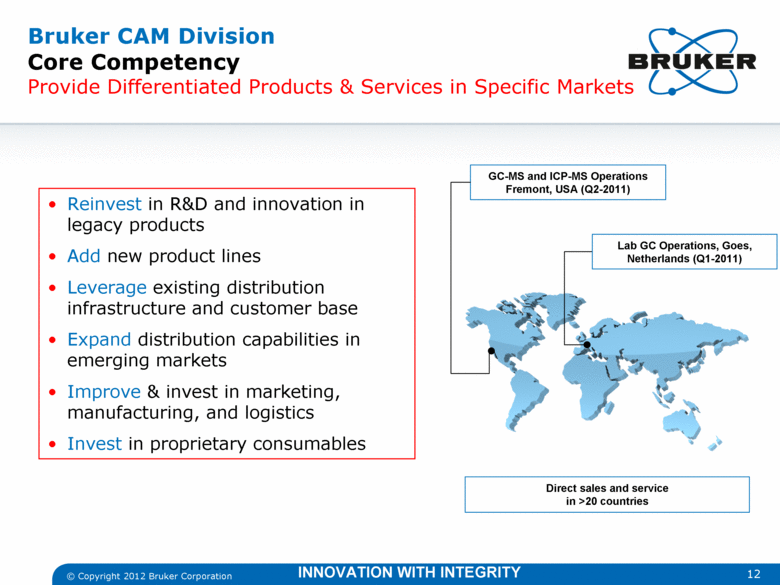
12 Reinvest in R&D and innovation in legacy products Add new product lines Leverage existing distribution infrastructure and customer base Expand distribution capabilities in emerging markets Improve & invest in marketing, manufacturing, and logistics Invest in proprietary consumables GC-MS and ICP-MS Operations Fremont, USA (Q2-2011) © Copyright 2012 Bruker Corporation Lab GC Operations, Goes, Netherlands (Q1-2011) Direct sales and service in >20 countries INNOVATION WITH INTEGRITY Bruker CAM Division Core Competency Provide Differentiated Products & Services in Specific Markets |
|
|
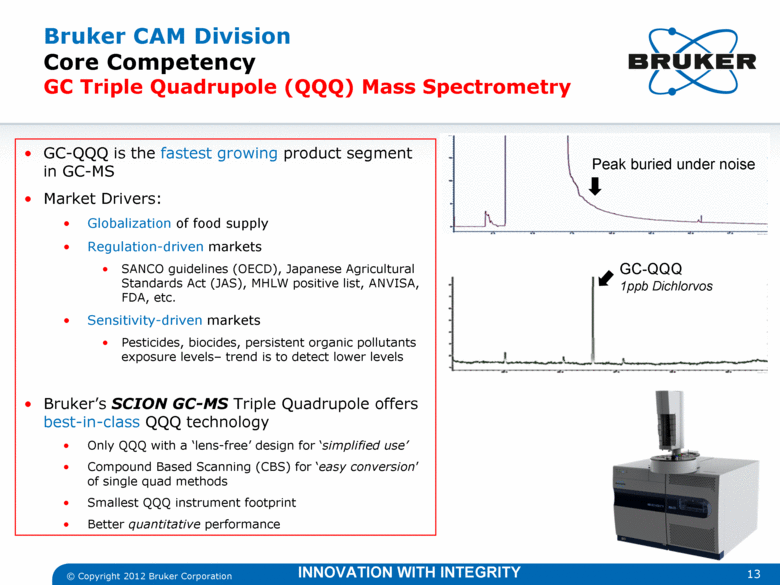
Bruker CAM Division Core Competency GC Triple Quadrupole (QQQ) Mass Spectrometry GC-QQQ is the fastest growing product segment in GC-MS Market Drivers: Globalization of food supply Regulation-driven markets SANCO guidelines (OECD), Japanese Agricultural Standards Act (JAS), MHLW positive list, ANVISA, FDA, etc. Sensitivity-driven markets Pesticides, biocides, persistent organic pollutants exposure levels– trend is to detect lower levels Bruker’s SCION GC-MS Triple Quadrupole offers best-in-class QQQ technology Only QQQ with a ‘lens-free’ design for ‘simplified use’ Compound Based Scanning (CBS) for ‘easy conversion’ of single quad methods Smallest QQQ instrument footprint Better quantitative performance Peak buried under noise GC-QQQ 1ppb Dichlorvos © Copyright 2012 Bruker Corporation 13 INNOVATION WITH INTEGRITY |
|
|
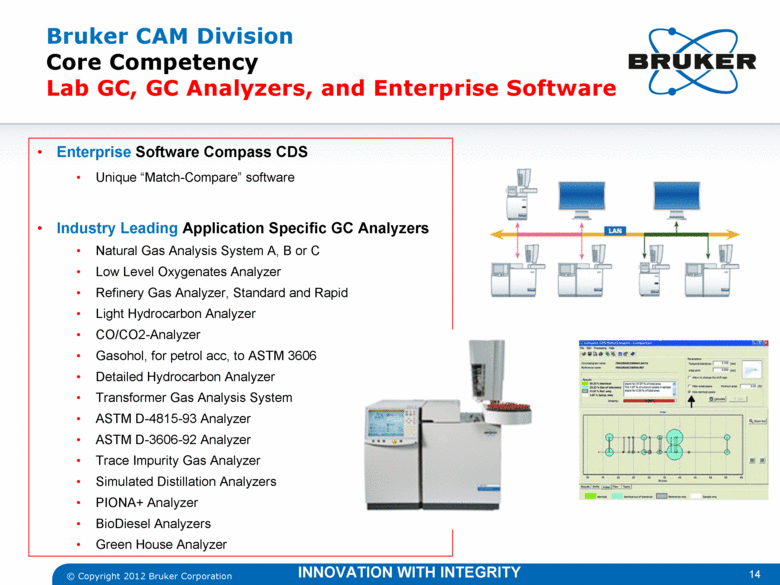
14 Enterprise Software Compass CDS Unique “Match-Compare” software Industry Leading Application Specific GC Analyzers Natural Gas Analysis System A, B or C Low Level Oxygenates Analyzer Refinery Gas Analyzer, Standard and Rapid Light Hydrocarbon Analyzer CO/CO2-Analyzer Gasohol, for petrol acc, to ASTM 3606 Detailed Hydrocarbon Analyzer Transformer Gas Analysis System ASTM D-4815-93 Analyzer ASTM D-3606-92 Analyzer Trace Impurity Gas Analyzer Simulated Distillation Analyzers PIONA+ Analyzer BioDiesel Analyzers Green House Analyzer © Copyright 2012 Bruker Corporation Bruker CAM Division Core Competency Lab GC, GC Analyzers, and Enterprise Software INNOVATION WITH INTEGRITY |
|
|
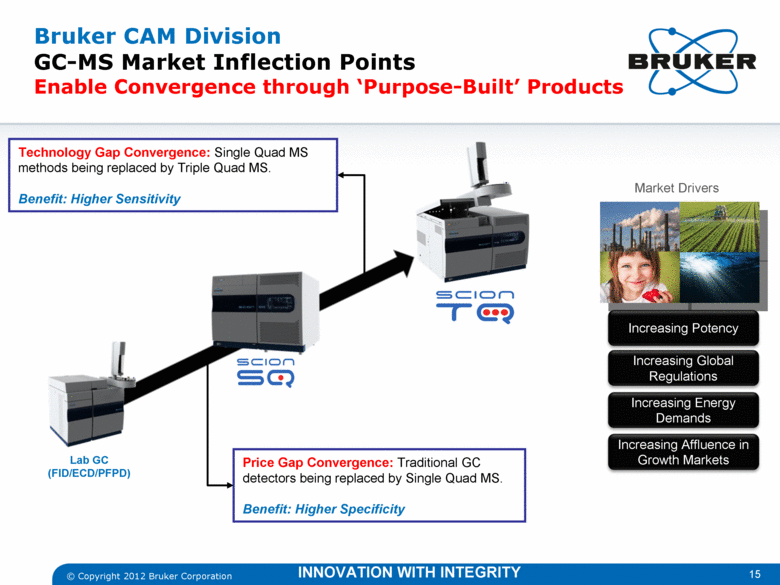
15 © Copyright 2012 Bruker Corporation Lab GC (FID/ECD/PFPD) Price Gap Convergence: Traditional GC detectors being replaced by Single Quad MS. Benefit: Higher Specificity Technology Gap Convergence: Single Quad MS methods being replaced by Triple Quad MS. Benefit: Higher Sensitivity Increasing Potency Increasing Global Regulations Increasing Energy Demands Market Drivers Increasing Affluence in Growth Markets INNOVATION WITH INTEGRITY Bruker CAM Division GC-MS Market Inflection Points Enable Convergence through ‘Purpose-Built’ Products |
|
|
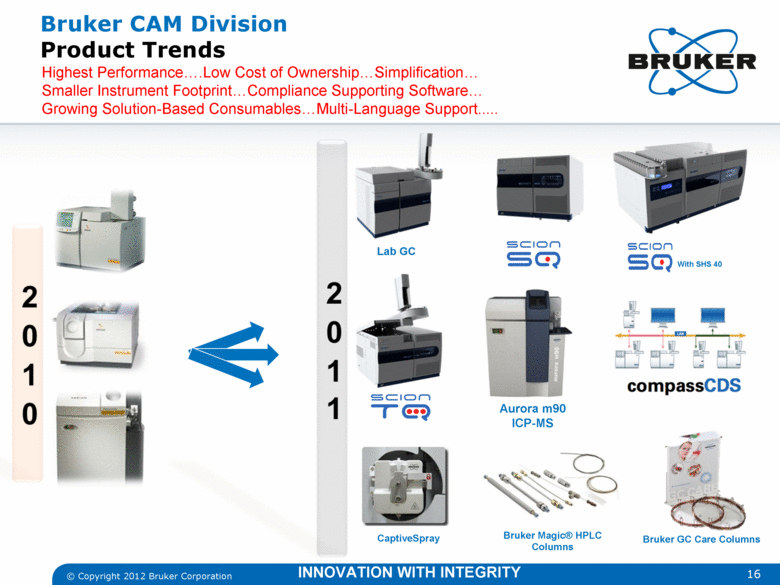
Bruker CAM Division Product Trends © Copyright 2012 Bruker Corporation 16 With SHS 40 Lab GC Aurora m90 ICP-MS CaptiveSpray Bruker Magic® HPLC Columns Bruker GC Care Columns Highest Performance....Low Cost of Ownership...Simplification... Smaller Instrument Footprint...Compliance Supporting Software... Growing Solution-Based Consumables...Multi-Language Support... INNOVATION WITH INTEGRITY |
|
|
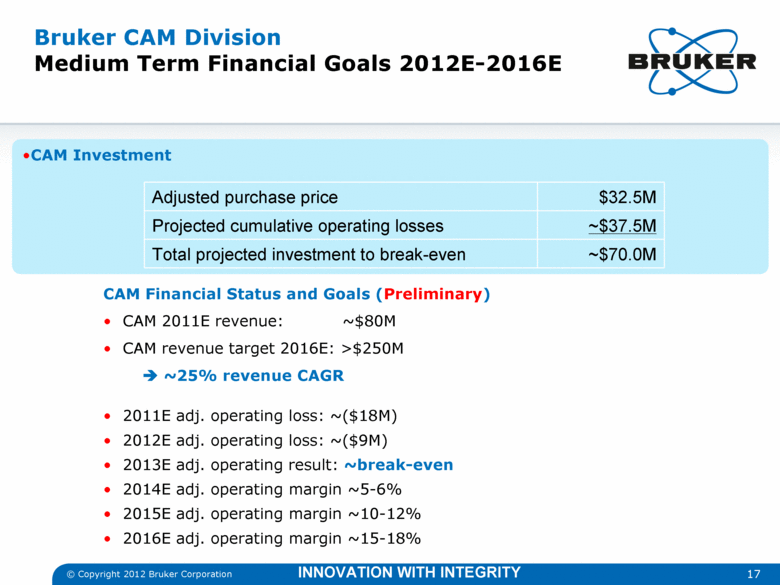
Bruker CAM Division Medium Term Financial Goals 2012E-2016E 17 CAM Financial Status and Goals (Preliminary) CAM 2011E revenue: ~$80M CAM revenue target 2016E: >$250M ~25% revenue CAGR 2011E adj. operating loss: ~($18M) 2012E adj. operating loss: ~($9M) 2013E adj. operating result: ~break-even 2014E adj. operating margin ~5-6% 2015E adj. operating margin ~10-12% 2016E adj. operating margin ~15-18% CAM Investment Adjusted purchase price $32.5M Projected cumulative operating losses ~$37.5M Total projected investment to break-even ~$70.0M © Copyright 2012 Bruker Corporation INNOVATION WITH INTEGRITY |
|
|
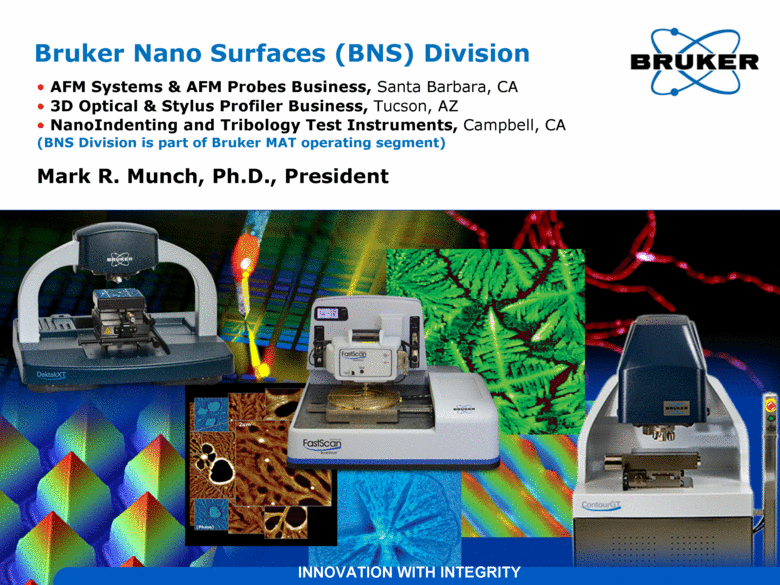
Bruker Nano Surfaces (BNS) Division AFM Systems & AFM Probes Business, Santa Barbara, CA 3D Optical & Stylus Profiler Business, Tucson, AZ NanoIndenting and Tribology Test Instruments, Campbell, CA (BNS Division is part of Bruker MAT operating segment) Mark R. Munch, Ph.D., President INNOVATION WITH INTEGRITY |
|
|
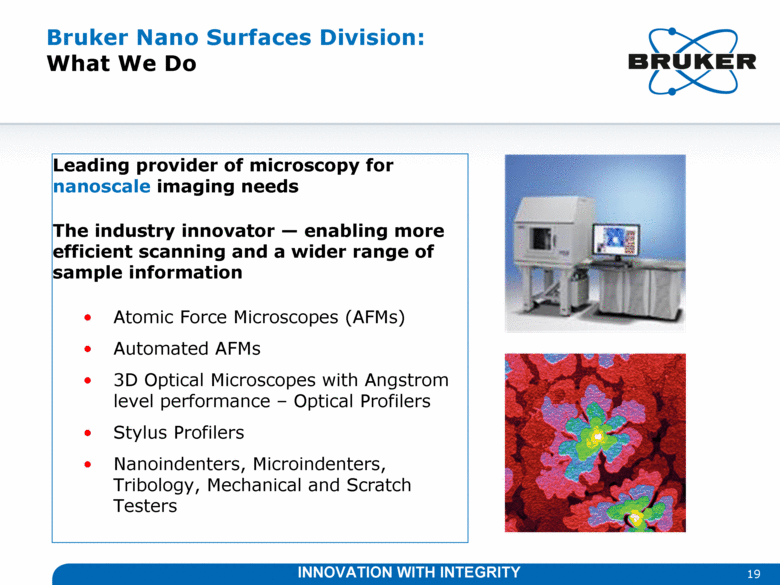
Bruker Nano Surfaces Division: What We Do Leading provider of microscopy for nanoscale imaging needs The industry innovator — enabling more efficient scanning and a wider range of sample information Atomic Force Microscopes (AFMs) Automated AFMs 3D Optical Microscopes with Angstrom level performance – Optical Profilers Stylus Profilers Nanoindenters, Microindenters, Tribology, Mechanical and Scratch Testers 19 INNOVATION WITH INTEGRITY |
|
|
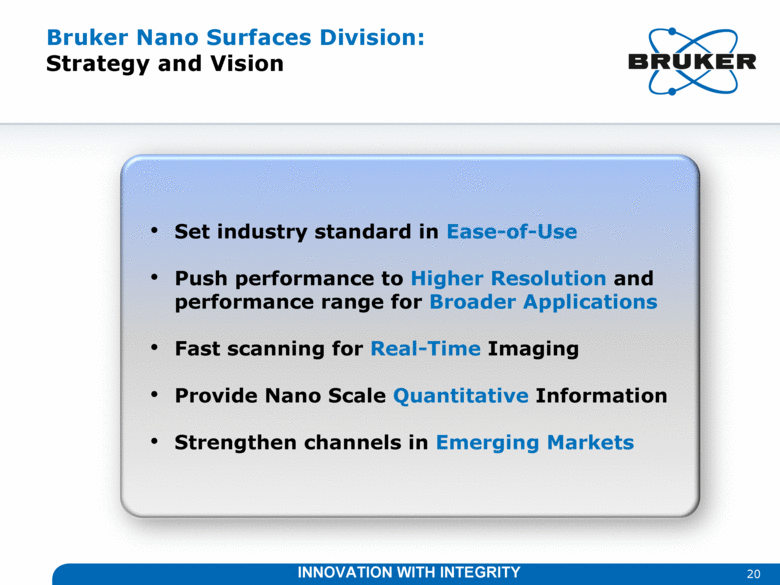
Bruker Nano Surfaces Division: Strategy and Vision 20 Set industry standard in Ease-of-Use Push performance to Higher Resolution and performance range for Broader Applications Fast scanning for Real-Time Imaging Provide Nano Scale Quantitative Information Strengthen channels in Emerging Markets INNOVATION WITH INTEGRITY |
|
|
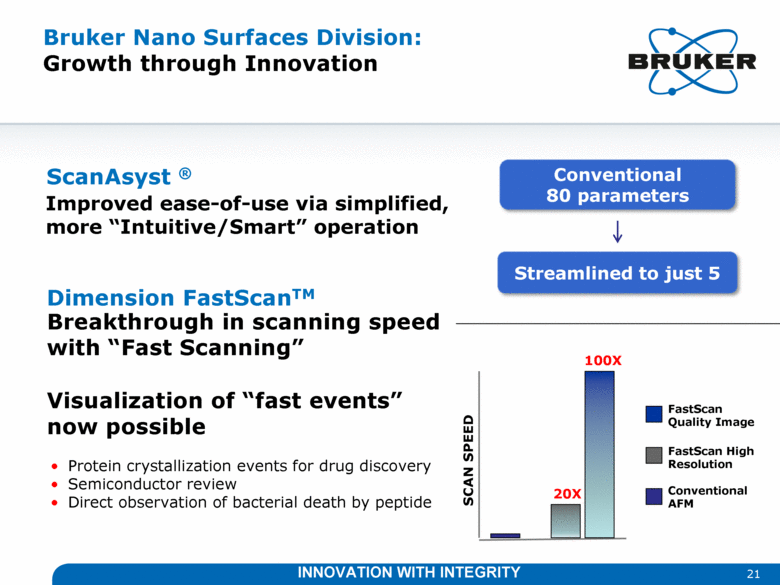
21 Bruker Nano Surfaces Division: Growth through Innovation Breakthrough in scanning speed with “Fast Scanning” Visualization of “fast events” now possible Conventional 80 parameters Streamlined to just 5 Conventional AFM FastScan High Resolution FastScan Quality Image Protein crystallization events for drug discovery Semiconductor review Direct observation of bacterial death by peptide 20X 100X SCAN SPEED Improved ease-of-use via simplified, more “Intuitive/Smart” operation ScanAsyst ® Dimension FastScanTM INNOVATION WITH INTEGRITY |
|
|
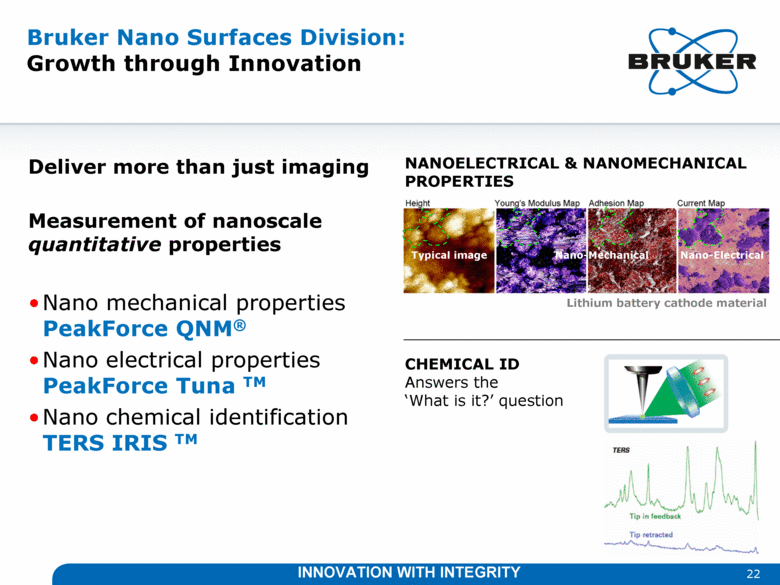
Bruker Nano Surfaces Division: Growth through Innovation Deliver more than just imaging Measurement of nanoscale quantitative properties Nano mechanical properties PeakForce QNM® Nano electrical properties PeakForce Tuna TM Nano chemical identification TERS IRIS TM Lithium battery cathode material CHEMICAL ID Answers the ‘What is it?’ question 22 NANOELECTRICAL & NANOMECHANICAL PROPERTIES Typical image Nano-Mechanical Nano-Electrical INNOVATION WITH INTEGRITY |
|
|
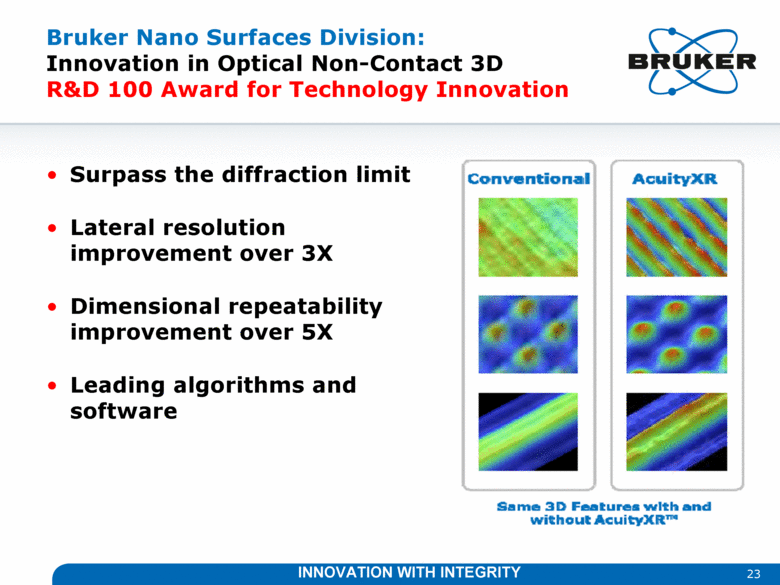
Bruker Nano Surfaces Division: Innovation in Optical Non-Contact 3D R&D 100 Award for Technology Innovation Surpass the diffraction limit Lateral resolution improvement over 3X Dimensional repeatability improvement over 5X Leading algorithms and software 23 INNOVATION WITH INTEGRITY |
|
|
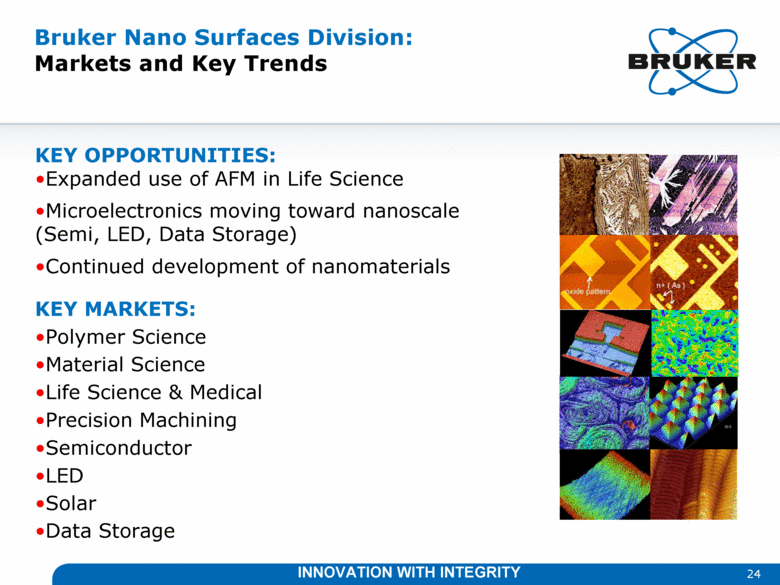
Bruker Nano Surfaces Division: Markets and Key Trends 24 KEY OPPORTUNITIES: Expanded use of AFM in Life Science Microelectronics moving toward nanoscale (Semi, LED, Data Storage) Continued development of nanomaterials KEY MARKETS: Polymer Science Material Science Life Science & Medical Precision Machining Semiconductor LED Solar Data Storage INNOVATION WITH INTEGRITY |
|
|
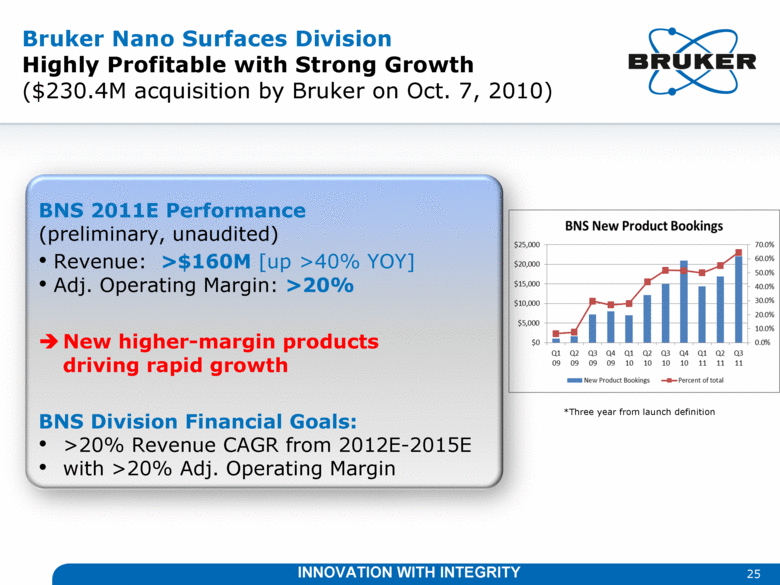
Bruker Nano Surfaces Division Highly Profitable with Strong Growth ($230.4M acquisition by Bruker on Oct. 7, 2010) 25 *Three year from launch definition BNS 2011E Performance (preliminary, unaudited) Revenue: >$160M [up >40% YOY] Adj. Operating Margin: >20% New higher-margin products driving rapid growth BNS Division Financial Goals: >20% Revenue CAGR from 2012E-2015E with >20% Adj. Operating Margin INNOVATION WITH INTEGRITY |
|
|
26 Bruker Investment Opportunity: Focus on Products, Profitable Organic Growth, Disciplined Acquisitions, Strong B/S, High RoIC Core Capabilities & Trends Premier brand for high-performance life-science and analytical instruments Strong innovation and growth record, expanding market shares Operational Excellence initiative on-going Excellent bookings and backlog momentum in Q3-2011YTD Profitable Growth Prospects Best-in-class R&D and product development New addressable markets through internal initiatives and disciplined acquisitions Strong tailwinds from secular megatrends and new requirements: post-genomics research, biologic drugs, membrane proteins, 450mm FABs, shrinking semicon/nanotech features, new explosives detection, microbiology MALDI ID, protein/metabolite MDx, supercon tools; Financial Performance & Goals Balance Sheet 9/30/11: Total debt <1.3 Adj. EBITDA, Intangible Asset Ratio ~15%; ~$335M (+25%) revenue jump in 2011E, with 2012E-2014E target CAGR of >10% 2009A & 2010A: adj. BSI operating margin up 210 bps and 190 bps, respectively 2014E BSI adj. operating margin goal >18% (excl. new CAM division) 2012E-2014E: Average annual BSI adj. EPS growth of 15-25% 2014E BSI RoIC target of >25% (adj. NOPAT) 2012E-2014E: Significant cash flow opportunity from profits and balance sheet © Copyright 2012 Bruker Corporation. INNOVATION WITH INTEGRITY |
|
|
www.bruker.com © Copyright 2012 Bruker Corporation. INNOVATION WITH INTEGRITY |

