Attached files
| file | filename |
|---|---|
| 8-K - FORM 8-K - CVR ENERGY INC | d275307d8k.htm |
 Deutsche Bank US Independent Refining Conference
January 5, 2012
Exhibit 99.1 |
 1
1
1
1
1
Forward-Looking Statements
This
presentation
should
be
reviewed
in
conjunction
with
CVR
Energy,
Inc.’s
Third
Quarter
earnings
conference
call
held
on
November
3,
2011.
The
following
information
contains
forward-looking
statements
based
on
management’s
current
expectations
and
beliefs,
as
well
as
a
number
of
assumptions
concerning
future
events.
These
statements
are
subject
to
risks,
uncertainties,
assumptions
and
other
important
factors.
You
are
cautioned
not
to
put
undue
reliance
on
such
forward-looking
statements
(including
forecasts
and
projections
regarding
our
future
performance)
because
actual
results
may
vary
materially
from
those
expressed
or
implied
as
a
result
of
various
factors,
including,
but
not
limited
to
(i)
those
set
forth
under
“Risk
Factors”
in
CVR
Energy,
Inc.’s
Annual
Report
on
Form
10-K,
Quarterly
Reports
on
Form
10-Q
and
any
other
filings
CVR
Energy,
Inc.
makes
with
the
Securities
and
Exchange
Commission,
and
(ii)
those
set
forth
under
“Risk
Factors”
and
“Cautionary
Note
Regarding
Forward-Looking
Statements”
in
the
CVR
Partners,
LP
Prospectus
and
any
other
filings
CVR
Partners,
LP
makes
with
the
Securities
and
Exchange
Commission.
CVR
Energy,
Inc.
assumes
no
obligation
to,
and
expressly
disclaims
any
obligation
to,
update
or
revise
any
forward-looking
statements,
whether
as
a
result
of
new
information,
future
events
or
otherwise.
TM |
 2
2
2
2
2
Management Attendees
Jack Lipinski
Chief Executive Officer
Ed Morgan
Executive Vice President of Investor Relations
Jay Finks
Director of Finance
TM |
 Gary-Williams Acquisition Summary |
 4
4
4
4
4
Transaction Overview
CVR Energy, Inc. acquired Gary-Williams Energy Corporation for $607
million including working capital
Gary-Williams’
primary asset is a 70,000 barrels-per-day (“bpd”) refinery
located in Wynnewood, Oklahoma
–
Complexity rating of 9.3
We funded the transaction primarily with cash, combined with
approximately $200 million of senior secured financing
–
$643 million in balance sheet cash at Coffeyville Resources as of
September 30, 2011
(a)
We increased our existing asset based credit facility to $400 million
Transaction closed December 15th
(a)
$643 million is net of cash at CVR Partners, LP.
TM |
 5
5
5
5
5
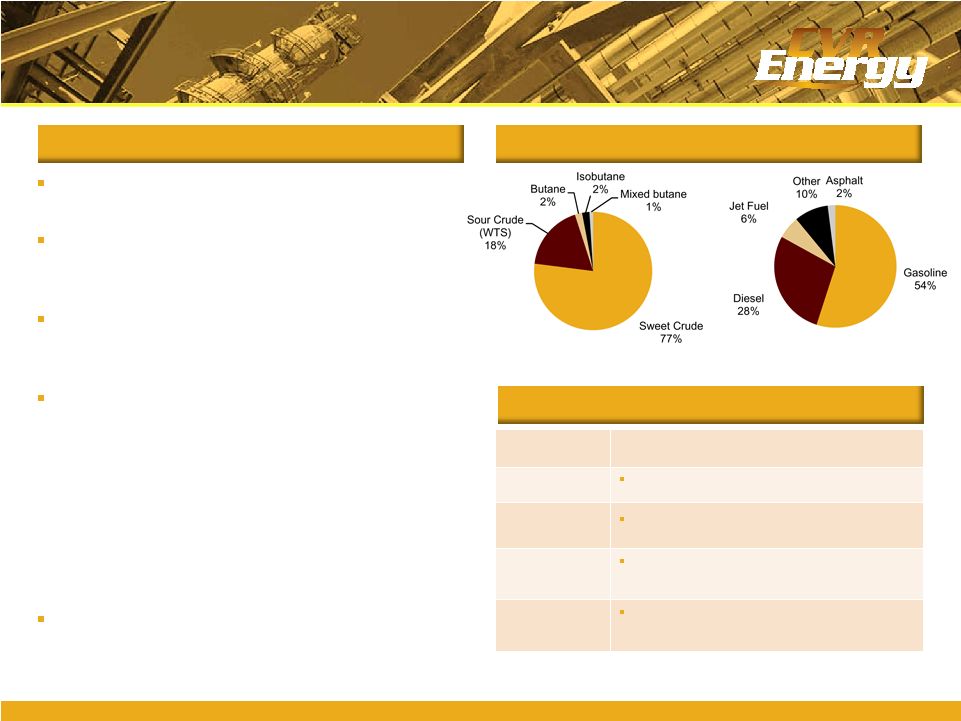
Summary
LTM Feedstock and Product Slate
Asset Improvement Opportunities
Wynnewood Refinery Overview
Note: LTM as of September 30, 2011.
70,000 bpd of crude throughput capacity
–
9.3 complexity
Produces a full slate of gasoline, diesel,
asphalt, jet fuel, LPG and specialty products
–
97.5% liquid product yield
Strategically located in Group III of PADD II
–
Access to cost-advantaged, WTI
price-linked crude oils
Approximately 60% of products sold directly
into the local Oklahoma market
–
Approximately 12,000 bpd of gasoline and
ULSD sold via truck rack
–
Approximately 4,000 bpd of JP-8 sold via
truck rack
–
Remaining volumes distributed
throughout Mid-Continent region via
Magellan Pipeline
Over $100 million invested to upgrade and
optimize the facility since 2007
Project
Opportunity
Logistics
Opportunity to share feedstocks based on unit
economics
Crude slate
Optimize crudes to improve consumed crude
differentials and improve realized refining margin
Rail options
Wynnewood connected to a BNSF main line
–
Property can accommodate new track and
off-take infrastructure
Storage options
Currently 2 million barrels of storage
–
Sufficient land for significant additional
storage / blending tanks
TM |
 6
6
6
6
6
Acquisition Rationale
High quality asset increases CVR’s scale and operational diversity
–
Pro forma company will have approximately 185,000 bpd of throughput capacity
and weighted average complexity of approximately 11.5
Strategically positioned in attractive Mid-Continent region
–
Located in the highly fragmented and historically underserved Group III, PADD II
region (same as CVR)
Significant opportunities to enhance consolidated operations
–
Ability to expand CVR’s existing crude oil gathering business, diversify
GWEC’s crude slate, leverage our marketing capabilities, reduce
duplicative SG&A Enhances financial strength and flexibility
–
Improves credit profile by expanding processing capacity and diversifying asset
base (CVR will no longer be a single asset refiner)
Favorable spread environment and positive industry outlook
–
WTI/LLS and WTI/Brent pricing dynamics continue to provide favorable Mid-
Continent
refining
environment
due
to
the
limited
crude
pipeline
capacity
to
Gulf
Coast (even post Seaway reversal)
TM |
 7
7
7
7
7
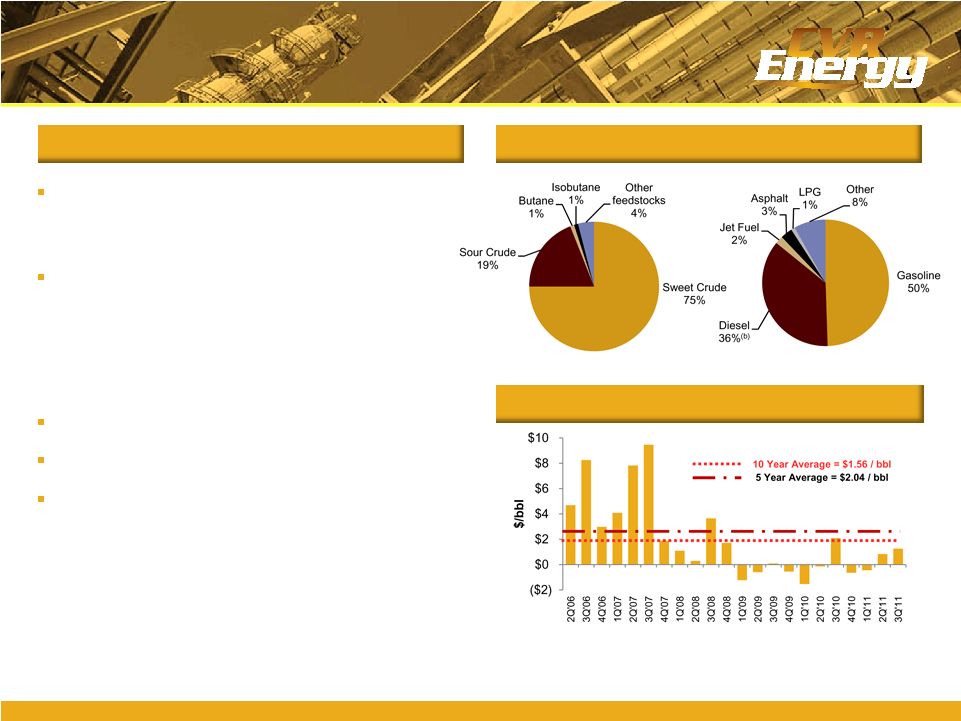
Pro Forma Company Overview
Two top-tier Mid-Continent refineries
–
115,000 bpd Coffeyville, Kansas refinery
–
70,000 bpd Wynnewood, Oklahoma Refinery
A nitrogen fertilizer plant using pet coke
gasification
–
Rated capacity of 1,225 tpd ammonia; 2,025 tpd
UAN Nitrogen
–
Current $100.0 million expansion ongoing to
increase UAN capacity by 400,000 tons
Operates in higher margin markets
Logistics assets supporting both businesses
Financial flexibility
Pro Forma LTM Feedstock & Product Slate
(a)
PADD II –
Group 3 Basis
CVR Energy: About Us
Note: LTM as of September 30, 2011.
(a)
Pro forma based on weighted average of refinery capacity.
(b)
CVR distillate assumed to be diesel for pro forma.
TM |
 8
8
8
8
8
(a)
100%
of
capacity
in
Wood
River,
IL
refinery
JV
consolidated
(50%
ownership
interest).
(b)
Includes 50% interest in JV in Toledo, OH refinery.
Source: EIA and Wall Street research
PADD
II
Consolidated
Refinery
Statistics
–
By
Owner
“Top Quartile”
Consolidated Asset Profile
PADD II Refiners
Well Positioned to Compete in
Underserved PADD II Region
TM |
 9
9
9
9
9
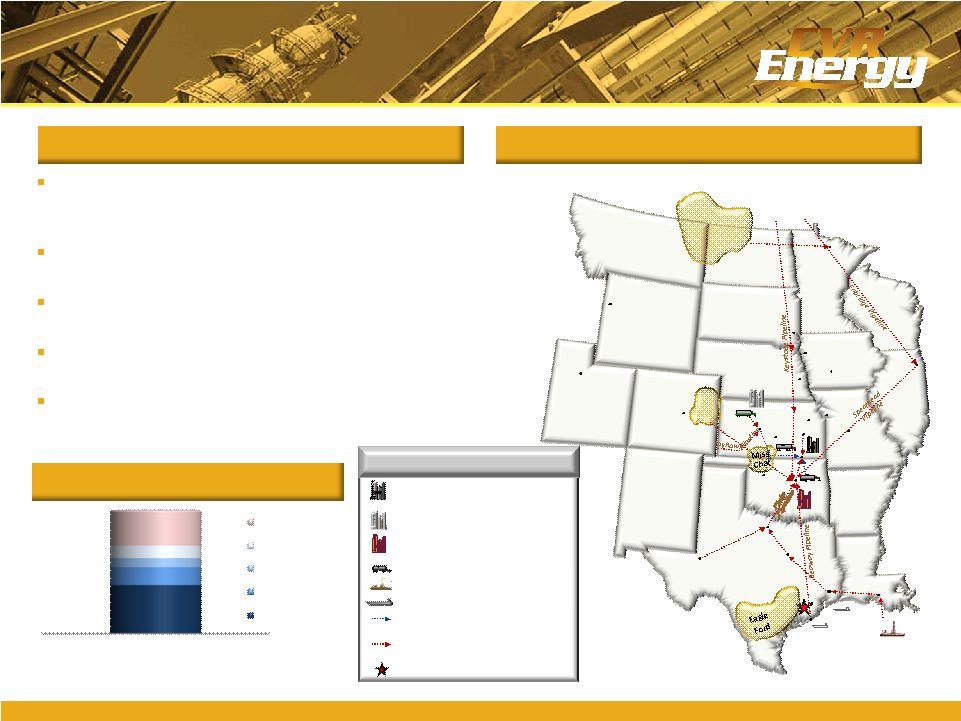
Consolidated Supply Network
Consolidated Marketing Network
Extensive Crude Oil Supply and
Product Distribution Network
Major Canadian Crude Oil Pipelines
Terminals
Third-Party Refined Product Pipelines
Wynnewood Refinery
Coffeyville Resources Refining &
Marketing and Nitrogen Fertilizer
Wynnewood Exchange Terminals
CVR Crude Oil Pipelines
Third-Party Crude Oil Pipelines
Wynnewood Related Pipelines
CVR Headquarters
TM |
 10
10
10
10
10
2.7
1.0
0.5
0.7
2.0
GWEC assets
Refinery
Gathering
Cushing Owned(a)
Cushing Leased
Logistics Overview
Operations Map
Logistics Drives Profitability
(a)
Under construction.
Located 100 miles from the global crude hub of
Cushing, CVR has access to global crudes with
storage to optimize purchasing and crude slates
Shipper status of 35,000 bpd on Spearhead and
Keystone Pipelines
37,000+ bpd crude oil gathering system serving
Kansas, Oklahoma, Missouri and Nebraska
145,000 bpd proprietary pipeline system to
transport crude to the Coffeyville refinery
Currently constructing an additional one million
barrel storage facility in Cushing
Coffeyville Resources
Refining & Marketing and Nitrogen
Fertilizer
Coffeyville Resources Refined Fuel
Products / Asphalt Terminal
Wynnewood Refinery
Coffeyville Resources Crude
Transportation
Offshore Deepwater Crude
Foreign Crude
Coffeyville Resources Crude Oil
Pipeline
Third-Party Crude Oil Pipeline
CVR Energy Headquarters
Legend
Total 6.9 mm bbls
Canada
Texas
Louisiana
Arkansas
Oklahoma
Missouri
Iowa
Nebraska
South Dakota
North Dakota
Wyoming
Montana
Utah
Minnesota
Illinois
Houston
Freeport
Shidler
Kansas City
Cushing
Bartlesville
Corsicana
Nederland
Sugar Land
Houma
Midland
Broome
Humboldt
Columbia
Des
Moines
Sioux Falls
Sioux City
Omaha
Oklahoma City
Tulsa
Topeka
Coffeyville
Plains
Pipeline
Wichita Falls
Colorado
Kansas
Winfield
Valley Center
Wichita
Plainville
Phillipsburg
Denver
Clearbrook
Flanagan
New Mexico
Bakken
Wisconsin
DJ
Basin
Salt Lake City
Jackson
PF Crude Storage Owned / Leased
TM |
 11
11
11
11
11
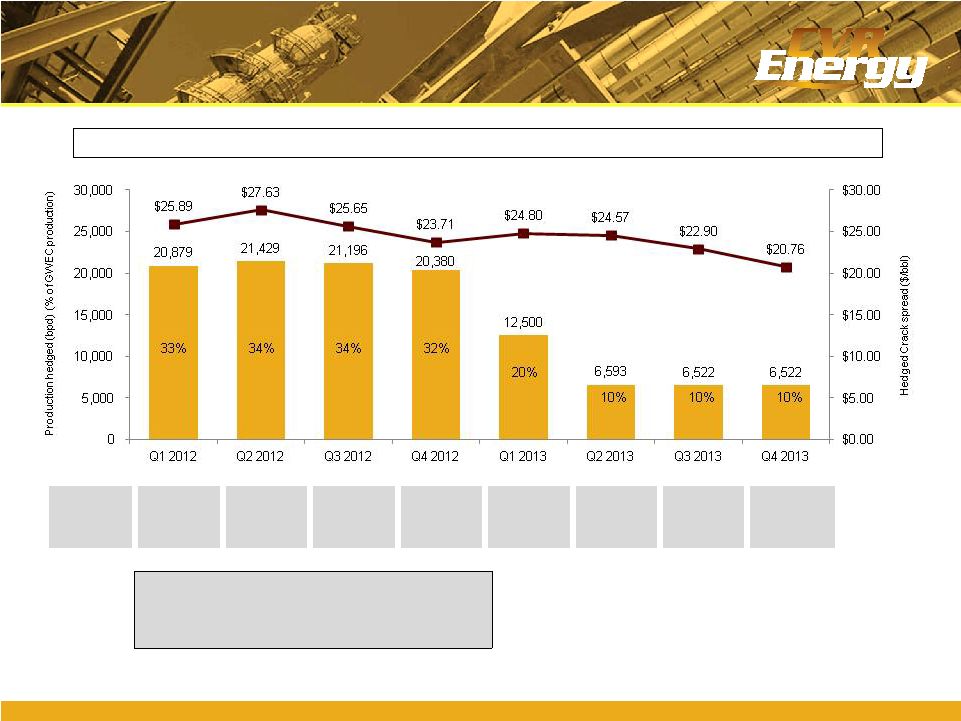
Hedging Activity
Note:
Based on 11/28 market data.
Locked
Gross
Margin
$49.2
$53.9
$50.0
$44.5
$27.9
$14.7
$13.7
$12.5
2012 Total Locked Gross Margin
$197.5
2012 Total Locked Margin per Barrel
$3.42
CVR has an estimated $50.9 million unrealized gain based on 11/28 market data
TM |
 12
12
12
12
12
Post-closing Value Enhancement
Initiatives
Integrate and optimize operations with existing businesses
–
Expand existing crude oil gathering business to supply lower cost, local
crude to Wynnewood refinery
–
Proximity of plant is a benefit to managing feedstocks
Increase ability to optimize Sour / Heavy Sour processing
–
CVR has 35,000 barrels per day capacity on pipelines from Canada
–
Ability to substitute Heavy Canadian Sour for Domestic US Sour
–
All crudes priced off WTI
SG&A synergies exist
TM |
 13
13
13
13
13
Projected Synergies and Improvements
(a)
Assumes realization at beginning of year.
Synergies
Assumptions
Amount ($mm)
(a)
Crude Rate Increase
4,000 bpd to 67,000 bpd in non turnaround years
$16.3
Overall Crude Differential
$0.50/bbl on crude rate
7.9
Reduce Trucked Crude Freight
$0.50/bbl on 10,000 bpd
0.9
Product & Feedstock Optimization Between Refineries
Assumes improvement of $1.50/bbl on 2,000 bpd
1.1
SG&A Improvements / Optimizations
Shared services, personnel realignment & general savings
5.0
Miscellaneous
Sum of small improvements & optimizations
1.2
Total
$32.4
2012E Projected Synergies
TM |
 Coffeyville Overview |
 15
15
15
15
15
Summary
LTM Feedstock & Product Slate
(a)
Management’s Proven Track Record
Coffeyville Refinery Overview
(a)
LTM as of September 30, 2011.
115,000 bpd of crude throughput capacity
–
12.9 complexity
High complexity refinery producing gasoline,
distillates, specialty products and petroleum coke
Strategically located in Group III of PADD II
–
Access to cost-advantaged, WTI price-linked
crude oils
–
100 miles from Cushing, Oklahoma
Sales and distribution
–
Rack marketing division supplies products
through tanker trucks
–
Bulk sales into Mid-Continent markets via
Magellan and into Colorado and other
destinations via product pipelines owned by
Magellan, Enterprise Products Partners and
NuStar
$521 million invested in refinery between 2005
and
2009
Two-phase turnaround complete in Q1 2012
2005 (Acquisition year)
Current
Operational
Upgrades
Launched $521 million of
upgrades
Now, most flexible
Mid-Con refinery
Crude and
Feedstock
Throughput (bpd)
98,300
115,140
(a)
Feedstock
flexibility
No heavy sour
Up to 25k bpd
Complexity
9.5
12.9
Gathered Barrels
Capacity (bpd)
~7,000
37,000+
TM |
 16
16
16
16
16
Overview
Historical & Projected Canadian Production
Historical & Projected Bakken Crude Production
Access to WTI Priced Crudes
(a)
Source: Canadian Association of Petroleum Producers June 2011 publication.
Source: Wood Mackenzie Upstream Service database
Both refineries benefit from the current WTI-Brent spread
WTI price-linked crudes are currently trading at
historically wide discounts to crudes, such as Brent
and
LLS
Growing production from the U.S. Bakken and Canada
flowing into Cushing, OK is contributing to this
differential
Expected pipeline capacity (Seaway reversal) necessary
to move production from Cushing to the Gulf Coast
projected to move only 400k bpd by 2013
87.6
102.1
132.7
142.3
201.8
262.9
313.1
340.0
362.4
0
100
200
300
400
2006
2007
2008
2009
2010
2011
2012
2013
2014
Bakken Crude Production
(thousand barrels per day)
Historical WTI-Brent Spread ($/bbl)
TM |
 17
17
17
17
17
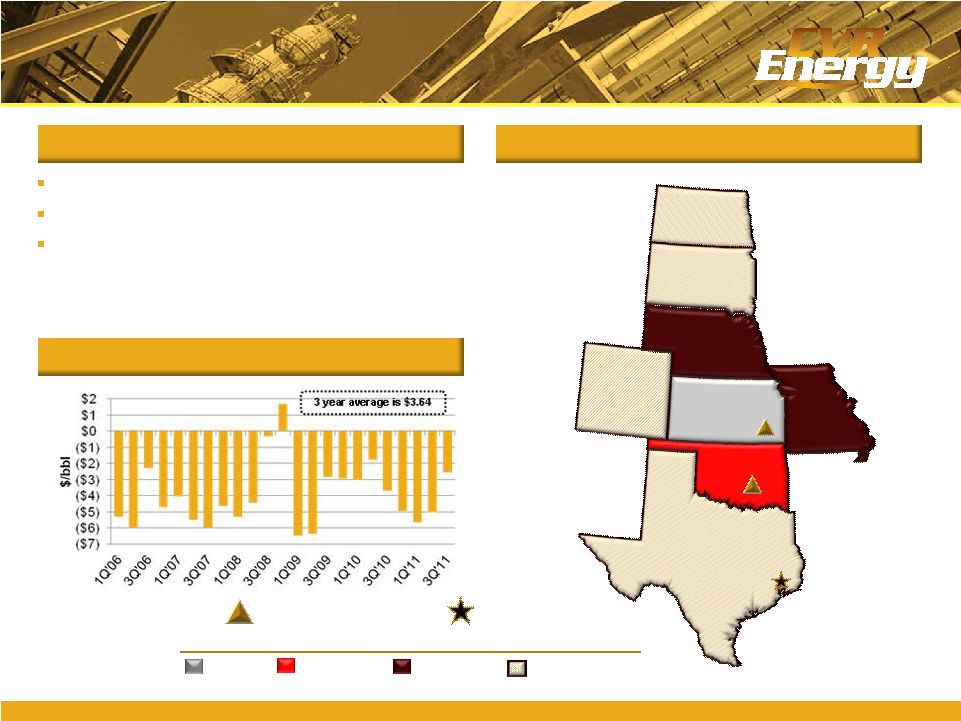
Overview
Asset Map
Total Consumed Crude Discount to WTI
Crude Gathering
Gathered 7,000 bpd in 2005
Today gathering 37,000+ bpd
Growth
target
10%
–
20%
per
year
for
the
next
2
–
5
years
Texas
Oklahoma
Missouri
Nebraska
Kansas
Colorado
South Dakota
North Dakota
Barrels Gathered Per Day –
LTM Q3 2011
15,000+
Up to 10,000
Up to 1,000
Refining Operations
Corporate
Headquarters
Growth Prospects
TM |
 Nitrogen Fertilizer MLP |
 19
19
19
19
19
Overview
Fertilizer Operations
Strategically Located Assets and Logistics
Located in the corn belt
(on Union
Pacific
mainline)
45% of corn planted in
2010 was within $35/UAN
ton freight rate of our
plant
$25/ton transportation
advantage to corn belt vs.
US Gulf
Coast
No intermediate transfer,
storage, barge freight or
pipeline freight charges
Rail Distribution
LTM Q3 2011 Tons Sold by State
100,000+
10,000 to 100,000
Up to 10,000
Corporate
Headquarters
Fertilizer Plant
LTM Q3 2011 Total Tons Sold ~ 731,500
TM |
 20
20
20
20
20
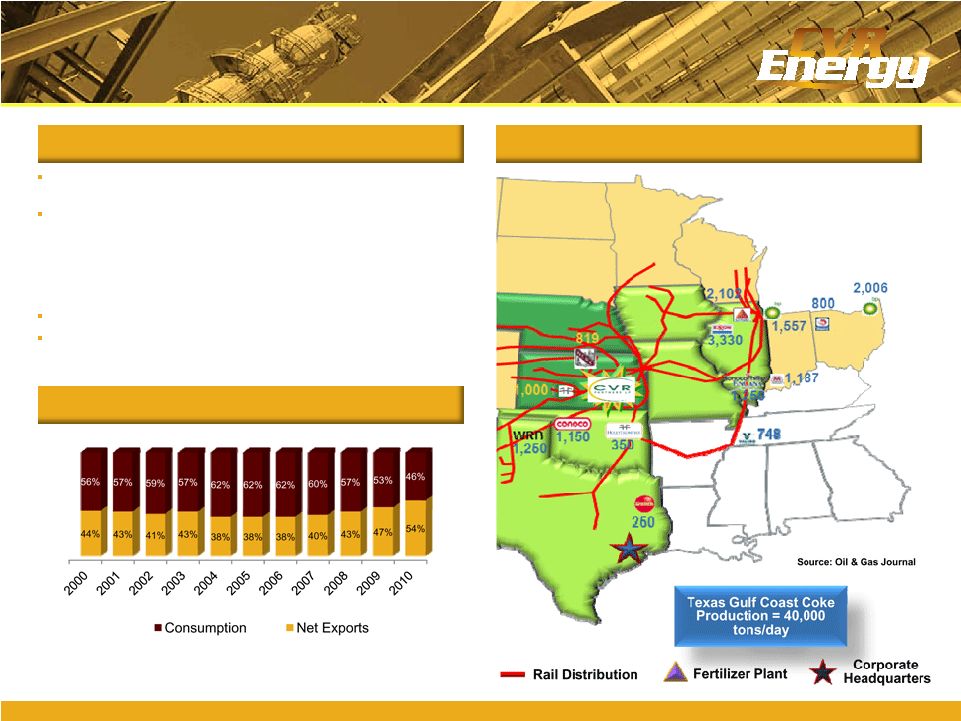
Overview
Abundant Supply of Third-party Pet Coke
US Pet Coke Exports and Consumption
Stable & Economic Feedstock
Source: EIA
CVR Partners LP 2008 –
2010 average daily coke demand ~ 1,378
tons/day
Coke gasification technology uses petroleum coke as a feedstock
–
Pet coke costs lower than natural gas costs per ton of ammonia
produced, and pet coke prices are significantly more stable than
natural gas prices
–
Over 70% of pet coke supplied by refinery through long-term
contract
Dual train gasifier configuration ensures reliability
Ammonia synthesis loop and UAN synthesis use same processes as
natural gas based producers
TM |
 21
21
21
21
21
Market Fundamentals
Farmer Profitability Supports Fertilizer Pricing
Corn consumes the largest amount of nitrogen fertilizer
Farmers are expected to generate substantial proceeds at currently forecasted corn
prices Farmers are still incentivized to apply nitrogen fertilizer at corn
prices lower than current spot Nitrogen fertilizer represents a small
percentage of a farmer’s input costs Note: Fixed Costs include labor,
machinery, land, taxes, insurance, and other. *As of Dec. 20, 2011
Source: CIQ
*As of Dec .20, 2011
Source: CIQ, USDA
TM |
 22
22
22
22
22
Market Fundamentals
Strong Pricing Environment
($ per Ton)
Historical U.S. Nitrogen Fertilizer Prices
0
100
200
300
400
500
600
700
800
900
1,000
1999
2000
2001
2002
2004
2005
2006
2007
2009
2010
2011
Ammonia
$686
UAN
$352
Southern Plains
Ammonia
Corn Belt UAN
5-Yr Average Southern
Plains Ammonia
Source:
Green Markets Data, Fertecon
5 Yr. Avg.
UAN $163
5-Yr Average
Corn Belt UAN
5 Yr. Avg.
Ammonia $283
5 Yr. Avg.
Ammonia $493
5 Yr. Avg.
UAN $312
TM |
 Financial Highlights |
 24
24
24
24
24
EBITDA by Operating Segment ($mm)
Capital Expenditures ($mm)
Refining Margins and Expenses ($/bbl)
Fertilizer Prices ($/Ton)
Key Historical Financial Statistics
CVR Energy Standalone
Note:
Adjusted Petroleum EBITDA represents petroleum operating income adjusted for FIFO
impacts, share-based compensation, loss on disposal of fixed assets, major
scheduled turnaround expenses, realized gain and losses on derivatives, net,
depreciation and amortization and other income or expenses. Adjusted Fertilizer EBITDA
represents nitrogen fertilizer operating income adjusted for share-based
compensation, loss of disposal of fixed assets, major scheduled turnaround expenses,
depreciation and amortization and other income or expenses.
(a)
Direct opex per barrel excludes turnaround.
TM |
 25
25
25
25
25
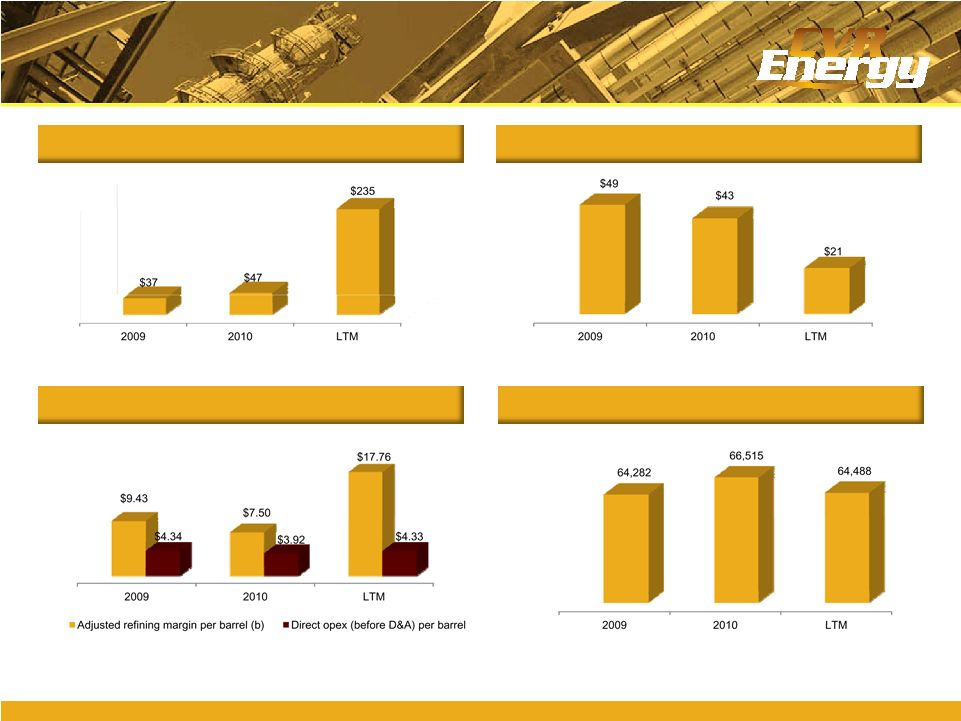
Adjusted EBITDA ($mm)
(a)
Capital Expenditures ($mm)
Refining Margins and Expenses ($/bbl)
Total Throughput (bpd)
Key Historical Financial Statistics
Gary Williams Standalone
(a)
Adjusted EBITDA represents GWEC operating income adjusted for FIFO impacts, major
scheduled turnaround expenses, realized gain and losses on derivatives, net,
depreciation and amortization and other income or expenses.
(b)
Adjusted refining margin per barrel is equal to gross operating margin adjusted for
FIFO inventory gains or losses divided by crude throughput. TM
|
 26
26
26
26
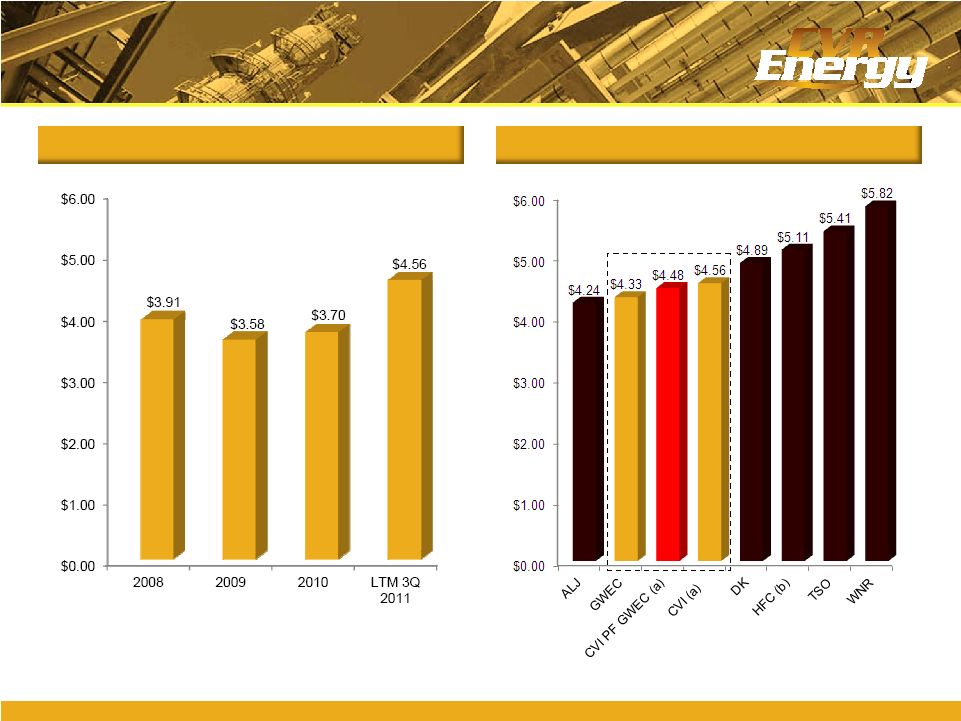
26
CVI Operating Expenses
(a)
($/bbl)
Q3’11 LTM Operating Expense ($/bbl)
Combined Company –
Controlled Operating Expenses
(a)
Excludes
turnaround.
CVI
PF
GWEC
based
on
weighted
average
crude
throughput.
(b)
HFC combined results from legacy companies 3Q 2011 report.
TM |
 Appendix |
 28
28
28
28
28
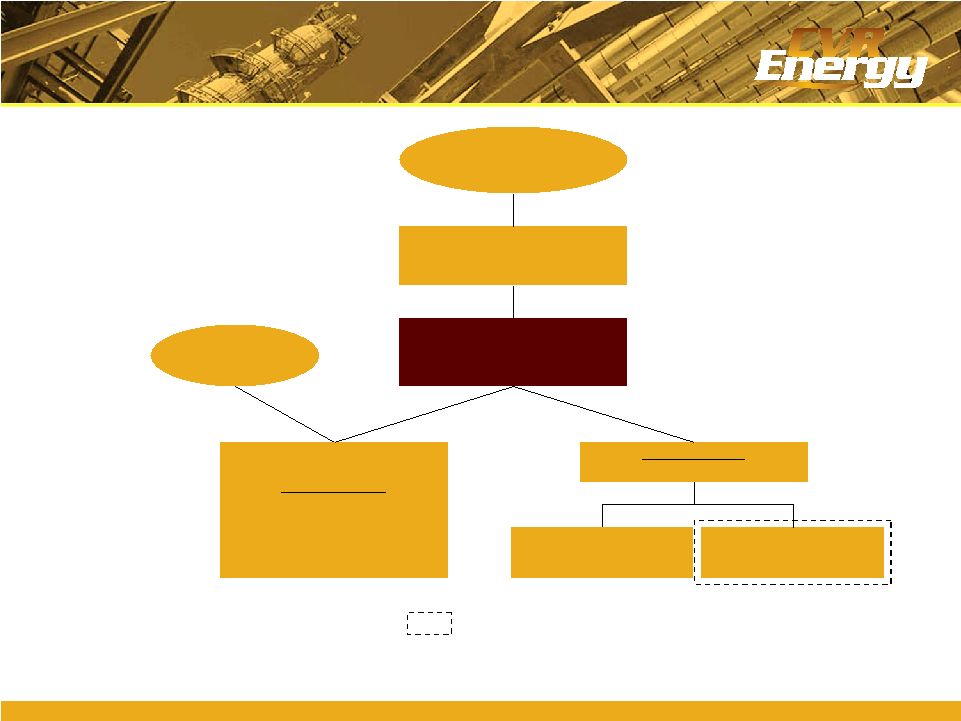
Pro Forma Organizational Structure
CVR Energy, Inc.
NYSE: CVI
Market cap: ~$2.2 bn
Coffeyville Resources, LLC
Fertilizer business
CVR Partners, LP
NYSE: UAN
Market cap: ~$1.8 bn
Refining business
~$809 mm LTM EBITDA
Public shareholders
Public unitholders
100%
100%
100% GP
69.7% LP
30.3% LP
Wynnewood Refinery (GWEC)
(Wynnewood, OK)
Coffeyville Refinery
(Coffeyville, KS)
100%
100%
Represents Acquisition
TM |
 29
29
29
29
29
Non-GAAP Financial Measures
To
supplement
the
actual
results
in
accordance
with
U.S.
generally
accepted
accounting
principles
(GAAP),
for
the
applicable
periods,
the
Company
also
uses
certain
non-GAAP
financial
measures
as
discussed
below,
which
are
adjusted
for
GAAP-based
results.
The
use
of
non-GAAP
adjustments
are
not
in
accordance
with
or
an
alternative
for
GAAP.
The
adjustments
are
provided
to
enhance
the
overall
understanding
of
the
Company’s
financial
performance
for
the
applicable
periods
and
are
also
indicators
that
management
utilizes
for
planning
and
forecasting
future
periods.
The
non-GAAP
measures
utilized
by
the
Company
are
not
necessarily
comparable
to
similarly
titled
measures
of
other
companies.
The
Company
believes
that
the
presentation
of
non-GAAP
financial
measures
provides
useful
information
to
investors
regarding
the
Company’s
financial
condition
and
results
of
operations
because
these
measures,
when
used
in
conjunction
with
related
GAAP
financial
measures
(i)
together
provide
a
more
comprehensive
view
of
the
Company’s
core
operations
and
ability
to
generate
cash
flow,
(ii)
provide
investors
with
the
financial
analytical
framework
upon
which
management
bases
financial
and
operational
planning
decisions,
and
(iii)
presents
measurements
that
investors
and
rating
agencies
have
indicated
to
management
are
useful
to
them
in
assessing
the
Company
and
its
results
of
operations.
TM |
 30
30
30
30
30
Non-GAAP Financial Measures (cont’d)
EBITDA:
EBITDA
represents
net
income
before
the
effect
of
interest
expense,
interest
income,
income
tax
expense
(benefit)
and
depreciation
and
amortization.
EBITDA
is
not
a
calculation
based
upon
GAAP;
however,
the
amounts
included
in
EBITDA
are
derived
from
amounts
included
in
the
consolidated
statement
of
operations
of
the
Company.
Adjusted
EBITDA
by
operating
segment
results
from
operating
income
by
segment
adjusted
for
items
that
the
company
believes
are
needed
in
order
to
evaluate
results
in
a
more
comparative
analysis
from
period
to
period.
Additional
adjustments
to
EBITDA
include
major
scheduled
turnaround
expense,
the
impact
of
the
Company’s
use
of
accounting
for
its
inventory
under
first-in,
first-out
(FIFO),
net
unrealized
gains/losses
on
derivative
activities,
share-based
compensation
expense,
loss
on
extinguishment
of
debt,
and
other
income
(expense).
Adjusted
EBITDA
is
not
a
recognized
term
under
GAAP
and
should
not
be
substituted
for
operating
income
or
net
income
as
a
measure
of
performance
but
should
be
utilized
as
a
supplemental
measure
of
financial
performance
in
evaluating
our
business.
First-in,
first-out
(FIFO):
The
Company’s
basis
for
determining
inventory
value
on
a
GAAP
basis.
Changes
in
crude
oil
prices
can
cause
fluctuations
in
the
inventory
valuation
of
our
crude
oil,
work
in
process
and
finished
goods,
thereby
resulting
in
favorable
FIFO
impacts
when
crude
oil
prices
increase
and
unfavorable
FIFO
impacts
when
crude
oil
prices
decrease.
The
FIFO
impact
is
calculated
based
upon
inventory
values
at
the
beginning
of
the
accounting
period
and
at
the
end
of
the
accounting
period.
TM |
 31
31
31
31
31
Non-GAAP Financial Measures (cont’d)
CVR 9/30/11 LTM Adjusted EBITDA ($mm)
LTM 9/30/2011
Consolidated Net Income
$282.2
Interest expense, net of interest income
53.8
Depreciation and amortization
88.1
Income tax expense
181.5
EBITDA adjustments included in NCI
(3.4)
Unrealized (gain)/loss on derivatives
9.8
Loss on disposal of fixed assets
2.9
FIFO impact (favorable), unfavorable
(30.4)
Share based compensation
52.4
Loss on extinguishment of debt
3.6
Major turnaround expense
16.5
Other non-cash expenses
-
Consolidated Adjusted EBITDA
$657.0
Fertilizer Adjusted EBITDA
121.7
Adjusted EBITDA excl. Fertilizer
$535.3
TM |
 32
32
32
32
32
Non-GAAP Financial Measures (cont’d)
CVR Adjusted EBITDA ($mm)
Petroleum:
2008
2009
2010
LTM 9/30/2011
Petroleum operating income
$31.9
$170.2
$104.6
$529.5
FIFO impact (favorable) unfavorable
102.5
(67.9)
(31.7)
(30.4)
Share-based compensation
(10.8)
(3.7)
11.5
17.1
Loss on disposal of fixed assets
-
-
1.3
1.5
Major scheduled turnaround
-
-
1.2
12.8
Realized gain (loss) on derivatives, net
(121.0)
(21.0)
0.7
(24.7)
Goodwill impairment
42.8
-
-
-
Depreciation and amortization
62.7
64.4
66.4
67.8
Other income (expense)
1.0
0.3
0.7
0.5
Adjusted EBITDA
$109.1
$142.3
$154.7
$574.1
Fertilizer:
2008
2009
2010
LTM 9/30/2011
Fertilizer operating income
$116.8
$48.9
$20.4
$84.0
Share-based compensation
(10.6)
3.2
9.0
14.1
Loss on disposal of fixed assets
2.3
-
1.4
1.4
Major scheduled turnaround
3.3
-
3.5
3.5
Depreciation and amortization
18.0
18.7
18.5
18.5
Other income (expense)
0.1
-
-
0.2
Adjusted EBITDA
$129.9
$70.8
$52.8
$121.7
TM |
 33
33
33
33
33
Non-GAAP Financial Measures (cont’d)
(a)
Includes disposal of assets, asset impairments, discontinued operations and fire
related adjustments. GWEC Adjusted EBITDA ($mm)
GWEC:
2009
2010
LTM 9/30/2011
Net income (loss)
$52.5
$16.1
$161.6
Income taxes
-
-
-
Interest expense (net)
12.9
22.4
28.6
Depreciation and amortization
13.8
14.7
17.2
Hedge mark to market loss (gain)
-
-
37.9
Turnaround amortization
15.4
13.8
13.1
Non-cash inventory loss (gain)
(57.9)
(19.6)
(23.1)
Other unusual or non-recurring items
(a)
0.1
-
(0.2)
Adjusted EBITDA
$36.8
$47.4
$235.1
TM |