Attached files
| file | filename |
|---|---|
| 8-K - ROSE UPDATED COMPANY PRESENTATION - NBL Texas, LLC | roseupdatedpres.htm |

Exhibit 99.1
Rosetta Resources Inc.
Investor Presentation
December 2011
www.rosettaresources.com / NASDAQ: ROSE
High Asset Quality - Executing Business Plan - Future Growth Catalysts - Financial Strength

2
This presentation includes forward-looking statements, which give the Company's current expectations or forecasts
of future events based on currently available information. Forward-looking statements are statements that are not
historical facts, such as expectations regarding drilling plans, including the acceleration thereof, production rates and
guidance, resource potential, incremental transportation capacity, exit rate guidance, net present value, development
plans, progress on infrastructure projects, exposures to weak natural gas prices, changes in the Company's liquidity,
changes in acreage positions, expected expenses, expected capital expenditures, and projected debt balances. The
assumptions of management and the future performance of the Company are subject to a wide range of business
risks and uncertainties and there is no assurance that these statements and projections will be met. Factors that
could affect the Company's business include, but are not limited to: the risks associated with drilling of oil and natural
gas wells; the Company's ability to find, acquire, market, develop, and produce new reserves; the risk of drilling dry
holes; oil and natural gas price volatility; derivative transactions (including the costs associated therewith and the
abilities of counterparties to perform thereunder); uncertainties in the estimation of proved, probable, and possible
reserves and in the projection of future rates of production and reserve growth; inaccuracies in the Company's
assumptions regarding items of income and expense and the level of capital expenditures; uncertainties in the timing
of exploitation expenditures; operating hazards attendant to the oil and natural gas business; drilling and completion
losses that are generally not recoverable from third parties or insurance; potential mechanical failure or
underperformance of significant wells; availability and limitations of capacity in midstream marketing facilities,
including processing plant and pipeline construction difficulties and operational upsets; climatic conditions; availability
and cost of material, supplies, equipment and services; the risks associated with operating in a limited number of
geographic areas; actions or inactions of third-party operators of the Company's properties; the Company's ability to
retain skilled personnel; diversion of management's attention from existing operations while pursuing acquisitions or
dispositions; availability of capital; the strength and financial resources of the Company's competitors; regulatory
developments; environmental risks; uncertainties in the capital markets; general economic and business conditions
(including the effects of the worldwide economic recession); industry trends; and other factors detailed in the
Company's most recent Form 10-K, Form 10-Q and other filings with the Securities and Exchange Commission. If
one or more of these risks or uncertainties materialize (or the consequences of such a development changes), or
should underlying assumptions prove incorrect, actual outcomes may vary materially from those forecasted or
expected. The Company undertakes no obligation to publicly update or revise any forward-looking statements except
as required by law.
Forward-Looking Statements and Terminology Used

3
For filings reporting year-end 2010 reserves, the SEC permits the optional disclosure of probable and possible
reserves. The Company has elected not to report probable and possible reserves in its filings with the SEC. We use
the term “net risked resources” to describe the Company’s internal estimates of volumes of natural gas and oil that are
not classified as proved reserves but are potentially recoverable through exploratory drilling or additional drilling or
recovery techniques. Estimates of unproved resources are by their nature more speculative than estimates of proved
reserves and accordingly are subject to substantially greater risk of actually being realized by the
Company. Estimates of unproved resources may change significantly as development provides additional data, and
actual quantities that are ultimately recovered may differ substantially from prior estimates. We use the term “BFIT
NPV10” to describe the Company’s estimate of before income tax net present value discounted at 10 percent
resulting from project economic evaluation. The net present value of a project is calculated by summing future cash
flows generated by a project, both inflows and outflows, and discounting those cash flows to arrive at a present value.
Inflows primarily include revenues generated from estimated production and commodity prices at the time of the
analysis. Outflows include drilling and completion capital and operating expenses. Net present value is used to
analyze the profitability of a project. Estimates of net present value may change significantly as additional data
becomes available, and with adjustments in prior estimates of actual quantities of production and recoverable
reserves, commodity prices, capital expenditures, and/or operating expenses.
Forward-Looking Statements and Terminology Used (cont.)

4
– Doubled proved reserves to 970 Bcfe at mid-year 2011
– Set record levels of liquids production
– Increased project inventory to 2.8 Tcfe
– Increased gross estimated ultimate recovery to 10 Bcfe per Gates Ranch Eagle
Ford well*
Ford well*
– Increased Gates Ranch planned well density to 65 acres per well
– Announced three new Eagle Ford field discoveries
– Firm transportation and processing capacity from Eagle Ford in place to execute
business plan
business plan
– Advanced Southern Alberta Basin horizontal drilling program
2011 Highlights
* EUR based on 850’ well spacing
5
– $640 million of capital; more than 90 percent allocated to Eagle Ford
– Four-rig program in Eagle Ford Area; 60 completions per year
– Continued Gates Ranch development
– Step out into other areas
– Completion of seven-well horizontal drilling program in Southern Alberta Basin
– Maintain acreage position
– Base capital program funded from internally-generated cash flow supplemented
by borrowings under current credit facility
by borrowings under current credit facility
– Eagle Ford program self-funding by year-end
– Divestitures remain an option
– Debt-to-Capitalization ratio approximately 30% at strip pricing
– Approximately 40% production growth over 2011
2012 Plans

6
Includes capitalized interest and other corporate costs.
Excludes New Ventures and A&D.
2012E
2012E
2011E
2011E
Capital Expenditures
Total: $640MM
Total: $475MM

7
– Asset Base High-Graded
– Executing Business Plan
– Testing Growth Catalysts
– Financial Strength
Agenda

8
Asset Base High-Graded

9
Alberta Basin
300,000 net acres
6 BBOE hydrocarbon resource in place
1500 potential locations
Exploration underway
11 delineation wells completed
4 horizontal wells drilled
Horizontal completions underway
Eagle Ford Liquids
50,000 net acres
20 TCFE hydrocarbon resource in place
600 potential remaining locations
52 horizontal wells completed*
125 MMcfe/d net*
10 years of potential remaining inventory
Eagle Ford Dry Gas
15,000 net acres
5 TCFE hydrocarbon resource in place
170 potential locations
4 horizontal wells completed*
5 MMcfe/d net*
3-4 years of remaining inventory
South Texas
(Non-Eagle Ford)
100,000 net acres
Numerous stacked reservoirs
20 MMcfe/d net*
* End of 3Q 2011
Asset Base High-Graded

10
Executing Business Plan

11
Proved Reserves - Doubled Since YE 2010
■ Eagle Ford
■ Other Core
■ Non-Core
351 Bcfe
479 Bcfe
970 Bcfe

12
Year-end 2011: 56 wells*
* Completed wells
9 miles
More than 12 TCFE of “hydrocarbons in place” have been delineated and are now being
exploited…
exploited…
Gates Ranch
13
7.3 BCFE Composite Type Curve (PUD bookings)
10 BCFE Composite Type Curve
DISCOVERY WELL
3500 ft lateral & 10 frac stages
DEVELOPMENT WELLS
5000 ft lateral & 15 frac stages
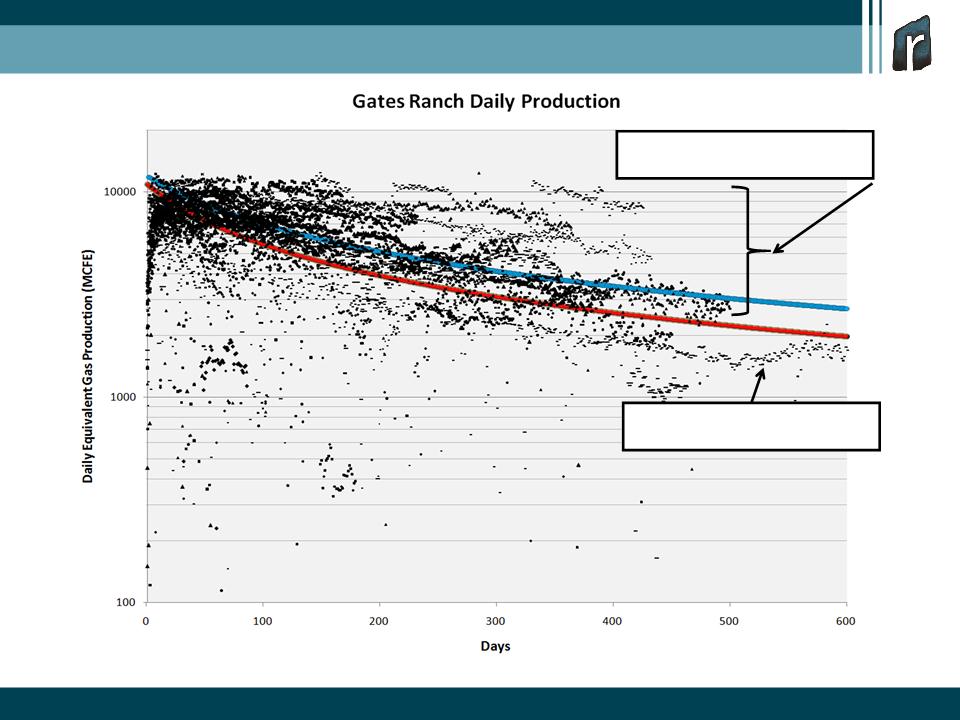
Gates Ranch Well Performance

14
Increased Firm Take-Away Capacity
¹ Net equivalent gas production (MMcfe/d) equals 1.35 times gross wet wellhead gas (MMcf/d).

15
Quarterly Production Performance
Production
(MMcfe/d)
250-280
220-240

16
Testing Growth Catalysts

17
|
Area
|
Window
|
Net
Acreage |
|
Gates Ranch
|
Liquids
|
26,500
|
|
Non-Gates Ranch
|
Liquids
|
23,500
|
|
Encinal Area
|
Dry Gas
|
15,000
|
|
TOTAL
|
|
65,000
|
Other Eagle Ford Areas

18
• Increased Well Density
• 280 locations remaining to be drilled
Gates Ranch
Field-wide development plans on 65-acre well spacing
Field-wide development plans on 65-acre well spacing

19
Discovery Well Test
• Southern Dimmit County Area
• 3,545 net acres
• 47 well locations remaining
• Initial Rate
• 850 bpd Oil
• 490 bpd NGL’s
• 3,900 mcfpd
• 1,990 BOEPD
Eagle Ford Discovery
Briscoe Ranch
Briscoe Ranch

20
Discovery Well Test
• Central Dimmit County Area
• 8,143 net acres
• 125 well locations remaining
• 7 day average rate
• 506 bpd Oil
• 102 bpd NGL’s
• 436 mcfpd
• 680 BOEPD
Eagle Ford Discovery
Central Dimmit County
Central Dimmit County

21
Discovery Well Test
• Southern Gonzales County Area
• 1,900 net acres
• 21 well locations remaining
• Initial Rate
• 2,450 bpd Oil
• 250 bpd NGL’s
• 2,000 mcfpd
• 3,033 BOEPD
Eagle Ford Discovery
Karnes Trough Area
Karnes Trough Area

22
* Includes only “well tested” inventory and excludes inventory on our 10,000 net acres that has offset data and will be tested in the upcoming quarters.
Eagle Ford
Well Tested Inventory
Well Tested Inventory

23
Delineation wells
Remaining Horizontal Wells
Southern Alberta Basin
2 of 7 Horizontal Wells Tested
2 of 7 Horizontal Wells Tested
Tribal Riverbend 07-04H
q Drilled +/- 3,500’ lateral length
q Middle Bakken interval
q Tested 154 BOEPD
Fee Simonson 34-01H
q Drilled +/- 3,700’ lateral length
q Middle Bakken interval
q Tested 104 BOEPD

24
– Confirmed significant resource in place, 6 billion BOE
– Advanced the well science work needed to “crack code” of complex play
– Identified fracture azimuth and orientation
– Achieved good vertical growth in initial stimulations
– Identified fracture stimulation design improvements to utilize in next four horizontal
well completions
well completions
– Improve isolation for more effective stimulations (cement liner and perf & plug)
– Targeted assumptions for well commerciality
– IP 250 Boe/d, EUR 185 MBOE, 160-acre spacing, $4 million well costs
– 21% ROR at $85 per barrel WTI
Next Steps
– Complete seven-well horizontal drilling program
– Maintain acreage position
– Engage industry service providers to identify opportunities to expand infrastructure
and reduce costs in the basin
and reduce costs in the basin
– Monitor long-term production performance to confirm model
Southern Alberta Basin Key Learnings

25
Financial Strength

26
Lower Cost Structure
|
|
|
2011 Full Year
|
|
2012 Full Year
|
||||
|
|
|
(Guidance Range)
|
|
(Guidance Range)
|
||||
|
Direct Lease Operating Expense
|
|
$ 0.44
|
-
|
$ 0.46
|
|
$ 0.25
|
-
|
$ 0.28
|
|
Workover Expenses
|
|
0.01
|
-
|
0.01
|
|
0.01
|
-
|
0.01
|
|
Insurance
|
|
0.02
|
-
|
0.02
|
|
0.03
|
-
|
0.03
|
|
Ad valorem Tax
|
|
0.12
|
-
|
0.13
|
|
0.13
|
-
|
0.14
|
|
Production Taxes
|
|
0.17
|
-
|
0.18
|
|
0.24
|
-
|
0.26
|
|
Treating, Transportation and Marketing
|
|
0.41
|
-
|
0.43
|
|
0.63
|
-
|
0.69
|
|
G&A, excluding stock-based compensation
|
0.74
|
-
|
0.78
|
|
0.50
|
-
|
0.55
|
|
|
Interest Expense
|
|
0.36
|
-
|
0.38
|
|
0.25
|
-
|
0.28
|
|
DD&A
|
|
2.03
|
-
|
2.13
|
|
1.85
|
-
|
1.95
|

27
Eagle Ford - Oil Marketing
Gates Ranch
– Velocity Midstream
– Long term condensate pipeline gathering and truck loading terminal transfer
– Current: Gathering capacity of 15,000 Bbls/d to Catarina with 15,000 Bbls
storage
storage
– January 2012: Gathering capacity of 25,000 Bbls/d to Gardendale with up to
60,000 Bbls storage
60,000 Bbls storage
– Long Term Crude Purchase Agreements
– 5,000 Bbls/d @ Catarina, Truck/Pipe; @ Gardendale, Pipeline Mid-2012
– Pricing based on Louisiana Light Sweet price less transportation
– Crude Oil Pricing Mix expected for 2012
– Gates Ranch, Briscoe Ranch and Central Dimmit County Properties
– 5,000 Bbls/d priced based on Louisiana Light Sweet (LLS) price less gravity and
transportation adjustments starting in mid-2012
transportation adjustments starting in mid-2012
– All other Condensate prices based on West Texas Intermediate (WTI) less gravity
and transportation adjustments
and transportation adjustments
– Karnes Trough Properties
– WTI-based price (currently with premium), no gravity or transportation adjustment

28
50
20
10,300
5,400
3,750
* NGL hedges exclude the Ethane component

29
Debt and Liquidity
350
250
402
237

30
– Adequate liquidity available to fund 2012 $640 million capital
program
program
– Strong cash flow in 2012
– $295 million of $325 million borrowing base available
– Potential to raise borrowing base based on performance
– Option for additional property divestitures
– In low price environment, $250 million capital spend will maintain
2012 production level flat versus 2011 exit rate
2012 production level flat versus 2011 exit rate
Liquidity

31
|
(MM)
|
3Q 2011
|
4Q 2010
|
|
Long-Term Debt
|
$250
|
$350
|
|
Total Stockholder’s Equity
|
608
|
529
|
|
TOTAL
|
$858
|
$879
|
|
|
|
|
|
Capitalization
|
|
|
|
- Debt
|
29%
|
40%
|
|
- Capital
|
71%
|
60%
|
|
TOTAL
|
100%
|
100%
|
Capital Structure

32
– Asset Base High-Graded
– Divestiture program complete
– South Texas focus
– Alberta Basin option
– Strong Eagle Ford project inventory
– Executing Business Plan
– Proved reserves doubled since 12/31/10
– Gates Ranch recoveries increased
– Increased firm take-away capacity
– Strong exit rates and 2012 growth projected
– Testing Growth Catalysts
– Increased Gates Ranch well density
– Other Eagle Ford areas
– Complete and evaluate Alberta Basin horizontal program
– Financial Strength
– Lower cost structure
– $402MM in liquidity
Summary

33
Appendix
34
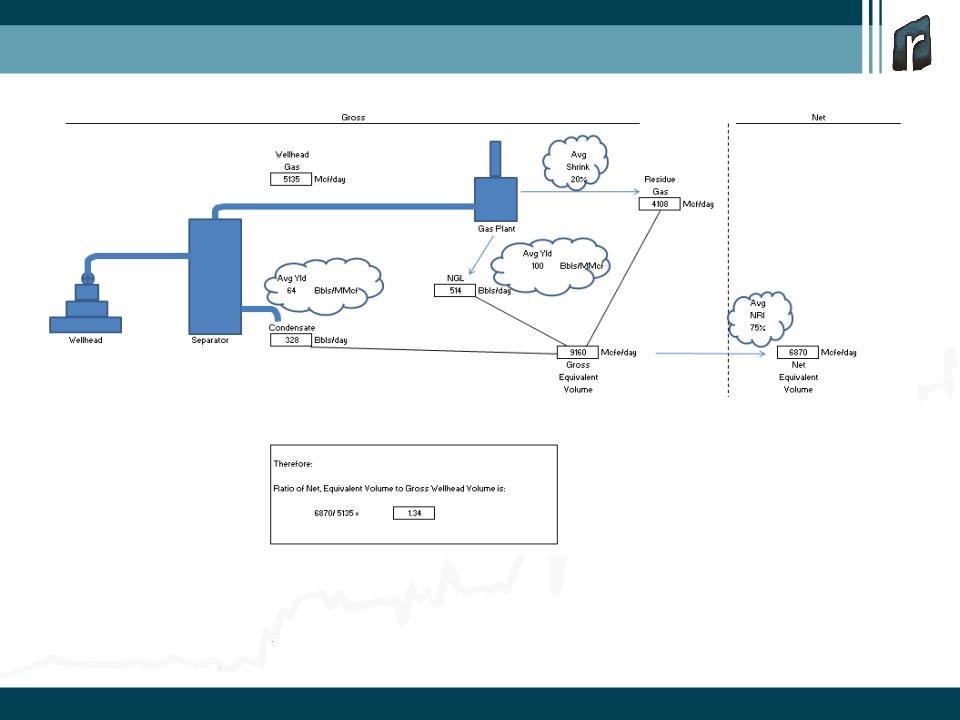
Note: This example describes the 3-streams of production from the average 2010 Gates Ranch horizontal
wells (based on completions as of January, 2011) and also provides a “rule of thumb” factor to convert
“net Rosetta sales volumes” (measured in Mcfe/d) to “gross wellhead gas” (measured in Mcf/d). This is
important for understanding Rosetta’s takeway capacity situation. As described, gross wellhead gas, and
therefore takeaway capacity, is multiplied by ~1.3 to determine net sales to Rosetta.
3-Stream Process Flow - Gates Ranch
35