Attached files
| file | filename |
|---|---|
| 8-K - LANDAUER INC | ldr_8k.htm |

LANDAUER, INC. Investor Presentation December 2011 Until superseded, this presentation will available at the Company website –www.landauer.com -in the Investors section.

This presentation may contain forward-looking statements, including statements about the outlook and prospects for Company and industry growth, as well as statements about the Company’s future financial and operating performance. Some of the information shared here constitutes forward-looking statements that are based on assumptions and involve certain risks and unce rtainties. These include the following, without limitation: assumptions, risks and uncertainties associated with the company's development and introduction of new technologies in general; introduction and cu stomer acceptance of the InLight technology; the adaptability of optically stimulated luminescence (OSL) technology to new platforms and formats, such as Luxel®+; the costs associated with the company's research and business development efforts; the usefulness of older technologies; the anticipated results of operations of the company and its subsidiaries or ventures; valuation of the company's long-lived assets or business units relative to future cash flows; changes in pricing of products and services; changes in postal and delivery practices; the company's business plans; anticipated revenue and cost growth; t he risks associated with conducting business internationally; other anticipated financial events; th e effects of changing economic and competitive conditions; foreign exchange rates; government regulations; accreditation requirements; and pending accounting pronouncements. These assumptions may not mat erialize to the extent assumed, and risks and uncertainties may cause actual results to be different from what is anticipated today. These risks and uncertainties also may result in changes to the compan y's business plans and prospects, and could create the need from time to time to write down the value of assets or otherwise cause the company to incur unanticipated expenses. You can find more information b y reviewing the "Significant Risk Factors" section in the company's Annual Report on Form 10 -K for the year ended September 30, 2011, and other reports filed by the company from time to time with the Securities and Exchange Commission. 2 Safe Harbor Statement
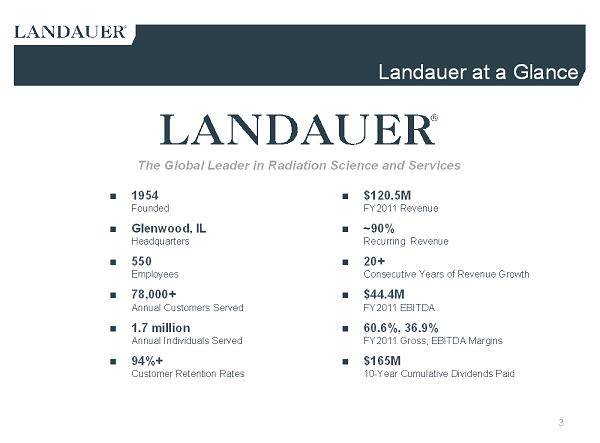
Landauer at a Glance 1954 Founded Glenwood, IL Headquarters 550 Employees 78,000+ Annual Customers Served 1.7 million Annual Individuals Served 94%+ Customer Retention Rates $120.5M FY2011 Revenue ~90% Recurring Revenue 20+ Consecutive Years of Revenue Growth $44.4M FY2011 EBITDA 60.6%, 36.9% FY2011 Gross, EBITDA Margins $165M 10-Year Cumulative Dividends Paid The Global Leader in Radiation Science and Services 3
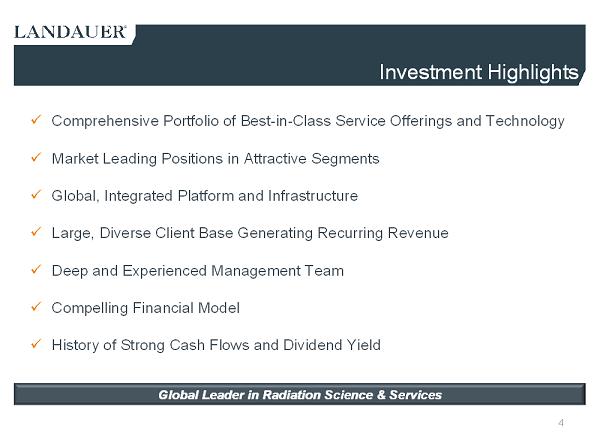
Investment Highlights x Comprehensive Portfolio of Best-in-Class Service Offerings and Technology x Market Leading Positions in Attractive Segments x Global, Integrated Platform and Infrastructure x Large, Diverse Client Base Generating Recurring Revenue x Deep and Experienced Management Team x Compelling Financial Model x History of Strong Cash Flows and Dividend Yield Global Leader in Radiation Science & Services Global Leader in Radiation Science & Services 4

Value Creation Deliver Upside Growth 1.Optimize Core 2.Competitive Growth 3. Strategic Expansion Strategic Priorities Landauer Strategy Overview Strategic ExpansionOptimize the Core Competitive Growth New Management in 2006 Restructure: Cost IT/ERP system upgrades OSL / InLight –new international market access New Channels and Geographies ― Military, First Responder New Products/Existing/Channel ― Patient Monitoring Radiation Safety Continuum ― Medical Physics acquisition ― IZI Medical Products Acquisition ― Leverage core competencies and footprint to expand market opportunity 5

Radiation Safety Continuum Existing Services with Penetration Opportunities* Complementary Adjacent Products / Services _____________________ (1) Average Revenue per Facility greater than $400K. Along the Radiation Safety Continuum 6 IZI Medical Physics Core Business Greater than $1.1 Billion U.S. Market Opportunity
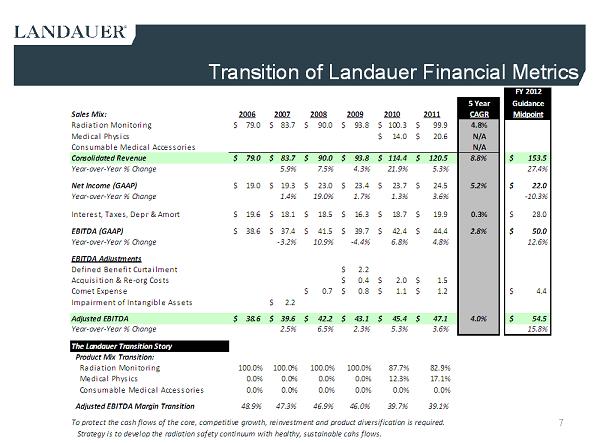
7 Transition of Landauer Financial Metrics FY 20125 Year Guidance Sales Mix: 2006 2007 2008 2009 2010 2011 CAGR Midpoint Radiation Monitoring 79.0$ 83.7$ 90.0$ 93.8$ 100.3$ 99.9$ 4.8% Medical Physics 14.0$ 20.6$ N/A Consumable Medical Accessories N/A Consolidated Revenue 79.0$ 83.7$ 90.0$ 93.8$ 114.4$ 120.5$ 8.8% 153.5$ Year-over-Year % Change 5.9% 7.5% 4.3% 21.9% 5.3% 27.4% Net Income (GAAP) 19.0$ 19.3$ 23.0$ 23.4$ 23.7$ 24.5$ 5.2% 22.0$ Year-over-Year % Change 1.4% 19.0% 1.7% 1.3% 3.6% -10.3% Interest, Taxes, Depr & Amort 19.6$ 18.1$ 18.5$ 16.3$ 18.7$ 19.9$ 0.3% 28.0$ EBITDA (GAAP) 38.6$ 37.4$ 41.5$ 39.7$ 42.4$ 44.4$ 2.8% 50.0$ Year-over-Year % Change -3.2% 10.9% -4.4% 6.8% 4.8% 12.6% EBITDA Adjustments Defined Benefit Curtailment 2.2$ Acquisition & Re-org Costs 0.4$ 2.0$ 1.5$ Comet Expense 0.7$ 0.8$ 1.1$ 1.2$ 4.4$ Impairment of Intangible Assets 2.2$ Adjusted EBITDA 38.6$ 39.6$ 42.2$ 43.1$ 45.4$ 47.1$ 4.0% 54.5$ Year-over-Year % Change 2.5% 6.5% 2.3% 5.3% 3.6% 15.8% The Landauer Transition Story Product Mix Transition: Radiation Monitoring 100.0% 100.0% 100.0% 100.0% 87.7% 82.9% Medical Physics 0.0% 0.0% 0.0% 0.0% 12.3% 17.1% Consumable Medical Accessories 0.0% 0.0% 0.0% 0.0% 0.0% 0.0% Adjusted EBITDA Margin Transition 48.9% 47.3% 46.9% 46.0% 39.7% 39.1% To protect the cash flows of the core, competitive growth, reinvestment and product diversification is required. Strategy is to develop the radiation safety continuum with healthy, sustainable cahs flows.

Long Track Record of Growth and Innovation 1954 1968 1991 1995 2003 2006 2008 2010 2009 Landauer is founded Tech/Ops Landauer changes name to Landauer, Inc. 2011 Introduces InLight® dosimetry system Signs first long- term military contract ($12M) ($ in millions) 20+ Years of Consistent Revenue Growth Landauer merges with Tech/Ops, Inc. Becomes the first U.S. company certified by Canada’s Atomic Energy Commission 1992 1998 An office is opened in the United Kingdom Hired new management team Signs contract with National Dosimetry Services of Health Canada Completes 3 tuck-in Medical Physics acquisitions Develops new technology specifically for the U.S. military and first responder markets Acquires OSL crystal manufacturing facility Completes 2 tuck-in Occupational Radiation Monitoring acquisitions Acquires Upstate Medical Physics 8 Acquires Global Physics Solutions Introduces Luxel, first OSL dosimeter for broad market use Acquires IZI Medical Products _____________________ (1) Indicates mid-point of FY2012 guidance
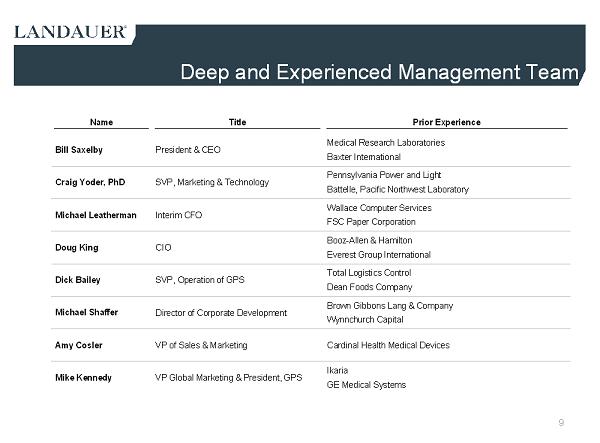
Deep and Experienced Management Team Name Title Prior Experience Bill Saxelby President & CEO Medical Research Laboratories Baxter International Craig Yoder, PhD SVP, Marketing & Technology Pennsylvania Power and Light Battelle, Pacific Northwest Laboratory Michael Leatherman Interim CFO Wallace Computer Services FSC Paper Corporation Doug King CIO Booz-Allen & Hamilton Everest Group International Dick Bailey SVP, Operation of GPS Total Logistics Control Dean Foods Company Michael Shaffer Director of Corporate Development Brown Gibbons Lang & Company Wynnchurch Capital Amy Cosler VP of Sales & Marketing Cardinal Health Medical Devices Mike Kennedy VP Global Marketing & President, GPS Ikaria GE Medical Systems 9
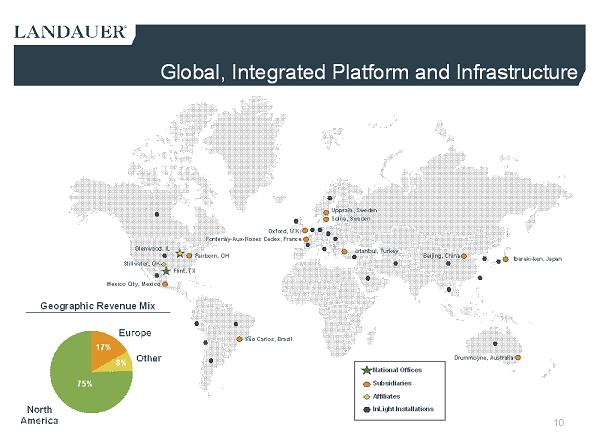
Global, Integrated Platform and Infrastructure 10 National Offices Subsidiaries Affiliates InLight Installations 8% 17% 75% Geographic Revenue Mix Fairborn, OH Flint, TX São Carlos, Brazil Ibaraki-ken, Japan Oxford, U.K. Beijing, China Drummoyne, Australia Fontenay-Aux-Roses Cedex, France Mexico City, Mexico Solna, Sweden Uppsala, Sweden Stillwater, OK Glenwood, IL Istanbul, Turkey

Landauer Business Overview Investor Presentation December 2011 11

Radiation Safety Continuum Occupational Radiation Monitoring “Radiation Dose to Workers” x Market leader in radiation dosimetry services and equipment x Full range of products and services utilizing proprietary technology continually evolving over 50 years x Utilize proprietary OSL dosimetry technology for determining radiation exposure x Critical services and products applicable to multiple industries and new emerging opportunities Medical Physics “Radiation Dose to Patients” x Leading provider of clinical physics support to monitor radiation delivered by imaging equipment x Offers full scope of medical physics services to hospitals and oncology centers x Thought leadership and unmatched medical physics expertise 12 To Protect and Improve Health Globally Through our Leadership in To Protect and Improve Health Globally Through our Leadership in Radiation Science and Services Radiation Science and Services IZI Medical Products “Radiation Dose Accuracy” x Provides high quality medical accessories used in Radiology, Radiation Therapy, and Image Guided Surgery procedures x Demonstrates a history of new and innovative product launches x Broad product portfolio x Over two decades of research and development expertise x Products increase procedural accuracy while decreasing procedural time
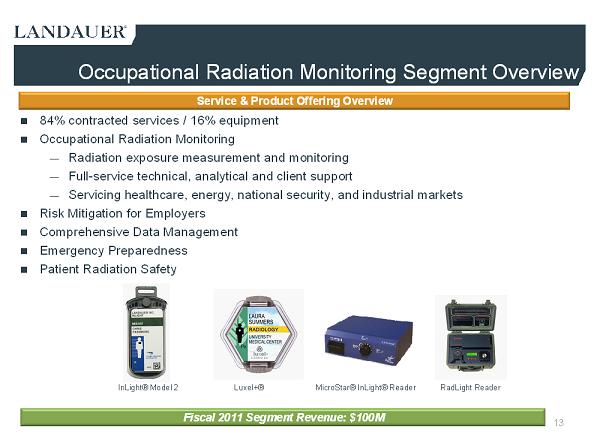
Occupational Radiation Monitoring Segment Overview Service & Product Offering Overview 84% contracted services / 16% equipment Occupational Radiation Monitoring ― Radiation exposure measurement and monitoring ― Full-service technical, analytical and client support ― Servicing healthcare, energy, national security, and industrial markets Risk Mitigation for Employers Comprehensive Data Management Emergency Preparedness Patient Radiation Safety MicroStar®InLight®ReaderLuxel+® InLight®Model 2 13 Fiscal 2011 Segment Revenue: $100M RadLight Reader
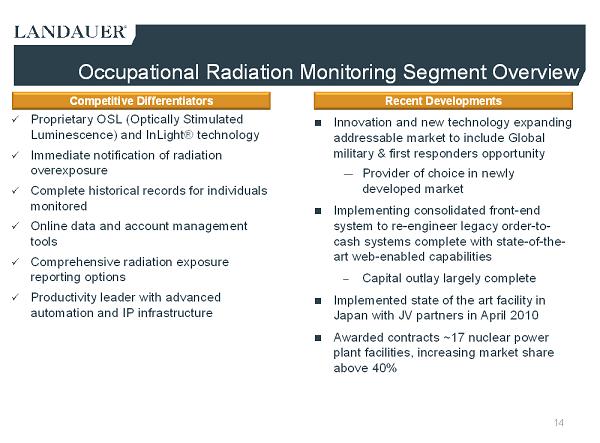
Occupational Radiation Monitoring Segment Overview Competitive Differentiators x Proprietary OSL (Optically Stimulated Luminescence) and InLight®technology x Immediate notification of radiation overexposure x Complete historical records for individuals monitored x Online data and account management tools x Comprehensive radiation exposure reporting options x Productivity leader with advanced automation and IP infrastructure Recent Developments Innovation and new technology expanding addressable market to include Global military & first responders opportunity ― Provider of choice in newly developed market Implementing consolidated front-end system to re-engineer legacy order-to- cash systems complete with state-of-the- art web-enabled capabilities – Capital outlay largely complete Implemented state of the art facility in Japan with JV partners in April 2010 Awarded contracts ~17 nuclear power plant facilities, increasing market share above 40% 14
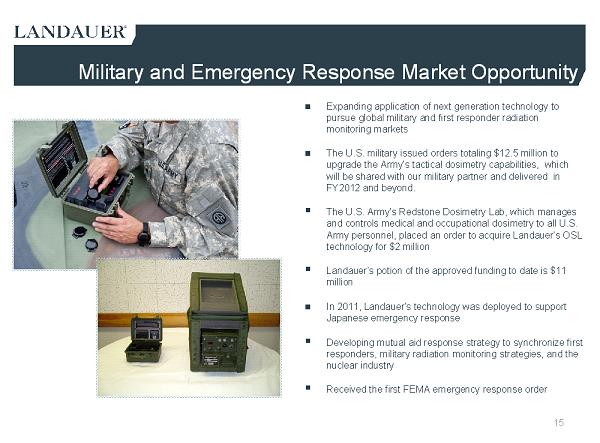
Military and Emergency Response Market Opportunity Expanding application of next generation technology to pursue global military and first responder radiation monitoring markets The U.S. military issued orders totaling $12.5 million to upgrade the Army’s tactical dosimetry capabilities, which will be shared with our military partner and delivered in FY2012 and beyond. ▪ The U.S. Army’s Redstone Dosimetry Lab, which manages and controls medical and occupational dosimetry to all U.S. Army personnel, placed an order to acquire Landauer’s OSL technology for $2 million ▪ Landauer’s potion of the approved funding to date is $11 million In 2011, Landauer’s technology was deployed to support Japanese emergency response ▪ Developing mutual aid response strategy to synchronize first responders, military radiation monitoring strategies, and the nuclear industry ▪ Received the first FEMA emergency response order 15

Emergency Response Mutual Aid / Synchronization 16
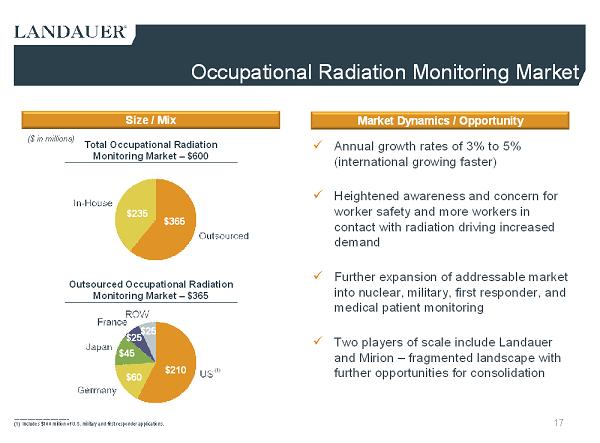
$235 $365 Occupational Radiation Monitoring Market Market Dynamics / Opportunity Size / Mix x Annual growth rates of 3% to 5% (international growing faster) x Heightened awareness and concern for worker safety and more workers in contact with radiation driving increased demand x Further expansion of addressable market into nuclear, military, first responder, and medical patient monitoring x Two players of scale include Landauer and Mirion –fragmented landscape with further opportunities for consolidation Total Occupational Radiation Monitoring Market –$600 Outsourced Occupational Radiation Monitoring Market –$365 ($ in millions) 17 $45 $210 $25 $25 $60 (1) _____________________ (1) Includes $100 million of U.S. military and first responder applications.
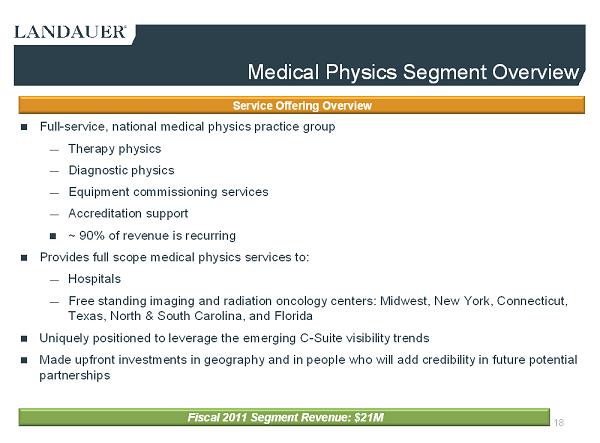
Medical Physics Segment Overview Service Offering Overview Full-service, national medical physics practice group ― Therapy physics ― Diagnostic physics ― Equipment commissioning services ― Accreditation support ~ 90% of revenue is recurring Provides full scope medical physics services to: ― Hospitals ― Free standing imaging and radiation oncology centers: Midwest, New York, Connecticut, Texas, North & South Carolina, and Florida Uniquely positioned to leverage the emerging C-Suite visibility trends Made upfront investments in geography and in people who will addcredibility in future potential partnerships 18 Fiscal 2011 Segment Revenue: $21M
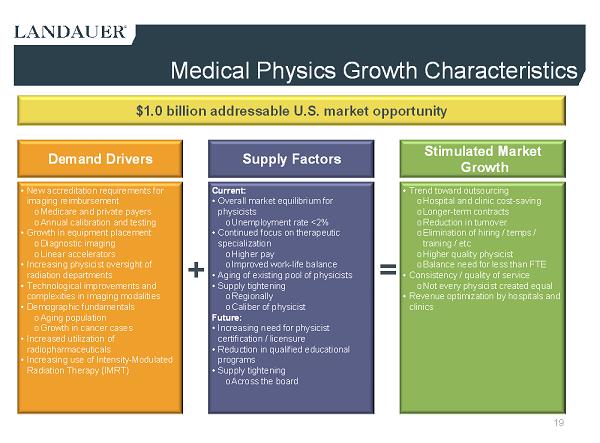
•New accreditation requirements for imaging reimbursement oMedicare and private payers oAnnual calibration and testing •Growth in equipment placement oDiagnostic imaging oLinear accelerators •Increasing physicist oversight of radiation departments •Technological improvements and complexities in imaging modalities •Demographic fundamentals oAging population oGrowth in cancer cases •Increased utilization of radiopharmaceuticals •Increasing use of Intensity-Modulated Radiation Therapy (IMRT) Current: •Overall market equilibrium for physicists oUnemployment rate <2% •Continued focus on therapeutic specialization oHigher pay oImproved work-life balance •Aging of existing pool of physicists •Supply tightening oRegionally oCaliber of physicist Future: •Increasing need for physicist certification / licensure •Reduction in qualified educational programs •Supply tightening oAcross the board Demand Drivers Supply Factors + •Trend toward outsourcing oHospital and clinic cost-saving oLonger-term contracts oReduction in turnover oElimination of hiring / temps / training / etc oHigher quality physicist oBalance need for less than FTE •Consistency / quality of service oNot every physicist created equal •Revenue optimization by hospitals and clinics Stimulated Market Growth = $1.0 billion addressable U.S. market opportunity Medical Physics Growth Characteristics 19
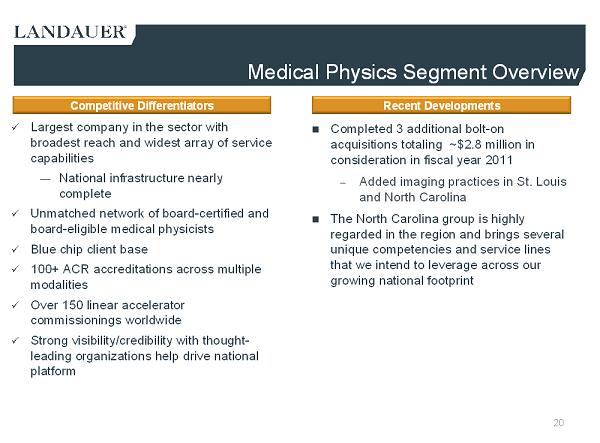
Medical Physics Segment Overview Competitive Differentiators x Largest company in the sector with broadest reach and widest array of service capabilities — National infrastructure nearly complete x Unmatched network of board-certified and board-eligible medical physicists x Blue chip client base x 100+ ACR accreditations across multiple modalities x Over 150 linear accelerator commissionings worldwide x Strong visibility/credibility with thought- leading organizations help drive national platform Recent Developments Completed 3 additional bolt-on acquisitions totaling ~$2.8 million in consideration in fiscal year 2011 – Added imaging practices in St. Louis and North Carolina The North Carolina group is highly regarded in the region and brings several unique competencies and service lines that we intend to leverage across our growing national footprint 20
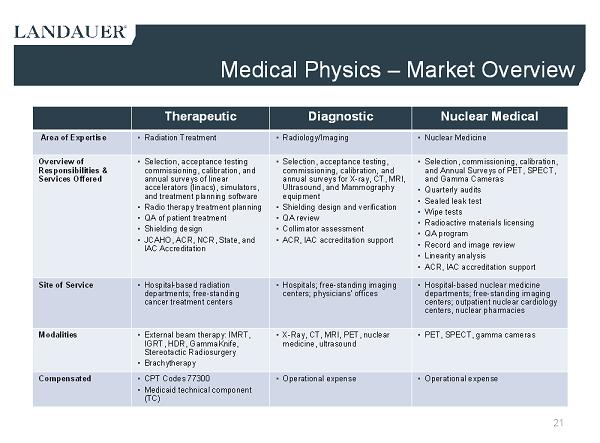
Therapeutic Diagnostic Nuclear Medical Area of Expertise • Radiation Treatment • Radiology/Imaging • Nuclear Medicine Overview of Responsibilities & Services Offered • Selection, acceptance testing commissioning, calibration, and annual surveys of linear accelerators (linacs), simulators, and treatment planning software • Radio therapy treatment planning • QA of patient treatment • Shielding design • JCAHO, ACR, NCR, State, and IAC Accreditation • Selection, acceptance testing, commissioning, calibration, and annual surveys for X-ray, CT, MRI, Ultrasound, and Mammography equipment • Shielding design and verification • QA review • Collimator assessment • ACR, IAC accreditation support • Selection, commissioning, calibration, and Annual Surveys of PET, SPECT, and Gamma Cameras • Quarterly audits • Sealed leak test • Wipe tests • Radioactive materials licensing • QA program • Record and image review • Linearity analysis • ACR, IAC accreditation support Site of Service • Hospital-based radiation departments; free-standing cancer treatment centers • Hospitals; free-standing imaging centers; physicians’offices • Hospital-based nuclear medicine departments; free-standing imaging centers; outpatient nuclear cardiology centers, nuclear pharmacies Modalities • External beam therapy: IMRT, IGRT, HDR, GammaKnife, Stereotactic Radiosurgery • Brachytherapy • X-Ray, CT, MRI, PET, nuclear medicine, ultrasound • PET, SPECT, gamma cameras Compensated • CPT Codes 77300 • Medicaid technical component (TC) • Operational expense • Operational expense Medical Physics –Market Overview 21
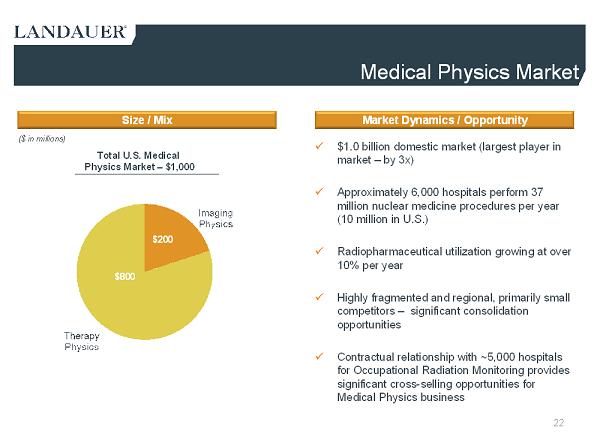
Medical Physics Market Market Dynamics / OpportunitySize / Mix x $1.0 billion domestic market (largest player in market –by 3x) x Approximately 6,000 hospitals perform 37 million nuclear medicine procedures per year (10 million in U.S.) x Radiopharmaceutical utilization growing at over 10% per year x Highly fragmented and regional, primarily small competitors – significant consolidation opportunities x Contractual relationship with ~5,000 hospitals for Occupational Radiation Monitoring provides significant cross-selling opportunities for Medical Physics business ($ in millions) $800 $200 Total U.S. Medical Physics Market –$1,000 22

IZI Medical Products 1991 Founded Baltimore, MD Headquarters 30 Employees $14M Revenue YTD (nine months ended 9/30) 100% Recurring Revenue 1,000+ Annual Customers Served ($ in millions) History of Strong Revenue Growth Company Overview Provides high quality medical accessories used in Radiology, Radiation Therapy, and Image Guided Surgery procedures ― Over two decades of research and development expertise ― Products increase procedural accuracy while decreasing procedural time Demonstrates a history of new and innovative product launches Broad consumable product portfolio used with: – MRI, CT, and Mammography technologies – Image Guided Surgery procedures 23
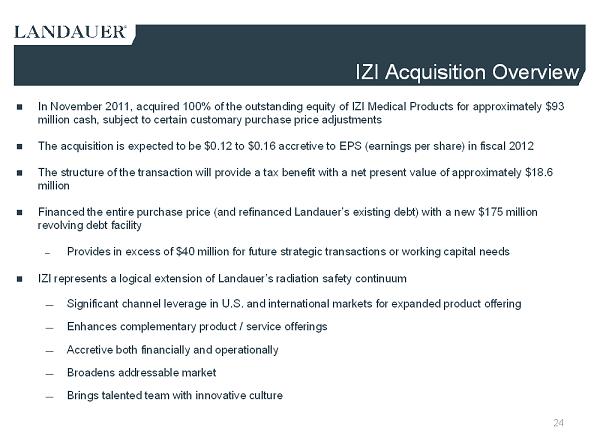
IZI Acquisition Overview In November 2011, acquired 100% of the outstanding equity of IZIMedical Products for approximately $93 million cash, subject to certain customary purchase price adjustments The acquisition is expected to be $0.12 to $0.16 accretive to EPS (earnings per share) in fiscal 2012 The structure of the transaction will provide a tax benefit witha net present value of approximately $18.6 million Financed the entire purchase price (and refinanced Landauer’s existing debt) with a new $175 million revolving debt facility – Provides in excess of $40 million for future strategic transactions or working capital needs IZI represents a logical extension of Landauer’s radiation safety continuum ― Significant channel leverage in U.S. and international markets for expanded product offering ― Enhances complementary product / service offerings ― Accretive both financially and operationally ― Broadens addressable market ― Brings talented team with innovative culture 24
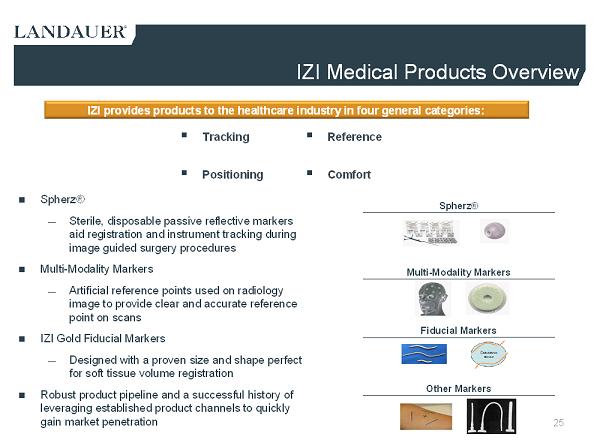
IZI Medical Products Overview Spherz® ― Sterile, disposable passive reflective markers aid registration and instrument tracking during image guided surgery procedures Multi-Modality Markers ― Artificial reference points used on radiology image to provide clear and accurate reference point on scans IZI Gold Fiducial Markers ― Designed with a proven size and shape perfect for soft tissue volume registration Robust product pipeline and a successful history of leveraging established product channels to quickly gain market penetration 25 Spherz® Fiducial Markers Multi-Modality Markers Other Markers ▪ Reference ▪ Comfort ▪ Tracking ▪ Positioning IZI provides products to the healthcare industry in four generalcategories:
IZI –Broad and Diverse Customer Base IZI’s customer base includes buyers at several stages along the supply chain including distributors, manufacturers of image guided navigation equipment, and product end users ― Medtronic ― Stryker ― Integra Radionics Targets community hospitals, radiation oncology clinics, mammography clinics, and imaging centers ― Sells direct to over 1,000 domestic hospital clinics and to over1,600 distinct medical departments ― 80% of total revenue is to hospital end users Utilize distributors for sales in 25 international countries ― International sales are only 3% of sales in 2010, but underestimate the use of IZI’s products internationally as domestic OEM’s resell IZI’s private label products directly overseas ― International market presents strong growth potential going forward 26

Financial Overview 27 Investor Presentation December 2011
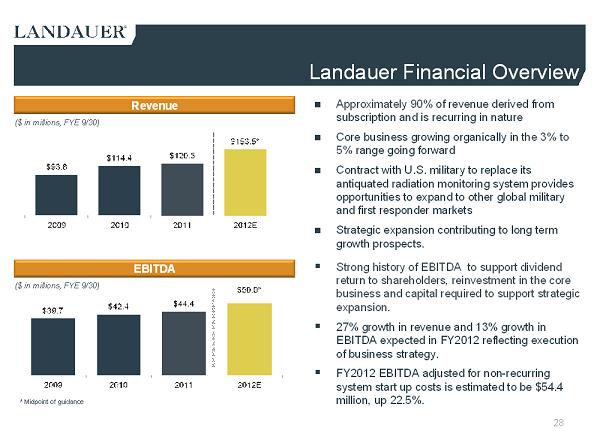
Landauer Financial Overview ($ in millions, FYE 9/30) Revenue ($ in millions, FYE 9/30) EBITDA Approximately 90% of revenue derived from subscription and is recurring in nature Core business growing organically in the 3% to 5% range going forward Contract with U.S. military to replace its antiquated radiation monitoring system provides opportunities to expand to other global military and first responder markets Strategic expansion contributing to long term growth prospects. ▪ Strong history of EBITDA to support dividend return to shareholders, reinvestment in the core business and capital required to support strategic expansion. ▪ 27% growth in revenue and 13% growth in EBITDA expected in FY2012 reflecting execution of business strategy. ▪ FY2012 EBITDA adjusted for non-recurring system start up costs is estimated to be $54.4 million, up 22.5%. 28 * Midpoint of guidance

Recent Financial Performance 29 Fiscal 2011 Highlights Revenue grew 5.3 percent to $120.5 million. Gross profit grew 4.4 percent to $72.9 million on increased revenue and mix. Operating income increased $0.3 million, to $34.9 million. Net income rose 3.6 percent to $24.5 million, or $2.58 per diluted share. EBITDA increased to $44.4 million, an increase of 4.8%. Cash from operating activities of $31.2 million, an increase of 18.9%. Strong dividend policy of $0.55 per share for the first fiscal quarter of fiscal 2012, providing an annual dividend rate of $2.20 consistent with 2011 levels. Received military funding totaling $14.5 million during the fiscal year for shipments in fiscal 2012 and beyond.
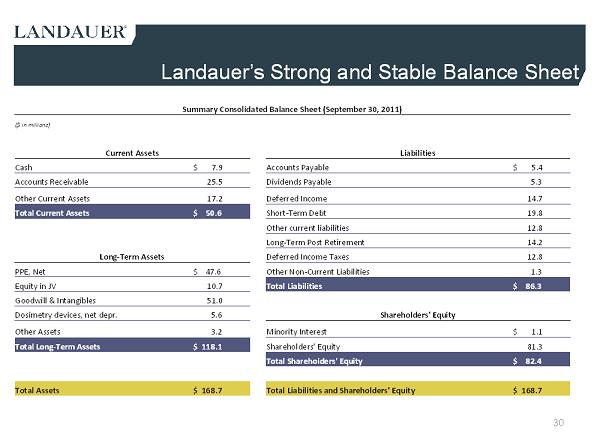
Landauer’s Strong and Stable Balance Sheet 30 Summary Consolidated Balance Sheet (September 30, 2011) ($ in millions) Current Assets Liabilities Cash $ 7.9 Accounts Payable $ 5.4 Accounts Receivable 25.5 Dividends Payable 5.3 Other Current Assets 17.2 Deferred Income 14.7 Total Current Assets $ 50.6 Short-Term Debt 19.8 Other current liabilities 12.8 Long-Term Post Retirement 14.2 Long-Term Assets Deferred Income Taxes 12.8 PPE, Net $ 47.6 Other Non-Current Liabilities 1.3 Equity in JV 10.7 Total Liabilities $ 86.3 Goodwill & Intangibles 51.0 Dosimetry devices, net depr. 5.6 Shareholders' Equity Other Assets 3.2 Minority Interest $ 1.1 Total Long-Term Assets $ 118.1 Shareholders' Equity 81.3 Total Shareholders' Equity $ 82.4 Total Assets $ 168.7 Total Liabilities and Shareholders' Equity $ 168.7
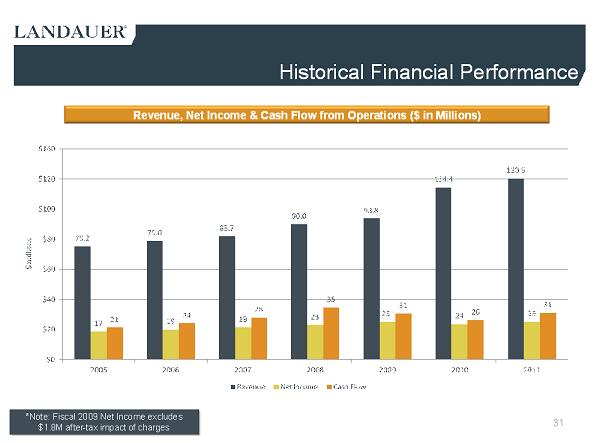
*Note: Fiscal 2009 Net Income excludes $1.8M after-tax impact of charges *Note: Fiscal 2009 Net Income excludes $1.8M after-tax impact of charges Historical Financial Performance 31 Revenue, Net Income & Cash Flow from Operations ($ in Millions)
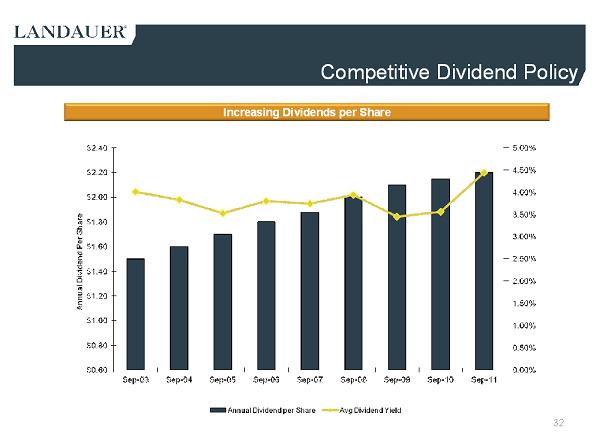
32 Competitive Dividend Policy Increasing Dividends per Share
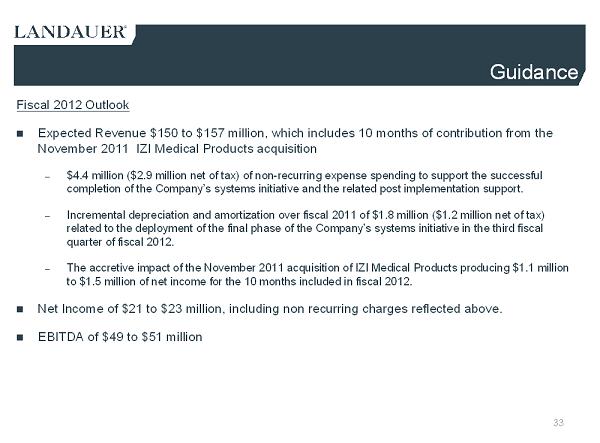
Guidance 33 Fiscal 2012 Outlook Expected Revenue $150 to $157 million, which includes 10 months of contribution from the November 2011 IZI Medical Products acquisition – $4.4 million ($2.9 million net of tax) of non-recurring expense spending to support the successful completion of the Company’s systems initiative and the related post implementation support. – Incremental depreciation and amortization over fiscal 2011 of $1.8 million ($1.2 million net of tax) related to the deployment of the final phase of the Company’s systems initiative in the third fiscal quarter of fiscal 2012. – The accretive impact of the November 2011 acquisition of IZI Medical Products producing $1.1 million to $1.5 million of net income for the 10 months included in fiscal 2012. Net Income of $21 to $23 million, including non recurring charges reflected above. EBITDA of $49 to $51 million